



Abstract
Primary production on the Western Indus continental shelf has been linked to the large quantities of nutrients delivered to the shelf by the Indus River. Multiple geochemical tracers and biomarker records, including stable isotopes (δ13C and δ15N), total organic carbon (TOC), total nitrogen (TN), molar carbon/nitrogen (C/N) ratio, the branched and isoprenoid tetraether (BIT) index, and glycerol dialkyl glycerol tetraether (GDGT), have been analyzed from the Indus-23AP sediment core recovered from the northern Arabian Sea. Our records show evidence of a mixture of marine and terrestrially derived organic matter (OM) during the last 14,000 years, as indicated by the C/N ratio, δ13C, δ15N, and the BIT index. The three sterol biomarkers (brassicasterol, dinosterol, and cholesterol) show concurrent enrichments during the last 3 millennia reflecting increased phytoplankton abundance because of increased Indus river discharge of nutrients during the summer monsoon. GDGT crenarchaeol enrichment is related to the BIT index. The TEX86-derived sea surface temperature (SST) record is shifted toward the summer season because Crenarchaeota are more abundant and active during periods of high primary production. SSTs indicate a long-term warming trend during the Holocene related to increasing winter insolation in the low latitudes northern Hemisphere.
Keywords
Introduction
The northern Arabian Sea is a unique biogeochemical environment in the global ocean because of the dominance of strong seasonal variability in monsoonal upwelling periods during the southwest monsoon (summer) and convective mixing during the northeast monsoon (winter) (Naqvi et al., 1982). Another prominent feature of the northern Arabian Sea is the stable midwater oxygen minimum zone (OMZ; from 200 to ~1200 m water depths) impinging the continental slope (Morrison et al., 1999; Olson et al., 1993; Qasim, 1982; Wyrtki, 1973). In the global ocean, OMZs cover more than 1 million km2 of permanently hypoxic shelf and bathyal seafloor, where dissolved oxygen is <0.5 mL L−1, over half (59%) are in the northern Indian Ocean (Helly and Levin, 2004). Hypoxic events may be stimulated by nutrient loading carried by runoff into the sea and contributing to phytoplankton blooms (Conley et al., 2009; Druon et al., 2004). An order of magnitude drop in oxygen (from 2.12 to 0.11 mL L−1) was observed on the outer Indus shelf (140 m water depth) pre-monsoon and late southwest monsoon in 2003, reflecting an upward shoaling of the OMZ (Brand and Griffiths, 2009). Thus suspended loads and nutrients provided through riverine input can have a major impact on the biogeochemistry in the marine realm (Syvitski et al., 2005). The Western Indus continental shelf of the northern Arabian Sea is subject to seasonal monsoon-driven floods. Some evidence of flood-induced productivity was detected in the near-shelf waters offshore Sindh (Figure 1; Fanning et al., 2011). Primary productivity increases because of higher nutrient levels during the southwest monsoon and driven during the northeast monsoon by convective mixing, together with nutrients provided through terrestrial inputs (Naqvi et al., 2002). Very few studies have been done on the Western Indus shelf in the northern Arabian Sea, mostly focused on sediment storage and reworking on the shelf (Clift et al., 2014), organic carbon and nitrogen, stable nitrogen isotopic ratio (δ15N), amino acids (Möbius et al., 2011), and changes in paleoproductivity within the OMZ, using a set of biomarkers (alkenones, dinosterol and brassicasterol; Schulte et al., 1999). Studies of total organic carbon (TOC) highlighted that formation of hypoxia conditions would have allowed enhanced preservation and enrichment of TOC in marine sediments (Demaison and Moore, 1980). However, detailed information on the paleoproductivity and paleofloods variations during the Holocene based on a number of biomarkers have not been documented in the Western Indus continental shelf.

(a) Map showing the mean annual sea surface temperature (SST) from World Ocean Atlas database (WOA 1955–2012; https://data.nodc.noaa.gov/las/getUI.do; Locarnini et al., 2013) and the Indus-23AP core location. Sites used for comparison as well as Indus River are also shown. (b) Map showing the chlorophyll-ɑ concentration in the Arabian Sea (1997–2010) according to the SeaWiFS project (oceancolor.gsfc.nasa.gov/cgi/l3) and main winds during summer and winter seasons.
In this study, we present new geochemical records based on a multi-proxy approach, including sterol biomarkers (dinosterol, brassicasterol, cholesterol), stable isotope composition (δ13Corg, δ15N), TOC, total nitrogen (TN), carbon/nitrogen (C/N), glycerol dialkyl glycerol tetraether (GDGT), and the branched and isoprenoid tetraether (BIT) index in a sediment core from the Western Indus continental shelf close to the Indus River mouth and canyon. The major objectives of this study are (1) to examine the quantitative and qualitative variations of the TOC in sediments to reveal changes in primary production and land-derived organic carbon input; (2) to determine selected biomarkers in the sediment core and use them as proxies for the phytoplankton community and productivity; (3) to provide a linkage between the geochemical records and variation of the monsoon intensity and Indus River discharge; and (4) to reconstruct sea surface temperatures (SSTs) in the study area since the late deglaciation (the last 14,000 years).
Regional setting
This study focuses on the continental shelf of the northern Arabian Sea, which is not under the OMZ (Figure 1). The shelf acts as a sink for sediment transported by rivers, mainly the Indus River, from the Karakoram and Western Himalayan regions to the Arabian Sea (Clift et al., 2002). The shelf stretches ca. 340 km from the Murray Ridge in the northwest to the Rann of Kutch in the southeast and runs ca. 120 km from the Indus Delta to the continental slope. It is controlled by the submarine Indus delta and a large sinuous canyon structure, the Swatch, separating the eastern and western shelves (Giosan et al., 2006). The Indus River delta is built over an 11-km-thick passive margin sediment pile dating back to the late Cretaceous, which has been the recipient of large volume of sediments from the Indus River that increased in rate by the early Miocene (Clift et al., 2001). It experiences very high wave energies and prior to human intervention and damming received at least 250 × 106 t yr−1 (Milliman et al., 1984). The Indus River is one of the world’s big rivers with a length of ~2900 km and a drainage basin area of 0.97 × 10⁶ km2. It is characterized by a peak discharge during the summer months as a result of seasonal glacial melting, flowing from the Karakoram and Tibet to the Arabian Sea mostly through arid lands, where the bulk of rainfall is brought by the summer monsoon (Milliman et al., 1984). Some anthropogenic impact on sediment flux may have started with the agriculture of the Harappan Civilization (i.e. ~5000 yr BP). The damming of the Indus River in the 1970s dramatically reduced sediment export, which might explain the present day scarcity of terrigenous organic matter (OM) in offshore sediments (Syvitski and Milliman, 2007).
The northern Arabian Sea is one of the most productive regions in the Indian Ocean (Figure 1b). Primary production is mainly controlled by convection and nutrients supplied by rivers (Naqvi et al., 2002). Convection in the northern Arabian Sea takes place mainly during summer season when strong southwesterly winds related to Summer Indian Monsoon blow over the region (Figure 1b). Strong southwesterlies during the summer monsoon drive upwelling along the coast of Somalia, Oman, and southwest of India, thereby, transporting nutrient-rich sub-surface waters to the photic zone and resulting in increased productivity (Qasim, 1982). During the winter season, strong cooling of the sea surface induces convective mixing of the nutrient enriched thermocline with the surface waters resulting in increased productivity (Madhupratap et al., 1996).
Material and methods
Sediment core and age model
The piston core Indus-23AP (7.65 m long) was retrieved from the northern Arabian Sea (Western Indus continental shelf; 23°36.66′N; 67°16.31′E, 70 m water depth) during the 2008/2009 cruise 64PE300 on RV Pelagia (Figure 1a). The Indus-23AP core was strategically selected because of its location close to the Indus River mouth and canyon (20 km away from the coastline). It has been obtained from British Ocean Sediment Core Research Facility, National Oceanography Centre, Southampton, UK, and shipped under frozen condition to the Second Institute of Oceanography (SIO), Hangzhou, China. The age model of Indus-23AP core is based on five AMS radiocarbon dates calibrated using the marine standard calibration of Hughen et al. (2004). For more details about age model establishment see Limmer et al. (2012). Based on the age model, the time interval covered by the investigated Indus-23AP core ranges from 14,000 yr BP to present, with a hiatus from 7300 to 3400 yr BP. The Indus-23AP core was continuously sampled using a sampling step of 15 cm for bulk chemical, isotope, and biomarker analysis. All samples for biomarkers were processed and analyzed at the Key Laboratory of Marine Ecosystem Dynamics of SIO and Biogeochemistry (LMEB) of SIO. The sedimentation is very low during the late deglaciation-early Holocene (ca. 17 cm kyr−1) compared with that of the late Holocene (ca. 1014 cm kyr−1).
Bulk chemical and isotopic analysis (TOC, TN, δ13C, and δ15N)
A sub-sample of wet sediment was dried at 45°C for several days prior to grinding for elemental and isotopic analyses. Analyses were performed for both elemental TOC and TN, and their isotopic composition (δ13C and δ15N). The dried sediments were mixed with 1 M hydrochloric acid (HCl) to remove the inorganic carbon using a sonicator and rest at overnight. Samples were then oven dried at 45°C. The residues were then ground to homogenize using a motor pestle. Approximately 30 mg of sediment was weighed into a tin boat foil and folded into a pellet. TOC and TN were measured using an Elementar Analyzer (vario ISOTOPE cube). The temperature of combustion was 950°C while that of reduction was 600°C. Flow of He and O2 gases were used at 230 mL min−1 and 15 mL min−1, respectively. Sulfanilamide was used as the standard reference material with a precision of 0.02% for TOC and 0.005% for TN. The average standard deviations of these measurements were ±0.2% for both TOC and TN. δ13C and δ15N values were obtained using the isotope ratio mass spectrometer (Thermo Finnigan, Flash EA 1112 Series) and Analyzer (Delta plus Advantage, Thermo Finnigan). Pee Dee Belemnite (PDB) was used as the standard reference material with a precision <0.2% for δ13C and <0.3% for δ15N. Values of δ13C and δ15N are expressed in standard delta notation relative to the PDB and atmospheric N2 standards, respectively (Xu et al., 2016).
Biomarker analysis
A few grams (3–4 g) of freeze-dried sediments were used to extract lipids using a mixture of methylene chloride/methanol (DCM/MeOH; 3:1 v/v). A 40 µL of alkenone internal standard and 30 µL of GDGTs internal standard were added before the extraction. Following saponification and extraction into hexane, the neutral lipids were purified using silica gel chromatography by elution with n-hexane and DCM/MeOH (95:5, v/v), respectively. Biomarkers representative of haptophytes (C37 alkenones), Archaea (GDGTs), dinoflagellates (dinosterol), diatoms (brassicasterol), and zooplankton (cholesterol) were separated with the DCM/MeOH fraction (Huguet et al., 2006a; Schouten et al., 2002; Xing et al., 2014; Zhang et al., 2012; Zhao et al., 1995). The solvent of this fraction was removed under N2, and the residue was dissolved by sonication (for 5 min) in hexane/isopropanol (99:1, v/v), and then divided into two parts. One part was used to quantify the alkenone, dinosterol, brassicasterol, and cholesterol compounds after derivatization (as trimethylsilyl ether derivatives) by comparison of their peak areas to that of methyl 5α-cholestane added prior to lipid extraction using gas chromatography (GC; Agilent Technologies 7890A with FID). GC-FID was equipped with an Agilent J&W HP-1 50 m × 0.32 mm I.D. column coated with 0.17 µm. Heating was applied with an initial temperature program of 80°C min−1, followed by 200–315°C at 5°C min−1. The temperature was held at 315°C for 64 min. The other part of the extract was filtered using a 0.22 μm, 4 mm diameter PTFE filter, and then analyzed for GDGTs using ultra-high performance liquid chromatography/atmospheric pressure chemical ionization-mass spectrometry/UPLC/APCI-MS, WATERS Corporation. About 2 µL aliquots were injected in a HSS Cyano column (2.1 × 100 mm, 1.8 µm; ACQUITY UPLC) maintained at 30°C. GDGTs were eluted using the following gradient with solvent A (n-hexane) and solvent B (10% isopropanol in n-hexane) – 99% A: 1% B for 0.5 min, linear gradient to 5% B in 0.6 min and kept for 3.5 min, linear gradient to 10% B in 1.4 min and kept for 2 min, and then back to 1% B to 12 min flow rate of 0.2 mL min−1. Conditions for APCI-MS were as follows: N2 flow: 1000 L h−1, cone gas: 100 L h−1, source: 150°C, and APCI probe: 550°C. For isoprenoidal and branched GDGT peak integration of their [M+H]+ ions (m/z 1318, 1316, 1314, 1302, 1300, 1298, 1296, 1292, 1022, 1036, and 1050) detected in selective ion monitoring (SIM) mode was used, with a dwell time 29 ms each (Kremer et al., 2018).
Results and discussion
Bulk chemical and isotopic signals
Figure 2 shows the δ13C (‰), δ15N (‰), TOC (%), TN (%), and C/N molar ratio records from the Indus-23AP core over the last 14,000 years. The insert shows the same records for the last 1600 years during which temporal resolution is exceptionally high.
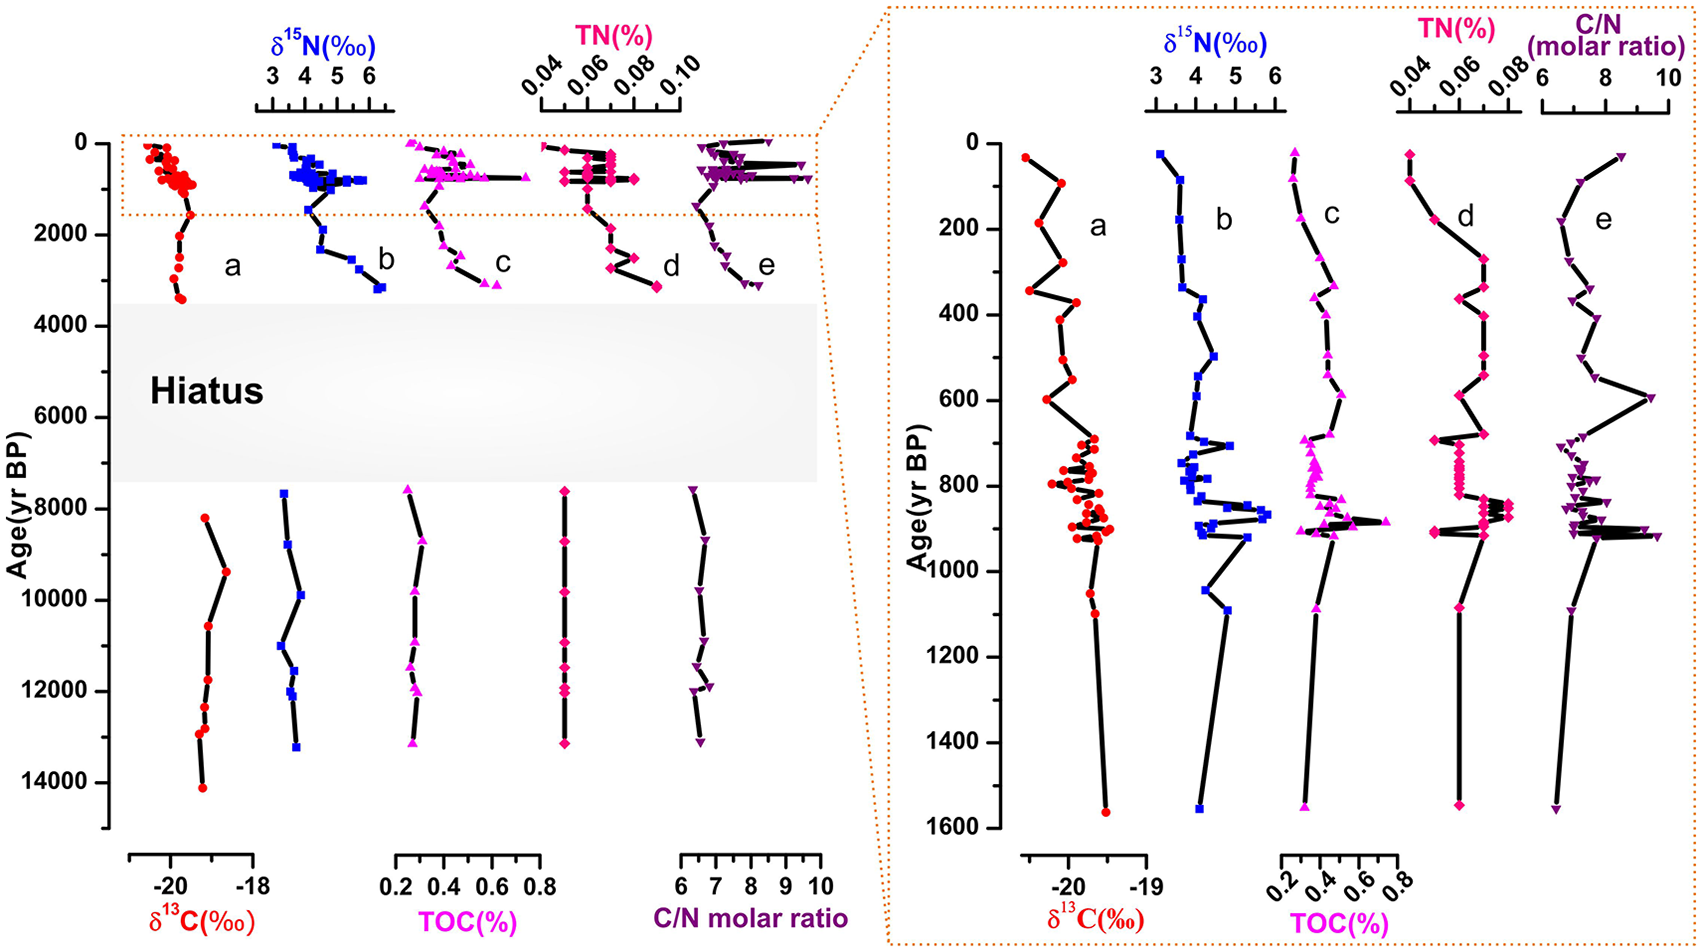
Variability of geochemical records: (a) δ13C (‰), (b) δ15N (‰), (c) TOC (%), (d) TN (%), and (e) C/N molar ratio from Indus-23AP core over the last 14,000 years. The insert shows the same proxy records during the last 1600 years.
TOC and TN
During the late deglaciation-early Holocene, TOC ranges from 0.31% to 0.25%, with relatively low variability (Figure 2c). TOC increases thereafter to a mean value of 0.62% from 3300 yr BP onward. During the last 1600 years, TOC varies between 0.26% and 0.75% with a mean value of 0.39%, much higher than values recorded during the late deglaciation-early Holocene (insert in Figure 2). The highest level of TOC (0.75%) is recorded at around 900 yr BP. The sedimentation rate is generally the most important factor influencing TOC preservation, as high rates mean less time for OM to degrade (Canfield, 1994). Organic carbon concentrations in sediments on the Indus Shelf are controlled by land-derived input and surface productivity but also by dilution with lithogenic material, bottom water oxygen concentrations, bulk accumulation rate, sediment texture, the refractory character of OM, and the mineral surface area. TOC in surficial sediments is higher on the Oman and Pakistan margins (3.32 ± 1.4% and 2.45 ± 1.1%, respectively; Jeffreys et al., 2015) compared with that of the Indus-23AP core. The range of TOC in Indus-23AP (0.25–0.75%) is also lower than those at the flank of the Indus canyon offshore the Indus River mouth in the center of the OMZ (i.e. 2.5–4.1%; Lückge et al., 2012).
The measured TN concentrations can be used as a reasonable estimate of organic nitrogen. The TN content in Indus-23AP core ranges between 0.05% during late deglaciation-early Holocene and 0.09% at 3300 yr BP (Figure 2d). Subsequently, TN decreases to lower values comparable to those of the early Holocene. TOC and TN records show a relatively high positive correlation (R2 = 0.79, Figure 3) suggesting that sedimentary OM contributes to the accumulation of TN and probably occurs predominantly in the organic origin of nitrogen. A similar distribution pattern in TOC and TN has been recorded in the Arctic (Stein, 1990) and in the Arabian Sea (Suthhof et al., 2000).
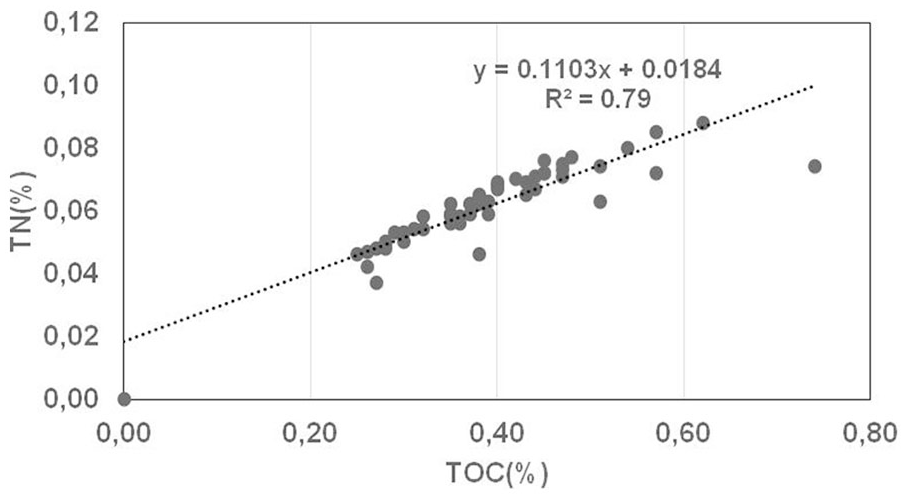
A cross plot of TOC and TN in the sediment samples from Indus-23AP core.
Surprisingly, both TOC and TN indicate low values between 10,000 and 8000 yr BP similar to those recorded during the late deglaciation (Figure 2c and d). This time interval coincides with maximum monsoon strength and high primary production in the Arabian Sea (Fleitmann et al., 2003; Gupta et al., 2003). Taking into account the very shallow water depth at the core site during the early Holocene, the fine sediments were probably fluxed away from the site. This is also evident from the magnetic susceptibility from Indus-23AP core, showing unexpected sharp decline between 10,000 and 8500 yr BP (Limmer et al., 2012). Based on XRF records from the same sediment core, Limmer et al. (2012) highlighted a shift to more Indus River derived sediment deposition only at around 8000 yr BP. Higher TOC and TN during the late Holocene reflect increased Indus River sediment supply and less post-depositional erosion.
C/N ratio
In Indus-23AP core, the C/N molar ratio ranges between 6.34 and 6.81 during the late deglaciation-early Holocene (Figure 2e). It shows a long-term decrease between 3300 and 1600 yr BP (i.e. from 8 to 6.5). During the last 1600 years, the C/N ratio increases again, reaching a value of 9.24 at 900 yr BP and 9.44 at 600 yr BP. This ratio is an indicator of OM sources in the aquatic ecosystems. Atomic C/N ratios are useful to distinguish between algal and land-plant origins of sedimentary OM. Marine sources typically have atomic C/N ratios between 4 and 10 because of nitrogen enrichment, whereas vascular land plants have C/N ratios of more than 20 (Meyers, 1994). Indeed, C/N ratios above ~10 can indicate a more terrestrial influence. The C/N ratio from the Indus-23AP core varies between 6 and 10 during the last 14,000 years, indicating a mixture of marine and terrestrially derived OM. Lower values during the late deglaciation-early Holocene probably reflect post-depositional erosion of sediments rather than decreased land-derived input or increased primary production. Increasing C/N ratio over the last 3300 years further confirms enhanced sediment supply by the Indus River to the core site.
Organic carbon isotopic composition (δ13C)
The sedimentary organic carbon isotope (δ13C) values from Indus-23AP core fall into a narrow range (−18.65‰ to −20.55‰) with a mean value of −19.75‰ (Figure 2a). High values of δ13C were observed during the late deglaciation-early Holocene, and then decreased up-core. Organic carbon isotopic composition is useful for distinguishing between marine and continental plant sources of sedimentary OM. Marine OM typically has δ13C values ranging between −18‰ and −20‰ while terrestrial OM ranges from −24‰ to −30‰ (Meyers, 1994). However, terrestrial plants are dominated by two distinct vegetation groups, C3 and C4 plants employing different photosynthetic pathways that produce different δ13C values (Deines, 1980). Therefore, δ13C values can be used not only as an indicator of the change of terrestrial plant populations but also a good proxy of the history of climate change. δ13C values of C3 plants range from −34‰ to −19‰ with average value of −26.7‰ while those of C4 plants range from −18‰ to −10‰ with average of −12.5‰ (Cerling et al., 1997). The δ13C values obtained in this study fall into a narrow range (−18.65‰ to −20.55‰) with a mean value of −19.75‰, suggesting a mixture of marine OM, as well as C3 and C4 vegetation in the Indus-23AP core (Figure 2a). A distinguishable decreasing trend in δ13C during the last 14,000 years indicates an increasing influence of land-derived input. The range of δ13C values from Indus-23AP core further supports the concept of a mixture of marine and terrestrial OM.
Organic nitrogen isotopic composition (δ15N)
As can be seen from Figure 2b, δ15N values range from 3.35‰ to 3.87‰ during the late-deglaciation-early Holocene, showing the lowest values of the record. δ15N shows the highest values (6.5‰) at 3300 yr BP, that decrease until 1600 yr BP. During the last 1600 years, δ15N values increase again and strongly fluctuate between 3.11‰ and 5.39‰ (insert in Figure 2). The main source of nitrogen in the ocean is N2 fixation, whereas denitrification is its largest sink (Meckler et al., 2007). Denitrification occurs both in the suboxic water column and in the sediments, such as in the eastern tropical North and South Pacific (Codispoti and Packard, 1980; Codispoti and Richards, 1976) and the Arabian Sea (Bange et al., 2000). δ15N is a commonly used proxy for reconstructing changes in the oceanic nitrogen cycle and for evaluating past ocean productivity. The δ15N of sediments reveals nitrogen sources (dissolved inorganic nitrogen (DIN)), as well as transformation processes in the ocean. δ15N values tend to be diagnostic because the OM produced by phytoplankton and terrestrial plants has significantly different isotopic signatures (Meyers, 2003). The δ15N values of OM produced by phytoplankton range between 7‰ and 10‰, whereas that originated from land plants and cyanobacteria show values between 0‰ and 2‰ (Meyers, 1997). Indeed, δ15N record from Indus-23AP suggests an important contribution of land plants and cyanobacteria which further attests the assumption of a mixture of marine and terrestrial OM (Figure 2b).
δ15N values in oxygenated basins do not exceed 6‰, whereas those from oxygen depleted basins are highly enriched >6‰ (Altabet et al., 1999). Thus, sediments with δ15N values higher than 6‰ may reflect the effect of denitrification. Except the slightly high value at ~3300 to 3400 yr BP (6.5‰), our δ15N record does not show evidence of denitrification at the core site. However, coupling increase in δ15N and TOC/TN, such as values around 3300 and 900 yr BP, may indicate increasing productivity (Altabet et al., 1999; Cowie et al., 1999; Naqvi et al., 1998).
Alkenones, dinosterol, brassicasterol, and cholesterol signals
There are many reservations and controversies about factors controlling OM accumulation and its connection to the monsoon and primary productivity. In this study, we use different biomarkers (alkenones, dinosterol, brassicasterol, cholesterol) to evaluate palaeoproductivity variation at our core site.
Alkenone C37 was not detected in Indus-23AP core. This result might indicate low abundance of coccolithophores in shallow waters since the water depth of Indus-23AP core is only 70 m. Another prominent factor is the alkenones degradation in the sediments (Prahl et al., 1989b). However, Sales De Freitas et al. (2017) argued that degradation of alkenones in <500,000 yr BP sediments is unlikely. The proxy records broadly suggest relatively low coccolithophore growth at the core location during the last 14,000 years.
Temporal variations of marine biomarkers in the Indus-23AP core are shown in Figure 4. Dinosterols are the most abundant (61.53–1303.60 ng g−1) followed by brassicasterol (24.38–958.99 ng g−1) and cholesterol (6.50–470.81 ng g−1). The contents of cholesterol and brassicasterol show higher values during the late deglaciation, whereas dinosterol indicates lower concentrations at the same time interval (Figure 4). During the early Holocene, both brassicasterol and dinosterol indicate low values while those of cholesterol remain relatively high. A rapid increase in concentration of the three compounds occurred at ~3400 yr BP. From 3000 to 1600 yr BP, concentrations were relatively constant. They increase again at 900–1000 yr BP and during the last 3 centuries. High phytoplankton abundances strongly coincide with increasing nutrients (TOC and TN) at around 3400 yr BP (Figure 2). Dinosterol and brassicasterol can help in classifying the organisms contributing to overall surface bio-production and its past variability (Schulte et al., 1999). During the last 1600 years, the range of dinosterol concentrations in Indus-23AP core varies between 81.46 and 803.25 ng g−1, whereas the concentration of brassicasterol varies between 24.38 and 338.62 ng g−1. The similar distributions of dinosterol and brassicasterol indicate that the relative contributions of the dominant members of the phytoplankton community (diatoms and dinoflagellates) to primary production were roughly uniform over the past 14,000 yr BP (Figure 4).
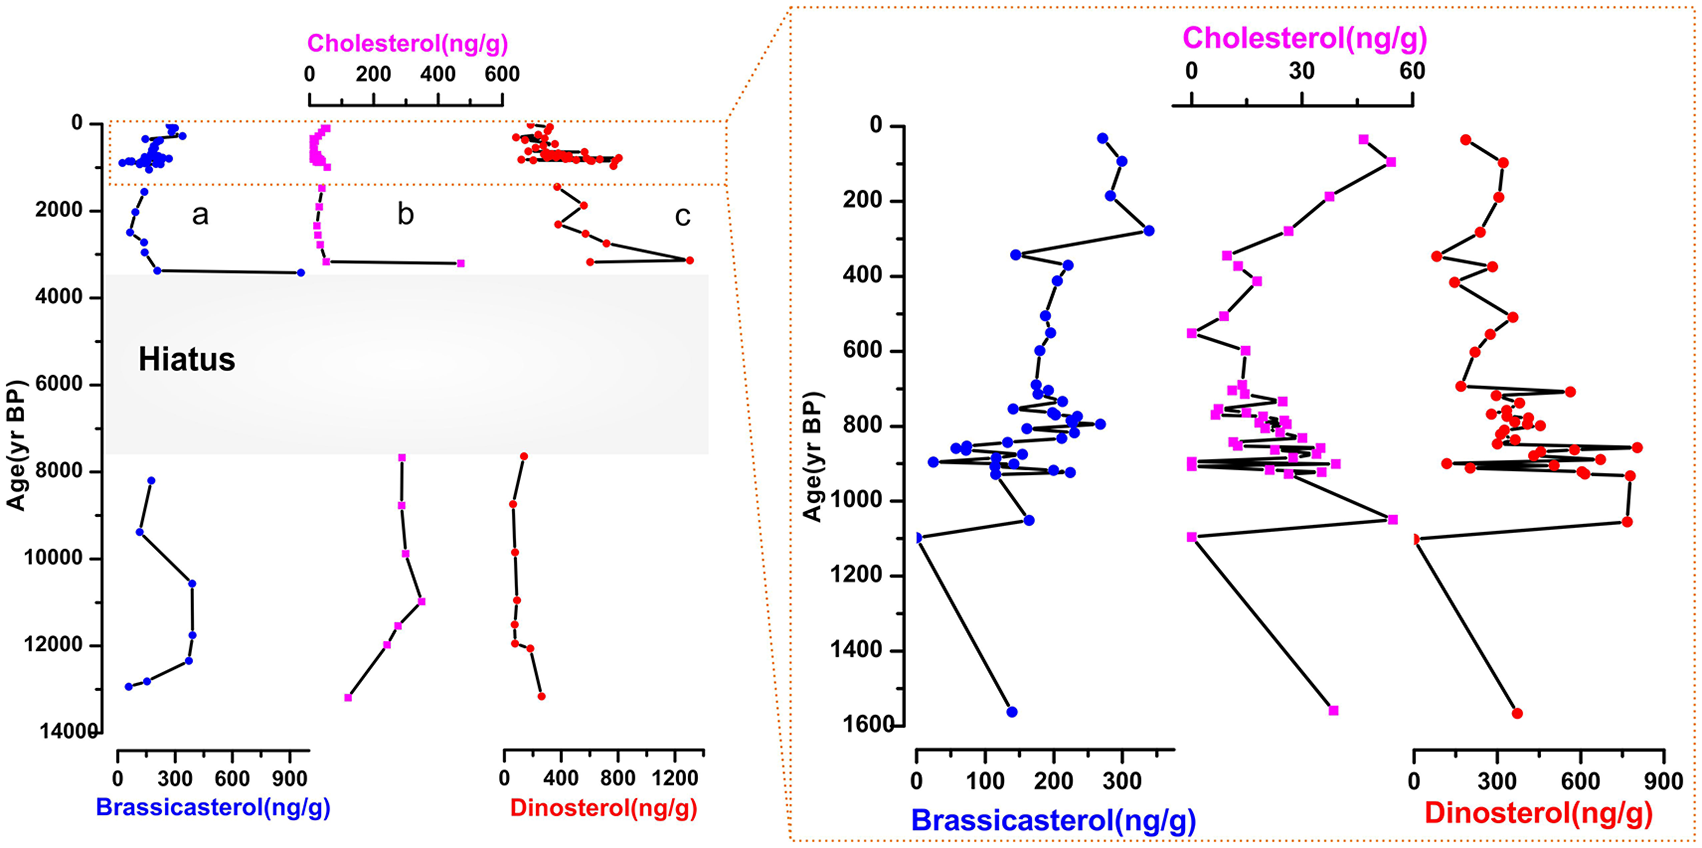
Variability of sterol biomarkers from the core Indus-23AP over the last 14,000 years: (a) brassicasterol (ng g−1), (b) cholesterol (ng g−1), and (c) dinosterol (ng g−1). The insert shows the same proxy records during the last 1600 years.
Paleoproductivity in the northern Arabian Sea
We reconstructed the changes in paleoproductivity using a set of biomarkers (cholesterol, dinosterol, and brassicasterol) from the western Indus Shelf. As mentioned above, both cholesterol and brassicasterol show relatively high concentrations during the late deglaciation (14,000–11,000 yr BP). Taking into account the very shallow water depth at the core site, this feature probably reflects reworking of pre-existing sediments. During the early Holocene (11,000–8000 yr BP), concentration of cholesterol remains relatively high while those of brassicasterol and dinosterol show lower values (Figure 5). This period broadly coincides with the so-called Holocene Humid Period characterized by enhanced monsoon intensity in the subtropical northern Hemisphere, resulting in increasing Indus River discharge (Figure 5d, e, and f; Fleitmann et al., 2003; Gupta et al., 2003; Staubwasser et al., 2003).
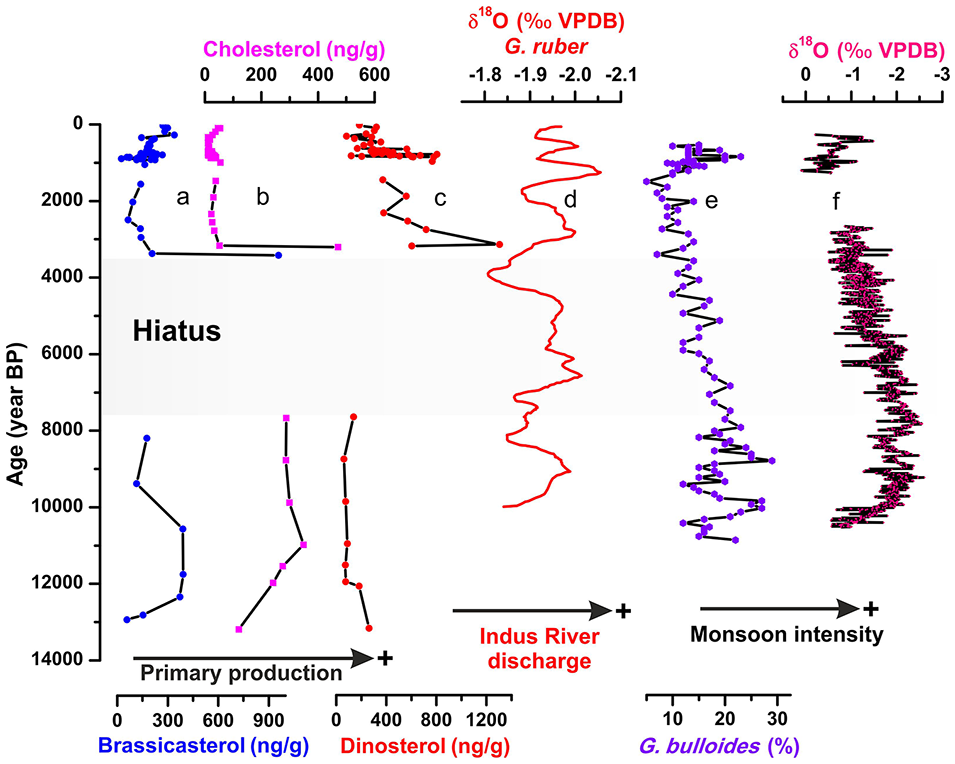
Variability of sterol biomarkers from Indus-23AP core over the last 14,000 years; (a) brassicasterol (ng g−1), (b) cholesterol (ng g−1), (c) dinosterol (ng g−1), and (d) Indus River discharge based on the δ18O of G. ruber from core 289KL (Staubwasser et al., 2003). (e) Indian monsoon upwelling record from continental margin of Oman, Arabian Sea based on abundance of G. bulloides (Gupta et al., 2003) and (f) Q5 δ18O record (Fleitmann et al., 2003) from Qunf Cave in southern Oman.
Our three compounds (cholesterol, dinosterol, and brassicasterol) show a slight increase around 3300–3400 yr BP and 900–1000 yr BP and during the last centuries that perfectly correlates to increased Indus River discharge as shown by the lighter δ18O values of G. ruber from core 63KA (continental margin off Pakistan; Staubwasser et al., 2003). Evidence of increasing Indus River discharge during the last millennia comes also from the XRF analysis of core SO130-289KL retrieved from the OMZ (Sindh continental margin; Deplazes et al., 2014). Several studies highlighted that the Summer Indian Monsoon slightly increased during the late Holocene, especially over the last 2 millennia, resulting in increasing land-derived input (Deplazes et al., 2014; Fleitmann et al., 2003; Gupta et al., 2003; Limmer et al., 2012; Staubwasser et al., 2003). These features indicate the crucial role of terrestrial OM input on the primary production in the western Indus Shelf.
As can be seen from Figure 1b, maximum chlorophyll-ɑ concentration occurs during summer season as a result of strong southwesterly winds related to Indian summer monsoon. Enrichment of phytoplankton in this part of the Arabian Sea is related to wind-derived vertical mixing but also to river discharge during the summer monsoon. The high productivity in the northeastern Arabian Sea is probably caused by the northeastward drift current, forced by the strong southwest monsoonal winds of nutrient-rich surface waters with a rich stock of biomass from Oman to the Pakistan margin (Böll et al., 2014). Brock et al. (1992) further highlighted that biological production in the Arabian Sea is controlled by monsoon-driven upwelling.
TEX86-derived SSTs record in the northern Arabian Sea
Archaea are ubiquitous in terrestrial and marine environments (Jörn et al., 2018). The distribution and ubiquity of archaea indicate an important role in global carbon and nitrogen cycling (Francis et al., 2005). GDGTs constitute membrane lipids produced by nonthermophilic Crenarchaeota (Damsté et al., 2002b). These organisms are ubiquitous and abundant in seawater and large lakes and can be used to evaluate past water temperatures in paleoclimate research (Schouten et al., 2002). The most universally detected tetraether lipids in coastal marine sediments are branched and isoprenoid GDGTs (br-GDGTs and iso-GDGTs, respectively). br-GDGTs are membrane lipids most likely of anaerobic and heterotrophic bacteria and are found in soils and in peat (Pancost and Damsté, 2003; Weijers et al., 2006a, 2006b, 2007). Crenarchaeol, the characteristic membrane lipid of Crenarchaeota, has recently been shown to be abundant at depths of 500 m in the Arabian Sea, and is mainly derived from pelagic marine Crenarchaeota (Damsté et al., 2002a). GDGT-0 is also derived in substantial part from planktonic Crenarchaeota, but methanogenic archaea can also constitute a source (Pancost et al., 2001a).
The BIT index (Eq. 1) is the ratio between three major br-GDGTs (br-GDGT-I, br-GDGT-II, and br-GDGT-III) and the iso-GDGTs, membrane lipid crenarchaeol, synthesized by marine pelagic Crenarchaeota (Weijers et al., 2006a). It has been applied to trace past changes in soil OM input in paleoenvironmental studies (Sluijs et al., 2006). It is used here as a proxy for evaluating the contribution of terrestrial soil OM in our core site (Figure 6). The BIT index has been calculated as follows:


Sedimentary profiles of GDGT-based parameters, including the (a) Branched GDGTs; (b) crenarchaeol; and (c) BIT index from Indus-23AP core over the last 14,000 years. The insert shows the same proxy records during the last 1600 years.
The BIT index ranges from 0 to 1, with a value of 0 showing the presence of only crenarchaeol with no br-GDGT inputs, while a value of 1 indicates the presence of only br-GDGTs. The soil end-member can be less than 1 because of the production of small to moderate amounts of crenarchaeol in soils (Hopmans et al., 2004; Weijers et al., 2006a). Generally, BIT index values are low on continental shelves, and increase toward the mouths of large rivers (Kim et al., 2006).
Crenarchaeol and br-GDGTs I, II, III were detected and quantified in Indus-23AP core. Concentrations of the br-GDGTs are on average 135.83 ng g−1 with high concentrations during the last 1600 years (Figure 6a). Crenarchaeol concentrations are higher during the last 3400 years with an average value of 79,475 ng g−1, but they show a distinct maximum of 267,943 ng g−1 around 900 yr BP (Figure 6b). The predominance of GDGT-0 and crenarchaeol, together with low GDGT-0/Crenarchaeol ratios (ranging from 0.06 to 0.71), suggest that the GDGTs in Indus-23AP core were mainly derived from planktic thaumarchaeota. The BIT index in Indus-23AP core ranges from 0.06 to 0.61 (Supplemental Table S2, available online), similar to the previously measured ranges for continental shelves (Hopmans et al., 2004). However, the majority of continental shelf BIT values in the literature are on the low end of this spectrum (<0.10).
The BIT index shows higher values during the late deglaciation-early Holocene (from 14,000 to 8000 yr BP) and over the last 1000 years (0.61 ± 0.12) and lower values down to 0.06 between 3400 and 1000 yr BP (Figure 6c). During the last 1600 years, the BIT index did not rise above 0.61, and the highest values are seen at around 900 yr BP (Figure 6c). Indeed, higher BIT index values during the late deglaciation-early Holocene most probably reflect reworking of glacial sediments as previously highlighted by Limmer et al. (2012), because of the low sea level at that time. Increasing BIT index over the past 1000 years is in agreement with increasing Indus River discharge and relatively strong monsoon intensity (see the ‘Paleoproductivity in the northern Arabian Sea’ section). However, according to Weijers et al. (2007), BIT values above 0.3 can significantly bias the TEX86 signal.
Schouten et al. (2002) introduced SST proxy, TEX86, based on the relative distribution of GDGTs. TEX86 provides detailed information on SST variations in the Western Indus Shelf of northern Arabian Sea over the last 14,000 years and thus allows us to determine the impact of the Arabian Sea monsoonal climate system on the recorded SSTs. TEX86-derived SST estimates in Indus-23AP core range from 14.9°C to approximately 23.8°C (Figure 7b).
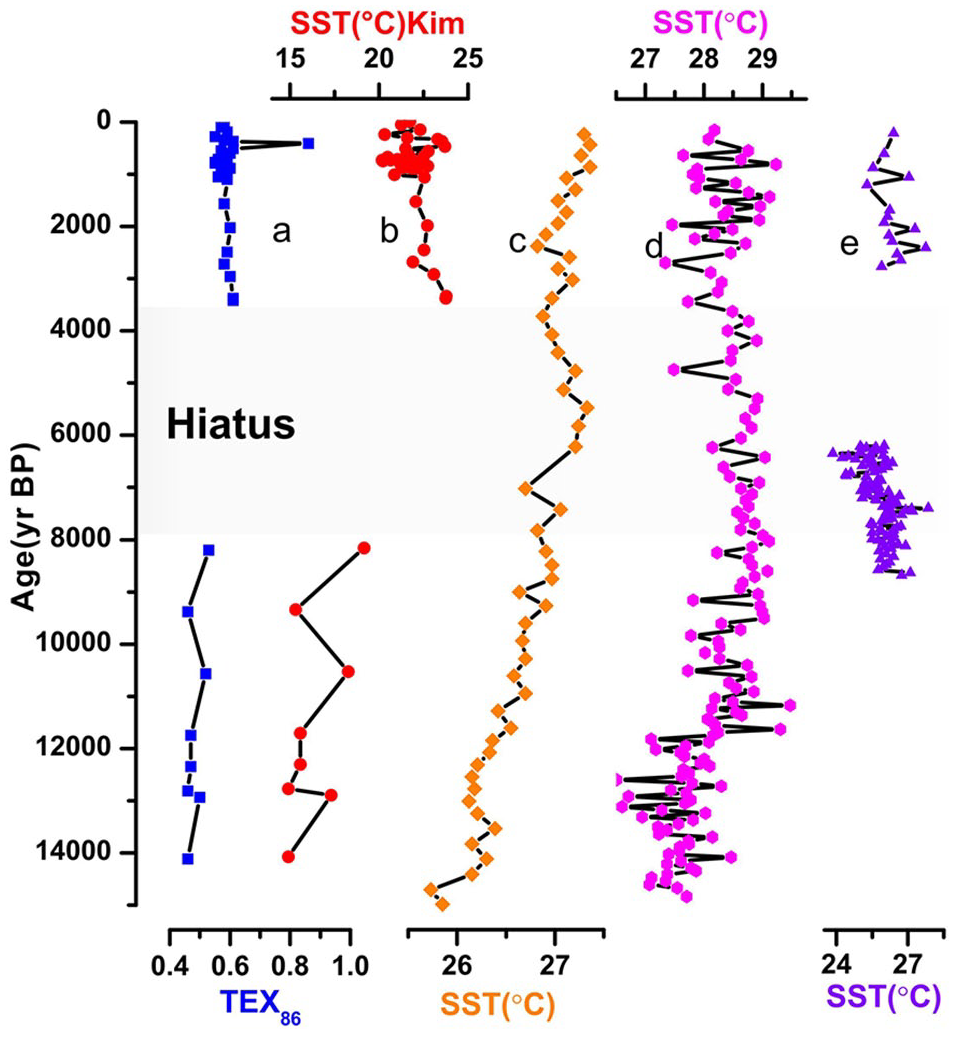
(a) TEX86 and (b) SST record from core Indus-23AP over the last 14,000 years compared with (c) SSTs from core 74KL from Western Arabian Sea (Huguet et al., 2006b); (d) SSTs from core SK237-GC04 from Eastern Arabian Sea (Saraswat et al., 2013); and (e) SSTs from core M74-SL163/MC681 from Northern Arabian Sea (Munz et al., 2017).
SSTs indicate a long-term warming trend of ~ 4°C over the last 10,000 years, in agreement with the global compilation of Marcott et al. (2013). According to Marcott et al. (2013), SSTs in tropical regions highlight a warming trend from the early to late Holocene in contrast to those from high latitudes that show a cooling trend. This is also in agreement with model simulations of the last 13,000 years (Liu et al., 2014) and the recent compilation of Mediterranean alkenone and TEX86-derived SSTs (Jalali et al., 2016). The same SST warming trend during the Holocene can be also observed from the northern and the eastern Arabian Sea (Figure 7c and d). A warming of about 2.5°C was measured in the Oman upwelling area and less than 2°C in the open western Arabian Sea, the Somali upwelling, and the southeastern Arabian Sea south of India (Gaye et al., 2018). Core 74KL in the Western Arabian Sea also shows a 2°C warming trend through the Holocene. Cold SSTs near coastal sites in the upwelling centers during the early Holocene climate optimum could indicate enhanced upwelling because of the strong summer monsoon during this time interval (Böll et al., 2015). Warming trend in tropical regions may be linked to increasing winter insolation during the Holocene (Marcott et al., 2013). Despite different time resolution, our SST record shows a good correspondence with the speleothem record from the Qunf Cave in southern Oman (Figure 5e). Strong summer Indian Monsoon coincides with cold SSTs in core Indus-23AP and vice versa. This result highlights the influence of southwesterly winds on SSTs in the northern Arabian Sea that seems to be stronger during the summer season. However, taking into account the high BIT values during late deglaciation-early Holocene and the last 1000 years, this interpretation should be taken with caution. This feature can also explain the relatively high warming trend calculated for the Indus-23AP SSTs over the last 10,000 years (~4°C) compared with other SST records from the Arabian Sea (~2°C).
Conclusion
A suite of geochemical tracers (δ13C, δ15N, TOC, TN, C/N, GDGT) and biomarkers (alkenone, brassicasterol, dinosterol, cholesterol) have been used to reconstruct source of OM, past productivity, and SST from the Indus shelf since the late deglaciation (the last 14,000 years). Geochemical records, such as C/N ratio, δ13C, δ15N, and the BIT index, all indicate evidence of a mixed source of OM. Both TOC and TN show higher levels during the late Holocene, indicating increased sediment supply from the Indus River. Sterols also indicate that productivity is tightly related to Indian summer monsoon intensity and Indus River floods during the late Holocene. The TEX86 SST from Indus-23AP core together with available SST records from the Arabian Sea show a long-term warming trend during the Holocene because of increased low latitude winter insolation.
Supplemental Material
Kahkashan_et_al._Suppporting_Information – Supplemental material for Holocene organic geochemical record from the Western Indus continental shelf (northern Arabian Sea)
Supplemental material, Kahkashan_et_al._Suppporting_Information for Holocene organic geochemical record from the Western Indus continental shelf (northern Arabian Sea) by Sanober Kahkashan, Jianfang Chen, Xinhong Wang, Peter D Clift, Bassem Jalali, Asif Inam, Monawwar Saleem, Javed Aftab, Zhongqiang Ji, Youcheng Bai, Zhongqiao Li, Jin Haiyan, Hongliang Li and Lihua Ran in The Holocene
Footnotes
Acknowledgements
We want to thank Dr Liviu Giosan at Woods Hole Oceanographic Institution, US, and Dr Guy Rothwell and Dr Suzie MacLachlan at British Ocean Sediment Core Research Facility, Southampton Oceanography Centre, UK, for providing core Indus-23AP. We thank the lab staff at the Second Institute of Oceanography, Ministry of Natural Resources, Hangzhou, China, for laboratory support on the bulk sediment elemental analysis and carbon isotope analysis. The authors are thankful to Dr Stephan Steinke, Dr Laodong Guo, and Dr Jian Ren for constructive comments, and suggestions that greatly helped to improve the manuscript. The authors would like to thank the two anonymous reviewers and the editor Dr Fabienne Marret for their stimulating reviews that improved the manuscript.
Funding
The author(s) disclosed receipt of the following financial support for the research, authorship, and/or publication of this article: This research was supported in part from the National Key Research and Development Program of China (Grant No. 2017YFC1405104), China-ASEAN Maritime Cooperation Fund Project, Chinese MNR’s JAMES (Joint Advanced Marine and Ecological Studies) Program, and China Government Marine Scholarship.

Supplemental material
Supplemental material for this article is available online.
References
Supplementary Material
Please find the following supplemental material available below.
For Open Access articles published under a Creative Commons License, all supplemental material carries the same license as the article it is associated with.
For non-Open Access articles published, all supplemental material carries a non-exclusive license, and permission requests for re-use of supplemental material or any part of supplemental material shall be sent directly to the copyright owner as specified in the copyright notice associated with the article.
