
Abstract
Here we present a continuous palaeoclimatic record of 5980 years (7230 cal BP–1250 cal BP) from Hetapatti, a Neolithic site situated on the western fringe of the Central Ganga Plain. The region was a center of reurbanisation following the decline of the Harappan civilisation and is considered a hub of economic, political and religious evolution since the sixth millennium BC. Hetapatti contains an uninterrupted sequence from Neolithic to Historic (Gupta) period. The study integrates two different approaches (phytoliths and carbon isotope analysis) to infer vegetational and climatic changes and to understand their relationship to the cultural sequence. Our results show a gradual transformation from a warm and humid climate into a warm and dry climate from the Neolithic to Historic (Gupta) period. We find an abrupt weakening of the ISM at ~2080 cal BP driving a warm and dry climate. The comparison of our data with other high resolution regional and global records led us to hypothesise a synchronicity in this warm and dry trend, coeval with the Roman warm period (RWP). The observed variation in vegetation and climate might have driven by the fluctuations in the Indian Summer Monsoon (ISM). Additionally, the phytolith analysis provides evidence of cereal crops including rice, wheat, barley, millets, etc. suggesting a crop affinity with the earlier Indus crop package. It is interesting to note that the site displays an uninterrupted cultural sequence from Neolithic to Historic times, with artefacts of each phase exhibiting technological and stylistic developments from the preceding culture. From this we infer that the well adapted socio-ecological strategies and availability of perennial rivers may have helped the ancient civilisation to absorb the stress relating to a varying climate.
Introduction
The Ganga Plain, one of the largest alluvial tracts of the world, located between the Himalaya and Peninsular India, has been cradle of human settlement sites right from the terminal Pleistocene period (Singh, 1971). The region was a center of reurbanisation following the decline of the Harrapan civilisation and is considered hub of economic, political and religious evolution since the sixth millennium BC (Singh, 2014). While following the decline of Indus Valley civilisation, the cultural and economic focus of the subcontinent was gradually shifted towards Ganga plain, however the nearby Vindhyan-Kaimur hilly terrain was already occupied from the Stone Age. The Neolithic populations first occupied the Middle Ganga Plain (6500–2200 BCE) while the Upper Ganga Plain was occupied by Ochre Coloured pottery (OCP) (2200–1800 BCE) or Copper Hoard Culture (Saraswat, 1992; Tripathi, 2017). The Neolithic way of life in Ganga plain lasted for a long time starting somewhere between eighth–seventh millennium BC and third–second millennium BC (Singh, 2014). While the OCP culture in the Ganga plain is known to exist from about second millennium BC and persisted around first millennium BC (Saraswat, 1992). The fertile alluvial plain hosts a diversity of archaeological cultures and is dotted with numerous high mounds containing uninterrupted cultural sequences (Tripathi, 2017). These sites provide a record of the transition from food-gathering/hunting community through incipient food producing to settled village farming during the Neolithic (Sharma, 1985; Singh 1990; Tewari et al., 2006).
Sedentism, and an economy based on domesticated cattle and rice agriculture are salient characters of Neolithic of the Ganga Plain (Allchin and Allchin, 1997; Mandal, 1997; Pandey, 1988; Pokharia et al., 2017; Singh, 2014). Past studies suggest the history of agriculture in Ganga plain begins with rice cultivation from its wild to domesticated species, marking this region as an independent zone of rice cultivation at around seventh millennium BC (Saraswat, 2005; Saraswat and Pokharia, 2004; Tewari et al., 2006; Tripathi, 2017). Later on, indigenous millet cultivation may occur simultaneously with rice cultivation (Harvey and Fuller, 2005; Murphy and Fuller, 2017; Saraswat, 2005) and by the late Neolithic phase the double cropping pattern became common (Pal, 2008). Remains of domesticated animals including (Bos indicus), buffalo (Bubalus bubalis), sheep, goat and pigs also have been reported from the region (Joglekar et al., 2008).
The last few decades have seen a steady increase in the study of climate, environment and the culture-subsistence relationship (Anderson et al., 2007; Gupta, 2004; Kuper and Kröpelin, 2006; Sandweiss and Kelley, 2012; Sandweiss and Quilter, 2008; Weiss and Bradley, 2001). Similarly, the archaeobotanical data in north-western India have been used to explore aspects related to culture-climate-subsistence relationship during Indus civilisation (Farooqui et al, 2013; Madella and Fuller, 2006; Pokharia et al., 2011, 2014, 2017). The Climatic variations in Ganga Plain drove changes in human societies related to adaptive strategies, occupation of new landscapes, migration and transformation from hunter gatherer to agriculturist (Singh, 2005). The adaptation to agriculture and the shifting of settlements has been related to climatic instability (Richerson et al., 2001). Archaeological sites can provide well-defined and discrete climatic signals in datable cultural contexts directly related to archaeological era (Sandweiss and Kelley, 2012). In an Indian context, various studies related to past climate and culture are available based on lacustrine sediments (Chauhan et al., 2004, 2009, 2015; Farooqui et al., 2013; Prasad et al., 2014a; Prasad and Enzel, 2006; Saxena et al., 2013; Sharma et al., 2004a, 2006), soil carbonate nodules and soil organic matter (Agrawal et al., 2012, 2013a, 2013b, 2014a, 2014b; Basu et al., 2015), fluvial landscapes (Giosan et al., 2012), marine sediments (Staubwasser et al., 2003) and isotopic studies of off shore sediments (Ponton et al., 2012) etc., but rarely obtained directly from the archaeological sites (Ghosh et al., 2013; Jha et al., 2020; Premathilake et al., 2017; Sharma et al., 2004b). Studies from Kota Cina, archaeological site in Indonesia and Iron age and Gallo-Roman archaeological sediments from Beaurieux Les Greves, France, are good example of documenting the evolution of vegetation and human influence from archaeological sediments (Chabot et al., 2018; Innes and Haselgrove, 2019). Recent studies from Quaternary fluvial sequences of the Belan river in north-central India suggest climate-driven shifts in population density or local migration of prehistoric humans during the Middle Palaeolithic to Early Neolithic phase (Jha et al., 2020). The study from Great Rann of Kutch, synthesis of collapse of Dholavira and the climate culture relationship at the Vigakot and Karim Shahi settlement western India respectively prove that archaeological sites can be a powerful archive for palaeoclimatic and palaeovegetation studies (Sarkar et al., 2019; Sengupta et al., 2019).
Despite the Ganga Basin’s wider geographical extent, rich archaeological archives (Figure 1a) the region has not yet received much attention, excepting a few studies, intending to reconstruct regional paleoclimate. Most of these were focussed on the palynological study of few lacustrine deposits (Chauhan et al., 2004, 2009, 2015, 2018; Wasson et al., 2013), stable isotopic investigation of soil carbonate nodules and soil organic matter (Agrawal et al., 2012, 2013a, 2013b, 2014a, 2014b), and a few multiproxy studies including lake sediments (Misra et al., 2020; Saxena et al., 2015; Saxena and Singh, 2017; Sharma et al., 2004a; Tripathi et al., 2017; Trivedi et al., 2013). The only available record from archaeological contexts is, an Oxygen isotope analysis of mammalian teeth from the archaeological sites of Kalli Pachchhim, Dadupur and Charda (Sharma et al., 2004b).

(a) Map showing study area along with archaeological sites of Ganga plain, (b) Location map of the study area, (c) Neolithic Celt, (d) Neolithic corded ware potsherds, (e) Neolithic floor, (f) broken (terracotta) muller of Kushana period, (g) Handmade pot and brick wall, Kushana period, (h) Human burial of Kushana period.
On the western margin of Ganga plain, the identification of a Neolithic culture was reported for the first time at Hetapatti and Jhusi on the bank of River Ganga, with more Neolithic sites are supposedly located between the eastern and western margin of the area (Pal, 2007). Hence present work also expands the sparse palaeoclimatic record from Ganga plain in archaeological context. Here we provide a palaeoclimatic record from 7230 cal BP to 1250 cal BP from Hetapatti (25°29′0″N; 81°55′31″E), a Neolithic site located in western fringe of Central Ganga Plain (CGP), containing a continuous cultural record from the Neolithic to Historic (Gupta) period as identified by archaeological artefacts (Pal, 2008). Our work integrates two different approaches (phytolith and carbon isotope analysis) to evaluate mid to late Holocene vegetation and climate in Central Ganga Plain.
Regional setting and climate
Geology and geomorphology
Ganga Plain, a peripheral foreland basin, came into existence in Early Miocene, further expanded in the Middle Miocene and attained its present form in the Late Quaternary (Singh, 1996, 2004). The Plain comprises of unconsolidated Quaternary sediments underlain by the Precambrian rocks (Valdiya, 1976). These sediments are derived from the weathering and erosion of rocks from the northern Himalayas and southern peninsula, which filled the Indo-Gangetic foreland basin (Chauhan et al., 2015; Singh, 1996) and consist of surface cover of Holocene sediments of variable thickness throughout (Singh, 2004, 2005). These sediments are exposed in sections along the rivers. Near the surface, there is scattered inter-layered 1–2 m thick fine sand and silty mud deposits showing extensive but discontinuous calcrete horizons.
According to Oldham (1917) and Mukerji (1963), the geographic features of Ganga Alluvial Plain are classified into two morpho-stratigraphic units, the Newer Alluvium (Khader) and the Older Alluvium (Banger). The Newer Alluvium (Khader) forms deposits of the minor river channels and their valleys, whereas, interfluve surfaces of the Ganga Plain are collectively known as Bangar or upland interfluve surface. The Bangar surface is a depositional terrace of the Pleistocene age (Mukerji, 1963). According to Singh (1996), the Ganga Plain foreland basin is a mature underfilled basin, with an oversupply of sediments where sedimentation takes place by fluvial process. The Ganga Plain surface shows low relief and gentle regional slope from southeast to eastern direction, whereas, the northern part shows southward slope and southern part shows northward slope.
Modern climate and vegetation
Climatically, the study area comes under humid subtropical climate, largely influenced by the Indian Summer Monsoon (ISM) with the mean minimum and maximum temperatures as 27°C and 32.5°C respectively, with peaks around 48°C in the hottest month of June. Commencement of monsoon is from mid-June which continues to mid-September. From mid-July to mid-September, weather becomes sultry and unpleasant. The annual average rainfall is 1020 to 1140 mm. The region is hardly influenced by the western disturbances during winters and about 80% of the rainfall occurs due to the ISM. The winter season lasts from November to February with mean minimum and maximum temperatures of 7.6°C and 21°C respectively. The temperature seldom descends to 0°C during the severe cold months of December and January (Chauhan et al., 2015; Tripathi et al., 2017).
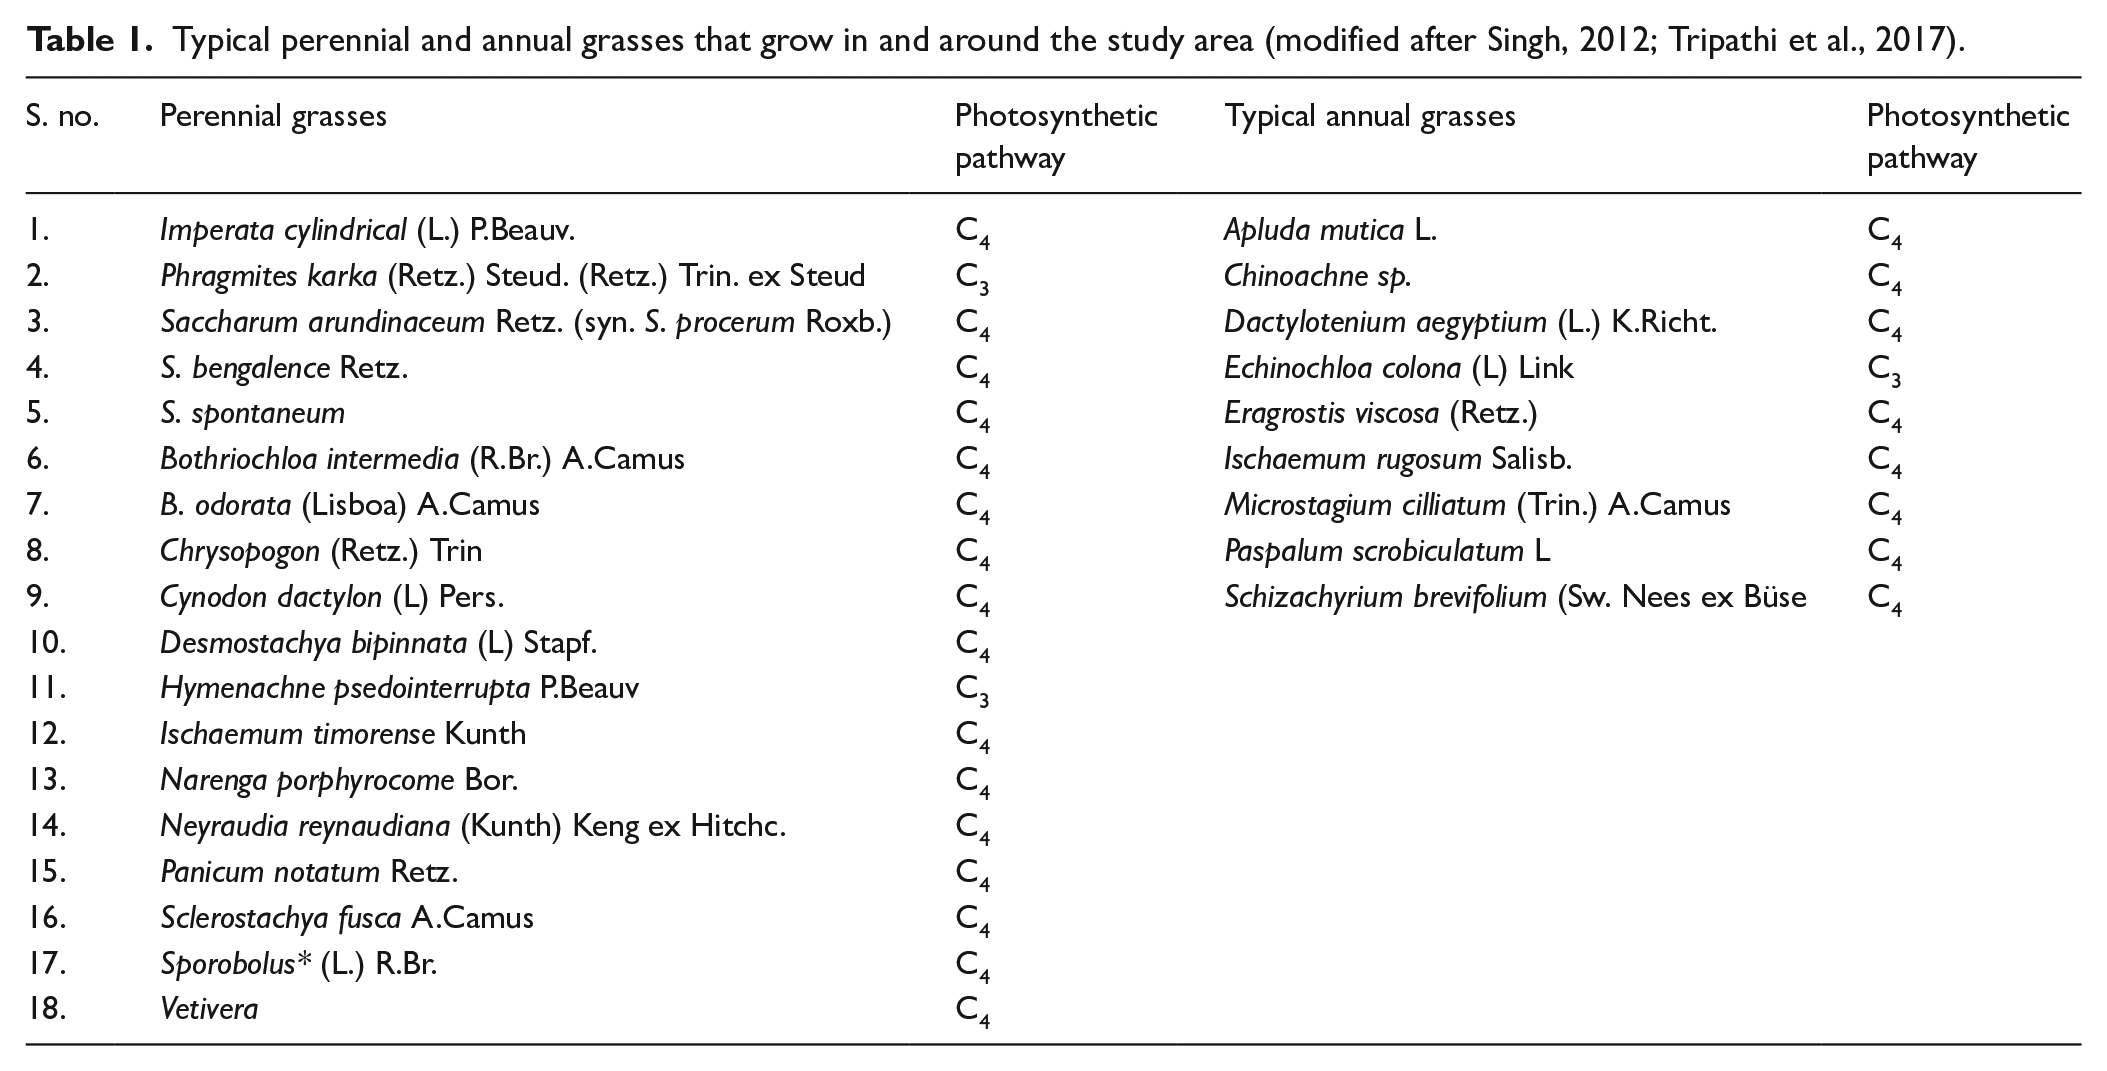
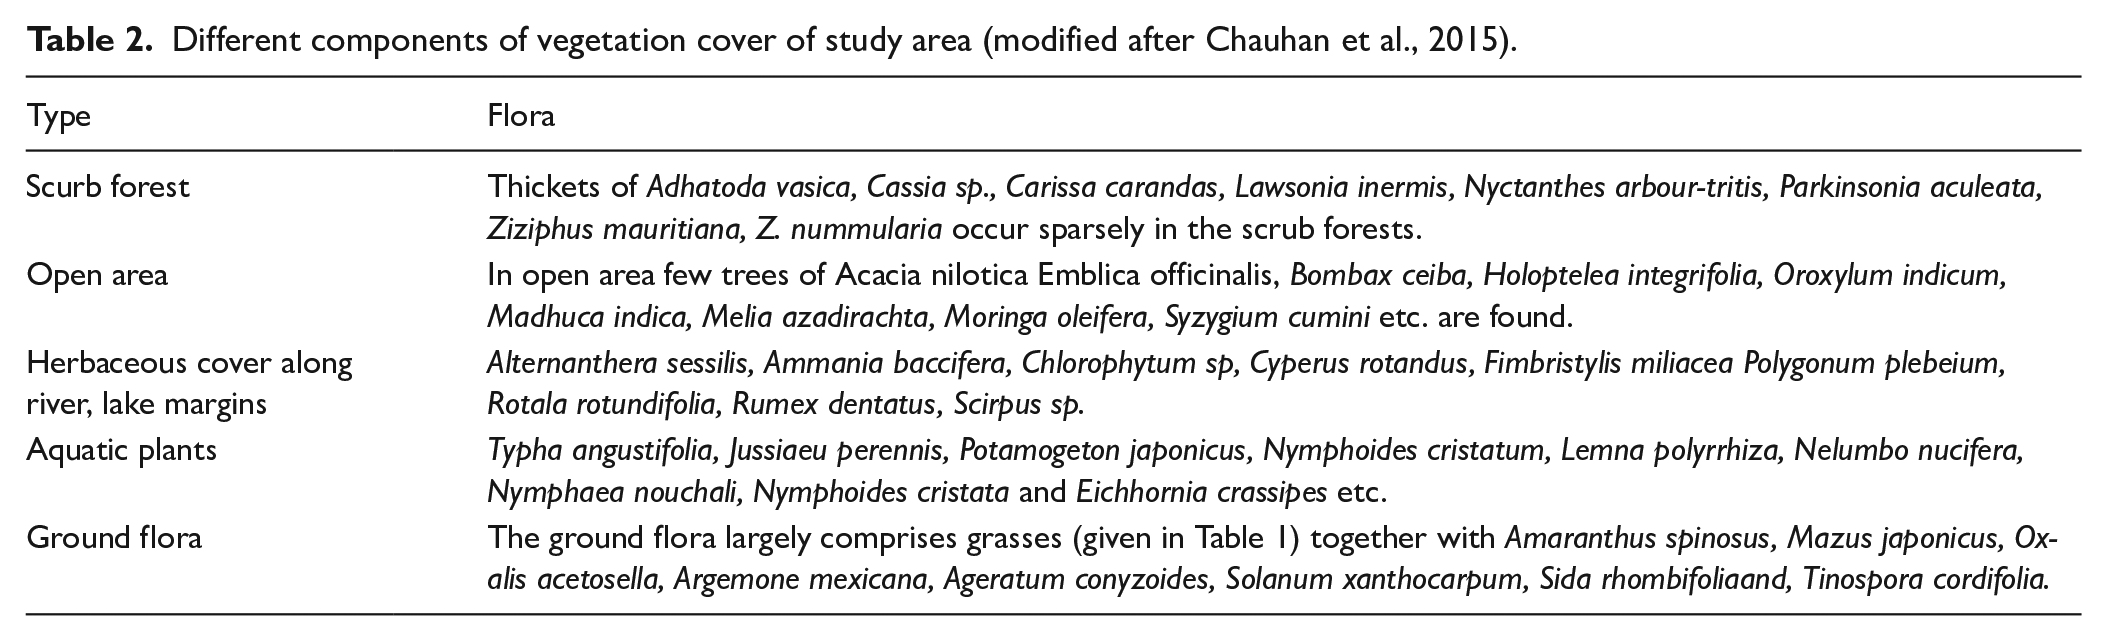
The area is mainly covered by open grasslands, interspersed by scrubby forest strands (Champion and Seth, 1968) and the most common type of grass vegetation throughout this plain is Phragmites-Saccharum-Imperata type (Aucour et al., 2006; Singh, 2012; Suttie et al., 2005; Tripathi et al., 2017). A brief account of vegetation along with the typical perennial and annual grasses, growing around the study area is given in Tables 1 and 2.
Typical perennial and annual grasses that grow in and around the study area (modified after Singh, 2012; Tripathi et al., 2017).
Different components of vegetation cover of study area (modified after Chauhan et al., 2015).
Archaeological background/stratigraphy of Hetapatti site
The Hetapatti archaeological site (Figure 1a and b) is situated on the left bank of the River Ganga, around 20 km from Allahabad. It is a multi-phase site adjacent to the Neolithic Jhusi site. The excavations and explorations in 1998, by University of Allahabad resulted in the recovery of a number of the chunks of semi-precious stones, for example, chert, jasper, chalcedony, etc. along with flakes and blade fragments. This indicates that the ancient human population might have been the microlith users. This supposition has been confirmed by the occurrence of microliths at adjoining Jhusi, Nibikalan and Jamunipur archaeological sites (Pal, 2007). In addition, rounded celts, handmade corded and rusticated potsherds (Figure 1c–e), the diagnostic traits of the Neolithic culture in the area were also recovered, along with other artefacts of succeeding culture and a human burial (Figure 1f–h).
The site is divided across three mounds. The main mound, named as Hetapatti (HPT-II) is 10 m thick profile and contains archaeological deposits from Neolithic to Historic (Gupta) period. The other two mounds, for example, HPT-I and HPT-III, each 6 m thick, contain sequences from the Neolithic to Northern Black Polished Ware (NBPW) and Neolithic to Kushana periods respectively. We selected the HPT-II mound for sampling as it contains an uninterrupted cultural sequence as lower level of disturbance (Pokharia et al., 2017). There is an extensive exposure of geological formation measuring more than 7 m in thickness on which the archaeological deposit rests (Pal, 2008). Two trenches were excavated on the HPT-II mound, which includes trenches (A1 and WA4) refer (Figure 2a–c). Since it was not possible to excavate A1 trench continuously, another trench at the distance of 4 m was excavated. Combining both trenches, we obtain whole profile of the Mound HPT-II from layers 1–24, spanning from Neolithic to Historic (Gupta) period.
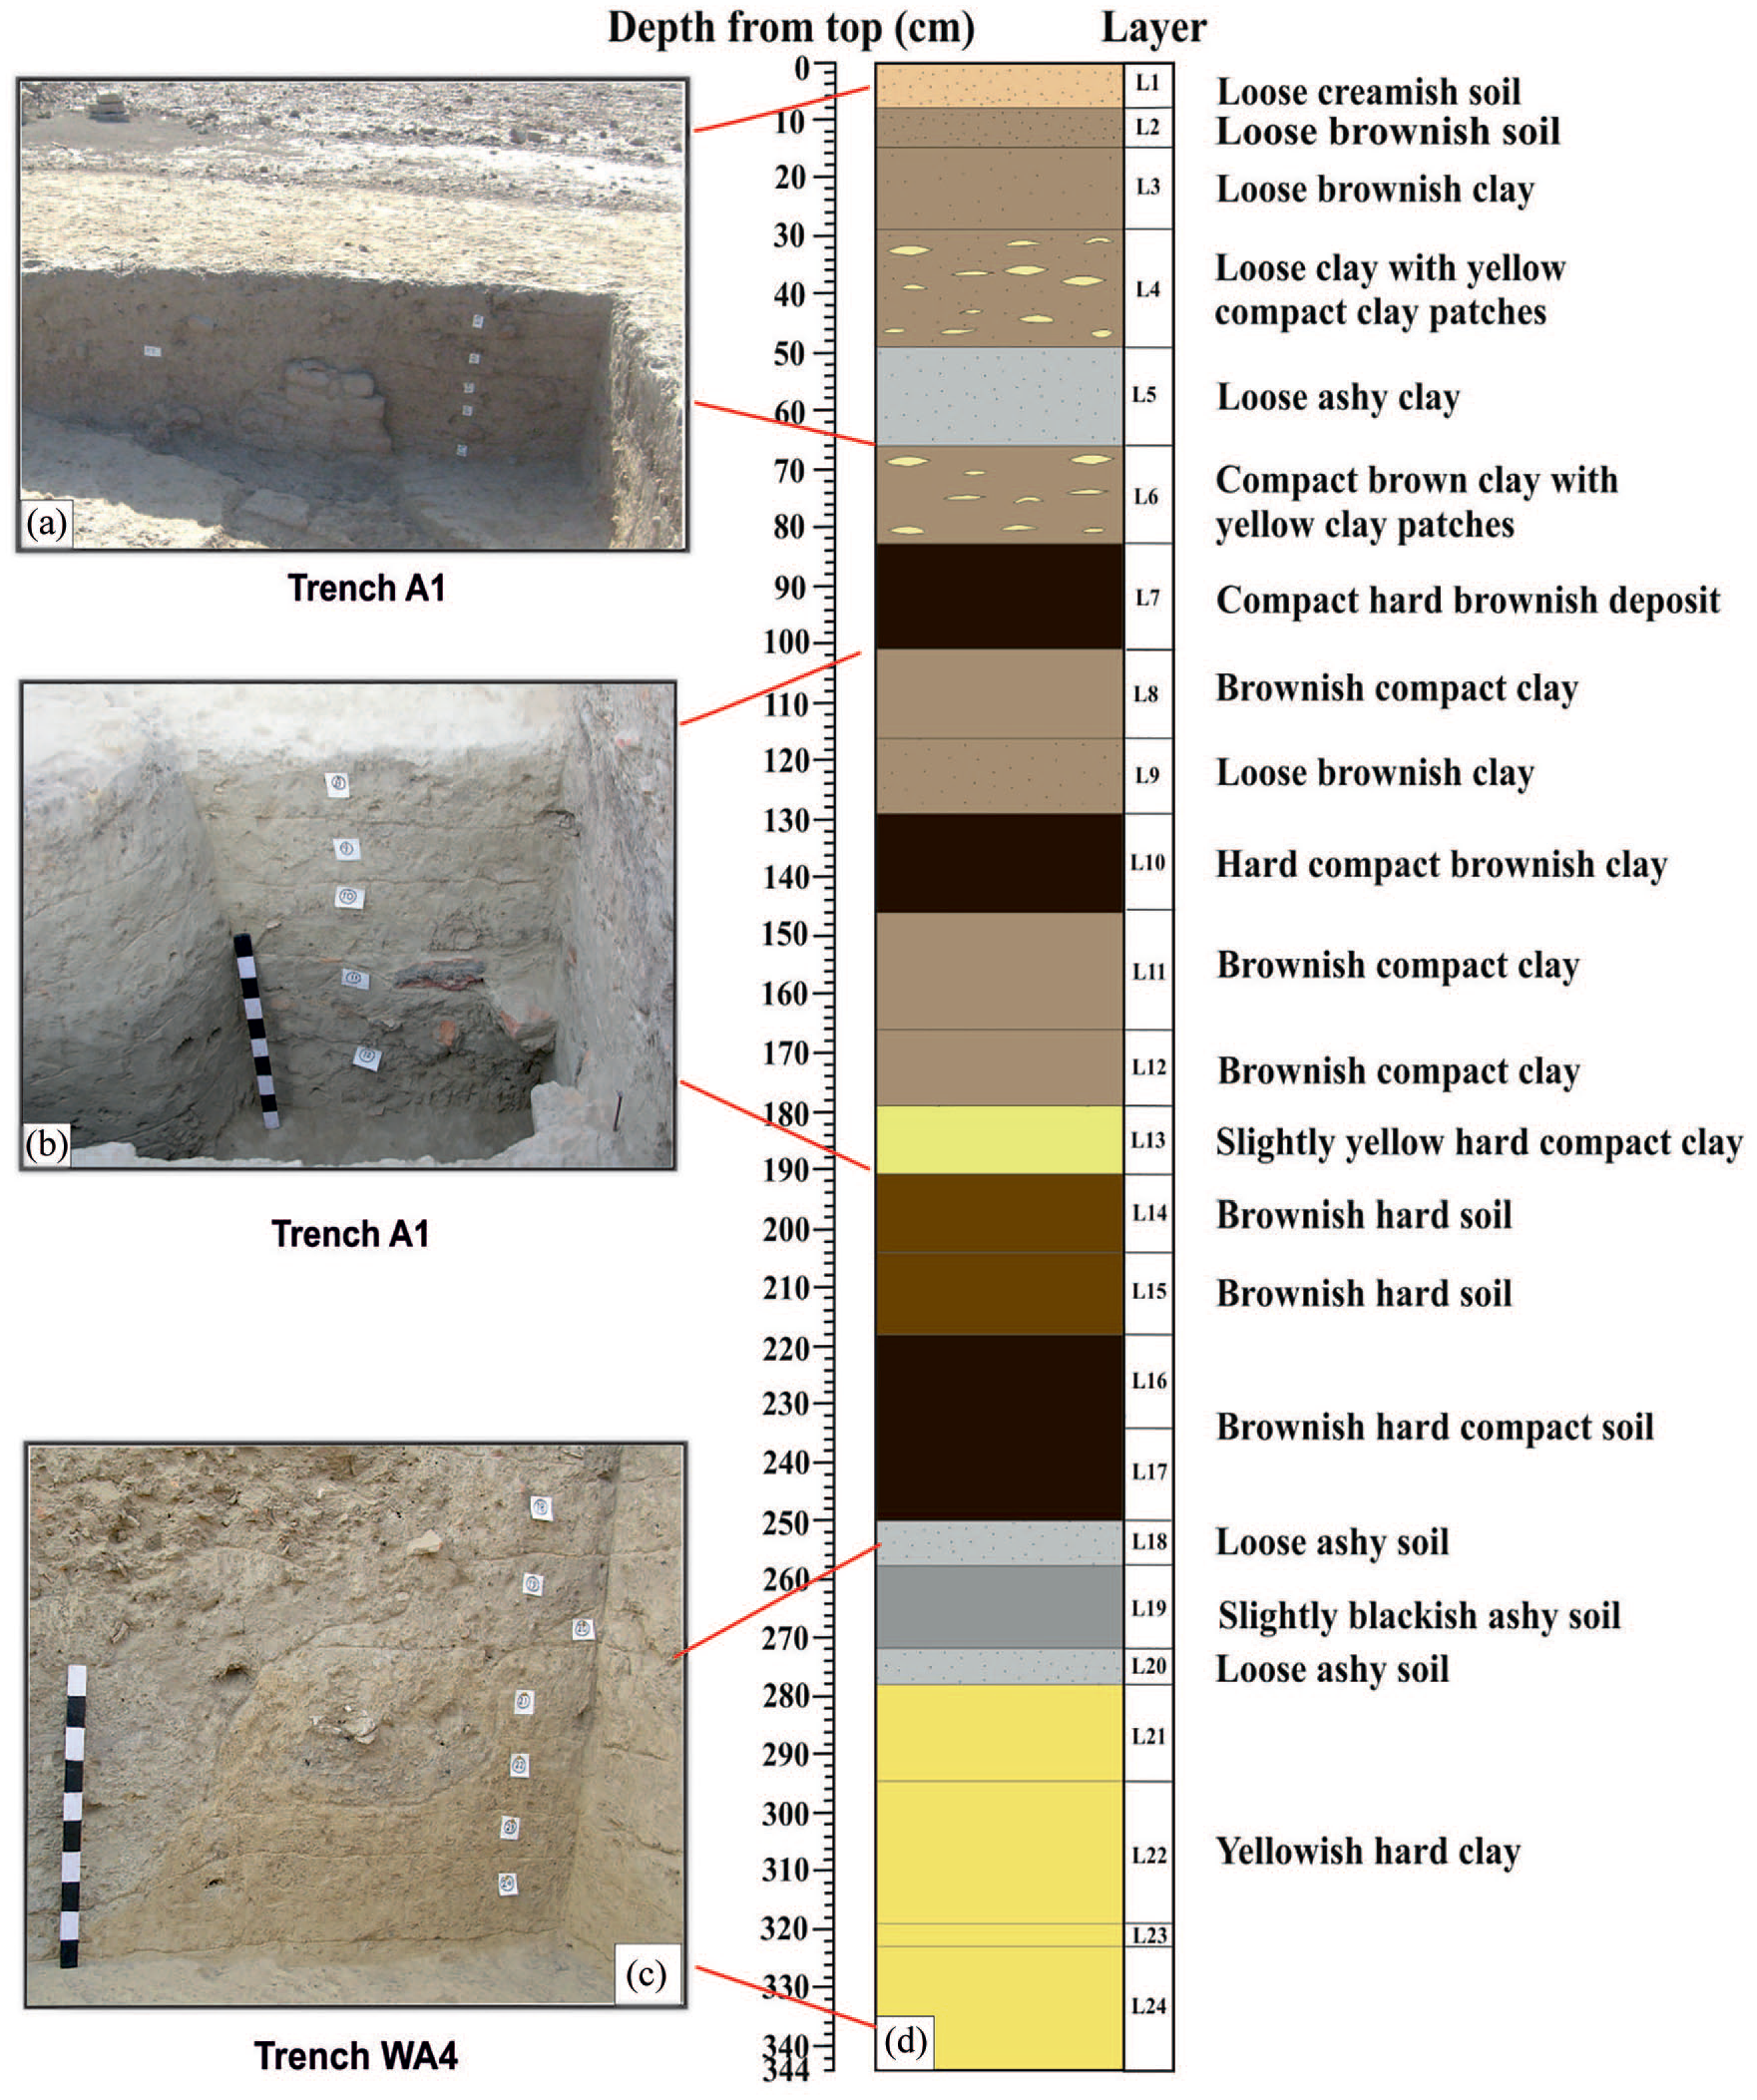
(a) Trench WA4 (showing layer 24–18), (b) Trench WA1 (showing layer 13–18), (c) Trench WA1 (showing layer 5–1), (d) Lithological succession of mound HPT-II.
Composite stratigraphy of studied profile
The HPT-II profile is 3.44 m thick, mainly composed of fine-grained yellowish clay, brownish compact clay and brownish hard sediment. Based on the archaeological material and nature of the deposit, the whole profile is stratigraphically divided into 24 layers with varying thickness (see Figure 2d). The non-laminated yellow hard clay layers (layers, 24–21) yielded corded potsherds, a characteristic Neolithic material, along with Neolithic celts, corded rusticated wares, burnt clay lumps, animal bones, charcoal, etc. indicating this deposit belongs to the Neolithic culture. Layers, 20–19 are composed of loose ashy sediment to blackish ashy sediment and contain potsherds, brickbats, charcoal and pieces of animal bones, representing the Chalcolithic culture. A sealed pit also yielded animal bones and pottery. In trench WA4, layers, 18–13 comprises hard brown sediment material and yielded small brickbats, a few animal bones, charcoal, potsherds and associated red ware, belonging to the NBPW culture. Layers 12–1 were obtained from the trench A1 considering the precise stratigraphic order. The lower layers are rich in compact brown clay while the upper layers are dominated by loose ashy clay mixed soil. These yielded a number of potsherds of red ware, terracotta and semi-precious stone heads, mullers, sharpeners bone arrowheads, iron objects pottery discs, terracotta balls and brick structure along with a human burial. In particular, the structure and ceramics from layers 10–2 indicate that these artefacts belong to the Kushana period and layer 1 was composed of loose creamish soil containing terracotta and pottery of Gupta period. There, apparently, is not stratigraphic break from Neolithic to Gupta period at Hetapatti. The artefacts of each culture, specially the ceramic industry, show an improvement and development from the preceding culture. Similar evidence has been obtained from other sites of the central Ganga plain (Singh, 2010).
Methodology
Field and laboratory work
A total of 24 samples from basal most layer (layer 24) to the top of profile were collected and analysed for phytolith study and supplemented by carbon isotope analysis in addition to five radiocarbon dates.
Chronology
The AMS radiocarbon dates from layers, 24, 21, 19, 13 and 4 (Table 3) were obtained from the HTP-II profile, using AMS (Accelerator Mass Spectrometry) method at Direct AMS Laboratory, Bothell, WA, USA and IUAC (Inter University Accelerator Centre), New Delhi. Finally, the radiocarbon ages (Libby age) were converted into calendar ages using the OxCal 4.2 (Ramsey and Lee, 2013) online calculator (https://c14.arch.ox.ac.uk/oxcal.html) developed by the University of Oxford (see Table 3).
Radiocarbon dates (on bulk sediment samples) from Hetapatti. Ages were calibrated in OxCal v.4.2 (Ramsey, 1995) with the IntCal13 calibration curve (Reimer et al., 2013).
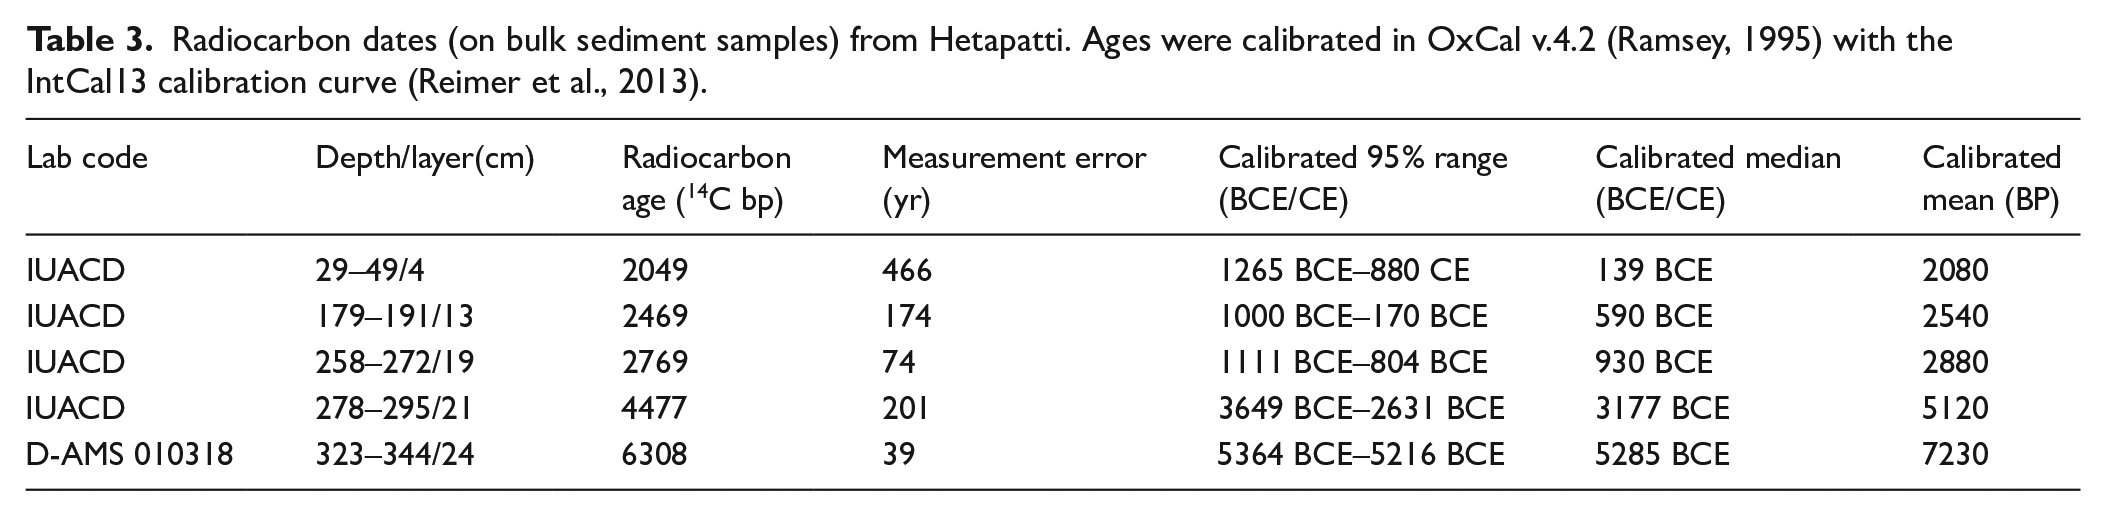
To produce an age depth curve see (Figure 3), the 14C ages from Hetapatti were calibrated in OxCal v.4.2 package (Ramsey, 2001) with the standard IntCal 13 calibration curve (Reimer et al., 2013). A Poisson process deposition model (Ramsey, 2008) was introduced to incorporate prior information (e.g. stratigraphical order of dated samples) with the radiocarbon results and to establish the age-depth relationship (Table 4). This model allows non-uniform depositional rate throughout the sequence, which proves to be more realistic in simulating the depositional history (e.g. Ramsey, 2008). Critical values at 68% and 95.4% respectively were configured for the agreement index and convergence index in the model (Ramsey, 1995).
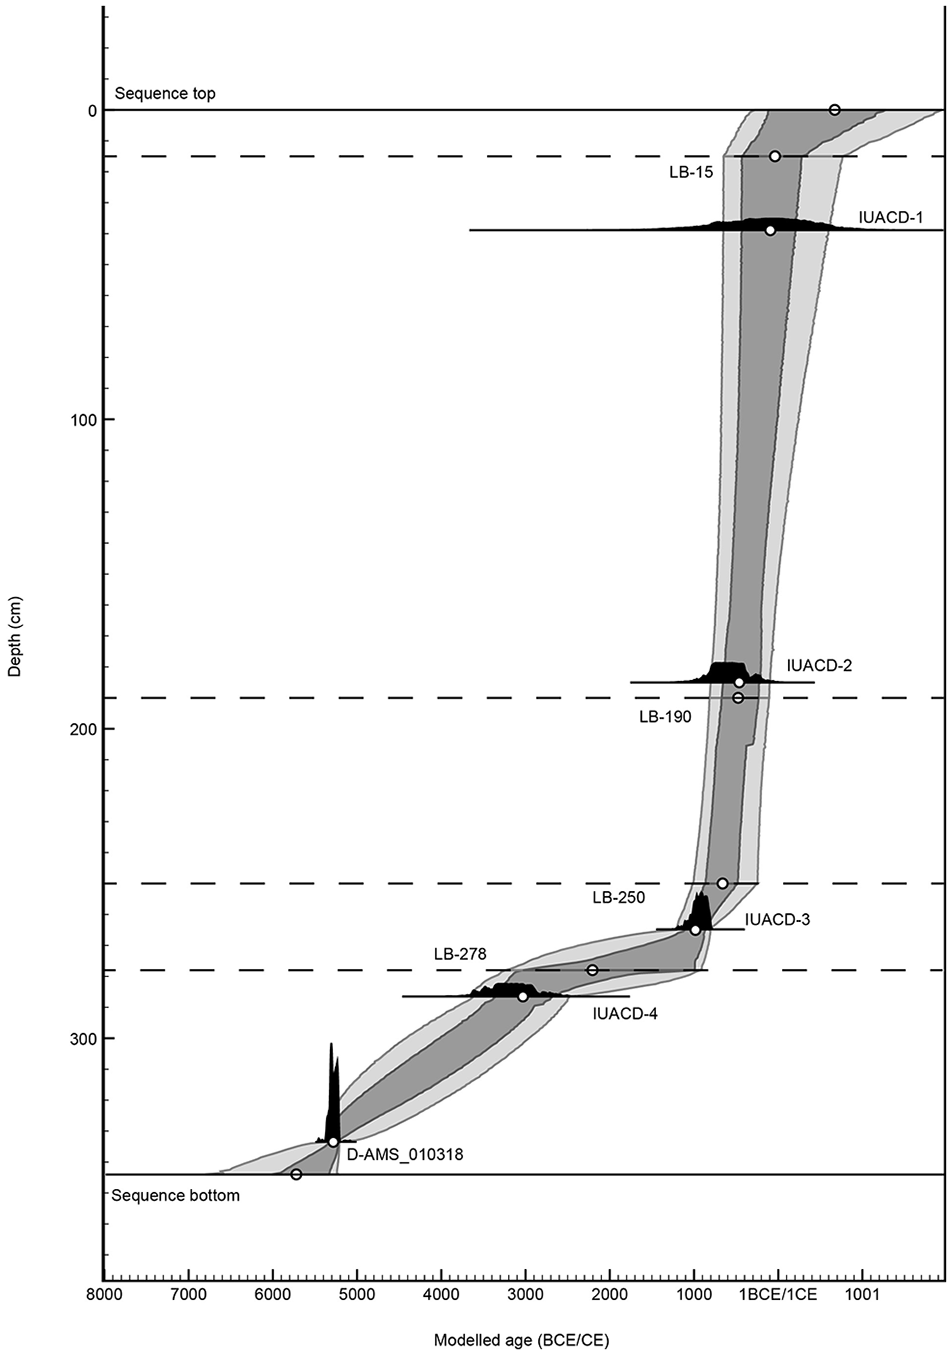
Modelled age-depth relationship in the sediment sequence from Hetapatti archaeological site, Middle Ganga plain, India (darker shades represent 68% probability range, while the lighter shades represent 95.4% probability range). The calibrated probability distribution of every age is shown as solid black curve. Major lithological boundaries, where changes in depositional rate occur, are shown. Open circles represent probabilistic median of modelled ages.
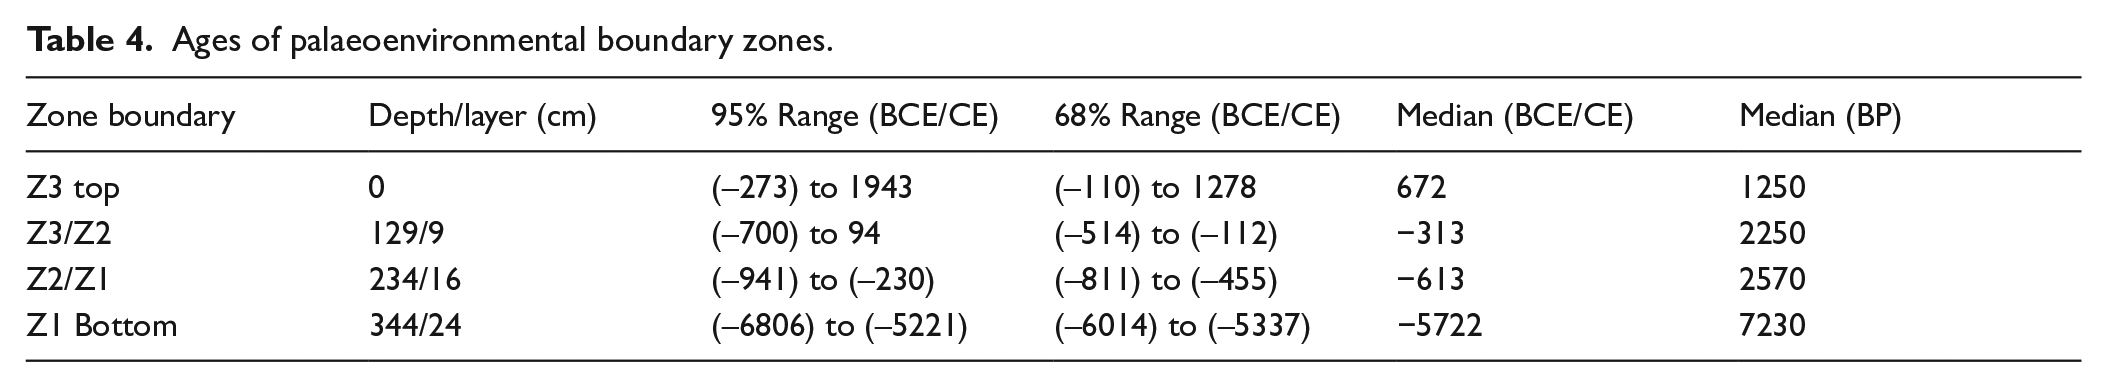
Ages of palaeoenvironmental boundary zones.
Phytolith study
Phytolith extraction procedures were modified following Piperno (2006) and Prasad et al. (2007) after slight modifications. A 10 g of dried sample was subjected to hydrochloric acid (HCl) to remove carbonates, followed by the treatment with hydrogen peroxide (H2O2) to remove organic contents. The samples were washed thoroughly with distilled water and centrifuged at each step. Finally, heavy liquid solution of CdI2 and KI (at specific gravity 2.3) was used and the supernatant was saved. The process was repeated. At least 300–350 phytoliths from each stratum were counted and photographed by Leica DM 2500 microscope (40×).
Phytolith morphotypes were grouped using standard classification (Fredlund and Tieszen, 1994; Mulholland and Rapp, 1992; Twiss, 1992; Twiss et al., 1969). The phytolith types were named according to international code for phytolith nomenclature (Madella et al., 2005). The humidity/aridity index or Iph (%) was calculated to decipher climatic changes, because it is more suitable for tropical environments. This index was first used to study the past environment of West Africa to demarcate humid–arid transitions (Diester-Hass et al., 1973). It is a ratio of chloridoid (xerophytic short) phytoliths to the sum of panicoid (mesophytic long) and chloridoid phytoliths. An Iph value of <30% suggests more humid conditions and a value of >30% suggests relatively drier conditions (Alexandre et al., 1997; Bremond et al., 2005; Fredlund and Tieszen, 1994; Prasad et al., 2014b; Stutz et al., 2010; Twiss, 1992). Another commonly used phytolith index, the tree cover density index (D/P) was calculated to analyse the tree cover density (see Alexandre et al., 1997). It is ratio of woody dicotyledons to the sum of total grass phytoliths. Though Alexandre et al. (1997) used total sum of grass phytoliths to calculate D/P, however, we have used total sum of grass phytoliths excluding elongated types and trichomes, as suggested by Bremond et al. (2005). The D/P index is always found to be lower than 0.5, mostly 0.1 in tall grass savannahes and a very reliable proxy to be used in low elevation tropical areas.
Stable carbon isotope (δ13C), total organic carbon (TOC) content and total nitrogen (TN)
The carbon isotopic composition of organic matter associated with sediments/paleosol (SOM) sample values was measured at Marine Stable Isotope Lab (MASTIL), National Centre for Antarctic and Ocean Research, Goa, India using an Isoprime Stable Isotope Ratio Mass Spectrometer in continuous-flow mode coupled with an Elemental Analyzer (Isoprime, Vario Isotope Cube). The external precisions on δ13C value is ±0.04‰ (1σ standard deviation) obtained by repeatedly running Cellulose (IAEA-CH-3). The external precisions for C% and N% are ±0.48% and ±0.55% (1σ standard deviation) obtained by repeatedly running sulphanilamide as the standard. The δ13C and δ15N values are reported with respect to V-PDB.
Ordination analysis
Ordination analysis was performed to understand the variation in biotic data (phytolith abundance) and to figure out what and how many factors that are needed to account for the observed variance. Ordination analyses such as principal component analysis (PCA) or correspondence analysis (CA) are generally employed on the response variables such as phytolith abundance and depend upon the length of the ecological gradient from which the phytolith data were obtained. In addition to the response variables, if the explanatory variables, such as environmental/climatic parameters (normally abiotic in nature) are also available, then constrained ordination analysis such as redundancy analysis (RDA) or canonical correspondence analysis (CCA) need to be employed. However, in the absence of independently derived abiotic or explanatory variable in this study, we fit (envfit method in the
Results and interpretations
AMS 14C chronology
The age depth model is provided in Figure 3, where the darker shades represent 68% probability range and lighter shades represent 95.4% probability range. The calibrated probability distribution of every date is shown as a solid and black curve. The major lithological boundaries, where changes in the lithological characteristics occur are also shown in Figure 3 in which the open circles represent probabilistic median of the modelled ages.
Phytolith record
All the studied samples yielded diverse phytolith morphotypes (Figure 4a–o). Excluding undetermined morphotypes, a total of fourteen phytolith morphotypes were identified (see Supplemental Table 1). The Grass Silica Short Cells (GSSCs) were dominant followed by other grass and non-grass cells and dicot types. Various identified GSSCs morphotypes were bilobates, cross, rondels, trapezoids and saddles. Other grass phytoliths are elongated and cuneiform bulliform types. Two family-specific phytolith types were identified, belonging to Cyperaceae and Palmae (Arecaceae); Cyperaceae types are characterised by polygonal achene seed phytoliths and papillae phytoliths and Palmae phytoliths are distinguished by spherical shape with spiny ornamentation (e.g. Bremond, 2008; Kondo et al., 1994; Piperno, 2006). The dicot and woody phytoliths were found in smaller amount. Indeterminate leaf/culm multicell panels from crops and a few cut phytoliths were also recovered. Cut phytoliths are epidermal phytoliths and are the product of agricultural activity. Characteristic rice phytoliths were also recovered from some layers. The presence of rice phytoliths along with other crop remains and cut phytoliths indicate anthropogenic activities in or around the area.
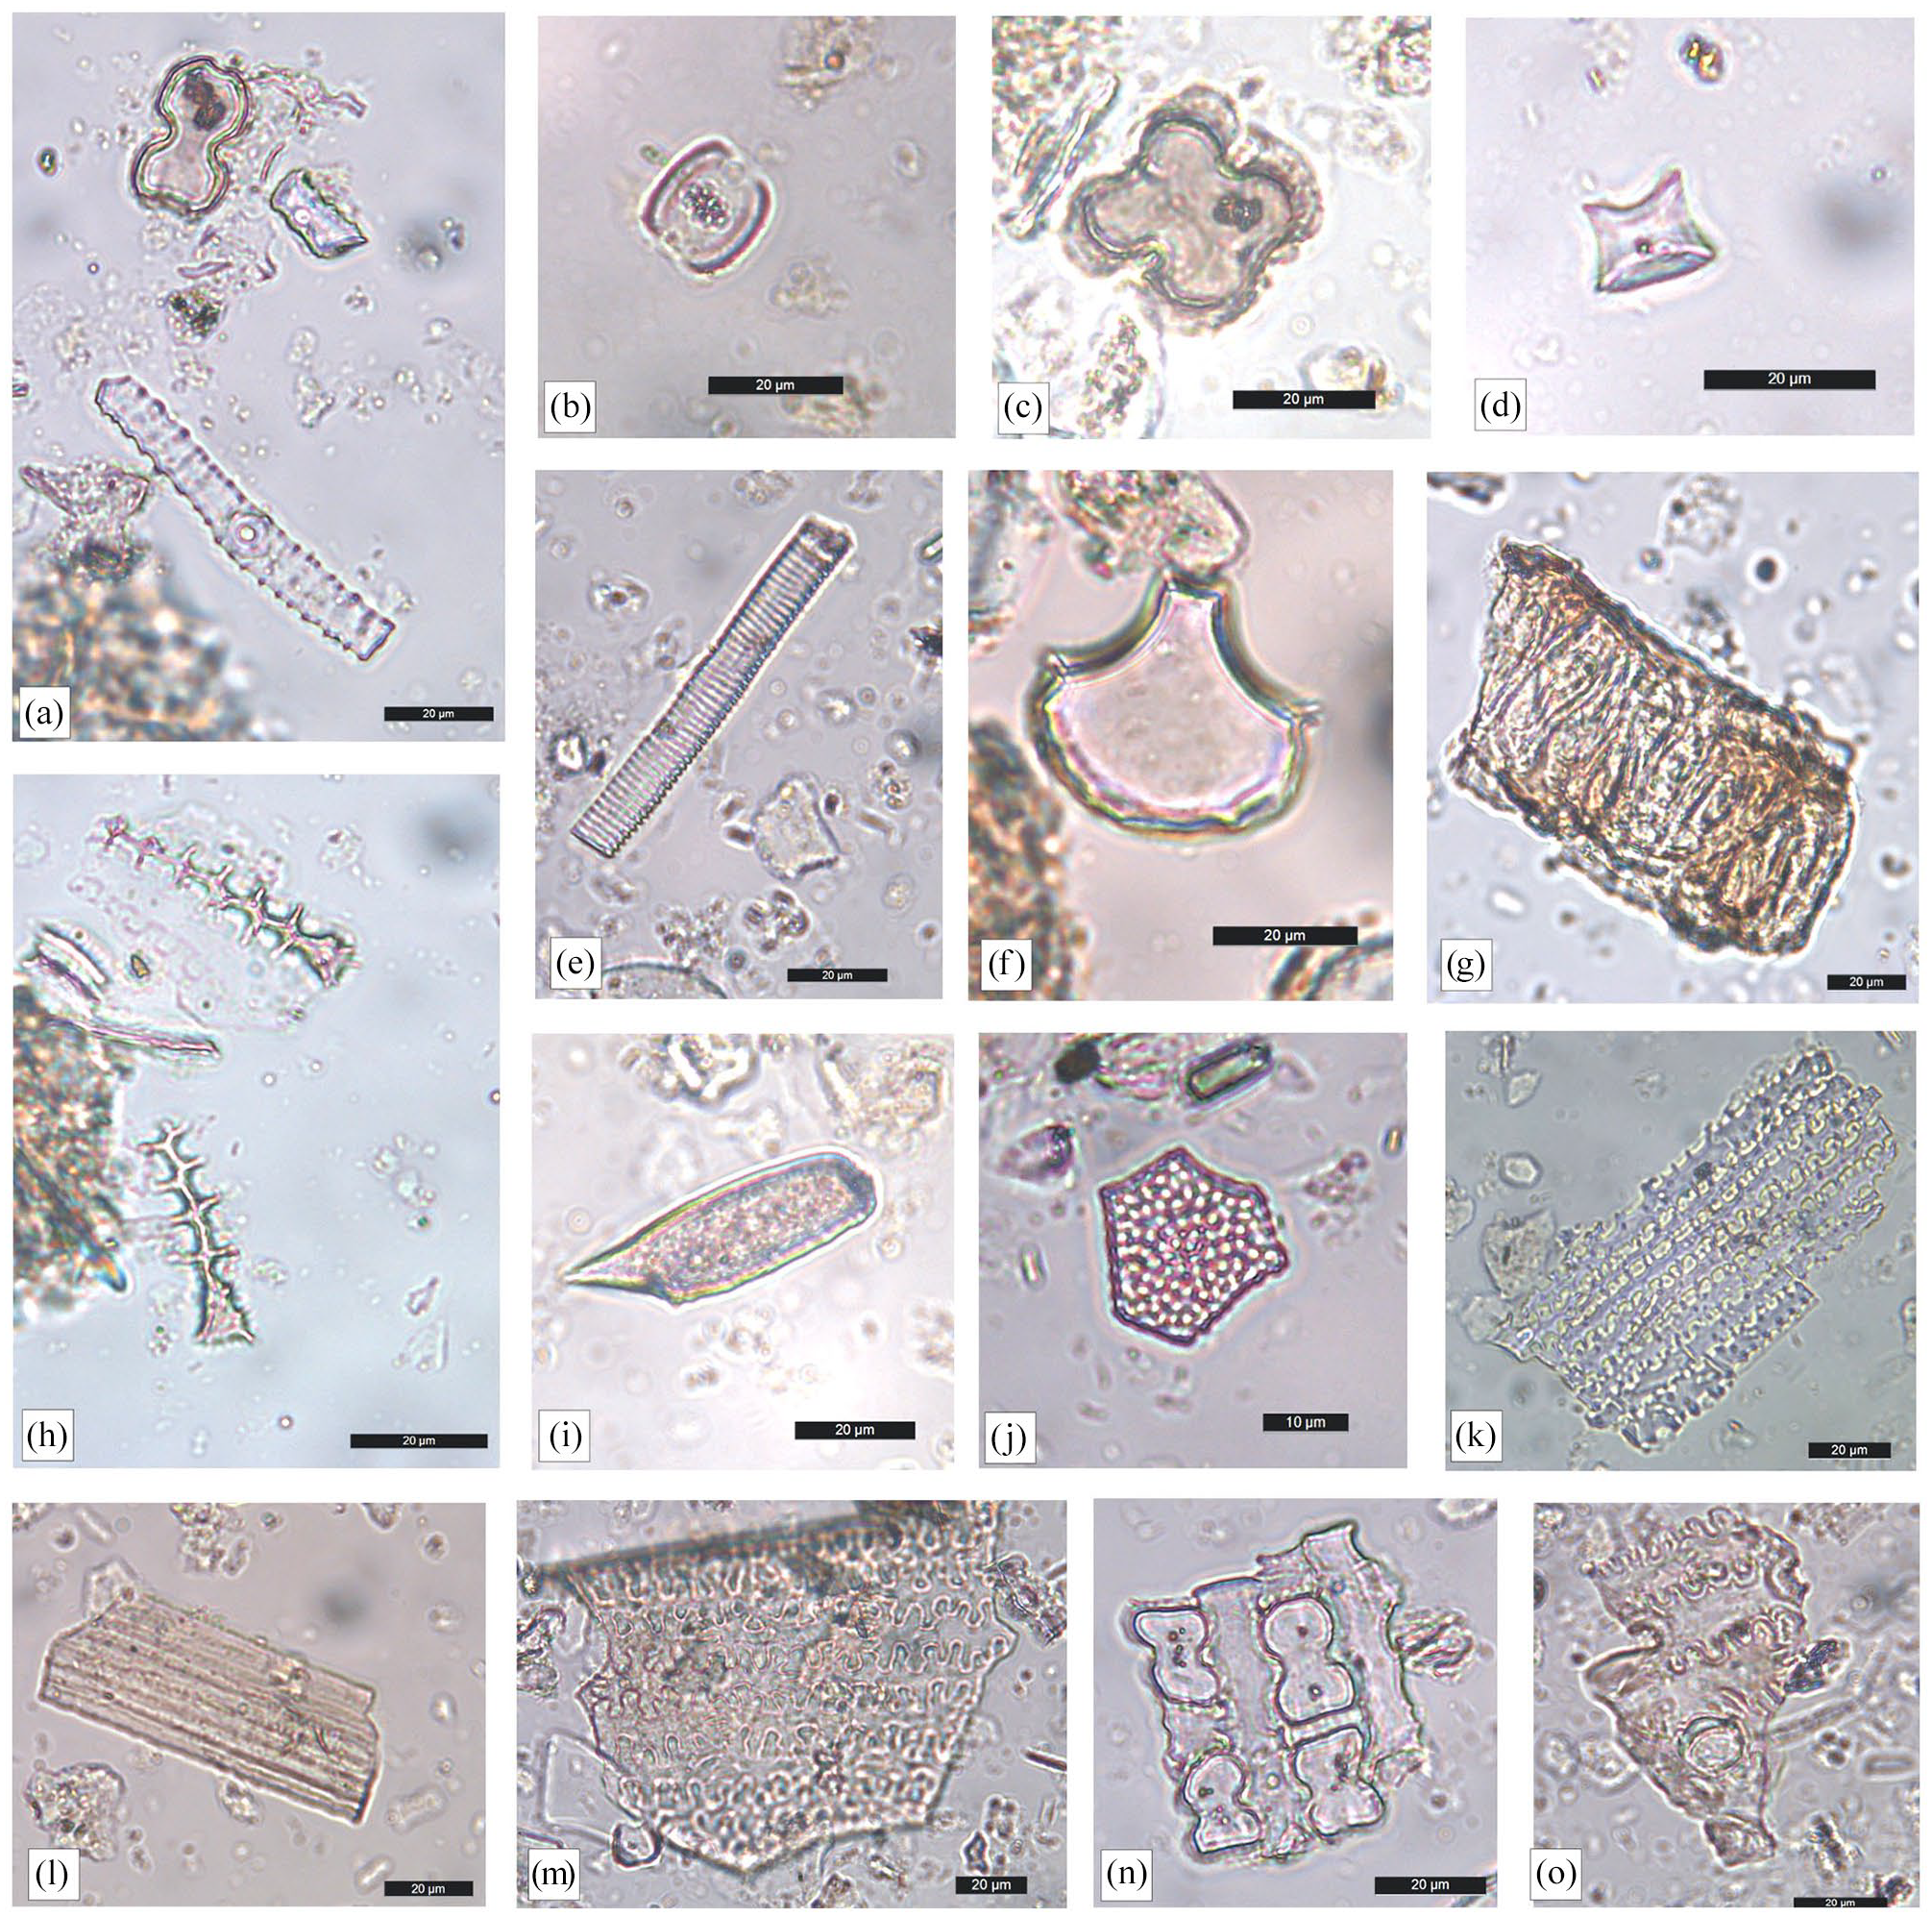
Various phytoliths morphotypes from Hetapatti (a) bilobate with elongate types, (b) saddle, (c) cross, (d) rondel, (e) cylindric sulcate, (f) Oryza-type cuneiform bulliform, (g) Oryza-type multi-cell husk panel, (h) elongate dendritic, (i) acicular, (j) achene of Cyperaceae, (k) Triticum-type elongate dendritic, (l) cut phytolith multi-cell panel, (m) millet type multicell panel, (n) indet multi-cell panel of grass, (o) cf. Hordeum-type multi-cell husk panel.
The combined distribution of phytolith morphotypes indices and isotope data in HPT-II profile is graphically presented in Figure 5. Based on the frequency distribution of these forms, three zones (HPT-Zone I, Zone II and Zone III) are identified, using cluster analysis in Tilia programme (Grimn, 1990). Percentages of various GSSCs morphotypes of Panicoideae, Chloridoide and Pooideae phytoliths are provided in Supplemental Table 2.

Combined assemblage chart for phytolith morphotypes, phytolith indices and isotopic data from Hetapatti.
HPT ZONE-I (7230 cal BP–2550 cal BP)
This zone shows the dominance of Poaceae phytoliths especially GSSCs, with a relative abundance of 75–79%. Amongst GSSCs, percentage of lobate phytoliths range from 33% to 41%, being highest in the profile, cross (4–7%), saddles (10–19%), trapezoids (8–12%) and rondels from 8% to 12%. The cuneiform bulliform phytoliths range from 1% to 6% and the elongate type including dendritic elongate and psilate elongate range from 5% to 14%. The multicell grass panels account for 2–5% including cut phytoliths and crop phytoliths, suggesting agricultural/anthropogenic activity around site. Cyperaceae phytoliths range from 1% to 4%, whereas, Arecaceae phytoliths vary from 1% to 2% and trichomes and dicot phytoliths range from 1% to 3% bearing no taxonomic value. The value of Humidity-Aridity index is lowest in this zone (Iph%), that is, from 19% to 32% and Tree Cover Density Index (D/P) ranges from 0 to 0.3.
HPT ZONE-II (2550 cal BP–2250 cal BP)
Zone II also shows dominance of GSSCs ranging from 75% to 79% with lobate phytoliths (32–36%), cross (3–7%), saddles (19–23%), trapezoids (4–10%) and rondels (8–13%). Cuneiform bulliforms account for 1–7%. The elongates including both dendritic and psilate types account for 7–11% and the multicell grass panels range from 2% to 4%. Trichomes and dicot type phytoliths vary from 2% to 6% and 1–3% respectively. The Cyperaceae phytoliths range from 2% to 4%, however, Arecaceae phytoliths were absent. The Iph% ranges from 33% to 38%, while the D/P was found between 0 and 0.3.
HPT ZONE-III (2250 cal BP–1250 cal BP)
Like preceding zones, the major contribution of phytoliths is from GGSCs ranging from 74% to 88%. Amongst them lobate phytoliths range from 29% to 39%, cross from 3% to 6%, saddle from 24% to 38%, trapezoid from 6% to 8% and rondels from 6% to 10%. Cuneiform bulliform phytoliths range from 2% to 5%, while elongates including dendritic and psilate forms range from 4% to 10%. The percentage of multicell panels ranges from 1% to 4%. Cyperaceae phytoliths range from 1% to 2%. Palm phytoliths were also noticed at one level. Both trichomes and dicot types range from 1% to 2%. The value of Humidity-Aridity index (Iph%) was much higher than preceding zones, ranging from 37% to 44% and D/P range from 0 to 0.2. Interestingly, a highest Iph value (53%) was recorded around ca. 2080 cal BP.
Stable carbon isotope (δ13C) total organic carbon content (TOC) and total nitrogen (TN)
The δ13C values in profile vary from −19.3‰ to −11.0‰ refer Supplemental Table 3, while the TOC in the de-carbonated samples ranges from 0.34% to 1.12%, showing significant enrichment in carbon. The total nitrogen (TN) in the bulk samples shows variation ranging from 0.03% to 0.07%.
HPT ZONE-I (7230 cal BP–2550 cal BP)
In this zone, δ13C values ranges from ‒19.3‰ to ‒14.0‰ and TOC content range from 0.34% to 0.86%. At about 7230 cal BP the observed δ13C value is ‒14.0‰ which shows a gradual lowering trend up to 3030 cal BP with a minimum of ‒19.1‰. Following this, gradual enrichment in 13C is observed up to 2550 cal BP. Additionally, the TOC/TN ratio ranges from 9.3 to 17.5.
HPT ZONE-II (2550 cal BP–2250 cal BP)
The δ13C values range from ‒19.3‰ to ‒13.2‰ and Carbon percentage vary from 0.4% to 0.86%. In this zone, initially δ13C values show an increasing trend followed by decreasing trend. The TOC/TN ratio ranges from 7.25 to 16.1.
HPT ZONE-III (2250 cal BP–1250 cal BP)
The δ13C values vary from to ‒17.4‰ to ‒11.0‰ and Carbon percentage is from 0.52% to 1.12%. At about 2250 cal BP the observed δ13C value is ‒16.8‰ which shows gradual increasing trend and highest δ13C values that is, ‒11.0‰ is observed at about 2080 cal BP. Subsequently, relatively lower and nearly constant δ13C values (–14.3‰) observed up to 1250.
In this zone, the TOC/TN ratio ranges from 10 to 21, and highest TOC/TN ratio observed at around 2000 cal BP.
Ordination analysis
Centralised and scaled data were used in this analysis. The observed short ecological gradient (0.58 × SD; SD stands for standard deviation) suggests principal component analysis (PCA) was a suitable application. The first three axes of the principal components accounted for 58.5% of total correlations in the data set and are 29.7%, 15.1% and 13.7%. The tri-plots (green lines showing the scaled data of IPh) are shown with Hill’s scaling (scaling = –3), show both the sites (samples layers) and phytolith morphotypes (with the first three English letters) as per their layer no and phytolith morphotypes (see Figure 6). Apart from the phytoliths abundance, Iph%, C4 plant analysis and TOC/TN values have been inferred as well. As they are derived from the biotic data, C4 and TOC/TN cannot be considered as independent driving factors that can explain the observed variance in the biotic data. Therefore, we have fitted (envfit method in the vegan package) these factors onto the phytolith data to observe if any pattern arises. From the statistical (permutation) analysis, it is found that Iph (r2: 0.909 and p-value: 0.01%) and C4 (0.37 and 5%) are the two important factors, accounting for the spread in principal components 1 and 2. So, the variation in the phytolith abundance is analysed to be driven by two principal factors – aridity (Iph) and the vegetation (C4) respectively. It is also observed that IPh and C4 are not independent (angle between the blue arrow lines corresponding to IPh and C4 is not 90°) but correlated positively.
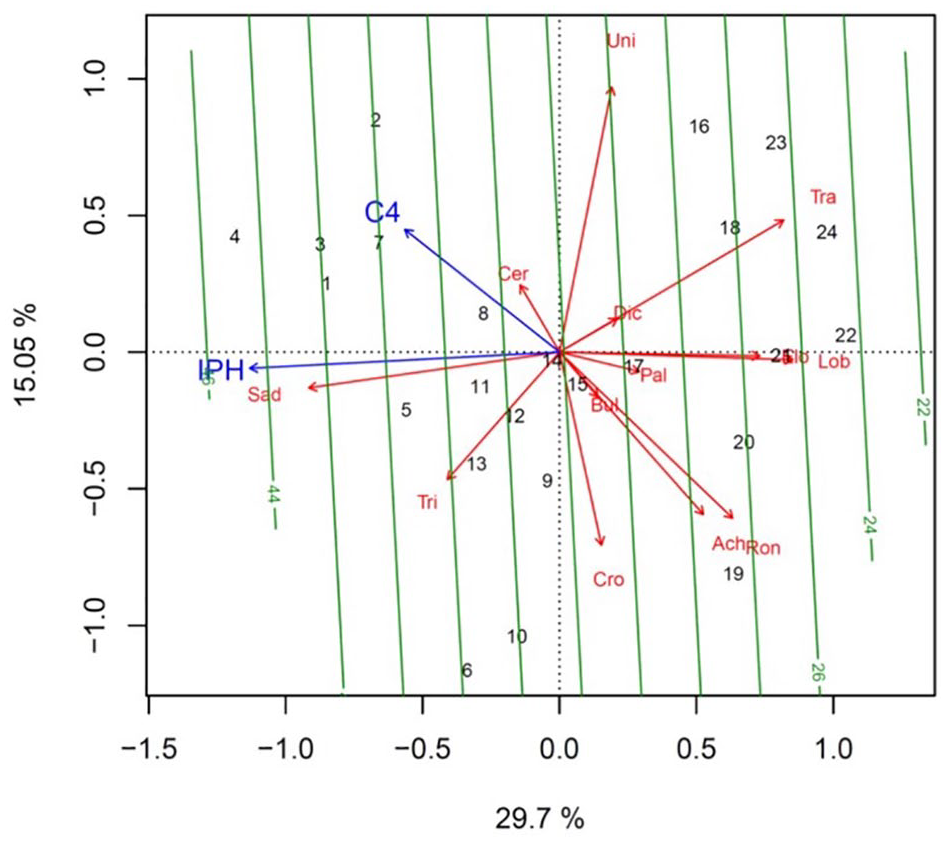
Ordination triplot showing the layer wise phytolith morphotypes and the explanatory variables (Iph and C4). Green lines show layers, red arrows show phytolith morphotypes and blue arrows showing correlation between Humidity-aridity index (Iph) and C4 vegetation.
Discussion
Origin of phytoliths in CGP
Being a part of the Asian grasslands, the Central Ganga Plain is characterised by mixed C3/C4 grassland system (Collatz et al., 1998), dominated by Phragmites-Saccharum-Imperata type grass cover (Singh, 2012; Suttie et al., 2005). Phytoliths in this region are supposed to have derived from a C3/C4 grass cover mixture. The major part of this mixed grassland system is covered by C4 grasses in which major phytolith types are Panicoid (mesic) or Chloridoid (xeric) types (Tripathi et al., 2017), while the proportion of Pooid phytolith (C3 grasses) is low. Saxena et al. (2013) have also recorded the dominance of Panicoid or Chloridoid type phytoliths from this region. Keeping this in mind, the Humidity-Aridity index (Iph%), a very significant phytolith index for tropical areas (e.g. Bremond et al., 2005) was applied. However, in this region, there are chances of bias to calculate Humidity-Aridity index as Pharagmites karka could overestimate aridity by producing C4 type phytoliths rather than C3 type. Therefore, to minimise the bias, we simply excluded plateaued saddles from counting as applied by various researchers (Neumann et al., 2009; Ollendorf et al., 1988; Piperno and Pearsall, 1998; Tripathi et al., 2017).
Currently, no phytolith reference catalogue is available for the CGP, so to infer change in plant community, the ratio of GSSCs (phytolith indices), as a significant and reliable approach (see Alexandre et al., 1999; Fredlund and Tieszen, 1994; Stutz et al., 2010; Twiss, 1992) was used. Based on the ratio of various GSSCs, the phytoliths indices provide a more specific reconstruction of vegetation cover. As grasses respond sharply to climatic fluctuations and have a shorter life span, variation in rainfall, temperature and CO2/O2 concentrations are capable enough to alter the composition of C3 and C4 grassland cover (Ficken et al., 2002). Additionally, these indices are not solely based upon any single phytolith morphotype of specific genra or species but refer to different subfamilies of Poaceae family, which are very helpful to trace the changing grass cover composition (Fredlund and Tieszen, 1994, Ghosh et al., 2014).
Carbon isotopic composition of SOM
Along with the phytolith, stable carbon isotopic composition (δ13C values) of the SOM is another tool which is mainly used in palaeovegetation as well as palaeoclimate reconstructions (Meyers,1994). It is a reliable proxy to discriminate past distribution of C3 and C4 plants. Carbon isotopic fractionation in both C3 and C4 plants are mainly affected by the environmental factors like the temperature and precipitation, availability of soil water, atmospheric CO2 concentration etc. All these factors influence stomatal conductance and alter the δ13C values of plants. C3 plants adapted to humid as well as cold climatic conditions and have a wider range of δ13C values (−20‰ to −34‰, VPDB). On the other hand, C4 plants adapted to humid warmer climatic conditions show a range between −9‰ and −16‰ (Agrawal et al., 2012; Basu et al., 2015; O’Leary, 1981, 1988). SOM is a heterogeneous mixture of organic compounds derived from in-situ productivity and from plants growing in the soil (C3/C4). In addition, decomposition of SOM facilitated by aerobic and anaerobic microbial processes also modifies the bulk isotopic composition of the SOM as the different fractions of organic matter degrade at different rates (Harvey et al., 1995; Hedges et al., 1988; Henrichs and Doyle, 1986; Meyers and Eadie, 1993; Skopintsev, 1981). Such processes change the δ13C values of SOM by several permill. The source of organic matter and associated biogeochemical changes within the sedimentary succession can be assessed by elemental proxies (TOC and TN) as well as stable isotope (δ13C values) signatures.
The positive correlation between TOC and TN indicating that both are derived from similar organically derived sources and suggesting that the elemental as well as isotopic signals are not primarily affected by the degradation processes (e.g. Engel et al., 2010; Herczeg 1988; Jones et al., 2010; Meyers 1997; Sharma et al., 2005). Through the whole profile, TOC/TN varies from 7.1 to 21.2 (mean, 13 ± 3.3) with fluctuations. Relatively lower TOC/TN values (~7) in layers 11–13 suggest higher contribution of organic matter from the bacteria, whereas, the higher TOC/TN values suggest significant contribution of organic matter from the terrestrial plants. Therefore, in the present study, we have used δ13C values to reconstruct the palaeovegetational history of the area under variable climate influence.
The detailed isotopic study of C3 and C4 plants in the different part of the Gangetic plain have been done by Agrawal et al. (2012), Basu et al. (2015, 2019) and Jha et al. (2020). δ13C values of C3 plants in the Gangetic plain range between −32.6‰ and −19.2‰ with an average value of −29.6 ± 1.9‰ and for C4 plants the values range from −16.6‰ to −10.4‰ with an average of −12.7 ± 1.4‰ (Agrawal et al., 2012; Basu et al., 2015, 2019). It has been observed that the average δ13C values of C3 plants obtained by Agrawal et al. (2012) and Basu et al. (2015) are lower than the globally reported dataset. Similar kind of lowering in δ13C value is also observed in the Belan valley (Jha et al., 2020). As the studied site is in central Ganga plain, therefore, in the present, isotopic composition of C3–C4 plants from the Gangetic plain has been used for paleovegetational reconstruction rather than the global average. Overall, the δ13C values obtained in this study fall within a range of the values reported by Agrawal et al. (2012) and Basu et al. (2015) for C3 and C4 plants, suggesting mixed C3–C4 vegetation with higher contribution of C4 vegetation in the studied area. The relative abundance of C3 and C4 plants was calculated using a mass balance equation. Before using mass balance equation, the average δ13C values of both C3 and C4 plants are corrected for the ‘Suess-effect’. The pre-industrial period (1800 AD) was characterised by 1.7‰ higher δ13C value (−6.5‰; Francey et al., 1999) with respect to the present day δ13C value (−8.2‰; Keeling et al., 2005) of atmospheric CO2. Thus, the end-member δ13C values of C3–C4 plants from the Gangetic plain have been corrected to estimate the relative abundance of C3 and C4 plants. After ‘Suess-effect’ correction, the end member δ13C values of C3 and C4 plants are −27.9‰ and −11.0‰, respectively. With the help of these end-member values, the relative abundance of C3 and C4 plants has been calculated and ranges from 0% to 49% and 51% to 100%, respectively, throughout the profile (Supplemental Table 3).
Variation in climate/vegetation and cultural changes
The phytolith and isotopic data from Hetapatti allows reconstruction of spatial-temporal changes in climate and vegetation from the Neolithic to Historic periods supplementing the available records. In the HPT Zone-I (ca.7230 cal BP–2550 cal BP), belonging to Neolithic, Chalcolithic and NBPW phases, the highest presence of Panicoid and Pooid phytoliths along with lowest Chloridoid phytoliths was observed (Figure 5), suggesting a vegetation cover dominated by mesic adapted C4 grasses. The Humidity-Aridity index (Iph%) ranging from 19% to 32% also suggests a prevalence of warm and moist climate during this time, also supported by lower δ13C values. The isotopic composition in this zone ranges between − 14‰ and −19‰ suggesting a C4 dominated vegetation, adapted to humid warmer climatic conditions. Similar inferences of a warm and humid climate were drawn by a palynological and multiproxy study of Karela lake sediments between 13,700 cal BP and 4300 cal BP (Chauhan et al., 2015; Tripathi et al., 2017). On the basis of Cerealia pollen from Karela lake, possible advent of a cereal based economy around ~ 9000 cal BP was also suggested, situated next to multicultural Hulaskhera archaeological site (Chauhan et al., 2015).
In this zone various crop phytoliths were retrieved including characteristic rice phytoliths, cuneiform bulliform and husk phytolith (Figure 4f and g) along with wheat, cut phytolith, millet and barley (Figure 4k–m, o) suggesting an early agriculture in the region. A comparative account of Neolithic tools and material culture from various sites, including Hetapatti, from the region and nearby Vidhyan area is provided in Supplemental Tables 4 and 5. The comparative data with details of tools and material culture may serve as an earliest evidence of agriculture. It is worth mentioning that both husk and leaf phytoliths of rice were identified from Hetapatti, suggesting a routine crop processing (threshing or dehusking) of from rice plant. Rice crop processing was also reported from Mahagara, a Neolithic site in Belan valley (Harvey et al., 2005). The percentage of rice phytoliths along with wheat and barley was found higher in this zone. Presence of Arecaceae (palms) and Cyperaceae (sedge) phytoliths suggest a warm and humid climate at that time as these thrive well in moist habitats. The presence of sedge phytoliths along with rice and panicoid grasses are suggestive of likely presence of these as weeds. This is possible, as archaeobotanical analysis from Hetapatti yielded evidences of early farming culture in the form of charred grains of cultivated plants (see Supplemental Figure 1) including rice, barley, millets, pulses, cotton, oilseeds and weeds, suggesting a developed agricultural practise (Pokharia et al., 2017).
A recent multiproxy study from nearby Baraila taal reports high moisture conditions in CGP between 6700 cal BP and 5600 cal BP due to a strong ISM, correlating it with the Holocene climatic optimum (Misra et al., 2020). Similar inferences were made from Chaudhary Ka Taal and Jalesar Lake, a palynological study also divulges warm and wet climatic conditions from 6400 cal BP to 3150 cal BP and 4780 cal BP to 3200 cal BP (Saxena et al., 2015; Trivedi et al., 2013). Palynological study of lake sediments from adjoining Vindhyan region further suggests the prevalence of moist deciduous vegetation from 4000 cal BP and 2000 cal BP, due to stronger ISM (Farooqui and Sekhar, 2011). Moving eastward to the Lower Ganga Plain, a phase of warm and moist climate was attested from 3600 cal BP to 2350 cal BP (Ghosh et al., 2013). Northwest of Hetapatti, a strong ISM from 4000 cal BP to 200 cal BP has also been reported from Saurashtra (Farooqui et al., 2013). The geomorphic characteristics and enhanced fluvial activity due to ISM fed rivers also point to a stronger ISM from 9000 cal BP to 6000 cal BP (Kale, 2007). The phytolith and isotopic results show well correlation with these studies, suggesting a warm and moist climate from ca. 7230 cal BP to 2550 cal BP due to stronger ISM. Various geomorphological studies in the Ganga Plain and Vindhyas suggest that the climate of the region was warm and wet during Early and Mid-Holocene (Vikrama and Chattopadhyaya, 2002).
In Zone-II, (ca. 2550 cal BP–2250 cal BP) belonging to the NBPW and Kushana period, a relative decrease in Panicoid phytoliths was observed along with relative increase in Chloridoid phytoliths. A trend of an increasing Iph ranging from 33% to 38% was, observed suggesting an initiation of a less humid climate (Figure 5). Crop phytoliths were present as in the preceding zone, while a decrease in rice phytoliths was noted. The absence of Arecaceae (palm) phytoliths and overall low percentage of Cyperaceae phytoliths was observed, excluding the top most layer. Such assemblage shows a variation in vegetation cover likely due to decreased moisture content resulting from reduced precipitation due to a weakening of the ISM in the region. This zone is characterised by gradually increasing δ13C values, suggesting an increasing abundance of C4 plants due to the shift to a less humid climate, except in the middle layer. Such variation may be linked to either plant degeneration due to fungal/bacterial growth or low input of organic matter. Synchronicity in diminished humidity was also observed in the Central Ganga Plain including Basaha Jheel from ca. 2800 cal BP to 2200 cal BP (Chauhan et al., 2004), Chaudhary ka Taal from 3150 cal BP to 1100 cal BP (Saxena et al., 2015), Kikar Taal from 4200 cal BP to 1800 cal BP (Saxena et al., 2017) and Jalesar lake from 3200 cal BP to 1200 cal BP (Trivedi et al., 2013). From Central India, the gradual transformation of moist deciduous forest into mixed dry deciduous sal forests between 4600 cal BP and 1800 cal BP also suggests a less humid climate prevailed due to relatively weaker ISM (Chauhan 2002, 2005). So due to relatively weaker ISM a less humid climate prevailed between ca. 2550 cal BP and 2250 cal BP at Hetapatti.
While in Zone-III (ca. 2250 cal BP–1250 cal BP), represents the Kushana period excepting the uppermost layer belonging to the Gupta (Historic) period. In this zone, the highest percentage of Chloridoid phytoliths was observed and along with lowest percentage of Panicoid phytoliths. A decrease in Pooid and Cypreaceae phytoliths are was observed and high Iph values ranging from 38% to 44% were recorded. Such an assemblage indicates a transformation of warm and humid climate into warm and dry one. The identified crops include rice, wheat, barley and millets. Around 2080 cal BP, the highest Iph value (53%) was recorded which occurred in tandem with highest δ13C value strongly suggests dominance of C4 vegetation (100%) and points to the driest climatic conditions. A trend of warm and dry climate with higher Iph values (44% to 49%) has already been reported from Karela Jheel ~2900 cal BP onwards (Tripathi et al., 2017). Pollen study of the same lake revealed the initiation of dry climatic conditions from ~2000 cal BP onwards due to weakened ISM (Chauhan et al., 2015).
Pollen analysis of Basaha Jheel adjacent to a single culture archaeological mound, existed there from ~3000 to 2000 cal BP revealed a similar situation. The site was abandoned around ca. 2000 cal BP due to increasing salinity and much reduced precipitation. A large tract of alkaline soil with meagre vegetation next to Basaha lake was observed. Apparently, the edaphic condition at Basaha Jheel became brine at ~2000 cal BP and peaked ~1800 cal BP onwards which led to the abandonment of the habitational site (Chauhan et al., 2004). From the Lower Gangetic Plain too, increasing aridity has been reported since ~2350 cal BP (Ghosh et al., 2013).
The RDA analysis also fit well with our inference as in axis 1, the Iph value and C4 vegetation is increasing in upper layers (HPT zone III) closer to saddles morphotypes which are more abundant in this phase, unlike HPT Zone I, where lobate types are more abundant. So, an increase in aridity is positively correlated with C4 vegetation. The changing climate during the Pleistocene–Holocene along with availability of edible food plants was conducive for human settlement and agricultural activities. Such plant species were evolved to adapt with changing climatic conditions (Farooqui and Sekhar, 2011). However, it was not a sudden process, but resulted from a protracted transformation as an outcome of a series of changes in human behaviour, climate and vegetation (Singh, 2005). Human settlements in any region result from climate conditions, the availability of wild plants resources and sedentism. In the Ganga plain, almost all the excavated sites are located near either the banks of rivers or horse-shoe lakes, as water is most important to sustain agriculture, keep livestock and maintain a sedentary lifestyle.
Previous works have ascribed societal collapse of various civilisation due to a deteriorating climate but Hetapatti remained occupied from Neolithic to Historic times (Gupta period) and with no evidence for climate driven abandonment. In each succeeding period increasing technological sophistication in pottery, tools and settlement structures were observed (Singh, 2010). It may be possible with the passage of time that the ancient people learnt how to adapt to changing climatic conditions with better management strategies, selecting crops and the availability of perennial rivers or by extensive trade contacts and interactions with distant communities in India.
Our phytolith data also suggest likely modification in agriculture by ancient settlers to sustain with drying climate ~2250 cal BP onwards as a decrease in rice and barley phytoliths and variation in millet phytoliths was observed. As rice has higher water requirement, this seems consistent with idea of one of the early centres of rice origin. As favourable moisture between 7200 cal BP and 2550 cal BP, covering Neolithic, Chalcolithic and beginning of NBPW, was conducive for rice cultivation and its expansion. Also, diverse type of millet phytoliths were retrieved ~2250 cal BP onwards, these are considered hardy-crops which can withstand a wide rainfall and temperatures, can be grown in low rainfall (Pokharia et al., 2014). The presence of millets from Iron age culture from Raja -Nal-ka-Tila, Ganga plain suggest drought resistant crops cultivation was present (Pokharia et al., 2014). By early third millennium BC, the common west Indian crops during Harrapan times such as wheat, barley, pulses, oil seeds and fibre crops like cotton and hemp, spread in Ganga plain. The spread of Ganga plain rice is also found throughout west India, at the same time bracket (Pokharia et al., 2017; Saraswat and Pokharia, 2002, 2003). The crop pattern from Neolithic to Early Historic Period of Ganga Plain indicates affinity with the Indus-crop package (Pokharia et al., 2017; Saraswat and Pokharia, 2002, 2003), suggesting direct or indirect contacts of the far distant cultures. It is interesting to note that at Hetapatti phytoliths of wheat were present throughout the whole assemblage but charred grains of wheat were absent (Pokharia et al., 2017), may be due to non-charring and preservation of grains, as these are reported from other sites in Ganga plain.
It is worth mentioning that between the middle of the second millennium BC and the beginning of the first millennium BC, most of Chalcolithic sites of western and central India were deserted, most likely due a significant decline in rainfall. The reduced rainfall led agriculture unfeasible and allowed populations to disperse from permanent villages to adept a nomadic way of life. Though these areas were reoccupied later on, around second half of first millennium B.C. by some settled farmers. The continuity of settlements from Chalcolithic to Iron Age and historic period, was seen in only in the Ganga valley (Misra, 2001). As site remained occupied continuously from Neolithic times, it can be inferred that the changes in climate did not affect ancient people to an extreme extant. The technological advancement, like discovery of iron, along with increasing population density and interaction with distant culture might have supported ancient settlers to sustain themselves (Pokharia et al., 2017; Saraswat, 1992).
The D/P or tree cover index was found less than 1 in the Hetapatti profile signalling the area was open and grassland dominated (Alexandre et al., 1997). Various studies reported a dominance of open grassland type vegetation in the area around 12,000 cal BP linked to the Younger Dryas event (Misra et al., 2020; Sharma et al., 2004a; Trivedi et al., 2013), while other palaeo-vegetation records are of the opinion that the Ganga plain was a grassland since last 45,000 cal BP dominated by C4 type vegetation (Singh, 2005).
Late-Holocene abrupt climate changes and regional/global correlation
Our results show an abrupt climate change during the Late-Holocene, around 2080 cal BP, suggesting the weakest ISM. It is evident that in Late-Holocene, a dry climate was driven by weakening of the ISM (Ponton et al., 2012; Prasad and Enzel, 2006; Prasad et al., 2014b; Singh et al., 1974). Human settlement and societal sustainability in Indian subcontinent are primarily dependent on monsoonal rainfall (Clark and Williams, 1986; Gibling et al., 2008; Williams and Clarke, 1984, 1995; Williams and Royce, 1982, 1983; Williams et al., 2006). The Mauryan empire emerged and flourished as the first unified kingdom, stretched over large tract of eastern and northern between ~2272 cal BP and 2135 cal BP, with a relatively stronger ISM. The collapse of this strong empire at around 2135 cal BP is linked to a weak ISM (Kathayat et al., 2017), also coincides with our results. This abrupt climate change is also shown in spelaeothem oxygen isotope (δ18O) records at Sahiya cave and Gupteshwar cave (Figure 7b, c) from North and Peninsular India, due to relatively weak ISM (Kathayat et al., 2017; Yadava and Ramesh, 2005). Another spelaeothem record from Peninsular India also corroborates our interpretation (Sinha et al., 2018). A drying climate was also evinced in Nonia taal (Figure 7e) Central India in the expansion of C4 plants between ~3,300 cal BP and 2,000 cal BP (Kumar et al., 2019). Records from the Arabian Sea, based on (δ18O) of planktonic foraminifera (refer Figure 7d, f) show the weakest monsoon from ~2500 cal BP to 1500 cal BP in the Late-Holocene (Gupta et al., 2003; Tiwari et al., 2006). From the Lower Gangetic Plains, similar increasing aridity was observed since ~2350 cal BP (Ghosh et al. 2013).

Comparison of Hetapatti results with other regional palaeoclimatic records (a) δ13C and humidity-aridity index values from Hetapatti, (b) δ18O records at Sahiya cave (Kathayat et al., 2017), (c) δ18O values from Gupteshwer cave (Yadava and Ramesh, 2005), (d) δ18O values of planktonic foraminifera, namely, Gs. sacculifer and Gs. ruber from Arabian sea (Tewari et al., 2006), (e) δ13C values from Nonia Taal (Kumar et al., 2019), (f) δ18O values of planktonic foraminifera G. bulloids (Gupta et al., 2003), (g) pollen record from Chandra Taal (Rawat et al., 2015), (h) δ18O values from Dharamjali cave Kumaun Himalaya (Kotlia et al., 2018). The shaded area (in Pink) shows a decreasing ISM trend while (in purple) shows an increasing trend of ISM and dotted line depicts driest phase at ~2080 cal BP in our Hetapatti record.
It is interesting to note that our results are consistent with regional peninsular records but show anti-correlation with Himalayan records (see Figure 7g and h). By using multi-proxy high resolution dataset, a number of researchers have argued that Mid-Late Holocene climate exhibits anti-correlation with that of peninsular India as the Himalaya receives both the ISM and Westerlies (Indian Winter Monsoon, Dimri et al., 2016) as two active precipitation sources (Dimri et al., 2016; Kotlia et al., 2012, 2015, 2018; Sanwal et al., 2013). Spelaeothem record from Dharamjali cave in Kumaun Himalaya (Figure 7h) shows an increased precipitation intensity between ~2100 cal BP and 2000 cal BP (Kotlia et al., 2018). The palynological study of a Himalayan peat bog suggests a cool and moist climate between ~2032 cal BP and 1158 cal BP (Rawat et al., 2015), where prolific increase of coniferous taxa and relative decline of broad leaved and meadow taxa was observed (refer Figure 7g). Similar trend was observed from Gharana wetland in northwest Himalaya revealing expansion of broad-leaved plants and a simultaneous reduction in coniferous elements from ~2776 cal BP to 1336 cal BP (Qamar, 2019) and results from Bhujbasa, Gangotri (Kar et al., 2002) during ~2500 cal BP and 1700 cal BP are suggestive of an increase in monsoon precipitation, unlike HPT Zone-III.
Comparison of the Hetapatti (Figure 8a) record with a few high-resolution global climatic records (Figure 8) find a synchronicity of increasing dryness after ~2250 cal BP. The spelaeothem record from Dongge cave (Figure 8b) shows an abrupt positive shift in δ18Ο at ~3550 cal BP followed by at a period of ~1500 years, which affected El Nino-Southern Oscillation (ENSO) variability (Dykoski et al., 2005). The increased dryness during this period is driven by low precipitation due to strong ENSO. The high-resolution records of δDice from Vostok and Greenland ice core (Figure 8c and d) are in good agreement with our ~2080 cal BP dry event at Hetapatti (North GRIP Members, 2004; Petit et al., 1999). Similarly, carbon and hydrogen isotopic compositions of n-alkanoic acids from Lake Karakuli, Central Asia (Figure 8e) also reported warm and dry episodes from ~2500 cal BP to 1900 cal BP and ~1500 cal BP to 600 cal BP (Aichner et al., 2015). Since this warm and dry event is also recorded at various places across the world, we hypothesise this was not just a local phenomenon. Our data also corresponds with the Roman Warm Period (RWP). The time line of RWP is generally considered 2500 cal BP–1600 cal BP, although it varies in different regions (Hass, 1996).
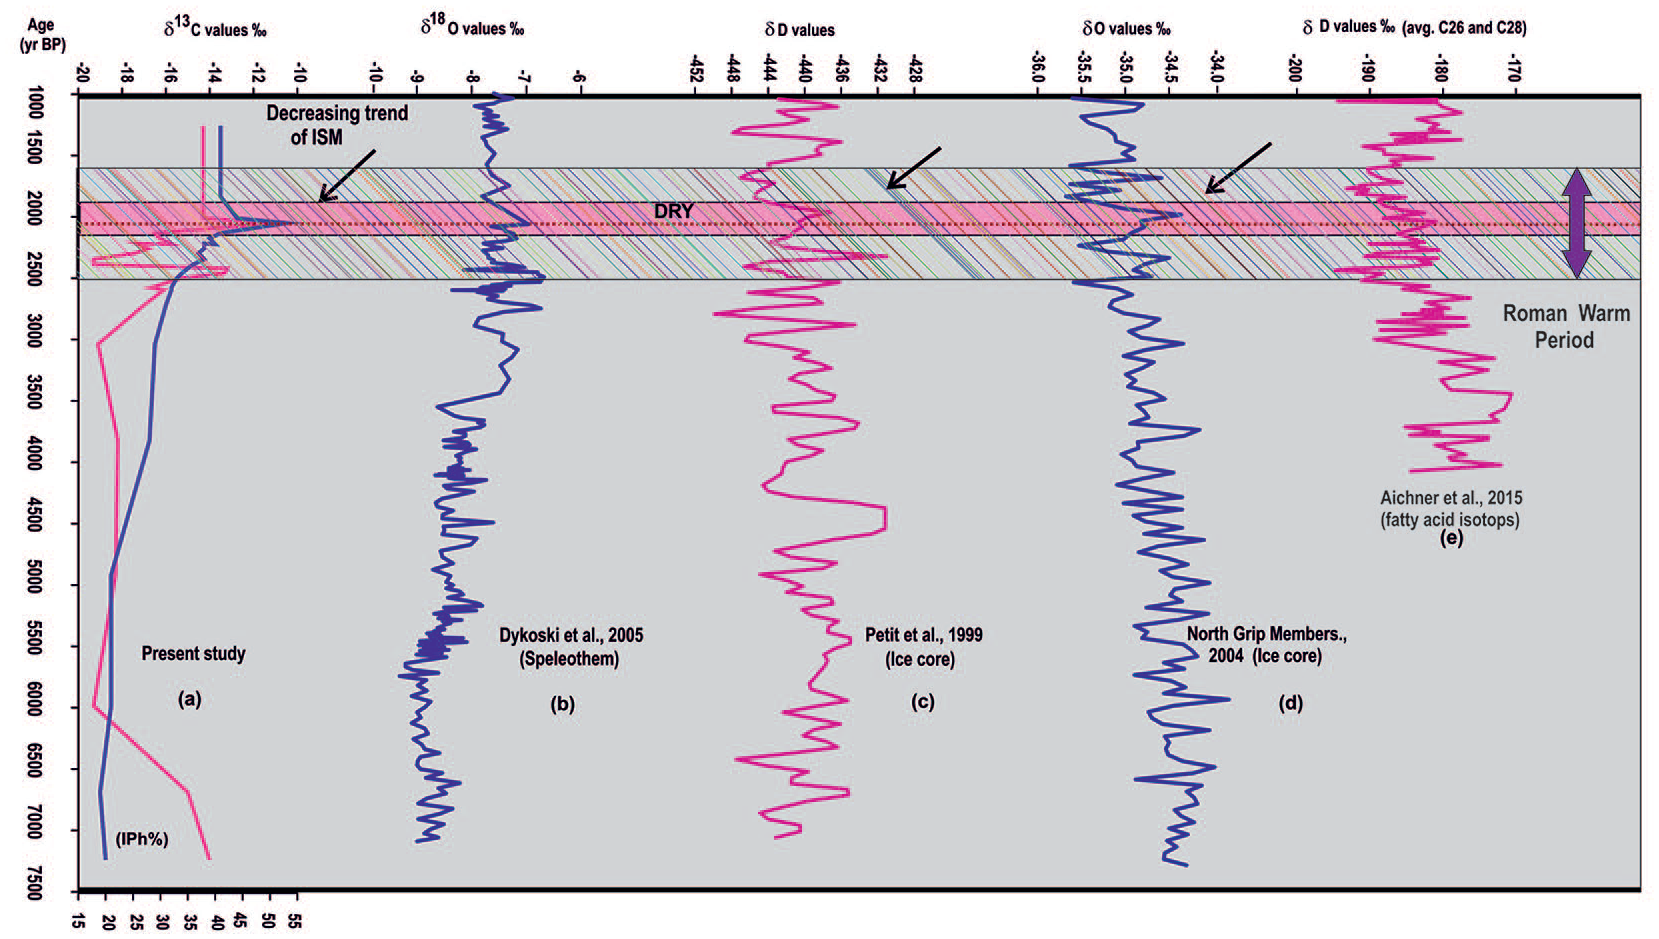
Comparison of Hetapatti results with global palaeoclimatic records (a) d13C and humidity-aridity index values from Hetapatti, (b) δ18O records from Dongge cave (Dykoski et al., 2005), (c) dDice from Vostok (Petit et al., 1999), (d) dDice from Greeland ice core (North GRIP Members, 2004), (e) carbon and hydrogen isotopic compositions of n-alkanoic acids from Lake Karakuli (Aichner et al., 2015). The shaded area (in pink) shows a dry period due to decreasing ISM trend and the shaded area (in hatching lines) corresponding to Roman Warm Period (RWP).
Conclusion
A parallel study of both phytoliths and stable carbon isotopes from the same trench allows us to provide a reliable palaeoclimatic reconstruction at the Hetapatti archaeological site. The inputs from both primary proxies throughout the profile, reflect changes in climate and vegetation. The studied area witnessed warm and humid climate from ca.7230 cal BP to 2550 cal BP, as evidenced by the low Iph values and dominant mesic adapted grass cover that we relate to a strong ISM and at ca. 2550 cal BP, the climate became less humid due to relative weakening of ISM. This caused slight change in vegetation cover as evidenced by higher Iph value. At ca. 2250 cal BP due to reduced ISM the earlier mesic vegetation cover was replaced by xeric one, as evident in very high Iph and δ13C values. An abrupt climate change took place at ca. 2080 cal BP, showing a spike in Iph value (53%) and δ13C value. During ca. 2250 cal BP to 1250 cal BP, the climate remained warm and dry, coeval with RWP.
The climate variability did not collapse any of the archaeological cultures, as artefacts from each culture show an improvement and development on the preceding culture. We infer that the climatic fluctuations at Hetapatti were driven by the fluctuations in the ISM. The cultural evolution and change in subsistence were probably resulted from interactions with other communities, allowing the adaptation of better management strategies and selection of crops etc.
Supplemental Material
sj-pdf-1-hol-10.1177_0959683620972770 – Supplemental material for New evidence of mid- to late- Holocene vegetation and climate change from a Neolithic settlement in western fringe of Central Ganga Plain: Implications for Neolithic to Historic phases
Supplemental material, sj-pdf-1-hol-10.1177_0959683620972770 for New evidence of mid- to late- Holocene vegetation and climate change from a Neolithic settlement in western fringe of Central Ganga Plain: Implications for Neolithic to Historic phases by Deepika Tripathi, Bahadur Singh Kotlia, Manish Tiwari, Anil K Pokharia, Shailesh Agrawal, Pankaj Kumar, Tengwen Long, Morthekai Paulramasamy, Biswajeet Thakur, Jagannath Pal, Kamalesh Singh Mahar and Devendra Kumar Chauhan in The Holocene
Footnotes
Acknowledgements
We thank Director, Birbal Sahni Institute of Palaeosciences, Lucknow for giving permission and facilities to accomplish this work. Authors are thankful to IUAC for extending the graphitization laboratory and AMS measurement facility for 14C established under the Ministry of Earth Science (MoES) funded projects with reference number MoES/16/07/11(i)-RDEAS. The authors are grateful to two anonymous reviewers and Professor Francis Mayle for insightful and supportive suggestions. We also thank Dr. Michael Spate (University of Sydney, Australia) for his help in finalizing the revised version. This is NCPOR contribution no. J- 86/2020-21.
Authors’ Note
DT, AKP, BSK and SA designed the research; DT, AKP, SA and BSK wrote the manuscript; DT and AKP undertook the field work and collected material during the archaeological excavation; JNP excavated the site and provided archaeological inputs; DT, MT and SA carried out the analysis, identification and interpretation of data; PK provided AMS dates; TL did the age depth modelling; MP did the statistical analysis; DKC assisted in interpretation; BT provided software assistance; KSM provided technical support. All authors discussed the results and provided input on the manuscript.
Funding
The author(s) received no financial support for the research, authorship, and/or publication of this article.
Supplemental material
Supplemental material for this article is available online.
References
Supplementary Material
Please find the following supplemental material available below.
For Open Access articles published under a Creative Commons License, all supplemental material carries the same license as the article it is associated with.
For non-Open Access articles published, all supplemental material carries a non-exclusive license, and permission requests for re-use of supplemental material or any part of supplemental material shall be sent directly to the copyright owner as specified in the copyright notice associated with the article.