
Abstract
High-resolution proxy-based paleoenvironmental records derived from peatlands provide important insights into climate changes over centennial to millennial timescales. In this study, we present a composite climatic index (CCI) for the Hani peatland from northeastern China, based on an innovative combination of pollen-spore, phytolith, and grain size data. We use the CCI to reconstruct variations of the East Asian summer monsoon (EASM) intensity during the Holocene. This is accomplished with complete ensemble empirical mode decomposition (CEEMD), REDFIT, and cross-wavelet coherency analysis to reveal the periodicities (frequencies) of the multi-proxy derived CCI sequences and to assess potential external forcing of the EASM. The results showed that periodicities of ca. 300–350, 475, 600, 1075, and 1875 years were present in the Hani CCI sequence. Those periodicities are consistent with previously published periodicities in East Asia, indicating they are a product of external climate controls over an extensive region, rather than random variations caused by peatland-specific factors. Cross-wavelet coherency analysis between the decomposed CCI components and past solar activity reconstructions suggests that variations of solar irradiation are most likely responsible for the cyclic characteristics at 500-year frequency. We propose a conceptual model to interpret how the sun regulates the monsoon climate via coupling with oceanic and atmospheric circulations. It seems that slight solar irradiation changes can be amplified by coupling with ENSO events, which result in a significant impact on the regional climate in the East Asian monsoon area.
Introduction
Recognition of the characteristics and forcing of natural climate cycles on different timescales is critical for understanding the magnitude and rapidity of climate change. The cyclic nature of the Earth’s climate during the last glacial period has been suggested to be paced by a ~1500-year periodicity (Dansgaard et al., 1993), but the origin of this pacing during the Holocene remains controversial. Bond et al. (1997, 2001) attributed the Holocene millennial climate cycle to solar irradiation. However, owing to the lack of a corresponding ~1500-year cycle in past solar activity reconstructions, the mechanism of Holocene millennial variability has stimulated a substantial debate (e.g. Braun et al., 2005; Darby et al., 2012; Debret et al., 2007; Obrochta et al., 2012; Ojala et al., 2015; Wanner and Bütikofer, 2008). Over the last decade, the use of spectrum analysis on proxy-based paleoclimate reconstructions has produced increasing evidence to confirm the existence of Holocene centennial- to millennial climate cycles (e.g. Obrochta et al., 2012; Ojala et al., 2015; Soon et al., 2014; Stebich et al., 2015; Swindles et al., 2012; Xu et al., 2014, 2019, 2020). However, until now, an agreed theory for these Holocene periodic oscillations and their potential forcing is still lacking. Furthermore, most of the existing records have focused largely on marine sediments (e.g. Bianchi and McCave, 1999; Bond et al., 2001), ice-cores (e.g. Stuiver et al., 1995) and stalagmites (e.g. Jo et al., 2017; Wang et al., 2005a) with uneven spatial distributions; few of them were from lakes or peatlands, which are directly coupled to the atmosphere and can provide continuous records to evaluate the potential external forcing for continental climate changes (Swindles et al., 2012).
The East Asian monsoon (EAM) is an important component of the global climate system (Wang et al., 2017). Monsoon rainfall in eastern Asia benefits nearly one-quarter of the world’s population. Past East Asian monsoon variations have been investigated at different time scales using loess (e.g. Beck et al., 2018), stalagmites (e.g. Wang et al., 2005a) and lacustrine (e.g. Chen et al., 2015) sediments, which have significantly improved understanding of regional climate changes in the monsoon area. The forcing and regulation mechanism of the East Asian Summer Monsoon (EASM) variation, however, is still controversial and has been attributed variously to orbital insolation changes (Wang et al., 2001, 2005a), low-latitude inter-hemispheric insolation gradients (Beck et al., 2018) and global ice volume variations (Stevens et al., 2018).
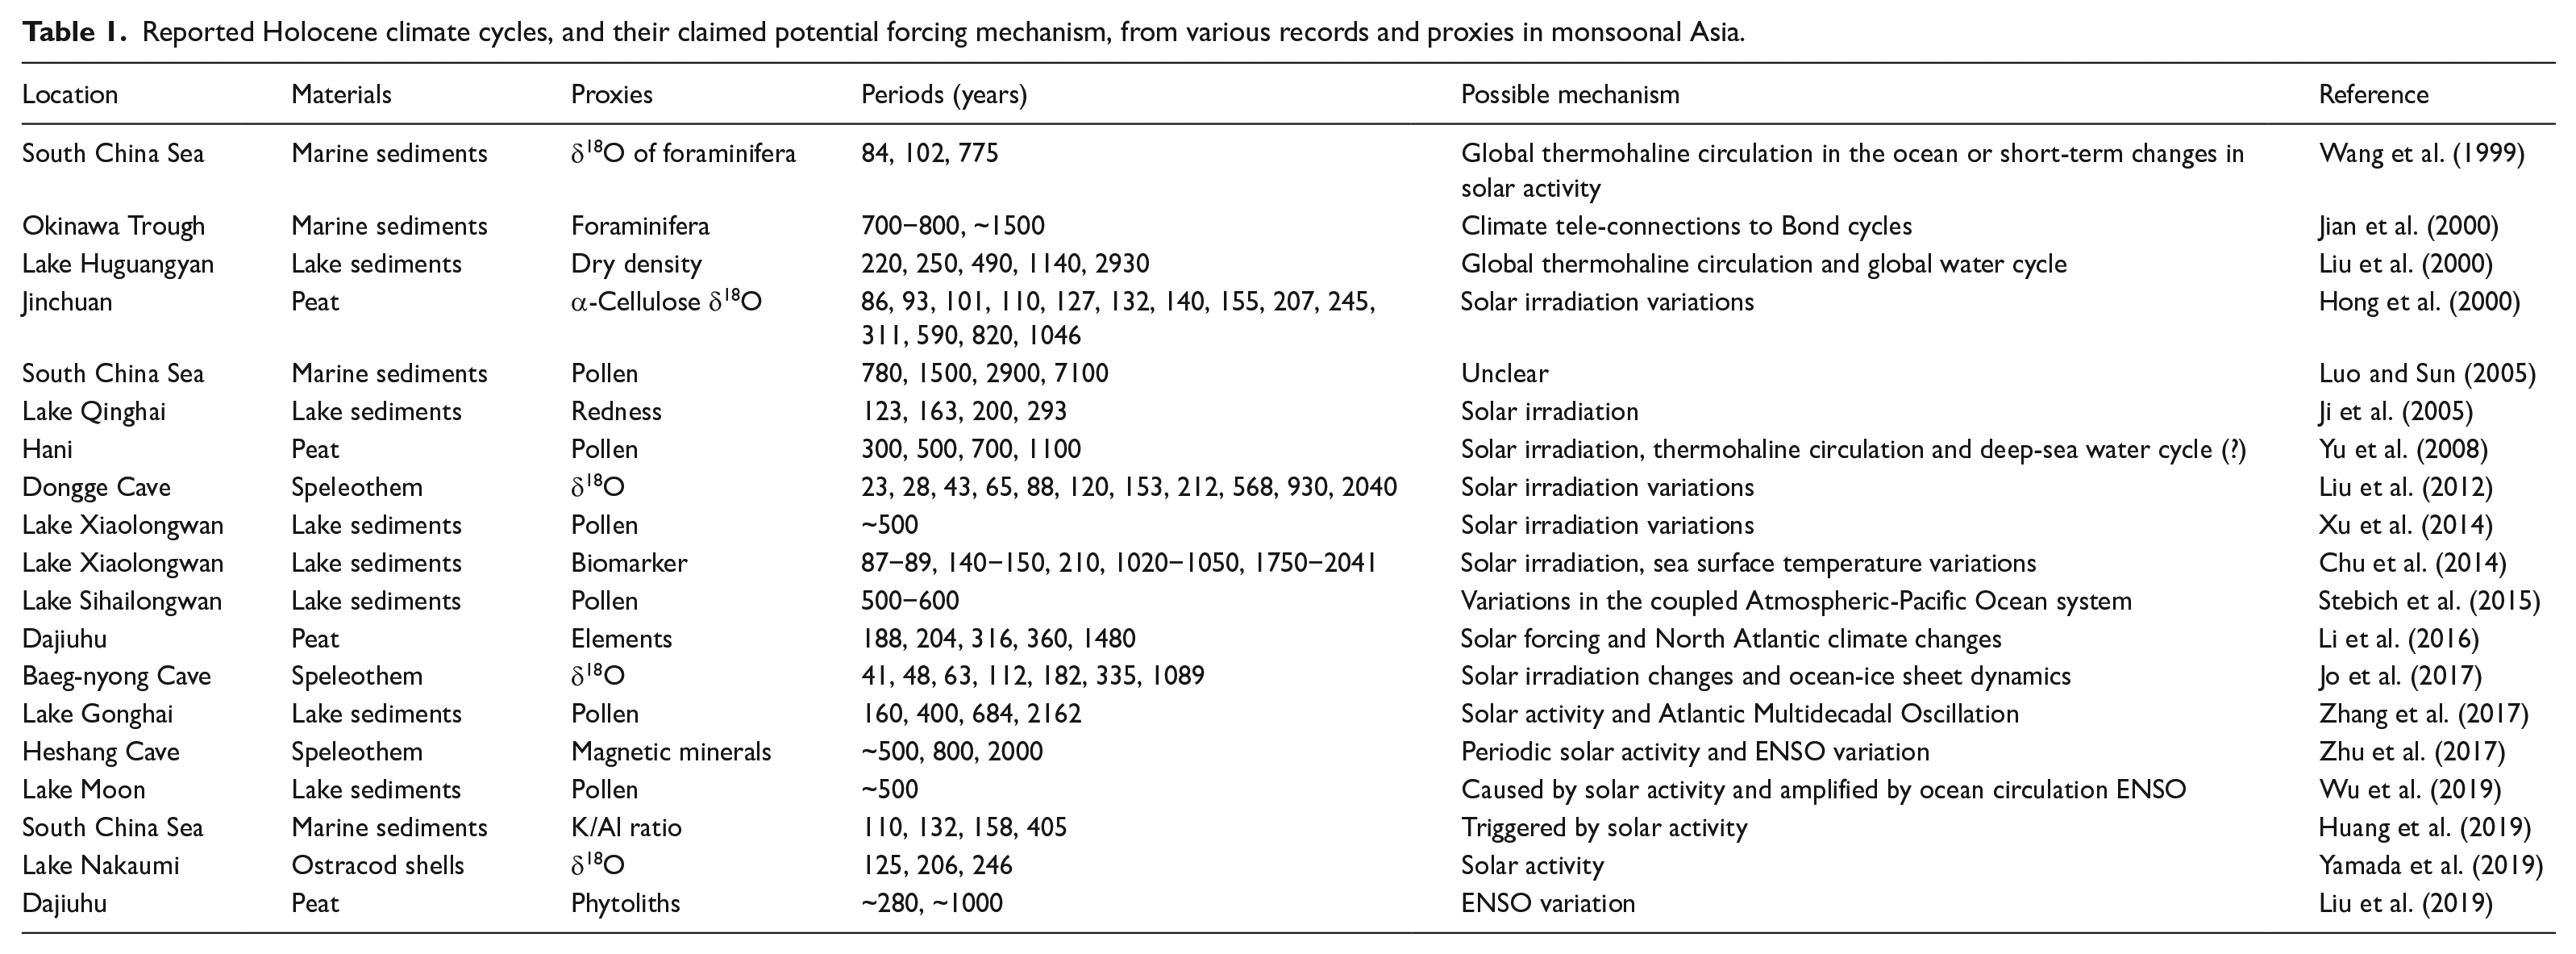
Table 1 lists papers published since 1999 reporting cyclic characters of East Asian monsoon climates reconstructed from various archives using a range of proxies. It demonstrates the existence of periodic cycles in the paleoclimate reconstructions of East Asia; solar insolation variations and global deep-water flow dynamics are the most reported pacemakers thought responsible for the periodic climate oscillations (Table 1). According to frequency statistics on currently reported periodicities in East Asia, as shown in Figure 1, the 200-year and 350-year cycle, as well as 500-year cycle, are the most commonly reported in the listed papers (Table 1). Although evidence for millennial- and centennial-scale climate cycles across East Asia is increasing, one single, agreed theory explaining the forcing factor and possible mechanism has not yet emerged (e.g. Beck et al., 2018; Jo et al., 2017; Lu et al., 2019; Stebich et al., 2015; Stevens et al., 2018; Wang et al., 2001, 2005a, 2005b, 2017; Xu et al., 2014, 2019, 2020). Therefore, additional terrestrial records from the EAM region are still required to establish a credible hypothesis regarding the cyclic characteristics of EASM activity. Meanwhile, the publication of high-resolution Holocene paleoclimate reconstructions during recent decades requires a synthetic review (even recalculation) of current trends in Holocene climate cycles and their potential forcing mechanisms for the EAM region.
Reported Holocene climate cycles, and their claimed potential forcing mechanism, from various records and proxies in monsoonal Asia.
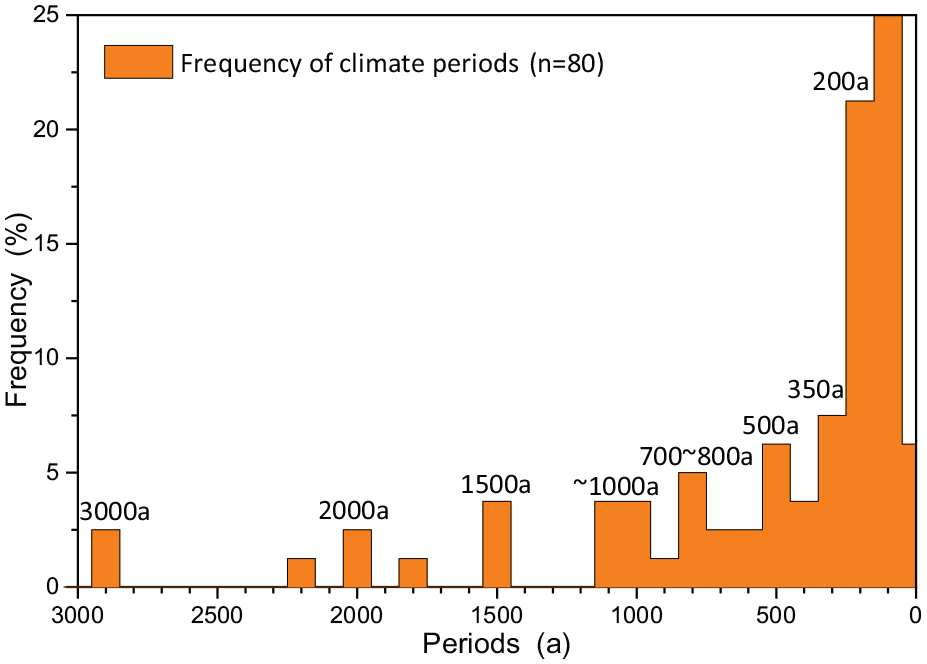
Frequency counts (n = 80) on published Holocene millennial and centennial climate cycles in East Asia.
Peatlands provide an important archive of Holocene environmental change. The moist environments in which peat forms encourage the growth of vascular plants and retard decomposition of their remains to produce organic-rich material that can be used for high-resolution paleoenvironmental reconstructions (Barber and Langdon, 2007; Chambers and Charman, 2004; Dise, 2009). Benefiting from a wide range of climate proxies and accurate radiocarbon dating, peatlands hold great potential for research into cyclical characters of Holocene climate (Chambers and Charman, 2004; Chambers et al., 2012). Northeastern China is one of the most important peat distribution regions of the world (Chai, 1990). Up to now, using a wide range of proxies, several Holocene paleoclimate reconstructions have been carried out on peat deposits in the Changbai Mountains, northeastern China (see Li et al., 2017; Zhang et al., 2019 and references therein). These pioneering studies confirm that northeastern China, located near the northern margin of the EAM, is sensitive to monsoonal climate variations. However, few of them have focused on the cyclical characteristics of Holocene climate and on the physical mechanism that modulated the intensity of the EASM (Stebich et al., 2015; Wu et al., 2019; Xu et al., 2014, 2019, 2020). Accompanied with an improved radiocarbon-dated chronology, here we present a new pollen-spore, phytolith, and grain size dataset from Hani peatland in northeastern China. Using principal component analysis (PCA), a composite climatic index based on pollen, phytolith, and grain size data, was defined and calculated to reconstruct Holocene paleoclimatic changes recorded in peats. We further conducted spectrum and wavelet analysis on the composite climate indices to reveal the potential forcing and the mechanism that regulates EASM climate change in East Asia.
Regional setting
Hani (HN) is a minerotrophic and ombrotrophic peatland, located in the Longgang Volcanic Field, northeastern China, which is one of the most active volcanic areas in China (Liu, 1988). The intense Cenozoic volcanic activities in this region provided a geological basis for the development of peatlands. The Hani peatland was formed in a paleo-lake basin that was dammed by volcanic ejecta in the Late Pleistocene (Qiao, 1993).
The modern climate of the study area is controlled by the EAM, which shows strong seasonal variability (Chao and Chen, 2001). In the winter, cold and dry north-westerly winds initiated from the interior of the Eurasian landmass blow strongly toward north China, while the summers are dominated by warm and humid air, transported by southerly winds from the Indian Ocean and the Pacific (Figure 2a and c). The main period of regional rainfall is concentrated from June to September, which accounts for more than 70% of the annual precipitation. The mean annual temperature of the Changbai Mountains ranges from −7.3°C to 4.8°C, while the average annual rainfall ranges from 700 to 1400 mm (Wang, 1989). The landform type in the Changbai Mountains is diverse and the dominant soil in the study region is dark brown forest soil, but with meadow soils in valleys and albic soil on high tableland. The natural vegetation in this area is temperate conifer–broadleaf mixed-forest.
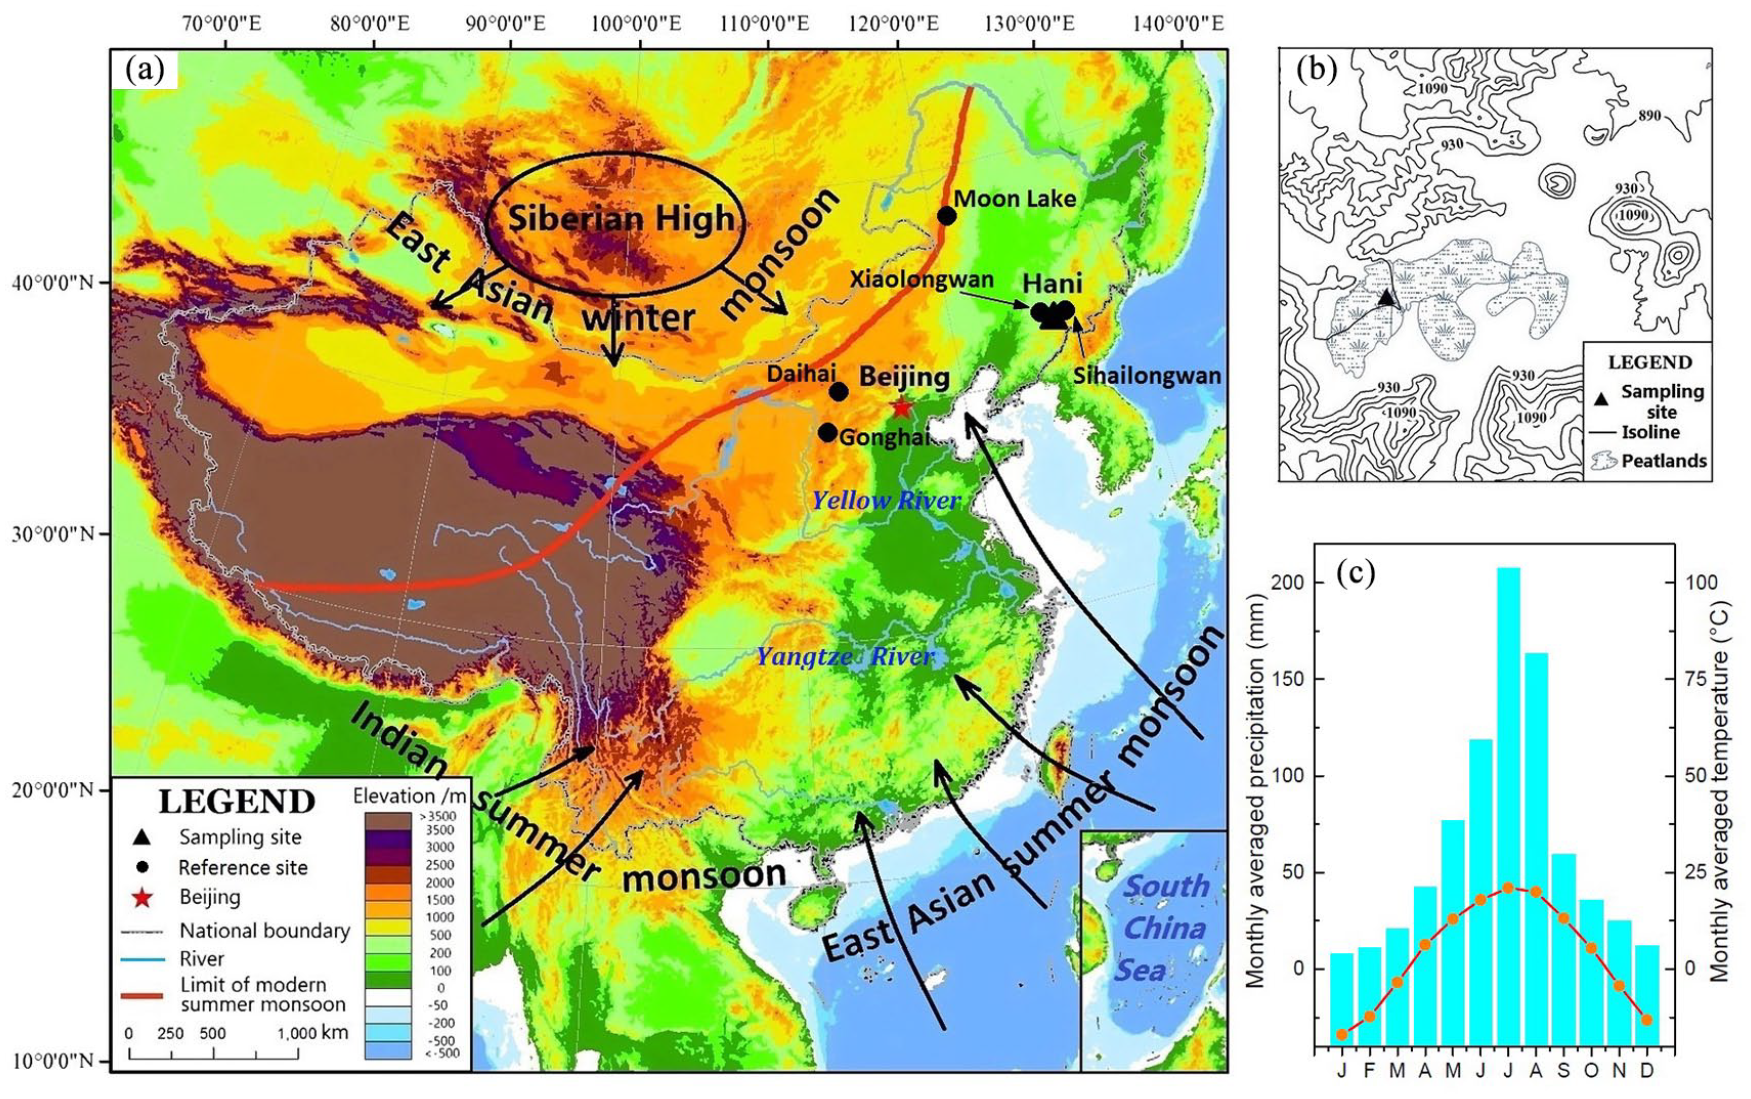
Investigation area and the locations of sampling and comparison sites in East Asia. (a) East Asian monsoon area and surroundings with ETOPO1 1 arc-minute global relief model (Amante and Eakins, 2009) and main regional atmospheric circulations (black arrows). (b) Hani peatlands and geographical setting. (c) Climatic pattern for the sampling area.
Naturally, the conifer–broadleaf mixed-forest is dominated by a variety of arboreal species, including Pinus koraiensis, Picea jezoensis, P. koraiensis, Abies nephrolepis, Larix olgensis, Tilia amurensis, T. mandshurica, Betula platyphylla, Quercus mongolica, Acer pictum, Juglans mandshurica, Populus davidiana, Ulmus pumila, Fraxinus mandshurica and Phellodendron amurense (Wu, 1980). Since the 1970s, the regional vegetation surrounding the Hani peatlands has undergone considerable modification by anthropogenic woodcutting, resulting in extensive secondary succession of regional vegetation. The local vegetation of the Hani peatland is covered by shrubs and wetland species (Schröder et al., 2007). The shrub layer is mainly composed of Larix olgensis, Betula fruticosa, Vaccinium uliginosum, Ledum palustre, and Chamaedaphne calyculata. The field layer comprises Carex spp., Sphagnum magellanicum, S. fuscum, Equisetum hyemale, Juncus effusus, Menyanthes trifoliata, Comarum palustre, Sanguisorba tenuifolia, Phragmites australis, etc.
Materials and methods
Peat recovery and data sources
A 350 cm peat core from Hani (42°13′31.1″N, 126°30′14.7″E, 890 m a.s.l.) peatland was sampled in the summer of 2009 (Figure 2b), using an Eijkelkamp peat sampler. The lithologic stratification and radiocarbon dating layers are shown in Figure S1. The core was sub-sampled at 1-cm intervals, resulting in 350 sub-samples, and then analyzed every 2-cm intervals. To overcome the site-specific effects of single core investigations, in addition to our dataset, several quantitatively reconstructed paleoclimate and paleovegetation sequences were used and analyzed for periodicities. Those reference sites were selected based on the following criteria: (1) sites that are located in the same or adjacent bioclimatic region; (2) with a minimum of eight dating controls for the Holocene; (3) with high sampling resolution better than 100-year per sample; and (4) a continuous record covering most of the Holocene without obvious sedimentary hiatus. Those sequences were Holocene Pinus and Quercus pollen percentages from Lake Moon (Wu et al., 2019), pollen-derived Holocene mean July temperature (Mtwa) and mean annual precipitation (Pann) sequences from Lake Sihailongwan (Stebich et al., 2015), Holocene Quercus pollen percentages from Lake Xiaolongwan (Xu et al., 2019), pollen-derived mean annual precipitation (Pann) from Lake Daihai (Ding et al., 2018; Xiao et al., 2004) and Lake Gonghai (Ding et al., 2018; Xu et al., 2017). The locations of those sites are displayed in Figure 2. Meanwhile, the IntCal13 Δ14C dataset, the deviation of the atmospheric 14C∕12C ratio from a standard value (Liu et al., 2012; Reimer et al., 2013; Steinhilber et al., 2012), is used as a proxy for past solar activity.
Radiocarbon dating and age-depth modeling
We present a new “age-depth” model for the Hani peat core in addition to our previously published chronology in Li et al. (2017). Five new radiocarbon dates were added to the profile to make a better age control to facilitate spectral analysis. For radiocarbon dating preparation, samples were treated with 1 M HCl (70°C, 12 h) after the removal of any visible roots, washed free from acid with Milli-Q water, then dried (65°C) and homogenized (Piotrowska et al., 2011). The organic carbon in a pre-treated sample was converted into CO2 by combustion with CuO in a sealed quartz tube; after purification, the gas was reduced into graphite by Fe/Zn reduction (Xu et al., 2007) at Northeast Normal University. The graphite was then analyzed for 14C activity with Accelerator Mass Spectrometry (AMS) at Guangzhou Institute of Geochemistry, Chinese Academy of Sciences (GIGCAS) (Zhu et al., 2015). All ages are reported in conventional age before present (year BP) and calibrated into calendar years with the IntCal20 calibration curve (Reimer et al., 2020) using the CALIB 8.10 program and expressed as cal. yr BP with 2σ ranges (Stuiver and Reimer, 1993). The chronologies were estimated with the “rbacon” package (v 2.5.0) in R (Blaauw and Christen, 2011).
Laboratory methods
Pollen-spore samples at 10 cm intervals from the Hani section were prepared for analysis. The samples were treated with KOH, HCl, HF, and a hot acetylation mixture. Sample residues were preserved in glycerine and analyzed by Leitz Orthoplan microscope at 600× magnification. Pollen-spore analysis of the Hani peat core was conducted at Jilin University, China.
Phytoliths were extracted from approximately 0.5 g crushed dried peat samples using 10% HCl to remove carbonates, followed by using 65% HNO3 in water-bath heating (80°C) to remove organics. The phytoliths were extracted from the residues using density separation (the density of heavy liquid is 2.35 g/cm3, ZnBr2). Phytolith counting was conducted under a Motic optical microscope at 600× magnification until about 300 phytolith grains were identified.
For grain size measurements, all samples were pretreated in a muffle furnace (550°C) for 4 h to remove organic matter, 10% hydrochloric acid (HCl) to remove carbonates and with 10 mL 0.05 mol/L sodium hexametaphosphate ((NaPO3)6) to facilitate dispersion. The grain size distribution was determined with a MICROTRAC S3500 particle analyzer at Northeast Normal University, China.
The loss-on-ignition (LOI) method was used to determine the total organic carbon content of the peat samples. For analysis, each sample of approximately 1 g oven-dried (105°C) peat was weighed in a crucible. The crucible was then placed in a muffle furnace (SX–8–10, Taisite, China) and combusted for 12 h at 500°C. After combustion, the sample was cooled in desiccators to room temperature and weighed again. All samples were weighed using a 0.1 mg analytical balance (BSA124S–CW, Sartorius, Germany). The TOC content was calculated as the weight loss at 500°C according to equations in Li et al. (2020).
Numerical methods
Ordination correspondence analysis and proxy classification
The relationships between the pollen-spore, phytolith assemblages and grain size parameters were analyzed by correspondence analysis. A pre-analysis (detrended correspondence analysis, DCA) was required to determine whether a redundancy analysis (RDA) or principal component analysis (PCA) technique should be used for proxy classification (grouping). The analysis was processed using the program CANOCO version 4.5 (ter Braak and Šmilauer, 2002).
Principal component analysis and past EASM intensity reconstruction
In a correspondence diagram, proxy taxa (for instance, pollen vs phytolith and grain-size vs phytolith in this study) are classified into contrasting indicative groups along different directions of the RDA (or PCA) axis, indicating diametrically different climate/environment implications for each group. Based on the proxy correspondence diagram, the phytolith, pollen-spore assemblages, and grain size parameters were then classified into two indicative groups: a strong EASM-indicated group and a weak EASM-indicated group.
We then undertook PCA to extract principal components that explain the variations of the strong/weak EASM-indicated proxy dataset. Before PCA, the raw data of pollen, phytolith, and grain-size were normalized to a sequence with a mean value of zero and standard deviation of one. All the strong EASM-indicated (or weak EASM-indicated) proxies (data from pollen, phytolith, and grain-size) were put together and processed by PCA to calculate the strong EASM (or weak EASM) loading for each principal component. The strong/weak EASM scores were defined as the total principal component scores, which were calculated as the sum of weighted principal factor-scores (loadings) for strong/weak EASM groups. Then, a composite climate index (CCI), based on the multiple proxies, was calculated as the sum of the strong EASM and weak EASM scores for each sample. The PCA was performed with SPSS 19.0 software (Statistical Package for Social Sciences, Chicago, IL, USA).
Complete ensemble empirical mode decomposition and spectrum analysis
To identify the major periodicities within the time series, the CCI series for the Hani peat core was processed using the least-squares best-fit line and was linearly interpolated from the original data at constant 90-year steps using the built-in MATLAB command, to provide an equally spaced time series. This was because the 90-year steps closely approximate the average temporal sampling resolution of the Hani CCI time series. Subsequently, the dataset was decomposed into its major components using the complete ensemble empirical mode decomposition (CEEMD) approach (Sharifi et al., 2015; Torres et al., 2011). Wavelet power spectrum analyses were performed on each individual component using the Morlet wave (Torrence and Compo, 1998) with a modified MATLAB script. Notable periodicities with global power spectra >1σ confidence level were considered significant according to the wavelet power spectra of each component.
In addition to CEEMD, spectral analyses were performed using REDFIT 3.8e (Schulz and Mudelsee, 2002) on the original unevenly spaced CCI data. The program involves the Lomb-Scargle Fourier transform to overcome unequal time intervals. A first-order autoregressive (AR1) parameter was generated from the dataset and presented in the frequency domain to test whether spectral peaks are significant against the red-noise background generated from a first-order autoregressive process (as the null hypothesis).
Considering the aim of looking for Holocene climate cyclic characteristics and their potential mechanism, here we only processed the Holocene CCI data (since 11,700 cal. yr BP) for spectral and wavelet analyses.
Results
Chronologies
Radiocarbon dating results and calibrated ages are listed in Table 2. The calibrated ages for the Hani peatland reflected the sample stratigraphic order within dating errors, without obvious inverted outliers (Table 2). Bacon-estimated chronologies suggest that the sequence recorded a continuous paleovegetation and paleoclimate evolution surrounding the Hani peatland from ca. 16,000 cal. yr BP to present (Figure 3). Meanwhile, the newly established age-depth model is almost identical with the previously published chronology in Li et al. (2017), underlining the reliability of our dating and chronology estimation methods.
Accelerator mass spectrometry (AMS) radiocarbon (14C) dates of samples from the Hani peat core.

The graphite was prepared at Northeast Normal University and analyzed at Guangzhou Institute of Geochemistry, Chinese Academy of Sciences (GIGCAS).
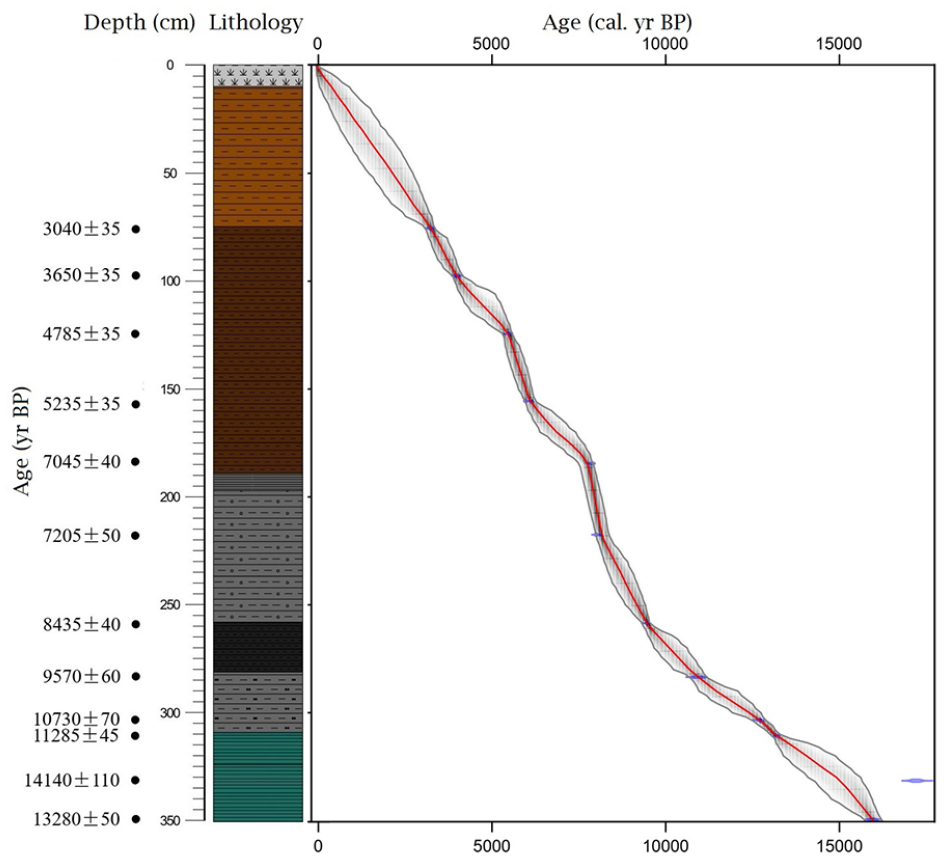
“rbacon” estimated age-depth model for Hani peat core. The best estimates for calibrated age are shown in red. The upper and lower estimates are shown in gray.
Microfossil assemblages and grain size data
Pollen-spore assemblages and regional vegetation development
Starting with the deglaciation period, the pollen diagram of Hani peatland covers the last 16,000 cal. yr BP (Figure S2). The pollen-spore spectra were dominated by Cyperaceae and various tree pollen types (Figure S2), indicating a forest swamp environment. The pollen sequence was visually divided into five pollen assemblage zones based on major changes in pollen assemblages.
Zone I (346–298 cm; 16,000–12,200 cal. yr BP) is exclusively dominated by Abies, Picea, and Cyperaceae where the abundances of broadleaf tree pollen are the lowest in the peat core, suggesting a boreal forest ecosystem surrounding the peatland.
Zone II (298–234 cm; 12,200–8700 cal. yr BP) is marked by increasing abundances of broad-leaved tree pollen and decreased Cyperaceae pollen. The Late-glacial climatic amelioration is palynologically indicated by the obvious increases in more thermophilous taxa, such as Juglans, Quercus, and Ulmus, revealing a shift in the regional vegetation composition to temperate broadleaf deciduous forests. Other temperate broadleaf deciduous trees, such as Carpinus and Corylus, become slightly more abundant. Boreal conifers, however, almost disappear from the study region as indicated by only scattered occurrences of conifer pollen (Figure S2).
Zone III (234–128 cm; 8700–5600 cal. yr BP): Juglans, Quercus, and Ulmus continue to dominate the pollen spectra. The mid-Holocene climate optimum is marked by rapid increases of broadleaved trees with maximum pollen percentage values during 8000–6000 cal. yr BP. Interestingly, the representation of Cyperaceae, which decreased during stage II, increases again since about 8200 cal. yr BP, clearly reflecting a trend toward relatively warm and moist climate conditions during the mid-Holocene.
Zone IV (128–64 cm; 5600–2700 cal. yr BP) is characterized by sharply increased values for Pinus pollen whose average percentage is more than 30% (Figure S2). The broadleaved trees, such as Juglans, Quercus, Ulmus, start to decrease and gradually no longer dominate the pollen spectra. This shift in vegetation cover documents a substantial spread of Pinus species at ca. 5300 cal. yr BP, possibly indicating that Pinus is becoming a common component of the regional vegetation. In the ground layer, Artemisia, which is tolerant of dryness, slightly increases at this stage, which suggests that the climate is becoming drier.
Zone V (64–0 cm; 2700 cal. yr BP to the present): similar to Zone IV, the regional vegetation is dominated by various conifers (e.g. as shown by pollen of Pinus, Abies, and Picea). Broadleaf tree pollen types significantly decrease during the late-Holocene while the Cyperaceae pollen slightly increases (Figure S2). Pinus contributes more than 50% of arboreal pollen while Picea is present up to ~6%. The regional landscape gradually evolves into the modern temperate needle-leaf and broadleaf mixed forest.
Phytolith assemblages
The peaty samples yield abundant phytolith types attributed to different species (Figure S3). The phytolith spectra are dominated by various elongates, rondel, trapeziform crenate, lanceolate, and bilobate phytoliths (Figure S3). The CONISS identified five first-order phytolith stratigraphic zones in the peat core. Two additional second-order subzones (Ia and Ib) were identified within phytolith Zone I.
Phytolith Zone I (346–286 cm; 16,000–11,000 cal. yr BP) covers most of the late-glacial period, during which the dominant phytolith types and contents were significantly different from those in the Holocene (Figure S3). Zone Ia (346–308 cm; 16,000–13,000 cal. yr BP) is dominated by elongate, trapeziform, and lanceolate phytoliths. Elongates contribute nearly 50% of the total assemblage. Bilobate phytoliths, which are more abundant in semi-humid regions (Lu et al., 2006), have the lowest percentages in the core (Figure S3). In Zone Ib (308–286 cm; 13,000–11,100 cal. yr BP), trapeziform crenate phytoliths significantly increase to the highest values in the core (Figure S3), indicating the regional climate becomes drier (Lu et al., 2006). Elongate, trapeziform, and lanceolate phytoliths continue to dominate the phytolith spectra; however, compared with Zone Ia, rondel slightly increase while the elongate and square decrease within this interval.
The phytolith assemblage of Zone II (286–214 cm; 11,100–8200 cal. yr BP) clearly reflected the early-Holocene climate amelioration: trapeziform crenate and lanceolate significantly decreased and no longer dominate the phytolith spectra. The bilobate and square phytoliths, which have higher abundances in wetter climates (Lu et al., 2006), increased during this stage.
Zone III (214–168 cm; 8200–6800 cal. yr BP) is marked by an increase in rondel, bilobate, and square phytoliths, revealing a favorable climate that may correspond to the mid-Holocene optimum. Elongate phytoliths decrease while blocky phytoliths slightly increase (Figure S3).
In Zone IV (168–64 cm; 6800–2700 cal. yr BP), the rondel phytoliths continue to increase, attaining the highest percentages of the core (21% on average). Trapeziform crenate increase whereas the square types significantly decrease. Considering the modern phytolith-climate calibrations (Gao et al., 2018; Lu et al., 2006), the phytolith assemblage variations during this stage seem mainly caused by mid- to late-Holocene climate deterioration.
Zone V (64–0 cm; 2700 cal. yr BP to the present) is characterized by the increase in elongate phytoliths and decrease in the rondel types. Trapeziform crenate continue to increase but not to values reached during the late-glacial age. The bilobate and the square types, which are common in warm and wet climate conditions (Lu et al., 2006), present lowered abundances within this interval, indicating cool and/or dry climate conditions in the late-Holocene.
Grain-size characters of Hani peat
The grain size parameters of the Hani peat core displayed significant variations, which could be divided into five different stages.
Zone I (346–238 cm; 16,000–8800 cal. yr BP) is characterized by high percentages of fine-grained clasts in peats. The peaty sediments are mainly composed of silt (78% on average) and clay (9% on average), with the mean grain-size of the sediments varying from 20 to 40 μm. Zone Ia (346–286 cm; 16,000–11,100 cal. yr BP) covers the late-glacial period, during which the regional climate is cold and dry; wind-blown fine components contribute the fine-grained layers of the peat core. In addition, within this interval, the LOI is lower than in other stages and displays rapid fluctuations. The grain-size characters during the early-Holocene (Zone Ib: 286–238 cm; 11,100–8800 cal. yr BP) are similar to those in late-glacial times but show slight differences: LOI sharply increased to more than 90% at ca. 11,700 cal. yr BP; fine-grained clasts’ contents started to decrease, indicating the East Asian summer monsoon-originated precipitation is increasing in the study area.
Zone II (238–198 cm; 8800–8000 cal. yr BP) is marked by a significant decrease in fine-grained components and increase in coarser clasts. The sandy component increased from 13 to 25% on average, suggesting the increase in coarse clasts came from surface flow erosion (Li et al., 2017).
Zone III (198–158 cm; 8000–6200 cal. yr BP) has the highest coarse-grained components of the peat core. The coarser component’s (>37 μm) percentage is higher than 60% on average and the sandy fractions increase to 47%. Since the coarse-grained components mainly come from monsoon-induced precipitation, the higher percentages of coarse clasts may correspond to the climatic optimum during the middle Holocene (Li et al., 2017).
In Zone IV (158–90 cm; 6200–3800 cal. yr BP), the sandy components start to decrease and varied more rapidly. The fine-grained clasts (<37 μm), which were less than 40% during the mid-Holocene, now account for more than 55% of the mineral particles, suggesting a decline in the strength of the East Asian summer monsoon and increase in winter monsoon-blown fine-grained fractions.
Zone V (90–0 cm; 3800 cal. yr BP to the present) is marked by several obvious sedimentation fluctuations (Figure S4). The contents of the sandy grains peaked first at ca. 3700 cal. yr BP (more than 90%) and then decreased to about 2% at 3300 cal. yr BP. During the late-Holocene, sandy fractions gradually increase while the silty fractions in the peats gradually decreased (Figure S4).
Although the paleoclimate and paleoenvironment reconstructions from different proxy data were not identical, all the data point to a similar general trend of the regional climate evolution: during the late-glacial age, the study region was influenced by a strong East Asian winter monsoon, resulting in cold and dry regional climate conditions. Since the onset of the Holocene, the data from the Hani peat core displayed marked enhancement of the East Asian summer monsoon, suggesting a climatic shift toward a favorable temperate environment. The late-Holocene is characterized by a decreasing trend of the East Asian summer monsoon, as the regional climate gradually becomes cooler and slightly drier. The agreements among those three proxies indicate that the proxy-based reconstruction resulted from regional climate change rather than site-specific conditions. All of them could be combined to construct a multiple-proxy based composite climate index.
Composite climate index calculation
Proxies grouping
DCA results showed that the linear approach of RDA is preferable to canonical correspondence analysis (CCA) of our datasets (ter Braak and Šmilauer, 2002). All the proxy groups were separately distributed in the RDA score plot, reflecting different environmental implications. Phytoliths and pollen-spore assemblages as well as grain size parameters were generally classified into two indicative groups, suggesting strong- and weak-EASM, respectively. In Figure 4, along Axis 1, phytoliths were classified into two distinct groups. Warm and humid climate-favored phytoliths, such as saddle and bilobate cross, plotted separately from elongate, lanceolate, and trapeziform crenate types, which usually occur in dry and cold climate conditions (Lu et al., 2006; Wang and Lu, 1993; Wang et al., 2003). Similarly, the pollen-spore taxa also separated into two distinct groups: thermophilous pollen and spore types (e.g. Cao et al., 2014; Chen et al., 2010; Yu et al., 2004), like broadleaf tree pollen, plotted along the minus direction of Axis 1, while coldness- and dryness-tolerant taxa, such as herbaceous plants and conifer taxa (e.g. Cao et al., 2014; Chen et al., 2010; Yu et al., 2004), plotted along the positive direction of Axis 1 (the same as phytoliths). The RDA between grain size parameters and phytolith assemblages indicated similar patterns. Strong EASM-indicated parameters, such as sand content and coarse components (>37 μm fractions) percentages, which suggest a strong summer monsoon period in northeastern China, plotted along the minus direction of Axis 1, while the weak EASM indices were in the opposite direction. In summary, RDA classified all these proxies into two major groups as they indicated different monsoon strength in northeastern China (Table 3).
RDA classification results of paleoclimatic proxy taxa in peatlands, Northeastern China.

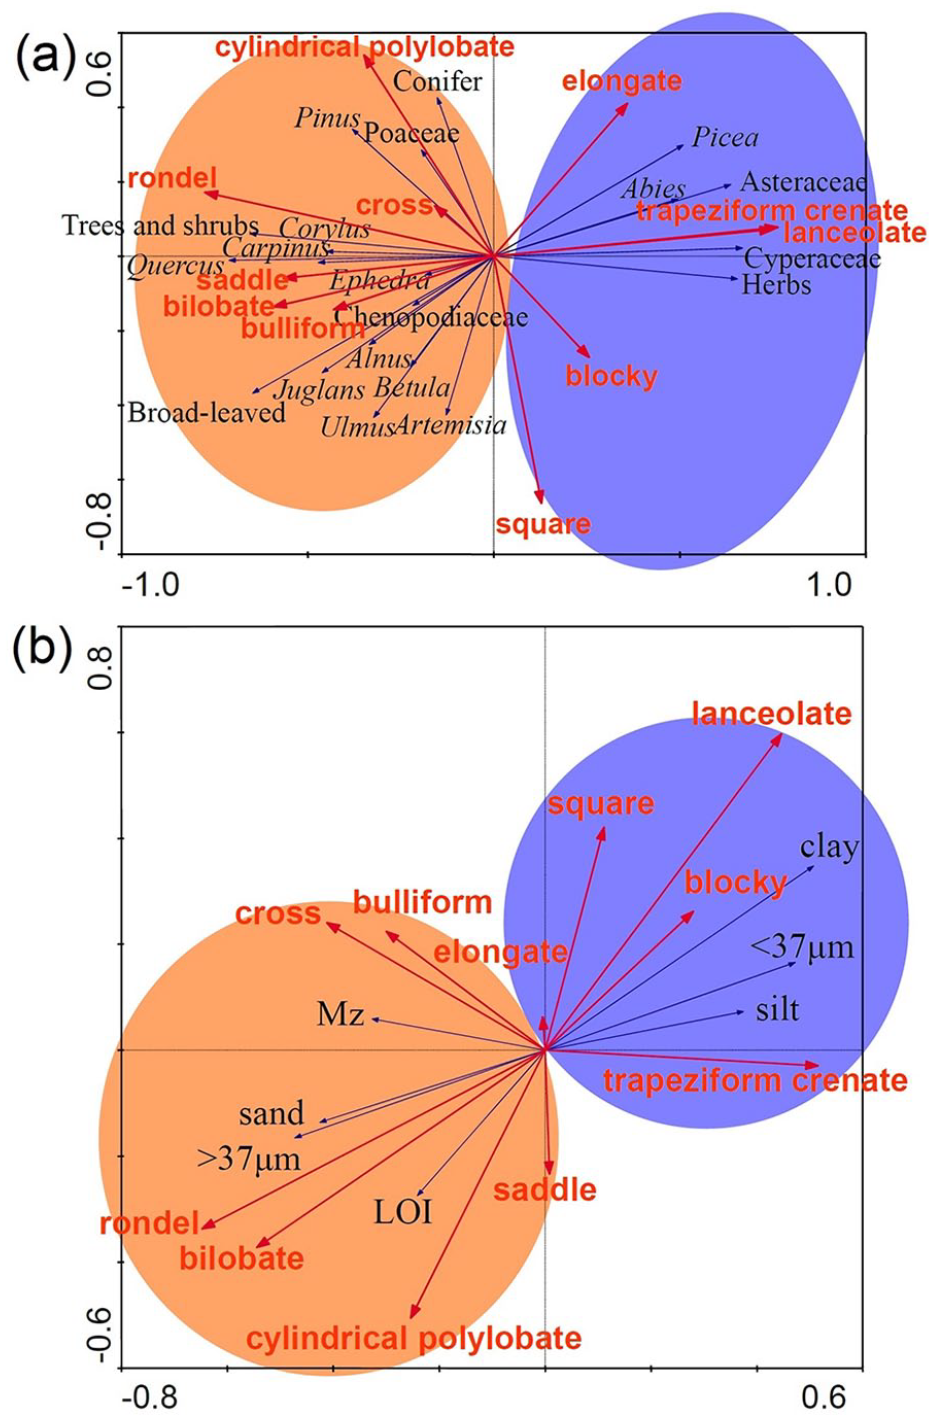
RDA analysis results and proxy grouping results for the Hani peat section. (a) Pollen and phytolith categories. (b) Phytolith taxa and grain size parameters.
PCA based composite climate index calculations
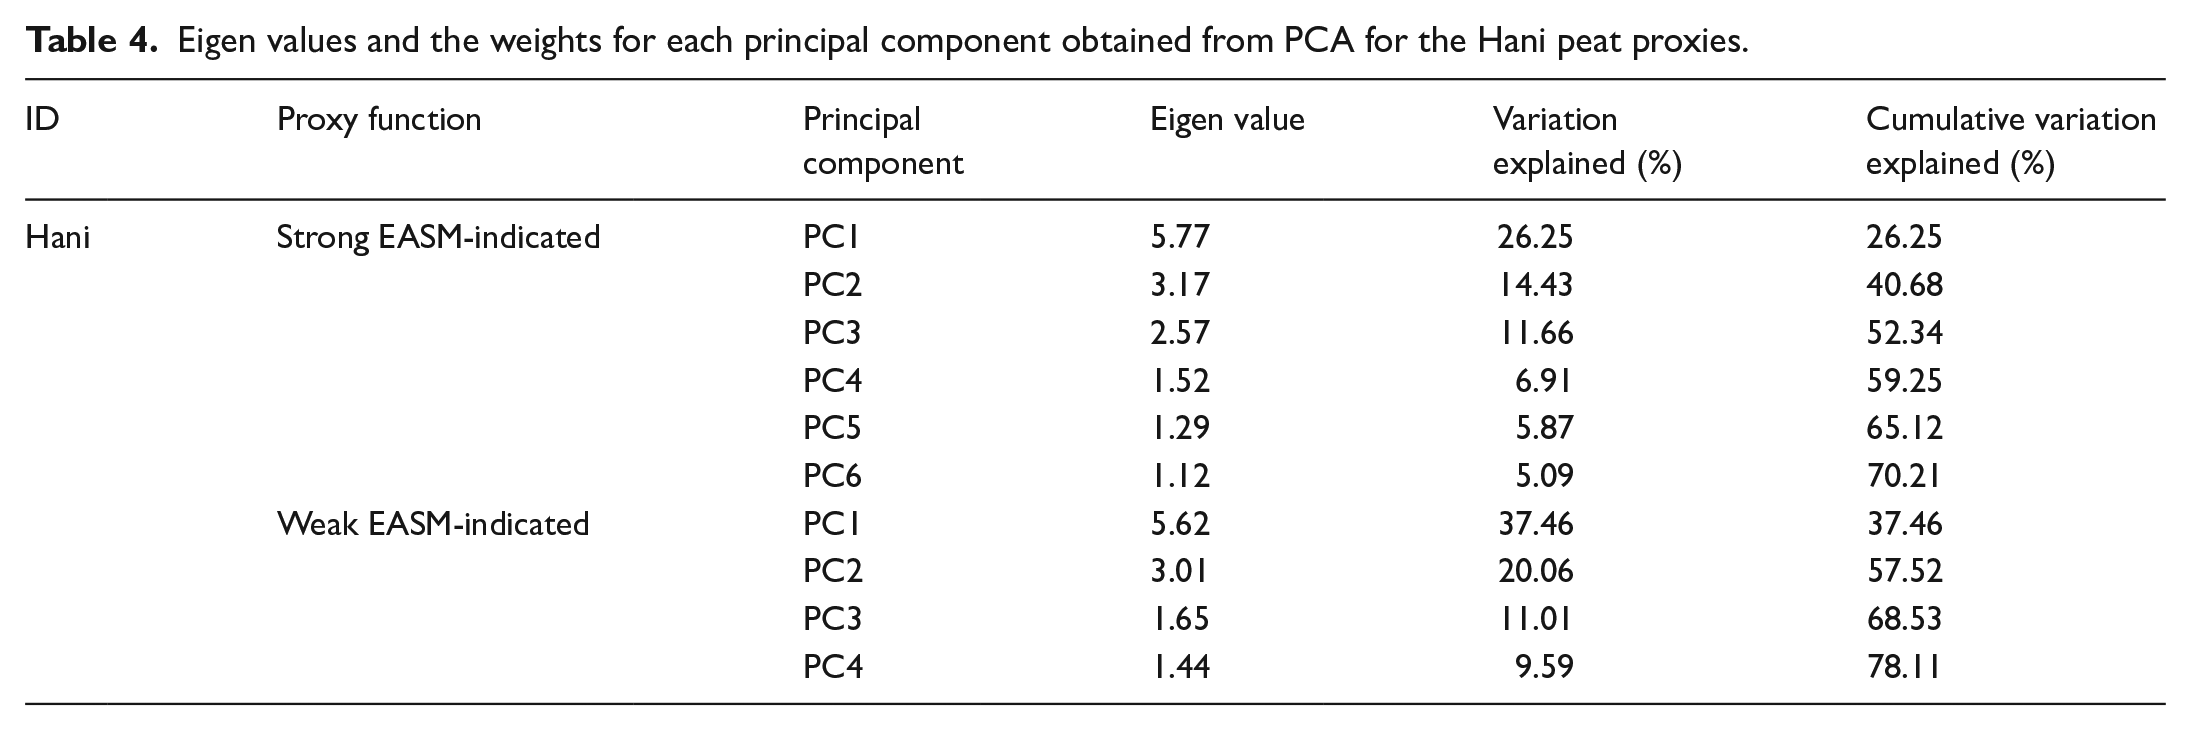
PCA extracted six strong EASM-indicated principal components (explaining 70.21% of variations of all the strong EASM-indicated proxies input) and four weak EASM-indicated principal components (explaining 78.11% of the variations of all the weak EASM-indicated proxies input) (Table 4). Total principal factor scores (strong/weak EASM scores) were calculated as the sum of weighted scores for each principal component. Higher values of the total principal factor scores represented stronger/weaker monsoon climate respectively; the composite climate indices (CCI) were calculated as the sum of the strong EASM scores and weak EASM scores. According to the definition, the greater values of the CCI indicated a stronger EASM phase in the study region (Figure 5).
Eigen values and the weights for each principal component obtained from PCA for the Hani peat proxies.
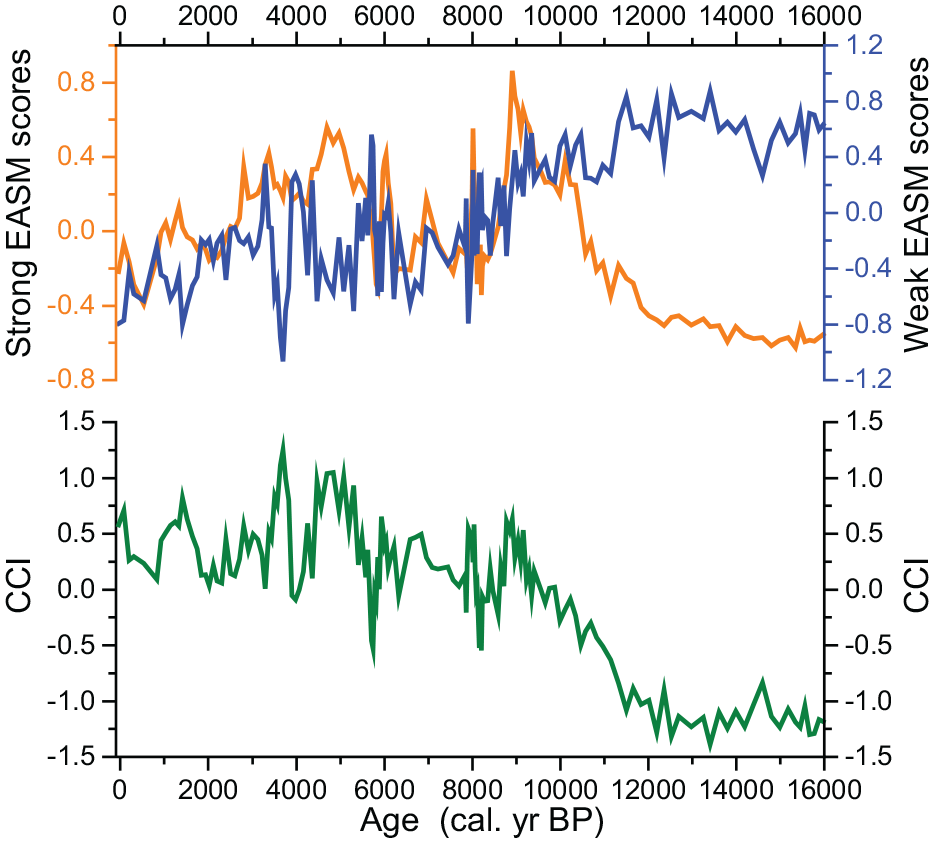
Strong EASM scores (in orange), weak EASM scores (in blue) and composite climate index (CCI) calculations (in green) for Hani peatland.
Wavelet and spectral analysis results
The complete ensemble empirical mode decomposition (CEEMD) of the Hani CCI series identified four major components (Table S2, Figure 6) with different frequencies centered at 500, 1100, 1875, and 4730 years (Figure 6a–d). Considering the length of the Hani CCI record (~11,700 year), the 4730-year periodicity should be treated with caution and is therefore not included in further discussion. REDFIT analysis results showed that multiple statistically significant periodicities (identified by the Monte-Carlo test) are recorded in the pollen-spore, phytolith, and grain size-derived CCI (Figure 7f). Statistically significant periodicities of ca. 1075, 600, 475, 350, 300 years were identified in the spectrum of Hani CCI sequences.
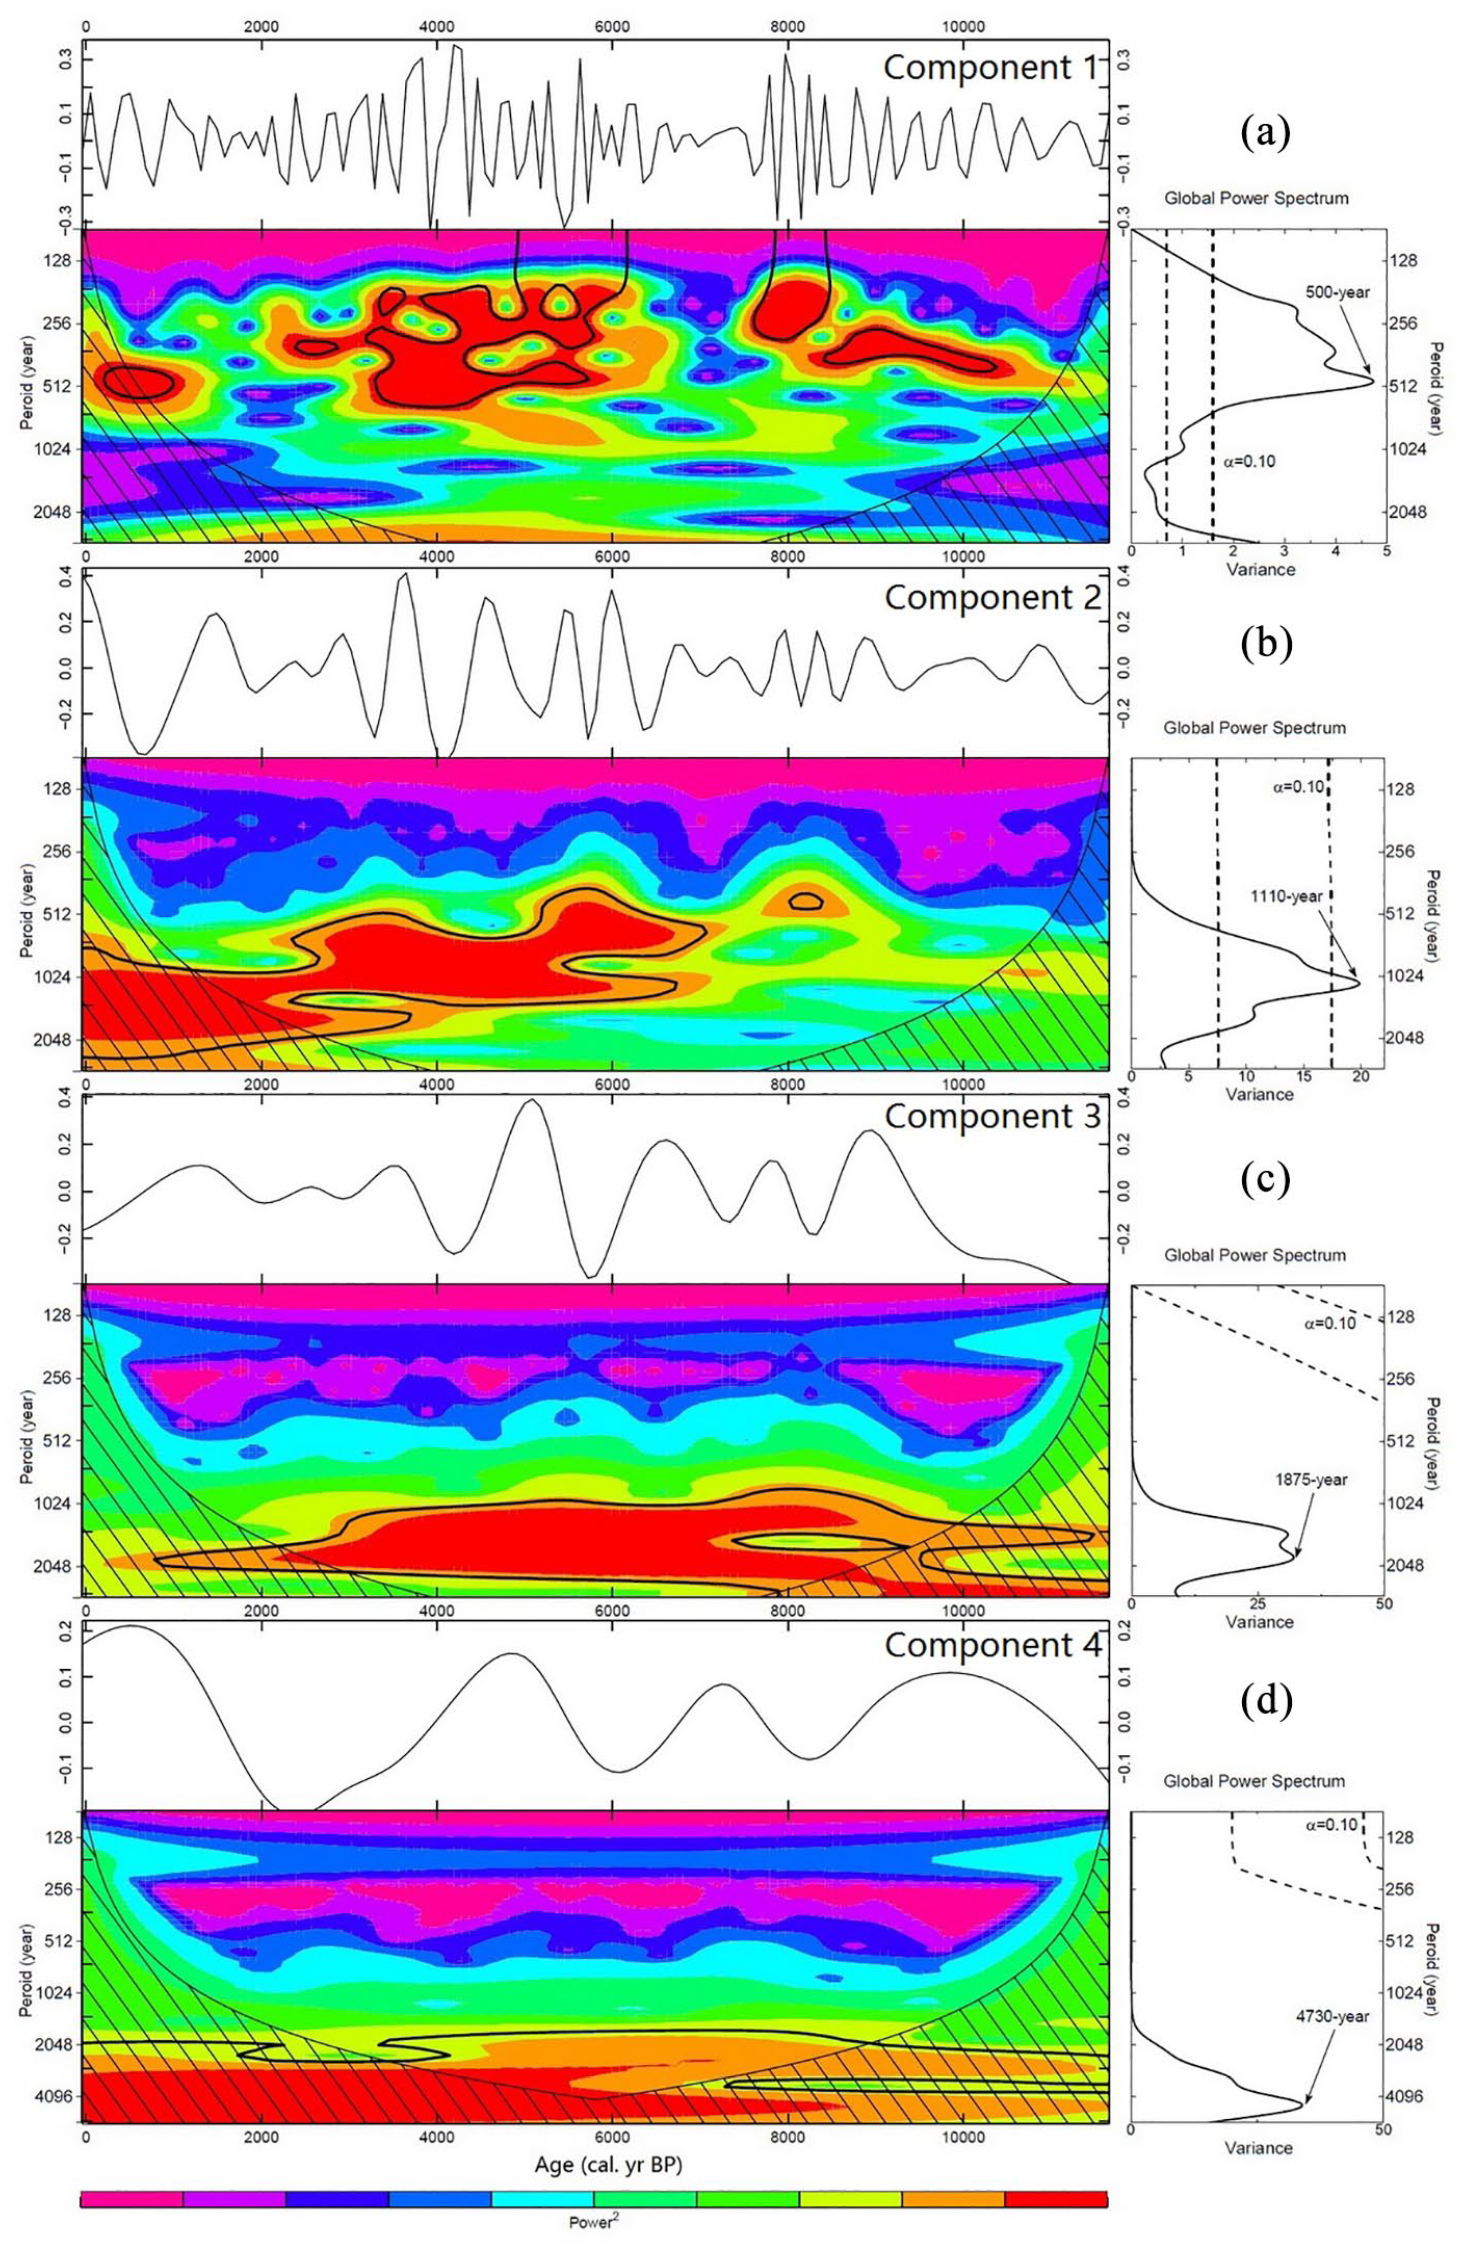
Wavelet power spectrum of the major components of Hani CCI time series using the Morlet wavelet (Torrence and Compo, 1998) and complete ensemble empirical mode decomposition (CEEMD) approach (Torres et al., 2011). (a) Component 1: 500-year periodicity. (b) Component 2: 1110-year periodicity. (c) Component 3: 1875-year periodicity. (d) Component 4: 4730-year periodicity.
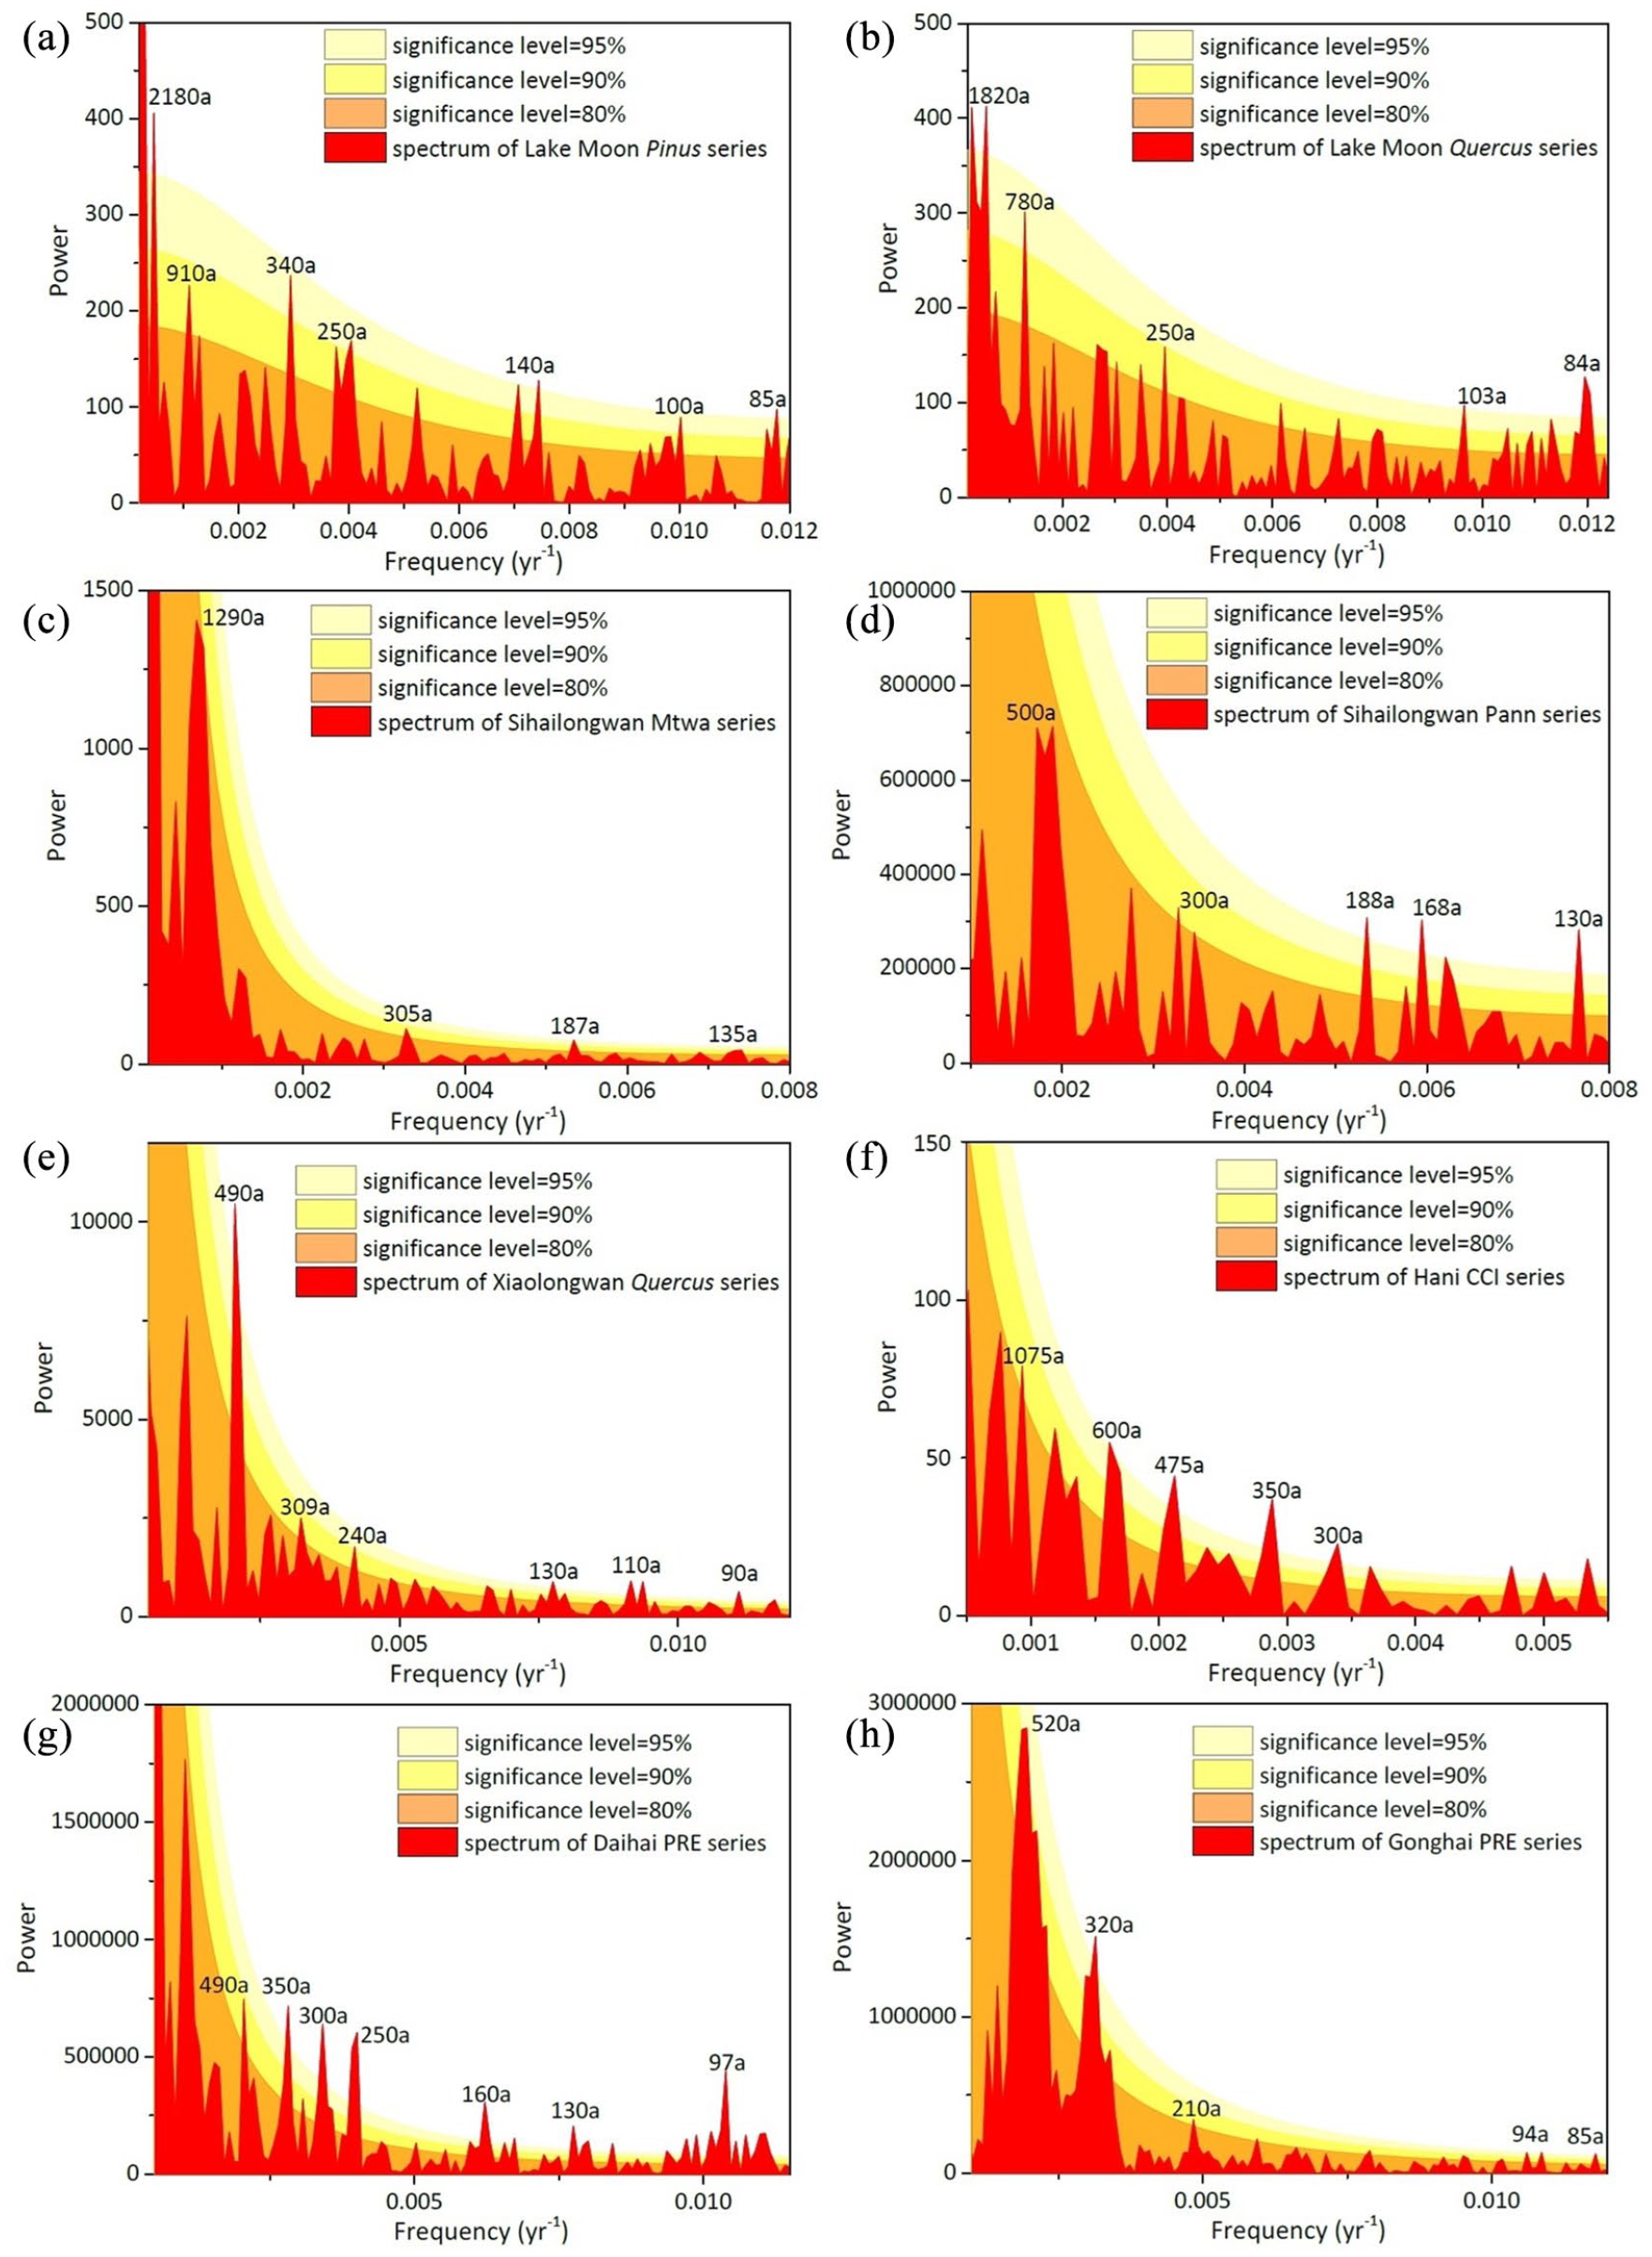
Spectral analysis of Holocene paleoclimate/paleovegetation records in East Asia. (a) Pinus pollen contents in Lake Moon (Wu et al., 2019). (b) Quercus pollen contents in Lake Moon (Wu et al., 2019). (c) Pollen-reconstructed July temperature (Mtwa) from Lake Sihailongwan (Stebich et al., 2015). (d) Pollen-reconstructed mean annual precipitation (Pann) from Lake Sihailongwan (Stebich et al., 2015). (e) Quercus pollen percentages in Lake Xiaolongwan (Xu et al., 2019). (f) Hani CCI profile (this study). (g) pollen-reconstructed mean annual precipitation (Pann) from Lake Daihai (Ding et al., 2018; Xiao et al., 2004). (h) Pollen-reconstructed mean annual precipitation (Pann) from Lake Gonghai (Ding et al., 2018; Xu et al., 2017).
Discussion
Millennial and centennial climate cycles registered in Holocene paleoclimate reconstructions in northern and northeastern China
Holocene millennial climate cycles
Numerous periodicities have been detected in Holocene paleoclimate records in monsoonal China (e.g. Hong et al., 2000; Liu et al., 2012; Stebich et al., 2015; Wu et al., 2019; Xu et al., 2014, 2019). However, the robustness of many of these periodicities has been questioned since they are highly dependent on the individual age–depth models and may be affected by the data-sampling resolution (Swindles et al., 2007). CEEMD and wavelet analyses showed that the Hani CCI profile is paced by a ~1800-year (1875-year) rhythm (Component 3). The strong EASM phases occurred at around 9100–8800, 8000–7700, 6800–6500, 5300–5000, 3600–3400, 1600–1200 cal. yr BP, whereas several weak-EASM phases peaked at around 8400–8100, 7400–7200, 5900–5600, 4300–4100 cal. yr BP (Figure 6). Some of these weak-EASM peaks coincided with Bond cycles, implying a possible tele-connection between monsoon climate and global oceanic oscillations.
Hani CCI records exhibit a clear cyclic oscillation signal at 1000-year periodicity (Figures 6 and 7f), which has been detected in past solar activity reconstructions (Liu et al., 2012; Steinhilber et al., 2012; Stuiver and Braziunas, 1993). Using cosmic nuclides production rates, solar variability is suggested to be characterized by a ~1000-year intrinsic oscillation, known as “Eddy cycles” (Liu et al., 2012; Steinhilber et al., 2012). This ~1000-year cycle has been identified in various paleoclimate records globally (e.g. Chu et al., 2014; Hong et al., 2000; Jo et al., 2017; Liu et al., 2019; Stuiver and Braziunas, 1993). For example, “Eddy cycles” have been reported in the δ18O sequences of the GISP2 ice-core record from Greenland (Stuiver et al., 1995), Iceland Scotland Overflow water (ISOW, Bianchi and McCave, 1999) and the marine sedimentary lightness records from North Atlantic deep water (NADW) circulation (Chapman and Shackleton, 2000). Records from Southern Siberia revealed that, even in the far interior, the sun paced the variations of climate changes there, displaying a significant ~1000-year cycle (Kravchinsky et al., 2013).
In the present study, the approximately 1000-year (910-year) cycle registered in Hani CCI (Figure 7f) and the Holocene Pinus profile of Lake Moon (Figure 7a), which may correspond to the ~1000-year cycle that has been well-documented in lacustrine sediments (e.g. Liu et al., 2000; Zhang et al., 2018), peatlands (e.g. Hong et al., 2000, Yu et al., 2008) and stalagmite records (Jo et al., 2017; Wang et al., 2005a), suggests possible solar-paced monsoon cyclic variations for this area. The discovery of the ca. 1000-year cycle may suggest that solar forcing has governed the Holocene paleoclimatic and paleoenvironmental fluctuations in northeastern Asia.
Holocene centennial climate cycles
The 475-year and 600-year cycles detected in Hani CCI sequences correspond well with the 550–600 years period that was previously reported from Lake Sihailongwan, which is only 10 km away from the Hani peatland (Stebich et al., 2015). The 500-year cycle has also been reported by Xu et al. (2014, 2019, 2020) from the pollen-spore records in Lake Xiaolongwan (16 km away from Hani peatlands), and from stable oxygen isotopes of peat α-cellulose from Jinchuan bog (20 km away from Hani peatlands, Hong et al., 2000).
CEEMD processing identified several ~500-year cyclical components (Figure 8) from the mean July temperature, mean annual precipitation reconstructions, and Quercus pollen percentages from the nearby records (Stebich et al., 2015; Xu et al., 2019). Those ~500-year components, which were extracted from different cores with independent chronologies, almost co-varied in-phase with component 1 (at ~500-year frequency) of the Hani CCI sequence (Figure 8), indicating that the ~500-year cycle is not produced by site-specific effects or chronological differences. Instead, the ~500-year periodicity is persistent in nature and exists in Holocene paleoclimate sequences over an extensive region. The ca. 500-year periodicity is not limited to monsoonal Asia (e.g. Cosford et al., 2008; Dykoski et al., 2005; Liu et al., 2014b) but has also been registered in peats (e.g. Blundell and Barber, 2005; Sharifi et al., 2015; Swindles et al., 2007, 2012), marine (Patterson et al., 2004), lacustrine (Hu et al., 2003), and speleothem records (Springer et al., 2008) from other bioclimatic zones globally. Considering the existence of inherent 512- and 550-year cycles in high-resolution tree ring Δ14C records (Stuiver and Braziunas, 1993; Stuiver et al., 1995), the detection of the ~500-year cycle in the Hani CCI profile and other paleoclimate sequences may suggest the role of the sun in regulating monsoonal climate variations at this frequency.
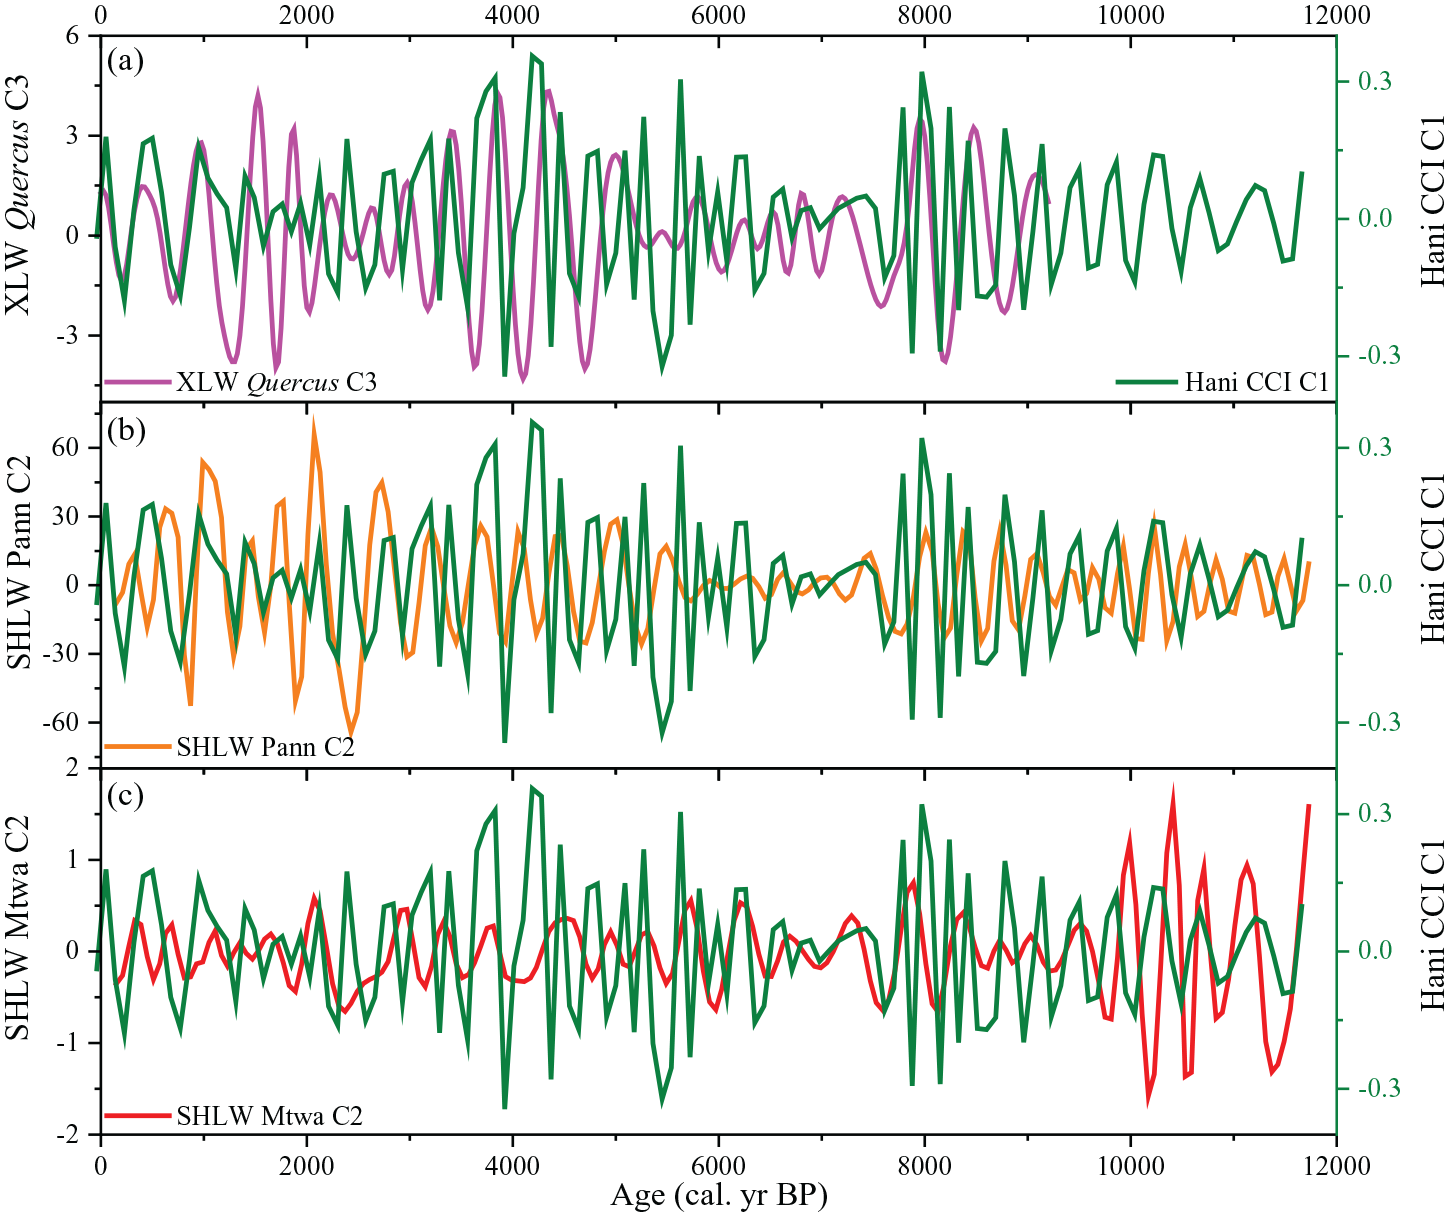
500-year components extracted from different paleoclimate/paleovegetation sequences and their comparison with Hani CCI component 1 (green line). (a) Quercus pollen profile from Lake Xiaolongwan (Xu et al., 2019) versus Hani CCI. (b) Pollen-reconstructed mean annual precipitation (Pann) from Lake Sihailongwan (Stebich et al., 2015) versus Hani CCI. (c) Pollen-reconstructed July temperature (Mtwa) from Lake Sihailongwan (Stebich et al., 2015) versus Hani CCI.
The 300–350-year periodicity exists in the spectra of all analyzed paleoclimate sequences (Figure 7) and has been found in various paleoclimate reconstructions using different geological archives (e.g. Hong et al., 2000; Ji et al., 2005; Jo et al., 2017; Li et al., 2016; Yu et al., 2008). Although evidence for the existence of ca. 300-year cycle is increasing (e.g. Chapman and Shackleton, 2000; Hong et al., 2000; Ji et al., 2005; Jo et al., 2017; Li et al., 2016), few studies demonstrated the possible forcing of periodic climate oscillations at this frequency. In addition to ~210-year (“de Vries cycle”) and ~1000-year (“Eddy cycle”) periodicities, wavelet analysis of cosmic-isotope-based Holocene solar activities have detected an unnamed significant cycle at about 350-year (e.g. Steinhilber et al., 2012), underscoring a possible inherent oscillation of solar irradiation. The significant 300–350-year periodicity detected in Hani CCI and other paleoclimate profiles (Ding et al., 2018; Stebich et al., 2015; Wu et al., 2019; Xu et al., 2019) may therefore indicate a link between East Asian monsoon climate and solar irradiation (Steinhilber et al., 2012).
The ~200-year periodicity was found in various paleoclimate records in East Asia (Figure 7). Globally, the ~200-year periodicity has been identified in a range of paleoenvironmental records (Chambers et al., 1999), including peats (Aaby, 1976; Borgmark, 2005; Chambers and Blackford, 2001; Hong et al., 2000; Sharifi et al., 2015; Spiridonov et al., 2019) and lacustrine sediments (Cooper et al., 2000; Liu et al., 2000), and marine records (Kunzendorf and Larsen, 2002; Patterson et al., 2007). It is one of the most well-known unambiguous solar-related periodicities, not only because numerous publications show its existence in various records, but also it is registered in past solar reconstructions and historic solar activity monitoring (e.g. Stuiver and Braziunas, 1993). For instance, using historical “naked-eye” observations of sunspots between 165 BCE and 1918 CE, Vaquero et al. (2002) reported a persistent ~250-year cycle. Wagner et al. (2001) also reported a 205-year cycle is persistent in GRIP ice 10Be sequences. In addition, a similar 208-year period was found in tree ring Δ14C sequences (Stuiver and Braziunas, 1993).
In summary, the detection of millennial and centennial climate cycles from the Holocene Hani CCI profile and the consistency between different records demonstrates that the periodic oscillation of Holocene climate at different frequencies is persistent over an extensive region in East Asia. Although our records are from a single core, the multi-proxy based CCI data of the Hani core can be treated as a representative investigation in northeastern China.
Role of the sun in regulating East Asian monsoon climate and its possible mechanism
Linkage between solar irradiation and Holocene monsoon climate change
Wavelet and spectral analyses showed that the ~1875-year, ~1100-year, ~500-year, and 350-year periodicities characterize the Hani CCI profile (Figures 6 and 7). Among these, the ca.1000-year, 500-year, 350-year periodicities correspond to ~1000-year (Eddy cycle), ~500-year, and ~350-year cycles that relate to solar activity (Steinhilber et al., 2012; Stuiver and Braziunas, 1993; Vaquero et al., 2002; Wagner et al., 2001). Cross-wavelet coherency analysis shows that the Hani CCI component 1 (at 500-year frequency) displayed a clear in-phase variation with corresponding cyclic components extracted from tree ring Δ14C profiles (Reimer et al., 2013), especially at the frequency of 350–500-year (Figure 9). The CCI component 1 at 500-year peaked when there is a corresponding peak in the reconstructed solar activity (Figure 9a). A slight discrepancy, however, exists in the timing and amplitude of the CCI components relative to the Δ14C fluctuations (Figure 9). Uncertainties in the chronological modeling of the peat core is probably the main reason for this discrepancy. Generally, however, based on the current chronology, the CCI components variations at 500-year and 1000-year matched well with Δ14C inferred solar activity (Figure 9).
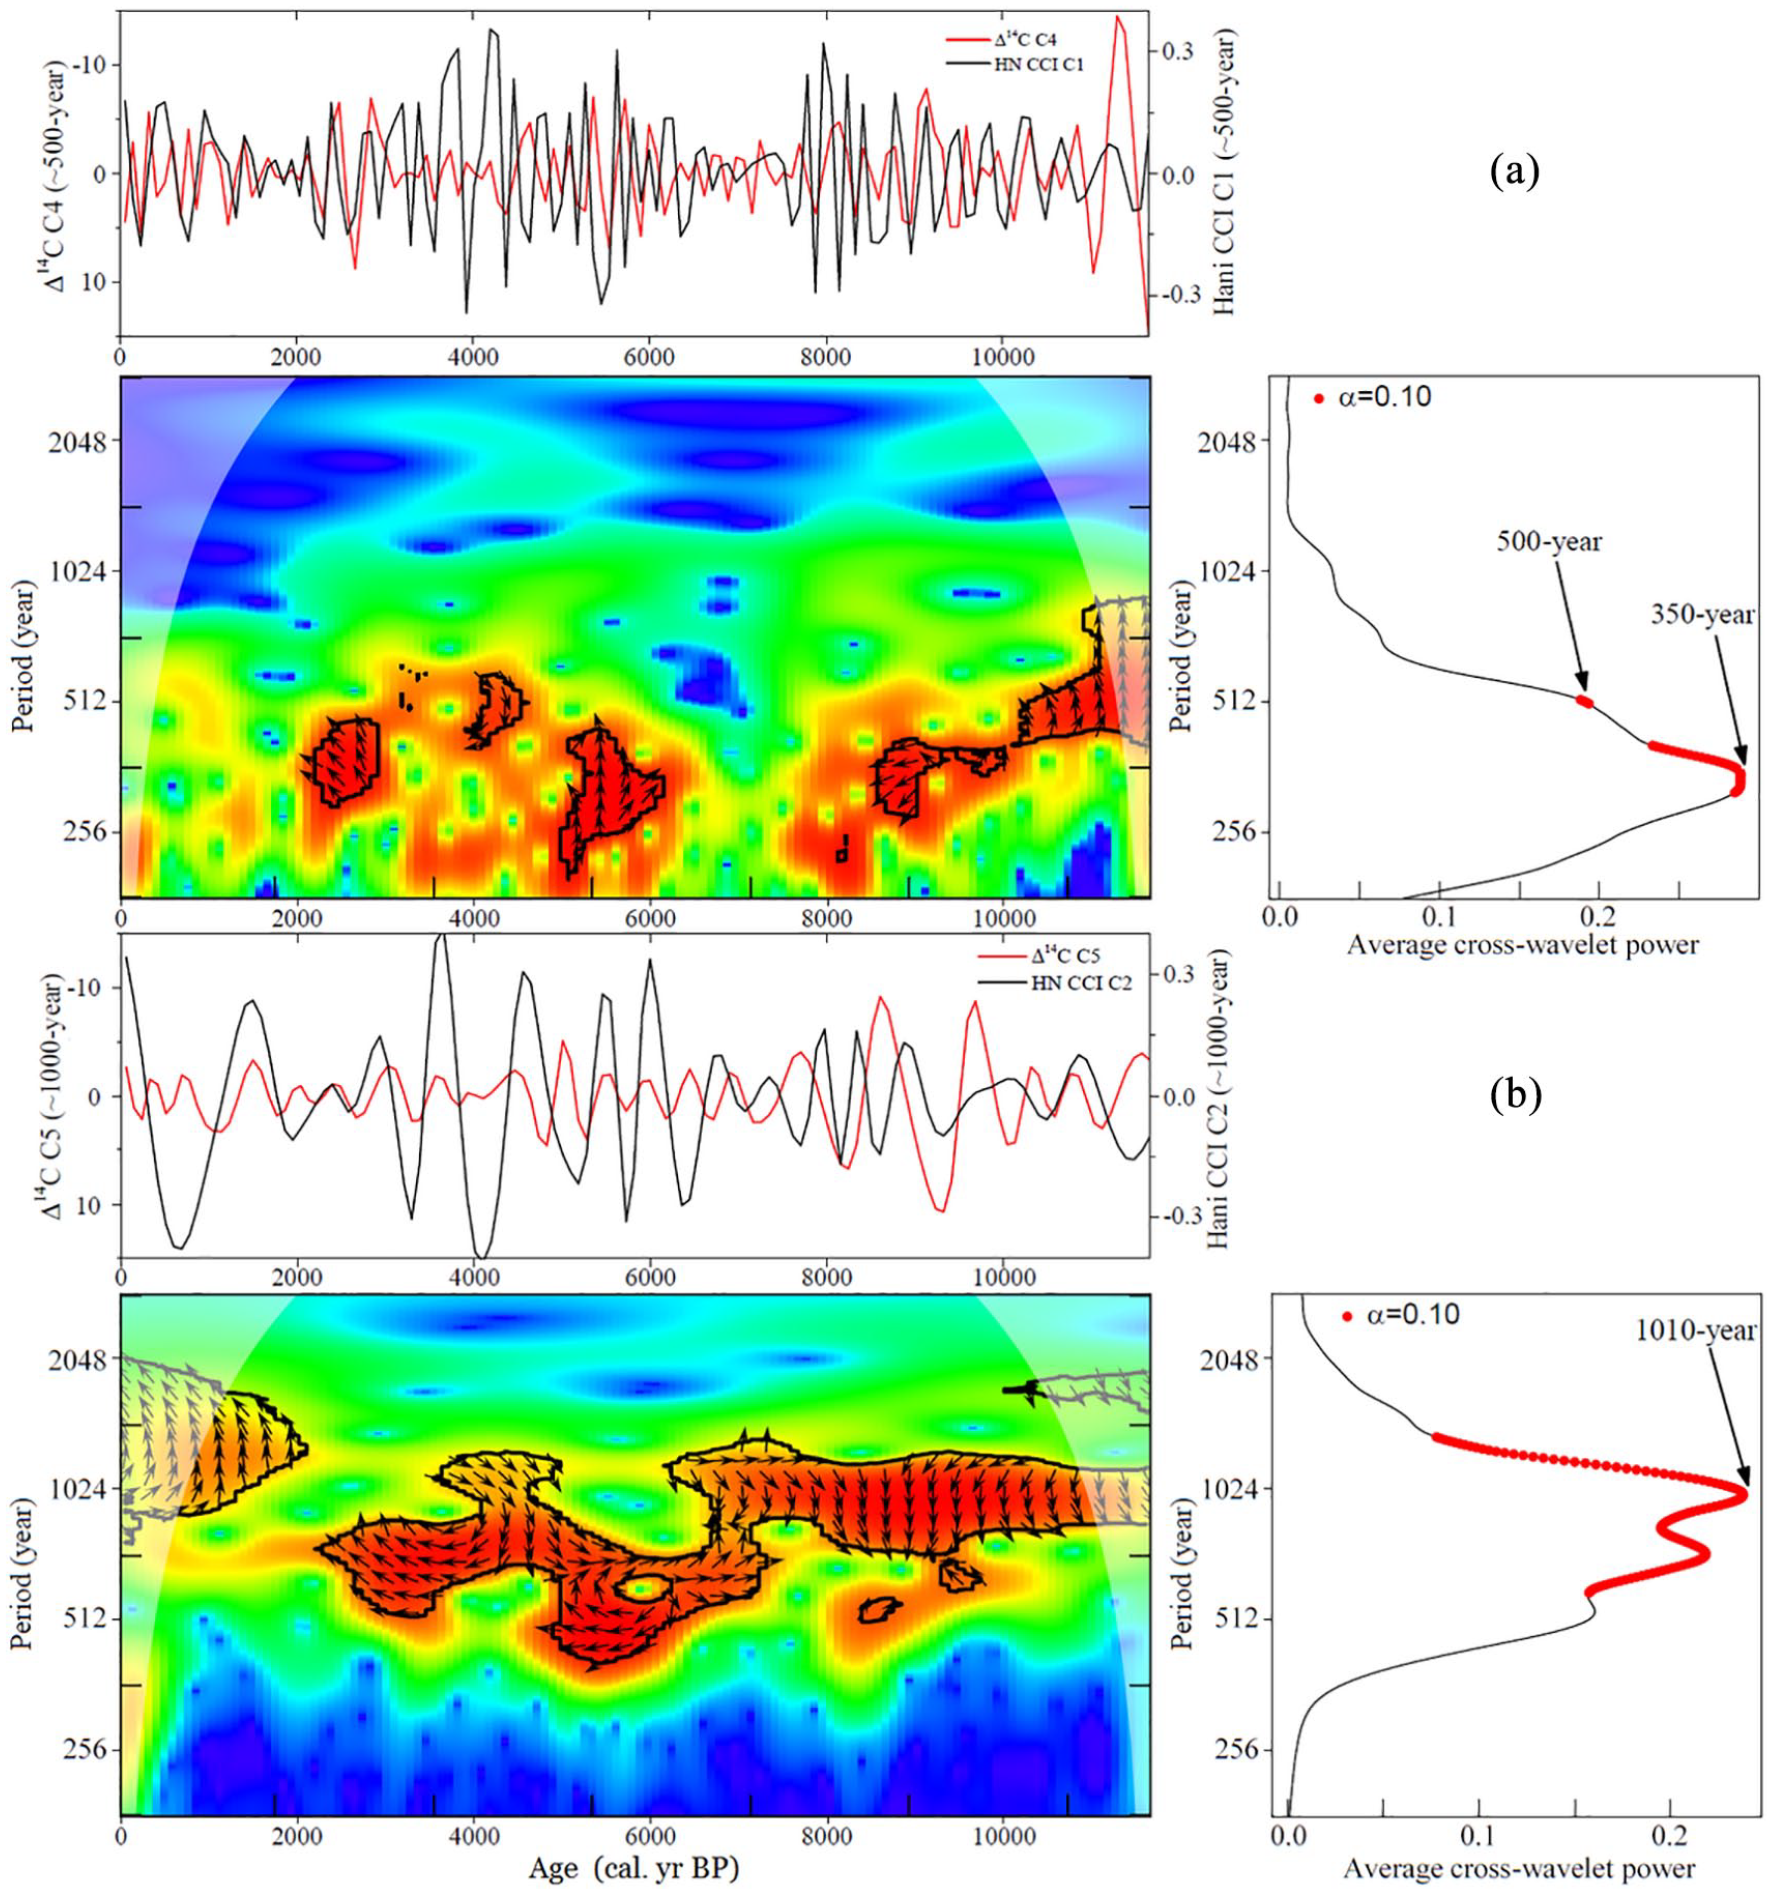
Cross wavelet coherence analysis between Hani CCI component 1 (500-year periodicity, a), component 2 (1000-year, b) and Δ14C components at 500-year and 1000-year periodicities.
Unlike the other periodicities, the origin of the ~1800-year cycle and its external forcing is still disputed (e.g. Debret et al., 2007; Soon et al., 2014). According to Debret et al. (2007), the ~1800-year cycle was reported to be mainly related to internal oceanic oscillations, rather than solar forcing, which is characterized by ca. 1000-year, 500-year, 200-year and 11-year cycles (Soon et al., 2014). However, employing wavelet transform analysis, Soon et al. (2014) detected novel 1500-year and 1800-year cycles in solar activity proxy datasets. The 1500–1800-year cycle was captured by three different solar proxies (Nitrate concentration from TALDICE ice core (Traversi et al., 2012); solar modulation parameter Φ derived from 10Be of GRIP (Steinhilber et al., 2009); 14C production rates (Stuiver and Braziunas, 1993)). Since all these proxies show a similar relation to solar activity, and since each has a quite different destiny in the terrestrial system, the results may imply solar activity could be responsible for the 1500- to 1800-year climatic variations in paleo-records (Soon et al., 2014) and in solar dynamo modeling (Pipin et al., 2012). Therefore, it is unwise to reject the possibility that the ~1800-year cycle in the Hani CCI sequence may be connected to intrinsic variations in solar irradiation output.
A conceptual model for solar-triggered monsoon climate variability in East Asia
Eastern China is deeply influenced by the monsoon climate, which is affected by land-sea contrast, sea surface temperatures, and inter-hemispheric heat gradients (Chao and Chen, 2001; Wang et al., 2005b). Located between the world’s largest continent (Eurasia) and ocean (Pacific), the East Asian monsoon is characterized by a moist southeasterly summer monsoon and a strong northwesterly (and/or northeasterly) winter monsoon (Wang et al., 2005b). Owing to the difference in heat capacity between the ocean and the continent, the EASM intensity is controlled by the ocean-land air pressure gradient, which can be further influenced by variations in solar irradiation (Beck et al., 2018). During high solar irradiation periods (boreal summer-like scenario), a large ocean/continent air pressure gradient and the northward movement of the Intertropical Convergence Zone (ITCZ), accompanied by heating over the Tibetan Plateau, strongly enhances the Asian monsoon (Chao and Chen, 2001; Wang et al., 2017). The strengthened EASM brings more precipitation to northern and northeastern China during the growing season, and this favors the growth of trees and also results in increased surface erosion in the lake (peatland) basin. It is therefore reasonable to deduce that more tree pollen and warmth-indicated phytoliths, as well as coarser grains, are recorded in the Hani peatland.
However, it should be noted that the change in total solar irradiance (ΔTSI) is less than 2w·m−2 over the past 9300 years (Steinhilber et al., 2009). A simultaneous amplifying mechanism is needed to produce the bigger climatic variations observed in paleoenvironmental reconstructions (e.g. Beck et al., 2018; Kravchinsky et al., 2013). El Niño–Southern Oscillation (ENSO) is a leading source of inter-annual climate variability over large regions of the globe (Ruzmaikin, 1999; Xie et al., 2009). It balances the water vapor transport and atmospheric circulation via feedbacks between surface wind and sea surface temperature (SST) distributions in the eastern and western Pacific. Increasing evidence indicates that slight changes in solar irradiation can be amplified via El Niño/La Niña (e.g. Liu et al., 2019; Lu et al., 2019; Rao et al., 2016). For example, employing stochastic resonance theory, Ruzmaikin (1999) suggested that the 11-year variation of solar forcing, although weak, can be effectively amplified through a nonlinear system when its period is close to twice that of the noise (Gammaitoni et al., 1998). White and Liu (2008) suggested that internal non-linear processes in the solar-forced Pacific delayed action/recharge oscillator (DAO) drove the ~3.6-year (one-third of ~11-year cycle) and ~2.2-year (one-fifth of ~11-year cycle) ENSO signals, indicating a feedback between the solar forcing and ENSO phases. In the present study, Hani CCI sequences show a general anti-phase variation with the TRACE simulated ENSO variabilities at the millennial scale (Figure 10). The proxy-based Hani CCI is more likely to drop during a strengthened ENSO phase, namely “El Niño”-like pattern (Figure 10). However, when the ENSO activity weakens (a “La Niña”-like pattern), the Hani CCI is more likely to increase (Figure 10). Based on modern observations and climate modeling (Chao and Chen, 2001; Ding et al., 2008; Lu et al., 2019; Rao et al., 2016; Xie et al., 2009), we propose a conceptual model to illustrate the influence of solar activity and ENSO variations on East Asian monsoon variabilities (Figure 11).

Comparisons of (a) Hani CCI records (this study) with (b) TRACE simulated ENSO variabilities (Liu et al., 2014a) and (c, d, e) past solar activity reconstructions (Solanki et al., 2004; Steinhilber et al., 2009, 2012).

Sketch maps of Eastern Asia showing the spatial patterns of precipitation and related circulation characteristics under different solar insolation scenarios. During high solar insolation stages, migration of ITCZ and intensified trade winds enhanced the EASM, forming a “La Niña” like atmospheric and oceanic circulation pattern (c). This resulted in increased precipitation in northern and northeastern China but a decrease in rainfall in the Yangtze River basin (a). During low solar irradiation intervals, the opposite occurs (an “El Niño” like circulation pattern), as shown in (b) and (d), resulting in intensified rainfall in the Yangtze River basin, but a decrease in precipitation (even droughts) in northern and northeastern China.
During high solar irradiation phases (Figure 11a), the northward migration of the ITCZ enhances the trade wind significantly (Chao and Chen, 2001; Wang et al., 2005b). The enhanced trade winds blow surface sea water to the western Pacific (Beck et al., 2018), forming a La Niña like phase (Figure 11c). As a result, the western Pacific sea surface temperature (SST) increases and stores a large amount of heat in the Western Pacific Warm Pool (WPWP) (Xu et al., 2013). The persistent warming in the western Pacific induces northeasterly winds and divergence north of the equator (Xie et al., 2009). The Ekman divergence restrains deep convection over the Northwest Pacific, amplifying the surface high pressure, namely Northwest Pacific Subtropical High (NPSH) (Figure 11a). The strengthened southeasterly monsoonal wind increases moisture transport from the western Pacific to East Asia, causing increased precipitation in the subtropical monsoon frontal region (Ding et al., 2008; Fan et al., 2016; Lu et al., 2019; Xie et al., 2009), for example, north and northeastern China. The Yangtze River basin, which is under the control of NPSH, experiences a decrease in regional precipitation (Figure 11a). In short, the intensified NPSH increases the frontal precipitation in north and northeastern China, but it causes a decrease in precipitation and even droughts in the Yangtze River basin.
In contrast, in a diminished insolation period (Figure 11b), the decreased Walker circulation will weaken the surface sea water blowing to the western Pacific (Beck et al., 2018), causing an El Niño like phase in the Pacific (Figure 11d, Ding et al., 2008; Liu et al., 2019; Xie et al., 2009). The NPSH is not as strong/active as during a high insolation period (Figure 11b). The position and zone of influence of NPSH is limited to southern China (Ding et al., 2008; Xu et al., 2020). Thus, the Yangtze River basin is exposed to the control of frontal precipitation of NPSH, resulting in enhanced regional precipitation there, whereas northern and northeastern China experience a shortage of rainfall (Ding et al., 2008; Liu et al., 2019; Xie et al., 2009), corresponding to a scenario of a weakened monsoon intensity period (Ding et al., 2008; Liu et al., 2019; Rao et al., 2016).
These spatially opposite “wet (dry) north and dry (wet) south” phases have been recognized and confirmed via modern observations (e.g. Ding et al., 2008; Xu et al., 2020) and proxy-based reconstructions (e.g. Liu et al., 2019; Lu et al., 2019; Rao et al., 2016). Slight solar variation, associated with ocean-atmosphere feedbacks, is the most likely factor that regulates the East Asian monsoon climate change. In a higher solar activity period, the intensified summer monsoon across eastern China is always accompanied by intensified rainfall in northern and northeastern China and by reduced rainfall over the Yangtze River basin. In contrast, during a diminished solar irradiation period, the weakened EASM climates across eastern China are characterized by a decrease of rainfall in northern and northeastern China and by increased rainfall in most of southern China.
Conclusions
Using peatland paleoecological data, a composite climatic index (CCI) was defined and calculated to investigate the periodic oscillation features of Holocene climate in East Asia. Statistically significant ca. 1800-year, 1000-year, 500-year, and 350-year periodicities were detected in the Hani CCI time series and other Holocene paleoclimatic sequences in northern and northeastern China. Cross-wavelet coherency analysis showed the CEEMD extracted 500-year component displayed a clear in-phase variation with past solar activity, indicating a link between East Asian monsoonal climate and solar forcing. Given the in-phase variations between our records and solar activity reconstructions, and possible anti-phase variations between Hani CCI and simulated ENSO variabilities, it seems that variation in solar irradiation, associated with ENSO activity, is mainly responsible for these centennial- to millennial- climate cycles observed in paleo-records. Based on modern climate observations and numerical modeling, we propose a conceptual model to argue that the relationship between East Asian monsoon climate change and solar forcing involves sun-atmosphere-ocean interactions and regulations. Amplified by ocean-atmosphere feedbacks, slight solar insolation change could trigger significant climate variations in East Asia during the Holocene.
Supplemental Material
sj-doc-3-hol-10.1177_0959683621994662 – Supplemental material for Linking Holocene East Asian monsoon variability to solar forcing and ENSO activity: Multi-proxy evidence from a peatland in Northeastern China
Supplemental material, sj-doc-3-hol-10.1177_0959683621994662 for Linking Holocene East Asian monsoon variability to solar forcing and ENSO activity: Multi-proxy evidence from a peatland in Northeastern China by Nannan Li, Arash Sharifi, Frank M Chambers, Yong Ge, Nathalie Dubois, Guizai Gao, Dehui Li, Lidan Liu, Hongyan Liu, Jiangyong Wang, Honghao Niu, Meng Meng, Ying Liu, Guihua Zhang and Dongmei Jie in The Holocene
Supplemental Material
sj-xls-1-hol-10.1177_0959683621994662 – Supplemental material for Linking Holocene East Asian monsoon variability to solar forcing and ENSO activity: Multi-proxy evidence from a peatland in Northeastern China
Supplemental material, sj-xls-1-hol-10.1177_0959683621994662 for Linking Holocene East Asian monsoon variability to solar forcing and ENSO activity: Multi-proxy evidence from a peatland in Northeastern China by Nannan Li, Arash Sharifi, Frank M Chambers, Yong Ge, Nathalie Dubois, Guizai Gao, Dehui Li, Lidan Liu, Hongyan Liu, Jiangyong Wang, Honghao Niu, Meng Meng, Ying Liu, Guihua Zhang and Dongmei Jie in The Holocene
Supplemental Material
sj-xls-2-hol-10.1177_0959683621994662 – Supplemental material for Linking Holocene East Asian monsoon variability to solar forcing and ENSO activity: Multi-proxy evidence from a peatland in Northeastern China
Supplemental material, sj-xls-2-hol-10.1177_0959683621994662 for Linking Holocene East Asian monsoon variability to solar forcing and ENSO activity: Multi-proxy evidence from a peatland in Northeastern China by Nannan Li, Arash Sharifi, Frank M Chambers, Yong Ge, Nathalie Dubois, Guizai Gao, Dehui Li, Lidan Liu, Hongyan Liu, Jiangyong Wang, Honghao Niu, Meng Meng, Ying Liu, Guihua Zhang and Dongmei Jie in The Holocene
Footnotes
Acknowledgements
We thank two anonymous reviewers for their insightful comments that greatly improved the manuscript. Dr. Zhengyao Lu (Lund University, Sweden) is acknowledged for kindly providing the TRACE simulated ENSO variability data.
Funding
The author(s) disclosed receipt of the following financial support for the research, authorship, and/or publication of this article: This work was financially supported by the National Natural Science Foundation of China (Grant No. 41771214, 41471164, and 41971100) and the National Key Research and Development Project of China (Grant No. 2016YFA0602301).
Supplemental material
Supplemental material for this article is available online.
References
Supplementary Material
Please find the following supplemental material available below.
For Open Access articles published under a Creative Commons License, all supplemental material carries the same license as the article it is associated with.
For non-Open Access articles published, all supplemental material carries a non-exclusive license, and permission requests for re-use of supplemental material or any part of supplemental material shall be sent directly to the copyright owner as specified in the copyright notice associated with the article.