



Abstract
Although enterprise support policies continue to be favored by policymakers in the European Union (EU) as tools for regional revitalization, there is as yet insufficient empirical evidence examining the effects of the policies on socially relevant outcomes. This paper helps fill that gap by utilizing firm-level data to offer robust counterfactual impact evaluation evidence on the employment effects of the coexisting European Regional Development Fund (ERDF) co-sponsored, national and regional programs commonly operated in many EU regions. By using data from a large northern Italian region, the analysis yields employment impact estimates of the policies under plausible identification assumptions. The paper finds no significant difference between the employment impacts of ERDF co-funded and national/regional programs, whereas, regardless of the funding body, the absolute per-firm employment effects of the programs are increasingly larger the higher the economic value of the incentives. However, the most generous incentives come with a much higher cost per each additional new job. The analysis also shows that the absolute per-firm employment effects of soft loans are similar to those of capital grants, but, because soft loans cost much less, they are more effective from a policy perspective.
Keywords
Introduction
European regional imbalances persist, and some theory argues and empirical evidence shows that inequity may even increase beyond particular threshold levels of development (Petrakos et al., 2011). The European Regional Development Fund (ERDF) seeks to reduce these regional disparities across the European Union (EU) by fostering regional economic development and social cohesion (Sweet, 1999; Greenbaum and Bondonio, 2004), and the budgetary focus on convergence has grown as the EU has expanded (Iribas and Pavia, 2010). Despite spending billions of euros on enterprise support policies – €13.6 billion for the 2007–13 programming period (Barca, 2009) – the empirical evidence on the effectiveness of such policies based on rigorous counterfactual impact evaluation studies is still limited. As others have also noted (for example, Bartik and Bingham, 1997; Bartik, 2004), a vital tool for evaluating enterprise support policies is sound empirical counterfactual impact evaluations that estimate how much the different firm-level outcomes between treatment and control groups are attributable to the program(s). Such evaluations of the proximate employment or local economic growth outcomes of the enterprise support policies provide vital empirical evidence that is also a necessary base for possible subsequent survey and focus group analyses that are more typical in the literature. They also complement macro-data studies aimed at assessing whether programs co-funded by the EU through the ERDF have an impact on regional economic growth (for example, Rodriguez-Pose and Fratesi, 2004) and regional econometric models aimed at estimating longer-term fiscal and employment benefits to local or regional economies.
Retrieving micro-data-based counterfactual impact estimates for enterprise support policies is not an easy task. The analysis must disentangle program effects from many confounding factors affecting firms and economic growth outcomes independently from the programs being evaluated. Further complicating the effort is the simultaneous presence of numerous competing enterprise support programs. In particular, multiple ERDF-co-funded, national and regional programs are often available to firms in the same area.
Most previous rigorous counterfactual impact evaluations of enterprise support policies in EU countries have analyzed a single type of policy instrument, operationalizing the incentives as a binary or a continuous treatment variable based on the economic intensity of the incentives (for example, Wren and Storey, 2002; Bondonio and Greenbaum, 2006; Bronzini and Di Blasio, 2006; Adorno et al., 2007; Girma et al., 2007; and Girma et al., 2008). This is often owing to the lack of comprehensive data on the whole array of the often coexistingpolicy instruments from sources such as the ERDF co-sponsored incentive payments and the entire set of national and regional enterprise support programs available in a NUTS 2 European region. Thereare two main limitations to analysis lacking comprehensive program activity data on multiple policy instruments. First, it is impossible to undertakecomparative evaluations that assess which typesof policy instrument are more effective in terms of returns of the different forms of assistance, holding constant the economic value of the public support. 1 Second, when the analysis is focused on single-policy implementations, no information is available on whether the comparison group firms not assisted by the ERDF program examined in the analysis received some assistance from other national or regional public programs. 2 As a result, in order to correctly identify counterfactual impact estimates, single-program evaluations must rely on the crucial hypothesis that the probability of firms gaining access to additional unobserved regional or national programs incentives is the same across both the assisted firms and the comparison group firms that did not receive assistance from the single observed program being evaluated. 3
This paper exploits the availability of a unique database on numerous types of enterprise support provided by ERDF co-sponsored, national and regional programs to yield counterfactual impact estimates of the policies that disentangle the impacts of various values of both the economic intensities of the program assistance and different policy instruments. We distinguish between non-repayable capital grants and loans at below-market interest rates, and between subsidies granted by ERDF co-funded programs and subsidies granted by regional/national programs.
The focus on the different economic intensities of the incentives is important in order to assess whether or not enterprise support programs are subject to decreasing marginal employment returns in correspondence to high per-firm values of assistance. Disentangling the impact of below-market-rate loans (soft loans) and capital grants, instead, is of great interest for redesigning enterprise support policies because, on the one hand, loans are more economical than business grants. For the same amount of public funds, loans allow for a much larger number of investment projects to be funded. Loans may also be more effective if credit market imperfections, such as the current credit crunch, are of significant concern. Such market failures can lead to inadequate financing of new or small businesses with little or no collateral or track record. On the other hand, however, capital grants can offer the assisted businesses a more generous financial incentive compared with subsidized loans, and they can help prevent fledgling businesses from amassing unsustainably large debt burdens. As a result, grants may have greater potential than loans to affect investment and hiring decisions. Although the question of capital grants versus subsidized loans has been at the center of a large debate and the focus of a large body of literature in the field of international aid to developing countries (for example, Schmidt, 1964, or Gupta et al., 2003), little to no empirical evidence is available on the relative effectiveness of grants versus loans when it comes to enterprise support policies for local economic development in the EU or in other industrialized countries.
Estimating different impacts for ERDF co-funded programs versus national/regional programs is important because the ERDF co-funded subsidies offered in the Objective 2 (Obj. 2) areas during the 2000–6 programming period were designed with a focus on supporting innovation and R&D expenditures. Thus, in theory, the ERDF co-funded subsidies focused on capital investment expenditures less tied to additional employment. The resulting greater automation from such investment expenditures may lead to, on average, more substitution away from labor and towards more capital-intensive production processes than in the investment projects subsidized by the national/regional programs. However, anecdotal evidence suggests difficulties in defining the procedures and implementation rules to effectively restrict support solely to expenditures connected with actual innovative investment projects and/or R&D activities. Therefore, holding constant the mix of capital grant and soft loan assistance, estimating whether the average employment impact of the ERDF programs is lower than that of the national/regional programs is a useful test of whether the intended focus on innovation and R&D expenditure of the ERDF programs was actually maintained.
The data used in the analysis come from eight national programs, six former national programs devolved to the regional government, four regional programs and seven Obj. 2 area programs co-funded by the ERDF operating (in the 2001–3 period) in a large northwestern Italian region (Piemonte). 4 The Piemonte region provides good external validity to the analysis because the region’s economy relies heavily on a base of almost 50,000 industrial firms that are the target of the programs’ assistance, owing to the economic decline continuing to plague many industrial sectors.
The employment outcomes are intended to capture the more proximate effects (in terms of space, time, and industry) of the support policies, disentangling the part of the firm-level outcome variation that was indeed due to the programs’ effects from the part due to socioeconomic factors independent from the programs’ interventions. The focus is on estimating the proximate effects of the support policies because the economic importance of the group of assisted firms, relative to the size of the entire regional/national economies in which they are located, is limited, as is typically the case with all enterprise support policies. Even if enterprise support programs are capable of affecting more distant outcomes, such as macroeconomic or long-run indicators of the wellbeing of residents measured at the level of the entire regions in which eligible firms are located, isolating such program impacts becomes virtually impossible. There are many confounding factors affecting outcomes that are of much greater importance than the possible program-induced improvements in the economic activity of the assisted firms.
The results of the analysis developed in the paper indicate that the absolute per-firm employment effects of the programs are increasingly larger the greater the economic value of the incentives. However, the incentives with the highest per-firm economic value yield employment impacts with a much higher cost per each additional new job than incentives with a lower economic value. The results also show that the absolute per-firm employment effects of soft loans are similar to those of capital grants. However, because soft loans cost governments much less than capital grants, soft loans possess much higher employment effectiveness than capital grants. Finally, no significant differences are estimated between the employment impacts of ERDF co-funded programs and the national/regional programs.
The remainder of the paper is organized as follows. First we provide a robust description of the features of the enterprise support policies consideredin the analysis and illustrate the methodology behind the ‘gross grant equivalent’ figures used to compute the monetary values of the incentives. We then describe the data used in the analysis, the programs’ activities and the employment descriptive statistics. After describing the econometric model used to retrieve the counterfactual impact evaluation estimates, we present and discuss the results of the analysis. The final section offers some concluding remarks.
Enterprise support policies and computation of the gross grant equivalent
National, regional, and ERDF co-funded enterprise support policies considered in the analysis are summarized in Tables 1–3. These policies represent the entire set of public assistance available to industrial firms in the northern Italian region of Piemonte from national and regional (including former national incentives devolved to the regional government) and ERDF co-sponsored subsidies during the 2001–3 period. 5 Incentive information is obtained from program managers, and the analysis focuses on the subsidy payments related to the assisted investments that entered into the production process in 2001. 6
National enterprise support programs, 2001–3.

No specific sector limitations.
With no direct collateral guarantees.
Regional programs and former national programs devolved to the regional government, 2001–3.
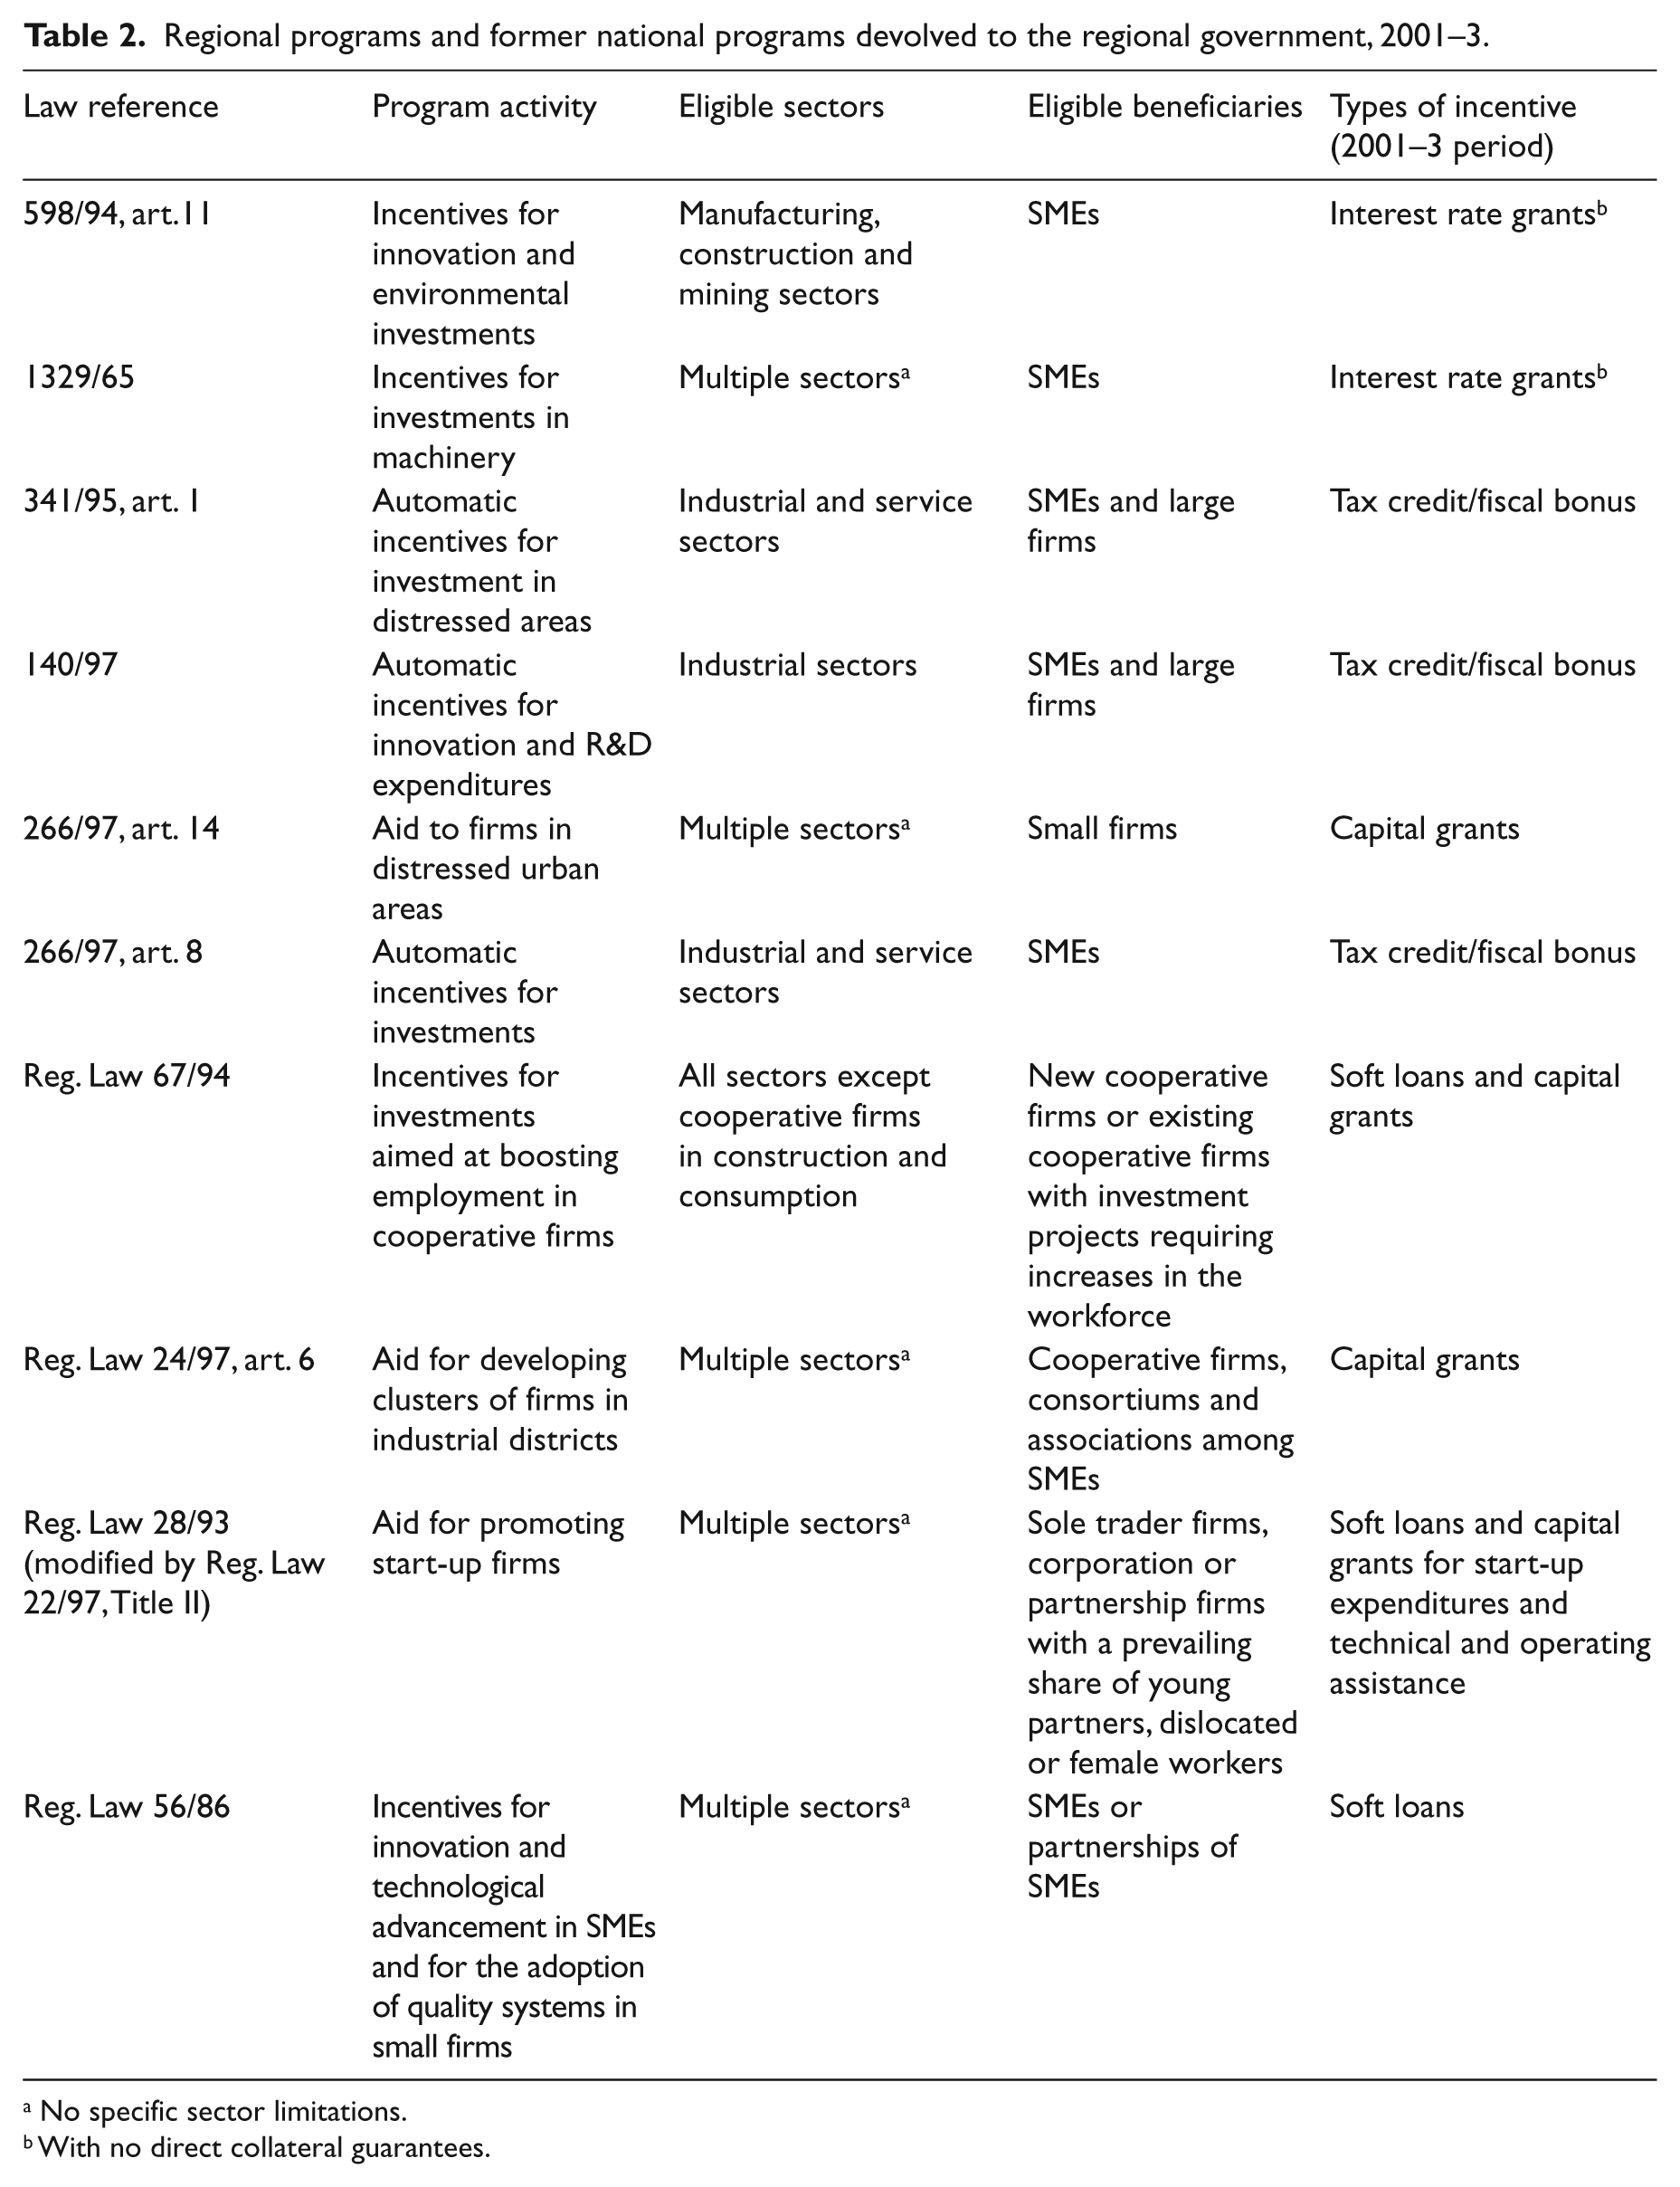
No specific sector limitations.
With no direct collateral guarantees.
Programs co-funded by the ERDF available in the 2000–6 Objective 2 areas.
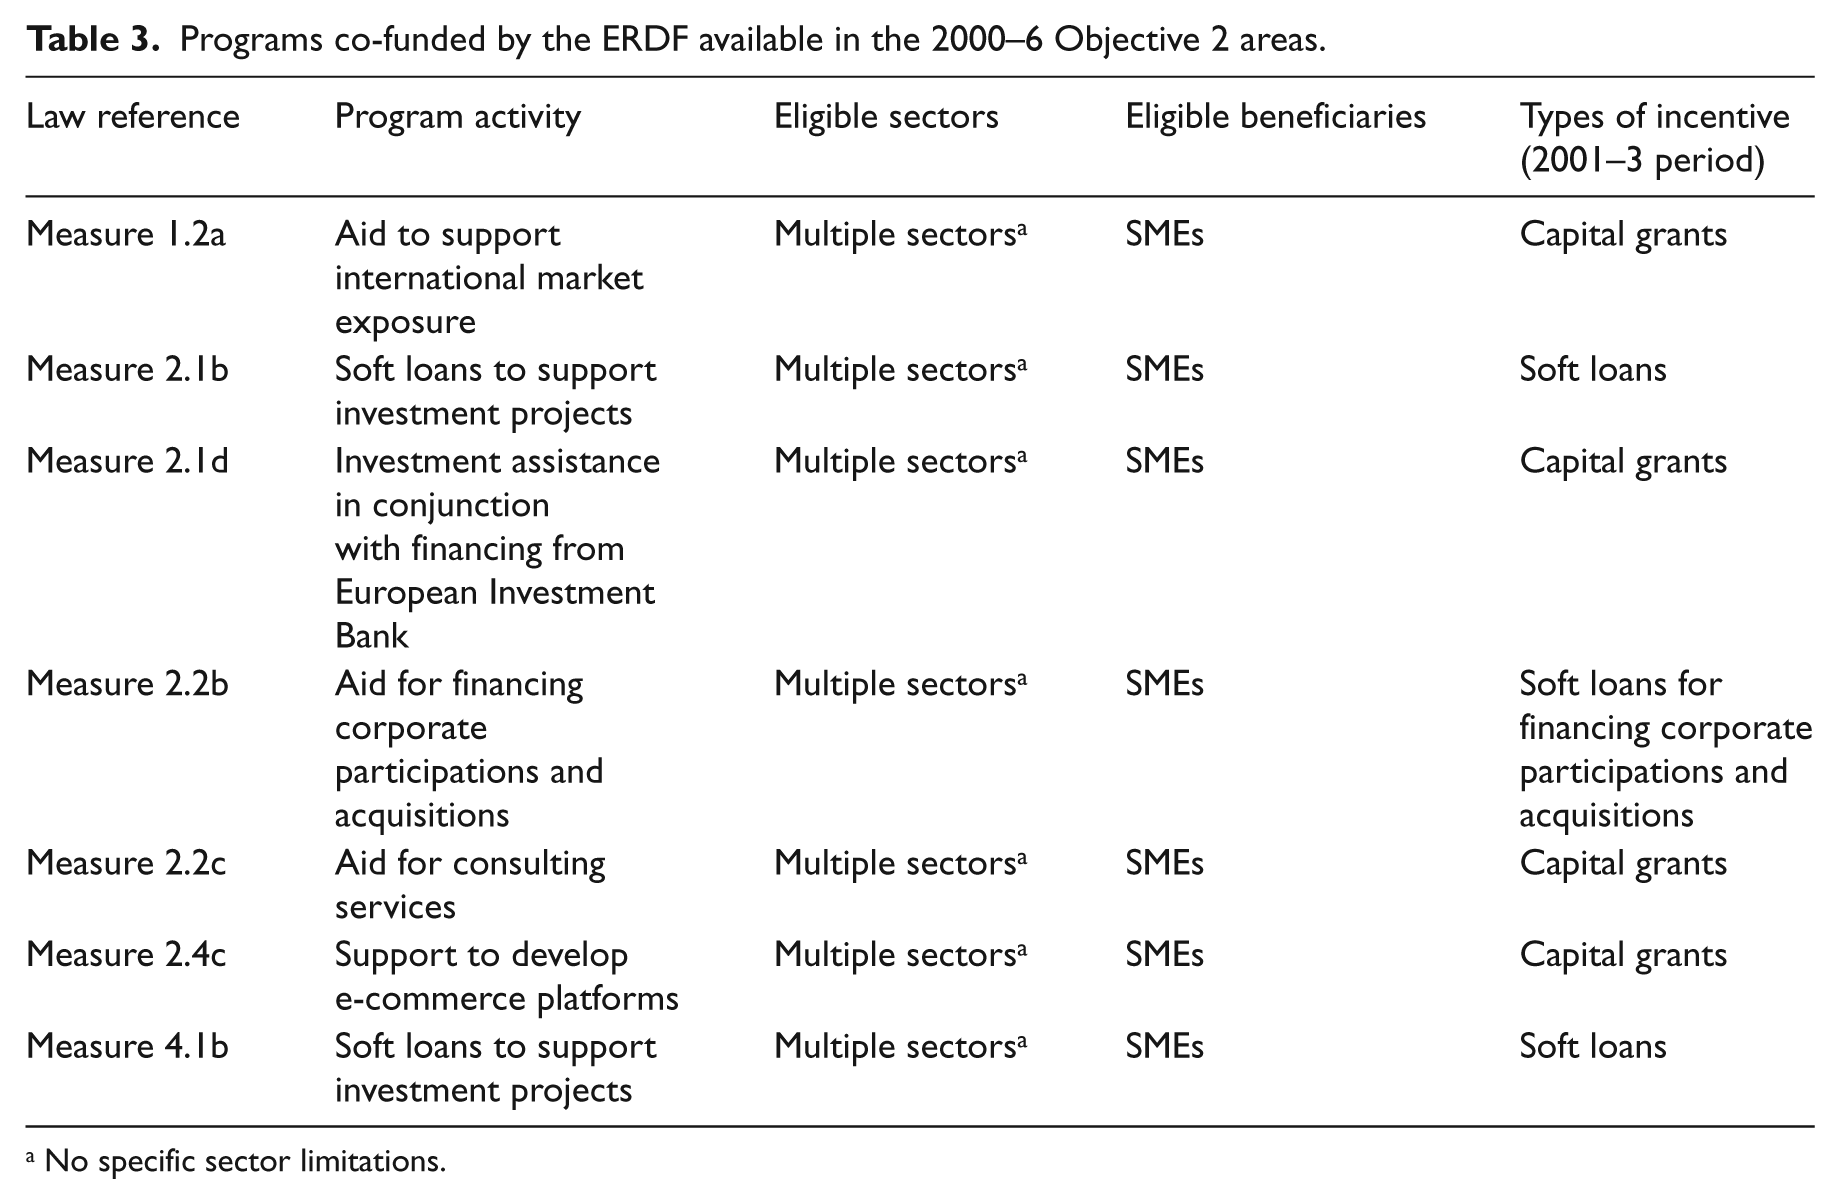
No specific sector limitations.
Computation of the gross grant equivalent
To comparatively estimate the impacts of the different support programs, all data on the economic value of the incentives granted to assisted firms are transformed into gross grant equivalent (GGE) values. The GGE values are computed as the net present values of the gross grant equivalent subsidy paid to the assisted firms (considered in terms of the absolute value of the equivalent grant rather than as the ratio between the equivalent grant and the value of the assisted investment).
In practical terms, data on the payments concerning non-repayable grants subsidies (applicable to either capital or interest rate expenditures), in most cases, were close to being readily interpretable as GGE. On the other hand, data on below-market-rate loans, hereafter referred to as ‘soft loans,’ needed to be transformed into the net present value of the difference between the flow of interest payments made by the assisted firms at a program’s below-market rate and the flow of interest payments that the assisted firms would have made at market rates. 7
Data on programs’ activities, share of assisted firms, and employment descriptive statistics
The data used in the analysis are the result of integrating business data from the Italian National Institute of Statistics (Istat) with policy data from the various program managing authorities.
Firm-level business data covering the years 2000–3 come from Istat’s Statistical Archives of Active Firms (Istat-Asia). 8 The data contain employment, industrial sector, and province of the headquarters location for all of the active firms located in the Piemonte region. The analysis focuses on firms operating in the following industrial sectors: mineral extraction (code C of the Istat ATECO 2002 classification 9 ); manufacturing activities (code D, Istat ATECO 2002); production and distribution of electricity, natural gas, steam and hot water (code E, Istat ATECO 2002). We also draw on data from the Istat 2001 Census of Industry and Services, which allows for the identification of firms with multiple local units, or establishments, located outside the Piemonte region.
Policy data come from various Italian public authorities, including the Ministry of Productive Activities, Mediocredito Centrale, Regione Piemonte, Finpiemonte, and Sviluppo Italia. The data onprogram activity for each of the enterprise support policies contain information on the dates and amounts of each subsidy payment. Further, eachof the program activity databases has the data organized by a unique identifier for the recipient firms, the VAT identification number, which allows the policy data to be linked with the firm-level Istat data. 10
The final database includes the following firm-level information: geographic location of the firm’s legal residence; standard industrial sector (five-digit ATECO 2002); legal form of the enterprise; yearly average total employment (from 2000 to 2003); yearly monetary values of the subsidies received (GGE), sorted by the name and type of program; the number of a firm’s local units; and whether or not the firm is a craft enterprise.
The distribution of incentives by type of enterprise support program
We examine 25 enterprise support programs. Table 4 lists these projects and the corresponding GGEvalue of the incentives paid to the subsidized firms. The individual program with the highest total GGE value of incentives awarded to firms in the Piemonte region in the 2001–3 period was Law 488/92, with €65.4 million, equal to 16.5 percent of the total. 11 The program of Law 266/97, article 14, providing support to enterprises in distressed urban areas, follows with approximately €49.1 million of GGE value of subsidies, equal to 12.4 percent of the total. The subsidies of Law 140/97, R&D aid with automatic eligibility rules, are in third place, with €48.8 million of GGE, or 12.3 percent of the total. 12
Summary of program incentives, Piemonte region, 2001–3.

Notes: Summary statistics are for incentives approved between 1 January 2001 and 31 December 2003 and awarded to firms with establishments in the Piemonte region and with a firm identifier (VAT code) traceable in the Istat-Asia database. All figures are in terms of GGE values.
Because a number of assisted firms were subsidized by more than one program in the 2001–3 period, the actual total is given.
Assisted firms as a percentage of the total number of active firms
Table 5 shows the percentage of assisted firms out of the total number of active firms located in the Piemonte region. From 2001 to 2003, 11.1 percent of all active firms with industrial production activities (Istat ATECO 2002 codes C, D, and E) were assisted under at least one business incentive program. Micro-firms, however, are composed of a large number of sole trader firms (with no employees) engaging in professional services ineligible for public assistance. Ignoring such micro-firms brings the number of assisted firms to much higher percentages. Among firms with 50–249 employees, 63.5 percent of all active firms were subsidized by at least one program during the 2001–3 period, and the percentages are 42.7 percent and 37.5 percent for firms with 250 or more employees and firms with 10–49 employees, respectively.
Share of active firms that received public assistance, Piemonte region, 2001–3 (percent).
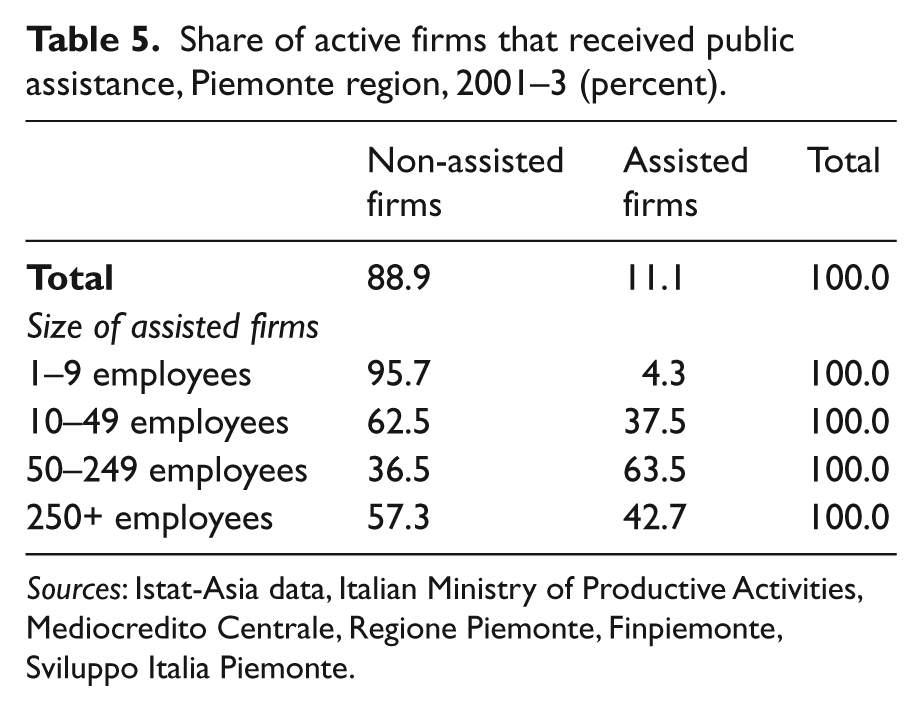
Sources: Istat-Asia data, Italian Ministry of Productive Activities, Mediocredito Centrale, Regione Piemonte, Finpiemonte, Sviluppo Italia Piemonte.
Employment changes per type of incentive and assisted firms
Tables 6–9 contain the descriptive statistics for the 2000–3 employment changes, sorted by the categories of assisted firms based on the economic intensity and type of public assistance that they received and on their initial firm size. 13
Employment change by treatment status and GGE values of the incentives (descriptive statistics).
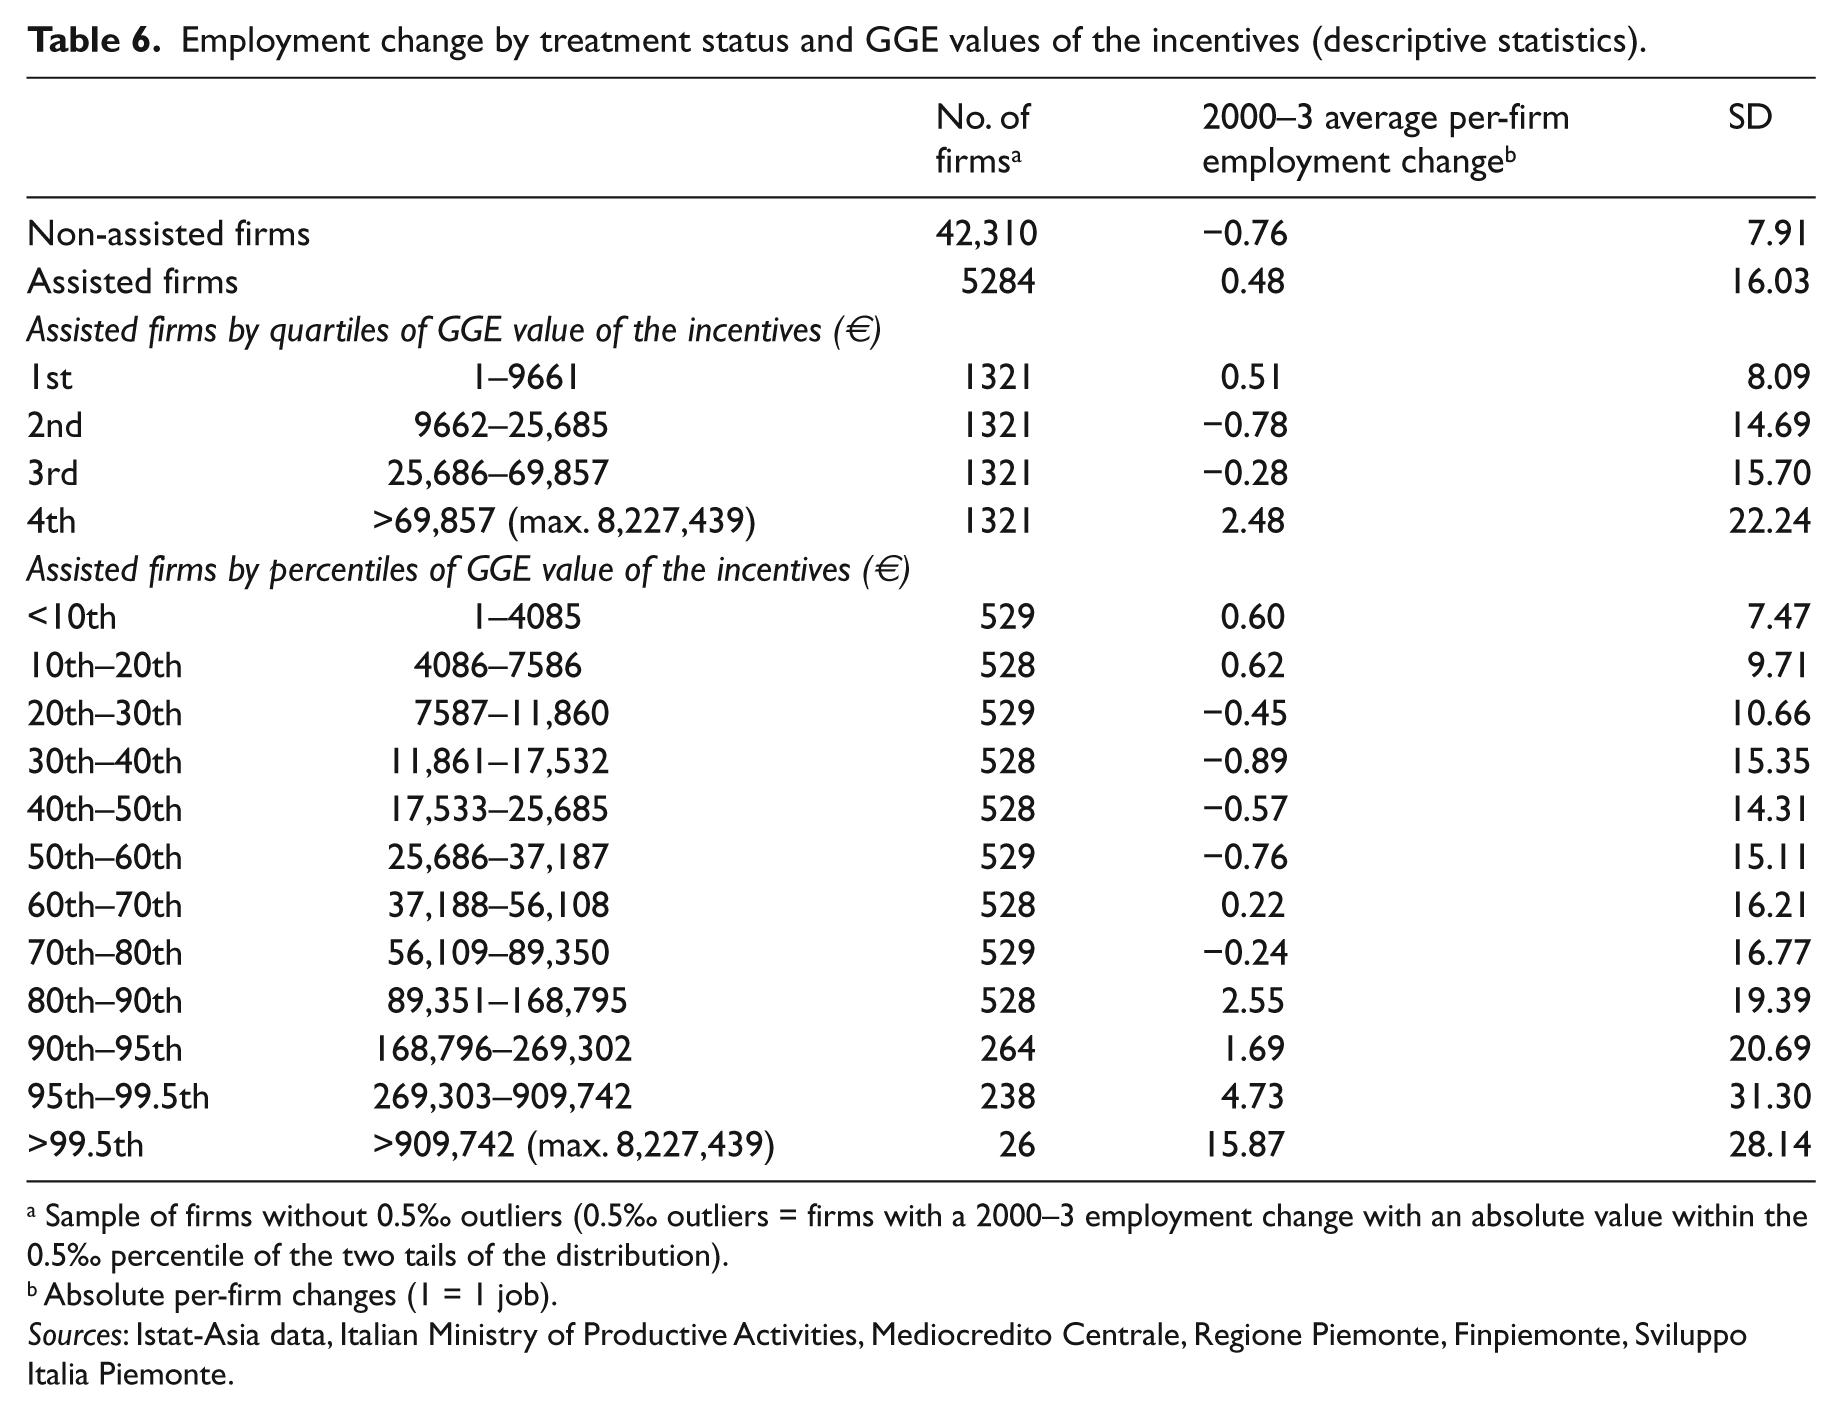
Sample of firms without 0.5‰ outliers (0.5‰ outliers = firms with a 2000–3 employment change with an absolute value within the 0.5‰ percentile of the two tails of the distribution).
Absolute per-firm changes (1 = 1 job).
Sources: Istat-Asia data, Italian Ministry of Productive Activities, Mediocredito Centrale, Regione Piemonte, Finpiemonte, Sviluppo Italia Piemonte.
Employment changes in assisted firms sorted by types of subsidy and GGE values of the incentives (descriptive statistics).

Sample of firms without 0.5‰ outliers (0.5‰ outliers = firms with a 2000–3 employment change with an absolute value within the 0.5‰ percentile of the two tails of the distribution).
Absolute per-firm changes (1 = 1 job).
Sources: Istat-Asia data, Italian Ministry of Productive Activities, Mediocredito Centrale, Regione Piemonte, Finpiemonte, Sviluppo Italia Piemonte.
Employment changes in assisted firms sorted by funding body and types of subsidy.

Sample of firms without 0.5‰ outliers (0.5‰ outliers = firms with a 2000–3 employment change with an absolute value within the 0.5‰ percentile of the two tails of the distribution).
Absolute per-firm changes (1 = 1 job).
Sources: Istat-Asia data, Italian Ministry of Productive Activities, Mediocredito Centrale, Regione Piemonte, Finpiemonte, Sviluppo Italia Piemonte.
Summary of model specifications by number and types of categorical treatment variables.
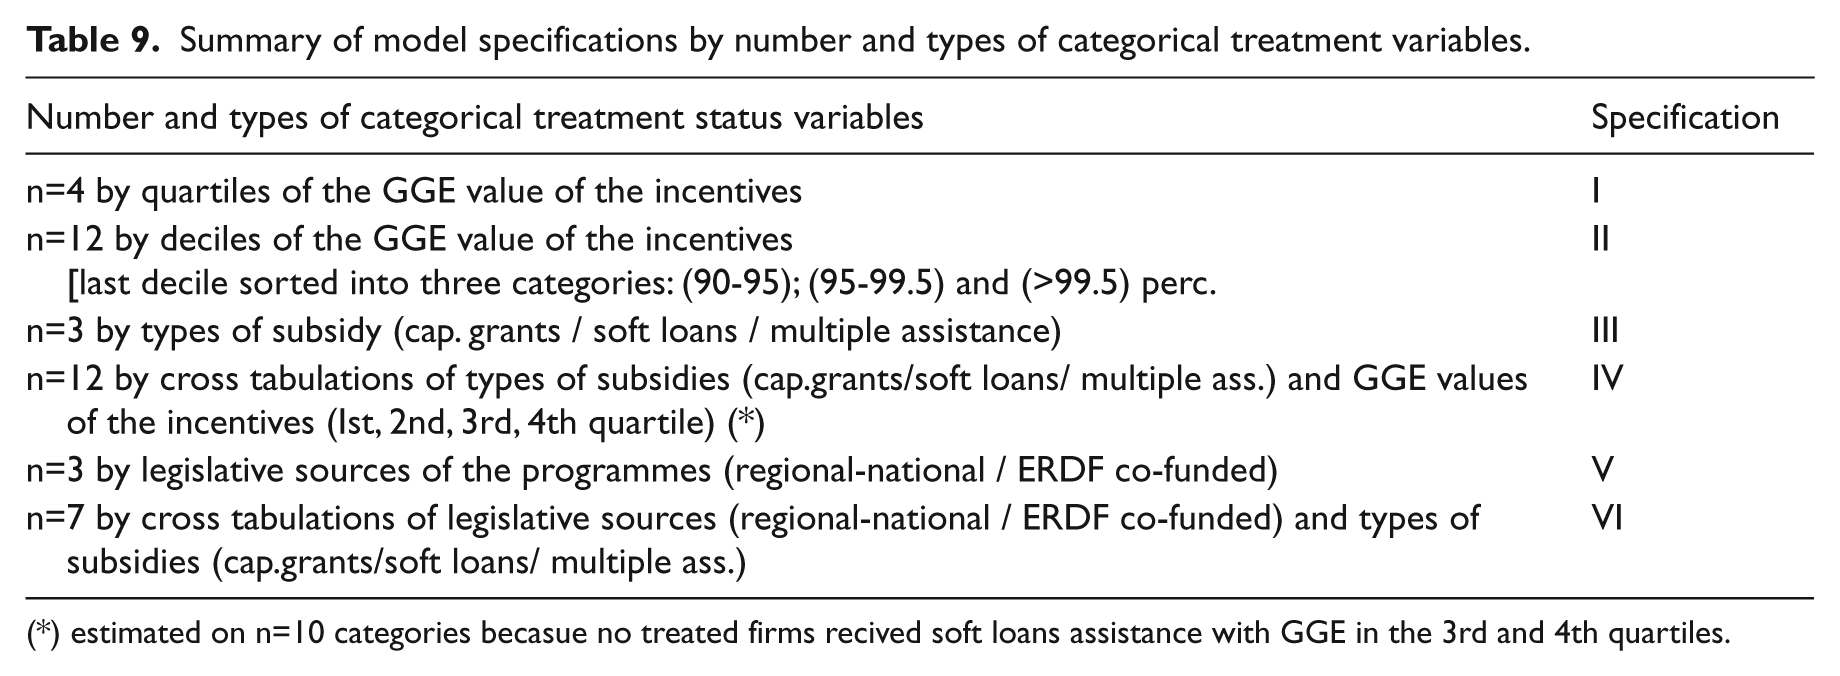
estimated on n=10 categories becasue no treated firms recived soft loans assistance with GGE in the 3rd and 4th quartiles.
Table 6 highlights the 2000–3 14 average per-firm absolute variation in the number of employees separately for assisted and non-assisted firms. To limit the effects of possible measurement errors in employment change figures, 47 outlier firms were excluded from the analysis (of which 35 were non-assisted firms and 12 were assisted firms). These excluded firms experienced either a positive or a negative workforce variation beyond the 0.5 per thousand percentile limit of the 2000–3 employment change distribution.
The group of non-assisted firms in the 2000–3 period experienced an average employment loss of 0.76 employees per firm. In the same period, the assisted firms experienced a positive average employment change of 0.48 employees per firm. The average employment change recorded by the assisted firms is further detailed in the lower section of Table 6, which reports the average changes per category of assisted firms based on the GGE value of the incentives received. Figures reported in Table 6 shows how the most positive average employment change was recorded in the firms that received incentivesof the highest GGE value: +15.9 employees per firm in the category of firms receiving incentives beyond the 99.5th percentile (with more than €909,742 GGE worth of incentives); +4.7 employees per firm in the category of firms with GGE incentives between the 95th and the 99.5th percentile (GGE between €269,303 and €909,742); +1.7 employees per firmin the category of firms with GGE incentives between the 90th and the 95th percentile (GGE between €168,796 and €269,302); and +2.55 employees per firm for firms within the 9th decile (GGE between €89,351 and €168,795).
Table 7 contains descriptive statistics for the 2000–3 employment change experienced by categories of firms defined by both the GGE value and the type of the incentives that they received. The 236 firms assisted exclusively with soft loans, on average, experienced an employment increase of 1.61 employees per firm, whereas the increase recorded in firms assisted solely with capital grants was 0.13 employees per firm. Finally, the 1049 firms assisted by both below-market-rate loans and capital grants experienced an average increase of 1.57 employees per firm.
Table 8 illustrates the 2000–3 per-firm average employment change sorted by funding body. The 4068 firms that received assistance exclusively under the provision of regional/national programs experienced average employment growth close to zero (−0.03 employees per firm). The 456 firms that were assisted solely by ERDF co-funded programs experienced an average increase of almost 1 employee per firm. The cross-tabulations between the funding body and types of subsidy reported in the second half of Table 8 highlight that the difference in the average employment changes between regional/national and ERDF co-funded programs is greatest for capital grants (−0.27 employees per firm for regional/national programs versus +0.81 employees per firm for the ERDF co-funded programs). For multiple assistance (from both capital grants and soft loan subsidies), the difference between regional/national and ERDF co-funded programs is +0.66 employees versus +1.17 employees. For soft loan assistance, in contrast, descriptive statistics highlight a slightly larger employment change related to regional/national programs (+1.68 employees per firm) than ERDF co-funded programs (+1.51 employees per firm).
Next, we turn to the methodological approach used to tease out the impacts of the program interventions by attempting to establish the counterfactual.
Methods
Ideally, counterfactual impact evaluations of enterprise support policies require comparing the pre/post-intervention outcome variation experienced in the group of treated units with an adequate estimate of the outcome variation that would have been experienced in the same treated units in the absence of the program intervention.
The program impact estimates focus on proximate effects, with a typical time-span of two years after the time at which the program-subsidized investments began operating. This is because using rigorous comparison group statistical impact evaluation designs to assess whether business incentives had long-lasting impacts on employment or other economic activity outcomes of the assisted firms is best avoided when the evaluation is carried out with firm-level data. Assisted firms are economic units embedded in anetwork of mutual economic transactions. In thelong run, a possible positive program shock on the employment of each single assisted firm is likely to have enough time to generate subsequent impacts on non-assisted firms as well. Those outcome data become endogenous to the treatment and can no longer be considered unaffected by the program incentives and used to retrieve counterfactual estimates. 15
To assess how much of the actual change in theoutcome variable of the analysis is attributable toeconomic trends and other factors completely independently from the program interventions, it is necessary to use data both on firms that did receive programassistance and on those that did not. The more general identification strategy of comparing outcomes of assisted and non-assisted firms is referred to as ‘comparison group design.’ In comparison group designs, data on non-assisted firms are used as a base to estimate the magnitude of the outcome changes that would have also affected the assisted firms in the absence of the program incentives. Using non-assisted firms is an effective means to help estimate the impact exerted on the outcome variable of interest by better controlling for factors that affect both assisted and non-assisted firms such as general or sectoral economic trends or socio-demographic, behavioral, and institutional changes that are part of the overall economy.
With comparison group design evaluations, if it were possible to analyze groups of assisted and non-assisted firms that are identical to one another, program impact estimates would be retrievable by simply comparing the average pre/post-intervention changes in the outcome variable of interest between the assisted and non-assisted firms. Lacking random assignment into treatment, differences between assisted and non-assisted firms pose a fundamental challenge to the empirical analysis. When the groups of firms differ, the diversity of initial firm characteristics may interact in dissimilar ways with the general economic trends and/or socio-demographic, behavioral, and institutional changes commonly experienced in the region where the assisted and non-assisted firms operate. This variety of interactions could yield changes in the outcome variables that would occur differently between the assisted and non-assisted firms even in the absence of the program intervention, causing bias in program impact estimates (that is, selection bias; see Bartik, 2004, Bartik and Bingham, 1997, and Bondonio, 2000, for a general discussion of ‘comparison group designs’ analyses).
To address such selection bias issues within the general comparison group design approach, the empirical analysis implemented in the paper is an extension of the multiple categorical treatments of the three-step conditional difference-in-difference (CDD) model descried in Ho et al. (2007) and Bondonio (2009).
Step 1
The first step of the model is the creation of a set of vectors containing firm-specific indicators that summarize all of the relevant pre-intervention firm characteristics that may interact with the general economic trends and/or socio-demographic, behavioral, and institutional changes to generate a change (independently from the program interventions) in the employment dynamic for the years subsequent to 2001–3. 16 The vectors of indicators, referred to as propensity scores (PS c ), are obtained, separately for each category c of program interventions considered in the analysis, from a probit regression model yielding the firm-specific predicted probabilities of receiving that particular type of program assistance (for example, Rosenbaum and Rubin, 1983; Heckman et al., 1997, 1998; Bondonio, 2009; Bondonio and Engberg, 2000). The vectors of PS c estimated in the analysis are obtained from the following n + 1 probit equations estimated separately on the sample of firms subsidized by the respective category c of treatment and on the sample of non-assisted firms.
P[T(c = 1) = 1] = Φ (SIZE, PROV, SETT, CRAFT, SINGLE_EST, NEW, VANISH) . . . P[T(c = n) = 1] = Φ (SIZE, PROV, SETT, CRAFT, SINGLE_EST, NEW, VANISH) P[T0 = 1] = Φ (SIZE, PROV, SETT, CRAFT, SINGLE_EST, NEW, VANISH) (1)
where:
T(c) categorical treatment status variable:
= 1 if a firm received a category c treatment;
= 0 if a firm did not receive any treatment;
c{1, 2, . . . n} = set of n treatment categories operationalized differently according to the various model specifications adopted in the analysis (see the subsection on ‘Model specifications’ for additional details):
n = 4 and n = 12 in specifications I and II, respectively (treatment categories by the intensity of the economic value of the incentives [GGE]);
n = 3 in specification III (treatment categories by types of incentive);
n = 12 in specification IV (treatment categories by cross-tabulations of economic intensities and types of incentive); 17
n = 3 in specification V (treatment categories by types of legislative source of the programs);
n = 7 in specification VI (treatment categories by cross-tabulations of the legislative sources of the programs and types of incentive);
T(0) = 1 if a firm did not receive any incentives;
= 0 if a firm did receive any type of incentive;
SIZE = set of 4 binary variables coding whether or not a firm belongs to one of the following size categories: micro-firm (0–9 employees); small firm (10–49 employees); medium-sized firm (50–249 employees); large firm (250 or more employees); 18
PROV = set of 8 binary variables capturing the province of the firm’s headquarters;
SETT = set of 16 binary variables coding the industrial sector of the firms (following the two-digit Istat ATECO 2002 classification);
CRAFT = 1 for craft firms; 19
= 0 for non-craft firms;
SINGL_EST = 1 for single establishment firms;
= 0 for multi-establishment firms;
NEW = 1 for firms that began operating after 2000;
= 0 for firms already in existence during 2000;
VANISH = 1 for firms that ceased operations during the 2000–3 period;
= 0 for firms continuing to operate during the 2000–3 period.
The specific functional form with which the control variables are included in the probit equations (1) is chosen so that the PS balancing property (Rosenbaum and Rubin, 1983) is satisfied, as tested through the Becker and Ichino (2002) procedure.
Step 2
The second step establishes common support between assisted and non-assisted firms. Separately for each of the n treatment categories c considered in the analysis, the firms subsidized by the category c treatment (Tc = 1) having a PS c higher than the 99.5 percentile of the PS c distribution of the non-assisted firms (Tc = 0) are eliminated from the analysis. Finally, the firms that did not receive any type of assistance (T0 = 1) are eliminated from the analysis if their PS0 makes them incomparable to the firms assisted by any type of treatment. 20
This procedure is aimed at eliminating (a) within each category of treatment c, the assisted firms with initial characteristics too unique and non-comparable to those of the non-assisted firms (for example, Bondonio and Engberg, 2000; Greenbaum and Engberg, 2000; Ho et al., 2007) and (b) within the zero treatment category, the non-assisted firms that are not comparable to any of the assisted firms.
Step 3
In the third step, the program impacts for each treatment category c are estimated though a regression design characterized as a CDD model implemented on the sample of comparable firms selected in step 2. In the CDD regression design, the outcome variable is differenced betweenthe post- and pre-intervention time (2003–2000), ensuring that all of the unobserved differences that may exist between assisted and non-assisted firms within each category of treatment are controlled for if they are characterized as fixed effects. The fixed effects are the initial firm characteristics that affect future outcome variable levels in a constant manner over time.
ΔYi = α + ∑cβcTci + ∑dφd SIZE_di + ∑
p
φ
p
PROV_pi + ∑
s
σ
s
SETT_si + pCRAFT
i
+ θSINGLE_EST
i
+ ωNEW
i
+ γVANISH
i
+ϵ (2)
where
ΔYi = 2000–3 absolute employment change for each firm i;
∑cβcTci = set of n treatment status variables specified differently according to the various model specifications described in the subsection on ‘Model specifications’.
Through the inclusion of explicit covariates that express observable firm characteristics in terms of industrial sector (SETT), size (SIZE), province location (PROV), and a binary coding for whether or not the firm is a craft enterprise (CRAFT), single establishment (SINGLE_EST) and started (NEW) or ceased (VANISH) operations during the 2000–3 period, the model is also capable of controlling for the differential impact on the outcome variable between the assisted and non-assisted firms owing to the remaining different initial observable characteristics, even if such attributes are not characterized as fixed effects and they affect future outcome variable levels in a non-constant manner over time. In order to avoid imposing cumbersome linearity or quadratic functional form assumptions, all the control variables of equation (2) (including firm size 21 ) are in the form of binary variables, and different functional forms and interactions are tested through an extensive sensitivity analysis aimed at assessing the degree of volatility of the program impact estimates.
The 2000–3 firm-level employment changes used as the outcome variable of the following model are expressed in terms of absolute changes rather than as percentage changes. This is because the economic rationale of the enterprise support programs is based on producing socio-benefit outcomes at the level of the local economies surrounding the area in which the assisted firms operate. As a result, the social benefit of each additional job generated by program incentives, relative to what would have happened in the absence of the programs, is to be weighted equally regardless of the size of the firm in which the job is created. Although, from the point of view of assisted entrepreneurs, jobs created in smaller firms represent a larger percentage increase, such an operationalization from the community’s perspective would lead to an unjustifiably larger weight given to the outcomes produced in smaller assisted firms.
Model specifications
As indicated in the previous section, the three-step CDD model of equations (1) and (2) is operationalized through the following specifications (see Table 9):
Specifications I and II: Impact estimates by the economic intensity of the incentives
Two model specifications are adopted in order to estimate the impacts of the economic value of program incentives. Specification I contains 4 binary treatment variables based on the quartile thresholds of the distribution of the GGE values of the incentives received by the assisted firms. 22 Specification II contains 12 binary treatment variables based on the decile thresholds of the distribution of the GGE values of the incentives, with the last decile containing assisted firms with ‘outlier’ GGE values, further divided into three categories: 90–95 percentile thresholds; 95–99.5 percentile thresholds; and above the 99.5 percentile threshold. 23 Impact estimates obtained from specification I highlight the absolute per-firm employment variation attributable to the programs’ incentives, separately estimating the differential impacts of four different categories of the economic value of the incentives. Similarly, specification II yields the programs’ employment effects by separately estimating the differential impacts of 12 categories of the economic value of the incentives.
Specification III and IV: Impact estimates by types of incentive and by cross-tabulations of the types of incentive and economic intensity
The differential impacts of the program interventions resulting from the different types of incentive awarded to the assisted firms are estimated through specifications III and IV.
Specification III contains 3 categorical treatment variables in order to separately estimate the employment impact of the incentives under the form of capital grants, 24 soft loans and a combination of both. Specification IV contains 12 categorical variables aimed at estimating the different employment impacts of the various types of incentive, simultaneously controlling for the economic value of the incentives (as expressed by the GGE). This is achieved by generating each categorical treatment variable from cross-tabulating four different degrees of the economic value of the incentives with the distinction between capital grants, soft loans, and capital grants plus soft loans. 25
Specification V and VI: Impact estimates by types oflegislative source of the programs and by cross-tabulations of funding body and types of intensity
Thepossible differential impacts due to the fundingbodies are estimated in specifications V and VI. Specification V contains 3 categorical treatment variables for whether or not the assistance is offered by national/regional programs, 26 by ERDF co-funded programs, or by at least one national/regional program and one ERDF co-funded program. Specification VI includes 7 categorical treatment variables that are introduced in the analysis in order to estimate the differential impacts of national/regional programs versus ERDF co-funded programs, controlling for the types of incentive awarded to the assisted firms. This is obtained by operationalizing the subsidies from the national/regional programs and the ERDF co-funded programs in the form of six cross-tabulations of the legislative sources and the types of incentive awarded (distinguishing between capital grants, soft loans, and multiple assistance from at least one capital grant program and one soft loan program). 27
Results
Table 10 highlights the impact estimates for the different levels of the overall economic value (in terms of GGE) of the incentives received by the assisted firms (model specifications I and II). The results from specification I show that the average employment impact of the programs is 1.87 additional jobs compared with what would have happened without the programs’ incentives in each assisted firm when the per-firm GGE value of the incentives is less than €9661 (within the first quartile of distribution); 1.69 additional jobs per assisted firm when the GGE value of the incentives is between €9662 and €25,685 (second quartile); 3.20 additional jobs per assisted firm when the GGE value of the incentives is between €25,686 and €69,857 (third quartile); and 6.86 additional jobs per assisted firm when the GGE value of the incentives is greater than €69,857 (fourth quartile). All of the impact estimates are statistically significant at the .001 level.
Impact estimates by economic intensity (in terms of GGE) of the subsidies. Dependent variable: 2000–3 per-firm employment change (1 = 1 job).
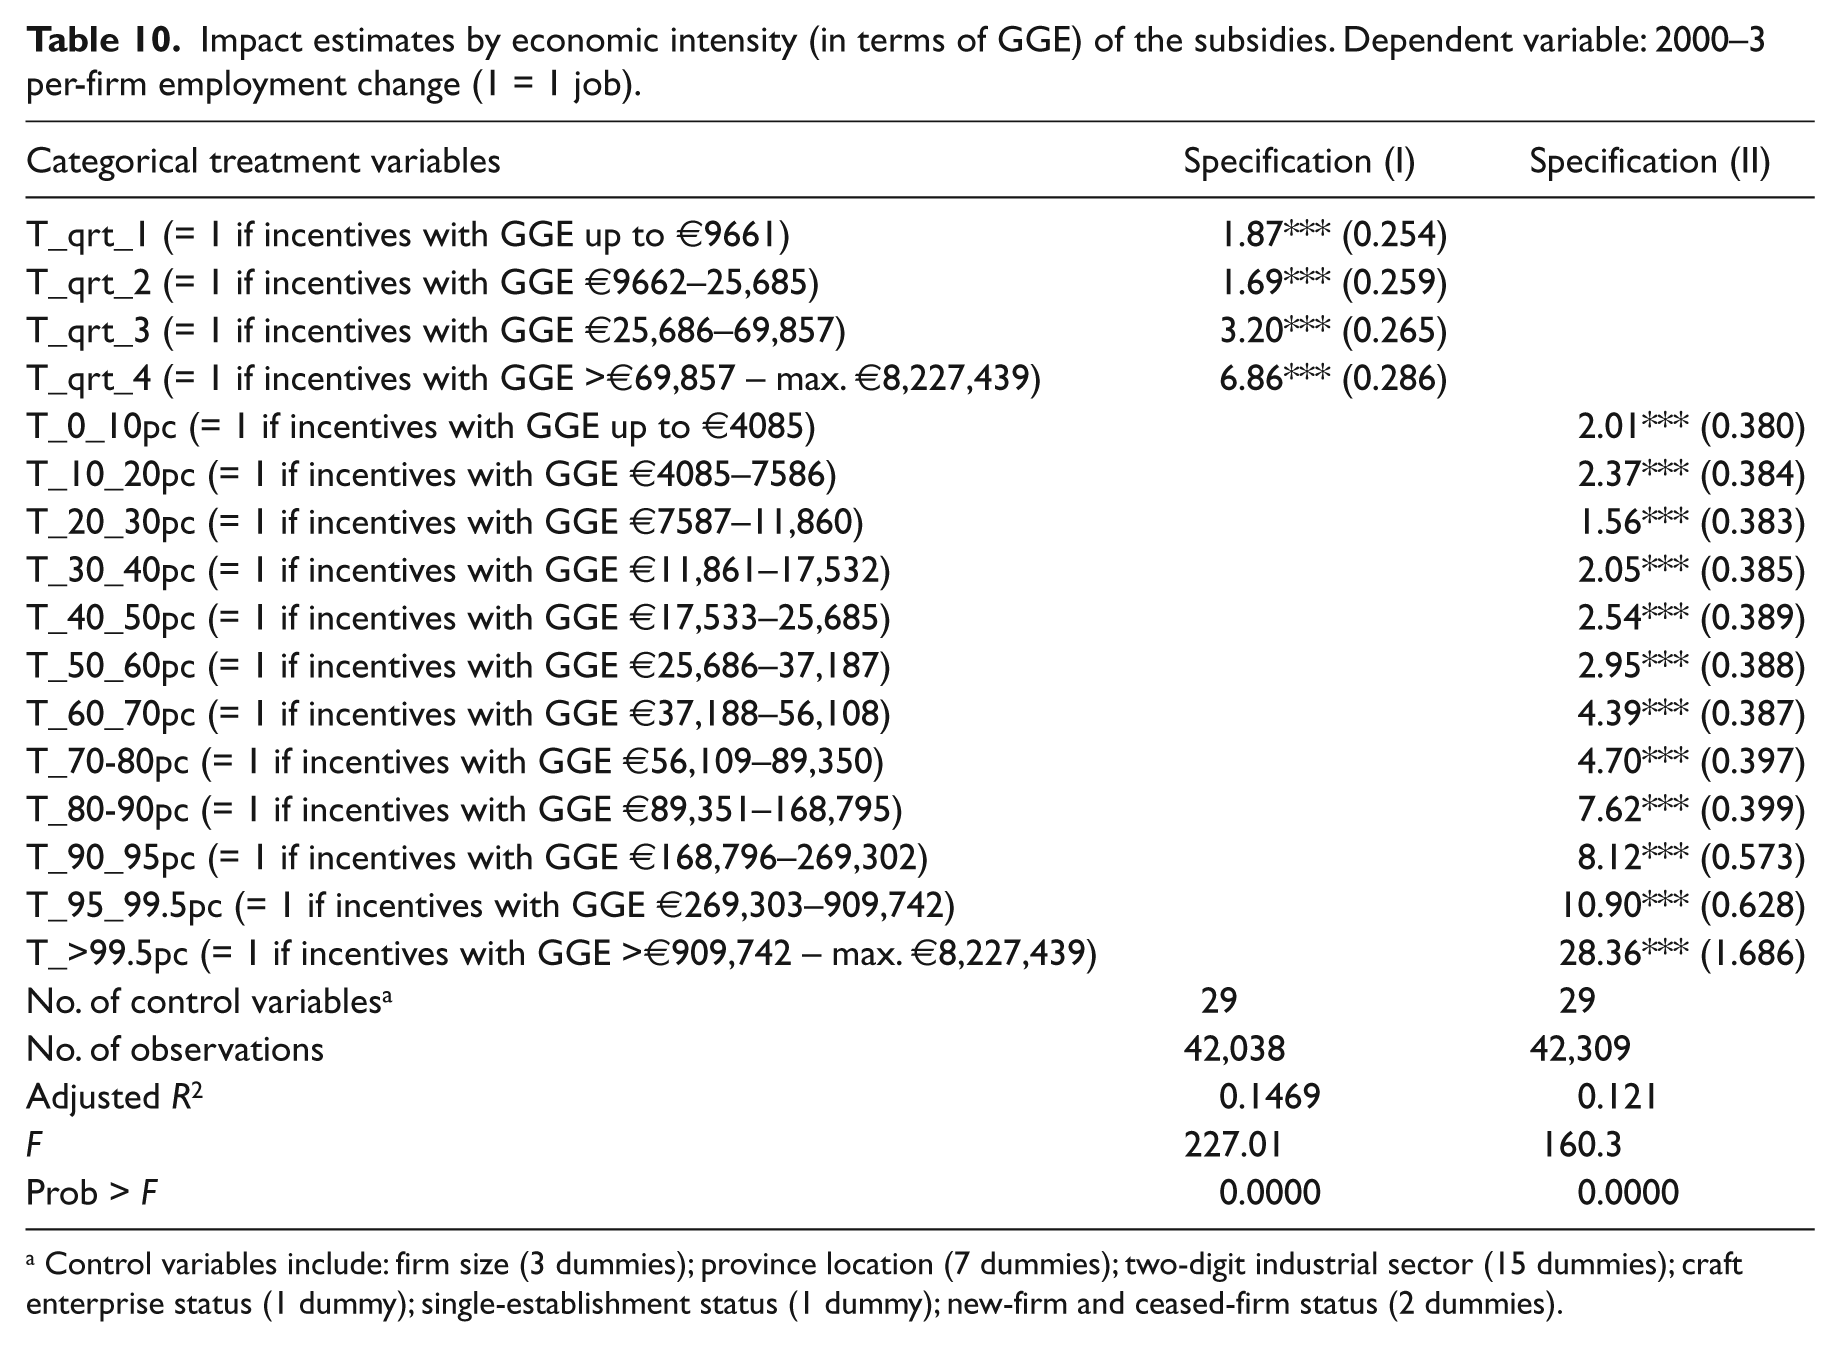
Control variables include: firm size (3 dummies); province location (7 dummies); two-digit industrial sector (15 dummies); craft enterprise status (1 dummy); single-establishment status (1 dummy); new-firm and ceased-firm status (2 dummies).
Based on the impact estimates from specification I, the overall employment impact produced by the incentives awarded to the entire set of 5,284 assisted firms can be summarized as follows:
The €6.5 million spent on incentives with a per-firm GGE value of less than €9661 (first quartile threshold) accounted for a total increase of approximately 2470 jobs compared with what would have happened in the absence of the incentives. The average cost for each job attributable to the incentives is equal to about €2640.
The €21.75 million spent on the incentives with a per-firm GGE value between €9661 and €25,685 (second quartile) accounted for a total increase of approximately 2235 jobs compared with what would have happened in the absence of the incentives, with an average cost for each job attributable to the incentives equal to about €9730.
The €57.3 million spent on the incentives with a per-firm GGE value between €25,685 and €69,857 (third quartile) accounted for a total increase of approximately 4330 jobs compared with what would have happened in the absence of the incentives, with an average cost for each job attributable to the incentives equal to about €13,550.
The €288.9 million spent on the incentives with a per-firm GGE value above €69,857 accounted for a total increase of approximately 9058 jobs compared with what would have happened in the absence of the incentives, with an average cost for each job attributable to the incentives equal to about €31,891.
The results from specification II are very similar to those of specification I and can be summarized as follows:
The per-firm employment impacts of the incentives are confirmed to be the highest in the treatment categories with the greatest GGE value (except for a slight decrease of the employment impact going from the two lowest deciles to the deciles immediately above them; with a sharp increase in the employment impact for the incentives in the highest percentile – GGE above €909,742).
When weighting the employment impacts by the GGE value of the incentives, the average cost for each additional job is again greater the higher the economic value (GGE) of the subsidy received by the assisted firms. 28
Impact estimates by types of subsidies
Table 11 summarizes the estimated impacts sorted by the types of incentives. The coefficient estimates from specification III separately highlight the number of additional jobs generated on average by each treated firm belonging to three different categories: firms assisted solely by soft loans; firms assisted solely by capital grants; firms assisted by at least one soft loan program and one capital grant program. When a treated firm receives capital grant assistance, the per-firm average employment gain compared with what would have happened in the absence of the incentives is estimated to be on average 2.83 additional jobs, all else equal. This compares with an estimate of 2.44 additional jobs on average if a treated firm receives only soft loans and an estimate of 4.16 additional jobs for treated firms receiving assistance from at least one capital grant program and one soft loans program.
Impact estimates by types of subsidy. Dependent variable: 2000–3 per-firm employment change (1 = 1 job).
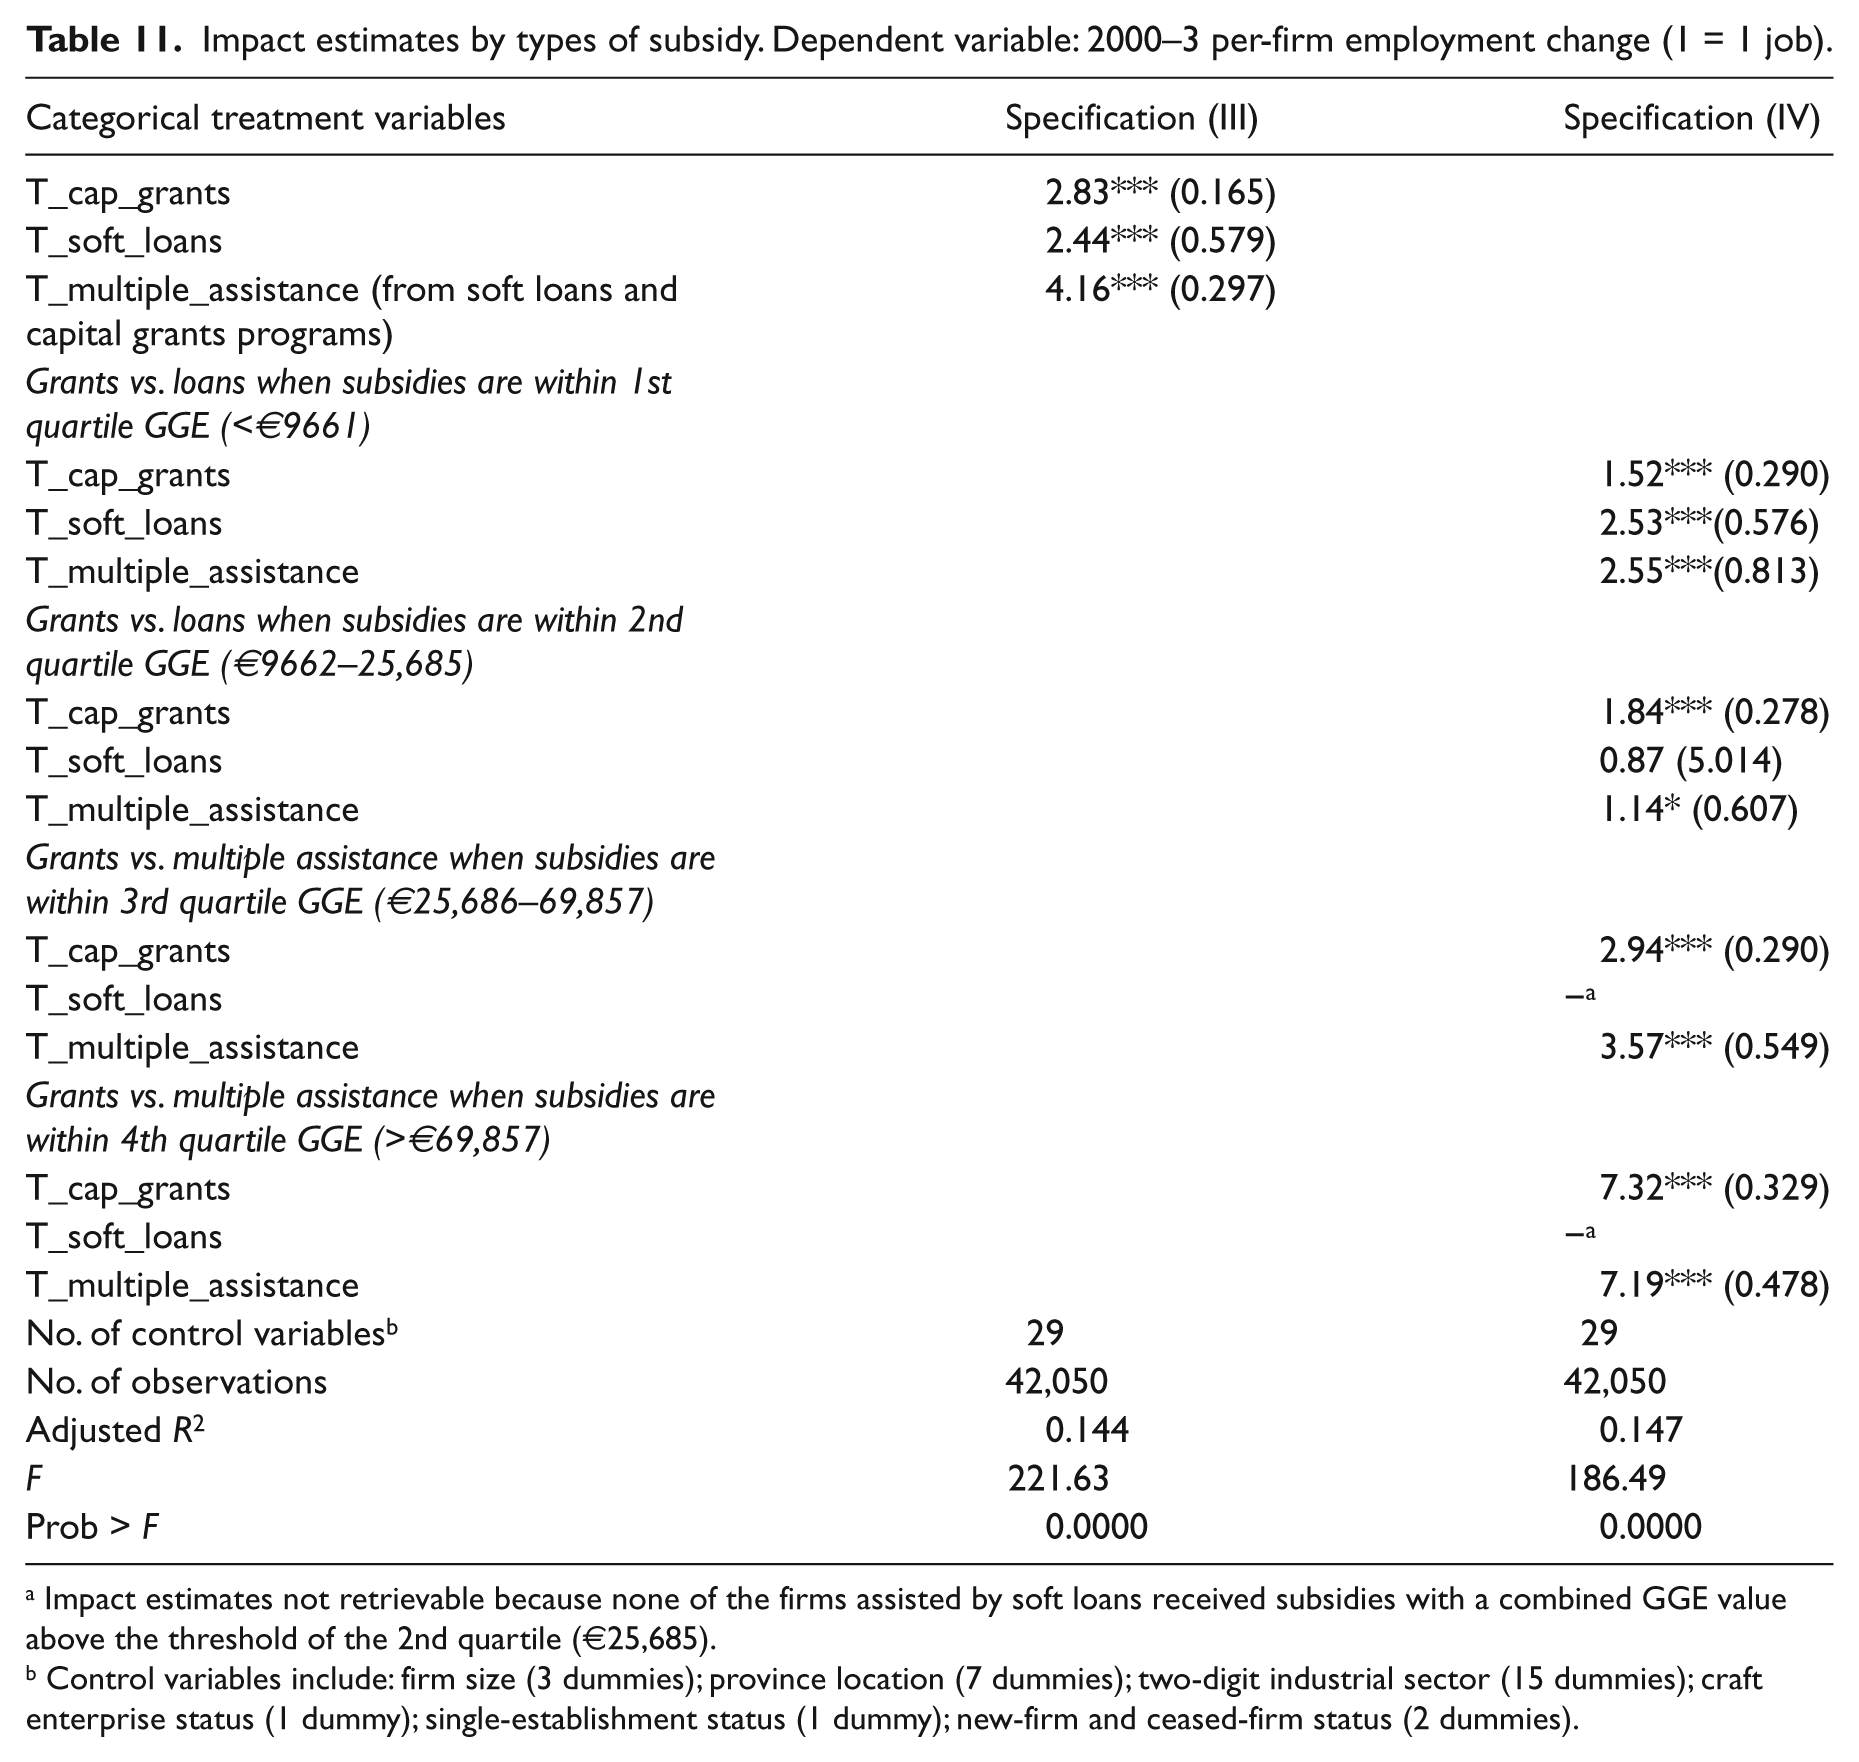
Impact estimates not retrievable because none of the firms assisted by soft loans received subsidies with a combined GGE value above the threshold of the 2nd quartile (€25,685).
Control variables include: firm size (3 dummies); province location (7 dummies); two-digit industrial sector (15 dummies); craft enterprise status (1 dummy); single-establishment status (1 dummy); new-firm and ceased-firm status (2 dummies).
The results from specification IV, which allows separate identification of the employment impacts for capital grants, soft loans, and mixed types of assistance, controlling for four different intensities of the economic value of the incentives, can be summarized as follows:
When the incentives have a GGE value up to €9661 (first quartile), soft loans generate a per-firm average employment gain of 2.53 jobs compared with what would have happened in the absence of the incentives. This estimate corresponds to an average cost for each job attributable to the incentives equal to €852. Capital grants generate a per-firm employment gain of 1.52 jobs, with an average cost for each job attributable to the incentives equal to €3580. Multiple aid in the form of both soft loans and capital grants generates a per-firm employment gain of 2.55 jobs, with an average cost for each job attributable to the incentives equal to €2351.
When the incentives have a GGE value between €9661 and €25,685 (second quartile), capital grants generate a per-firm employment gain of 1.84 jobs, with an average cost for each additional job equal to €8899. Multiple aid in the form of both soft loans and capital grants generates a per-firm employment gain of 1.14 jobs, with an average cost for each additional job equal to €14,823. 29
When the incentives have a GGE value between €25,685 and €69,857 (third quartile), capital grants assistance generates an average per-firm employment gain of 2.94 jobs, with an average cost for each additional job equal to €14,498. Multiple aid in the form of both soft loans and capital grants generates an average per-firm employment gain of 3.57 jobs, with an average cost for each additional job equal to €12,868.
When the incentives have a GGE value above €69,857 (fourth quartile), capital grants generate a per-firm employment gain of 7.32 jobs, with an average cost for each additional job equal to €29,733. Multiple aid in the form of both soft loans and capital grants generates a per-firm employment gain of 7.19 jobs, with an average cost for each additional job equal to €30,755. 30
Overall, the results from specifications III and IV highlight that the average employment impact of the programs without controlling for the differences in their economic value is of the same magnitude across the various types of incentive. Soft loans, however, show a greater effectiveness than capital grants owing to the fact that they achieve the same degree of efficacy as capital grants by offering the assisted firms a ‘gift’ (in terms of public money devoted to the incentives) of lesser monetary value than capital grants, resulting in the lower average cost for each additional job attributable to the incentive programs.
Impact estimates by the legislative source of the programs
Table 12 summarizes the impact estimates sorted by the funding body of the subsidies, distinguishing between ERDF co-funded programs and national/regional programs. The results from Table 12 highlight that the average employment impact of the ERDF co-funded programs is not different from that of the national/regional programs (with an average employment impact, in specification V, of +2.62 and +2.59 employees, respectively). This is true also holding constant the mix of capital grants and soft loans (specification VI), with estimated impacts of +2.47 and +2.56, respectively, for capital grants assistance and +2.49 and +2.39, respectively, for soft loan assistance. Although the average per-firm economic value of the incentives is about the same for the ERDF co-funded and the national/regional programs, the economic value is much higher for the firms that received cumulative assistance from at least one ERFD co-funded program and one national/regional program. For this reason, the estimated impact of the subsidies received by a combination of ERDF co-funded and national/regional programs is +6.33 in specification V and +6.21 in specification VI.
Impact estimates by legislative source of the programs. Dependent variable: 2000–3 per-firm employment change (1 = 1 job).
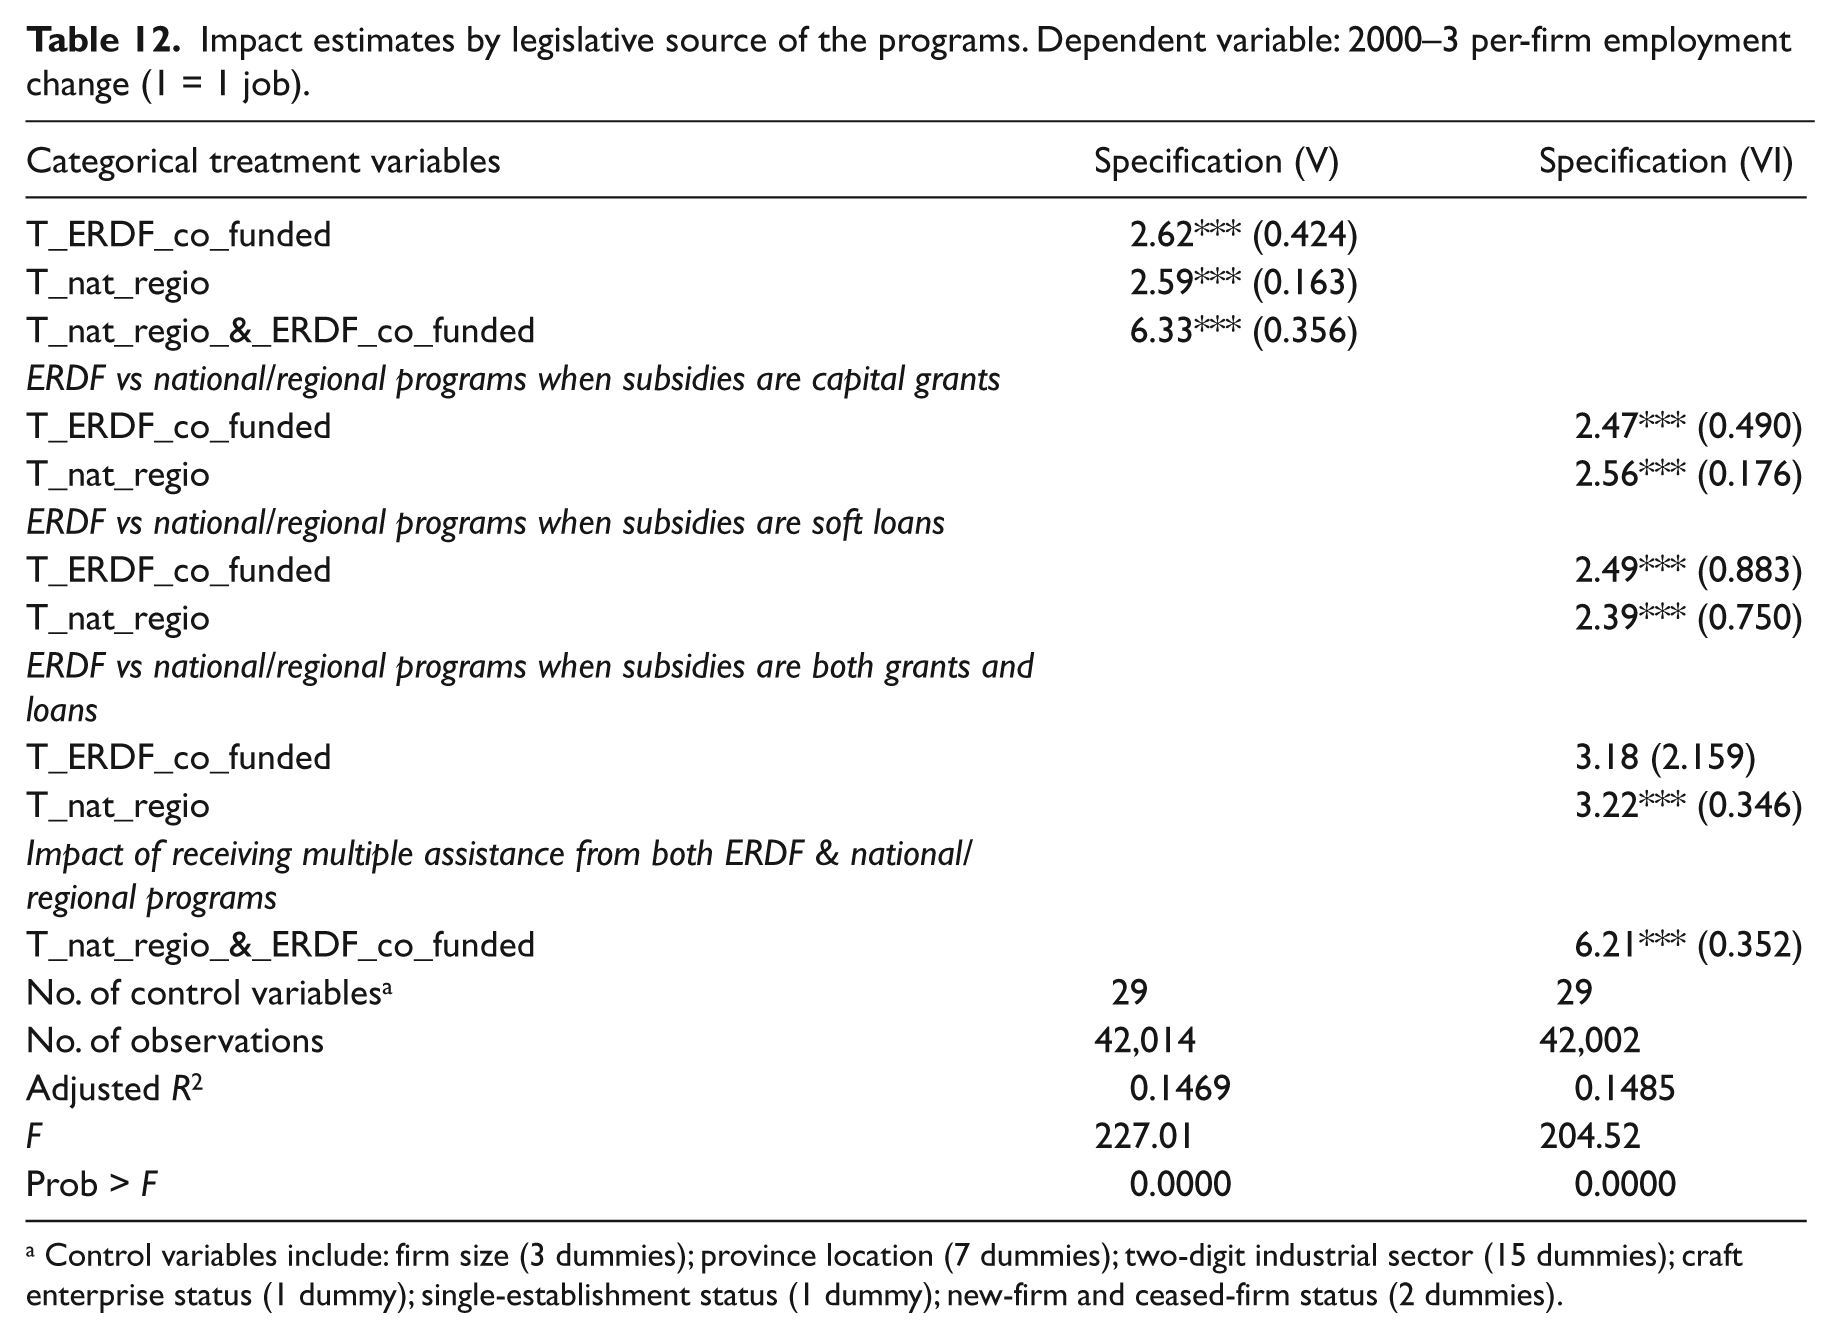
Control variables include: firm size (3 dummies); province location (7 dummies); two-digit industrial sector (15 dummies); craft enterprise status (1 dummy); single-establishment status (1 dummy); new-firm and ceased-firm status (2 dummies).
Results of the sensitivity analysis
The robustness of the employment estimates is tested through an extensive sensitivity analysis composed of a series of additional model specifications.
The alternative specifications are obtained through different choices in selecting the functional forms by which the independent variables are inserted in step 3 of the empirical model (equation 2). For the sake of brevity, it is not possible to describe the detailed results of all the different specifications included in the sensitivity analysis, but the complete results are available upon request. Overall, the empirical evidence yielded by the entire set of specifications included in the sensitivity analysis is in close agreement with the results presented.
Caveats and limitations
Two main limitations should be noted. First, the sample of firms assisted with soft loan incentives is much smaller (236) than the sample of firms assisted with capital grants (3999) and the sample of firms that received capital grants in conjunction with soft loan assistance (1049). The small sample size does limit, to a certain extent, the external validity of the results related to the differential impacts among the various forms of assistance. Moreover, when computing the economic value of the soft loan assistance, it was not possible to take into account the share of the cost related to the possible loan defaults in some of the subsidized firms. Inclusion of any defaults would increase the per-firm costs.
The second limitation is that pre-intervention employment changes were not controlled for. Such changes for both treated and non-treated firms would constitute a very useful observable control to include in the empirical conditional difference-in-difference model used to yield the programs’ impact estimates. However, as is commonly encountered in counterfactual impact evaluations of enterprise support policies, the pre-intervention employment trends cannot be included in the analysis because the employment changes prior to 2001 were likely affected by previous rounds of unobservable incentive payments related to the number of incentive programs that were in existence before 2001.
Conclusions
This paper exploits a unique firm-level database formed by merging reliable administrative data on firms’ demographic and employment activity from the Italian National Institute of Statistics with the programs’ activity archives on a complete set of coexisting ERDF co-sponsored programs and other independent national and regional incentives available to all active firms with industrial production in a large northwestern region of Italy.
Analyzing the entire spectrum of these coexisting programs (8 of which are national, 10 regional and 7 with ERDF co-sponsoring) first enables the estimation of how the entire set of public assistance available within a NUTS 2 region of the EU is divided between assisted firms of different characteristics as well as the estimation of the percentage of all active firms receiving public assistance. This type of preliminary information is very important to policymakers and yet is very rarely available throughout the EU owing to the lack of integration between the different single-program activity archives and reliable administrative data on the entire population of active firms. In this regard, the main findings produced by the Italian data analyzed in this paper can be summarized as follows:
Assisted firms quite often rely on multiple sources of incentives. For example, about 60 percent of all medium-sized enterprises receiving public assistance in the 2001–3 period were awarded incentives from two or more programs. Among all size classes of assisted firms, approximately 38 percent received assistance from several programs.
The overall percentage of active firms receiving public assistance is remarkable. During the 2001–3 period alone, 63.5 percent of all active medium-sized enterprises were subsidized with incentives from at least one public program, and 42.7 percent of large firms and 37.5 percent of small enterprises (excluding micro-firms with fewer than 10 workers) received subsidies.
Next, by developing a statistical counterfactual impact evaluation model, this paper exploits the extensive Italian firm-level database to yield employment estimates for the comparative effectiveness of the different forms of incentive. Such employment impact estimates are retrieved by disentangling the impacts of different values of both the economic intensity of the program assistance and different forms of assistance, distinguishing between capital grants and below-market interest rate (‘soft’) loans.
Results from the impact evaluation analysis highlight that the absolute per-firm employment effects of capital grants are increasingly higher the greater the economic value of the incentives awarded to each assisted firm. When the per-firm employment increases are compared with the costs of the subsidies, however, the incentives with the highest per-firm economic value yield employment impacts with a much higher cost per each additional new job generated compared with the estimated counterfactual status of incentives with a lower economic value. This empirical evidence is robust to replicating the analysis with alternative functional forms and points toward diminishing employment returns of the per-firm public money spent on capital grant assistance.
Estimating different impacts for ERDF co-funded programs versus national/regional programs yields no significant different between the average employment returns of the two types of programs. During the 2000–6 programming period, ERDF co-funded subsidies in the Objective 2 areas of Italy were planned with a focus on supporting innovation and R&D expenditures. However, the results support anecdotal evidence suggesting that the practical implementation procedures for the ERDF co-funded programs failed to effectively restrict the available support solely to expenditures connected with innovative investment projects and/or R&D activities. Indeed, if such a prevailing focus were actually maintained, the employment return of the ERDF co-funded programs would be likely to be lower than that of the national/regional programs that were planned to subsidize, on average, investment projects with much stronger ties to additional employment and with much less potential to generate substitution of labor with more capital-intensive production processes.
Finally, disentangling the program impacts of the different types of incentive, the results show that the average per-firm employment effects of soft loans assistance are similar to those of capital grants assistance, which include fiscal bonuses and interest rate payment grants with no collateral guarantees. However, taking into consideration that soft loans assistance bears a much lower cost in terms of public money devoted to the subsidies than does capital grants assistance, with much lower GGE subsidy levels, the impact estimates indicate that soft loans possess higher employment effectiveness than capital grants. This finding is reflected in a higher per-firm employment return from soft loan assistance than from capital grant assistance, holding constant the GGE value of the incentives awarded to each assisted firm. Thus, for each additional new job generated by the programs, soft loan assistance involves a lower cost compared with capital grant assistance. Such empirical evidence points toward emphasizing soft loan assistance rather than capital grants to support small and medium-sized enterprises. This is possibly owing to the fact that credit market imperfections might temper the efforts of obtaining full funding for many viable investment projects of small and medium-sized enterprises. This is also in spite of the fact that loan assistance leaves the firms more highly leveraged.
By examining the multiple forms of assistance available to firms, this paper not only contributes to the program evaluation literature in general and adds to the small number of counterfactual-based evaluations of ERDF spending, but it also contributes to the broader discussion of the role of policy that addresses regional inequities. As Storper (2011) recently laid out, there can be tradeoffs between equitable distributions of economic activity across Europe and economic efficiency. This paper shows that incentives such as soft loans can help redistribute business activity in a more cost-effective manner, should that redistribution be deemed economically or socially desirable.
Footnotes
1.
In the case of enterprise zones in the United States, such comparative evaluation studies provided valuable empirical evidence on the specific policy features (among the heterogeneous state-specific policy designs) that were more effective in boosting employment and other proximate business activity indicators (for example, Engberg and Greenbaum, 1999; Peters and Fisher, 2002; Greenbaum and Engberg, 2004; Bondonio and Greenbaum, 2007).
2.
This is not the case for the Girma et al. (2007) and  papers, which were able to exploit a database covering the entire set of lump-sum grants awarded to industrial plants in Ireland.
3.
In , data were geographically aggregated at the province level, with units of observation operationalized as province–sector cross-tabulations. At such an aggregated level, treated units of observation (i.e. Obj. 2 areas) and non-treated units of observations (i.e. non-Obj. 2 areas) were eligible for the same assistance provided by the platform of national and regional incentives available without any specific geographical targeting. Therefore, the hypothesis that treated and non-treated units were assisted in comparable ways by the programs not included in the analysis is more plausible.
4.
The Piemonte region has approximately 4.2 million residents, 1.8 million of whom have stable jobs.
5.
Excluded from the analysis are a small number of programs for which data on the incentive payments were not provided by the public authorities in charge of managing the subsidies.
6.
As a consequence, the employment recorded in 2000 is the appropriate reference for the pre-intervention measure, and 2003 is the appropriate time (as also explained in the ‘Methods’ section) at which to measure the post-intervention outcome in order to capture the proximate effects (in terms of space, time, and industry) of the programs.
7.
Formally, the soft loan GGE benefits are computed following the specifications indicated in Annex I of the Guidelines on National Regional Aid, Official Journal of the European Communities 98/C 74/19, 1998.
8.
Istat-Asia is formed by using administrative data on firms’ demographic, employment and sales information that is provided by a number of Italian national agencies. Istat-Asia considers a firm to be ‘active’ if it continues to remit the mandatory social security payments for employees in a given year.
9.
ATECO 2002 is the latest standard industrial classification produced by Istat.
10.
The linkage between the information on the programs’ incentives and Istat-Asia was performed on a transformation of the data that ensured confidentiality by dropping any reference to the names, exact addresses and corporate status of the firms. The actual linkage between the program incentive information and Istat-Asia was performed by Istat based on a transformation of firms’ VAT identification number into a unique firm-specific anonymous code. To further ensure preservation of the confidentiality of the data, the industrial sector coding of the firms was aggregated at the two-digit level and all of the incentive payment information was grouped by the type of program intervention, dropping any reference to the specific program incentive names. The linkage between the programs’ incentives archives and Istat-Asia was performed thanks to a research contract with Regione Piemonte and a joint research agreement between Istat and the European Commission (DG Regio). We thank Michelangelo Filippi (R&P and Regione Piemonte) and Marco Ventura (Istat) for supervising and processing the data linkages.
11.
This excludes the portion of the program administered by the Italian Ministry of Education, University and Scientific Research, which focused on supporting R&D projects and research centers.
12.
Not surprisingly, in the programs with the highest volume of GGE subsidies are those providing capital grant assistance. This is because the computation of the GGE value for the repayable soft loans is based solely on the net present value of the differential between the hypothetical flow of the market-rate interest rate payments on the assisted loan and the actual flow of interest rate payments at the discounted rate.
13.
It should be made clear that such descriptive statistics do not represent in any way the actual impact estimates of the employment effects of the program. Indeed, the employment changes highlighted in this section could have been caused by many economic changes and factors totally independent of the programs interventions. To infer the actual employment impacts due to the program incentives, such descriptive statistics have to be compared with credible estimates of the counterfactual changes. Results from the next sections of this paper will highlight such counterfactual empirical evidence.
14.
For new firms, this variation is the difference between 2003 and the year in which the firms started operating.
15.
Estimating the impact of enterprise support policies in terms of long-run macroeconomic or employment benefits for an overall province/regional/state economy could be attempted using regional macroeconomic simulation (for example, REMI – Fan et al., 2000; HERMIN – Bradley et al., 1995, 2003; QUEST – Roeger, 1996, Ratto et al., 2008). This is a viable evaluation option when the importance of the economic outputs of the assisted firms is not disproportionably smaller than the size of the local economy and the background elasticity parameters of the simulation model can be adequately tested and supported by convincing evidence. Even in such cases, however, analyses with regional macroeconomic simulation models should be performed only after having previously estimated (with a rigorous counterfactual approach based on micro-data) the program impact on proximate firm-level outcomes. This is because the set of multipliers used by regional macroeconomic models should not be applied directly to the measures of program activity, such as the entire volume of jobs or investments generated by the assisted firms. Instead, they should be used to measure the number of additional jobs or new investments attributable to the assisted firms compared with what activity would have been generated had the program incentives not been offered.
16.
Past employment growth is excluded from this list of pre-intervention firm characteristics because unobserved previous rounds of the subsidies (with program policies very similar to those currently investigated in the analysis) were in place in the years before the intervention. For this reason the pre-intervention firms’ employment growth has to be considered potentially affected by the same types of program for which impact estimates are retrieved in the analysis and has to be excluded from the control variables of the model because of strong endogeneity concerns.
17.
As also specified in the subsection on ‘Model specifications’, no treated firms can be found in the treatment categories of soft loan assistance and GGE values of the incentives in the third and fourth quartiles. As a result, the actual number of categorical treatment variables included in specification IV is 10.
18.
Firm size is operationalized through three categorical binary variables in place of a linear or quadratic functional form for the following reasons: (a) market trends and economies of scale that may differentially affect the future employment growth of firms of different initial size may not be a monotonic function of the number of employees; (b) the vast majority of Italian eligibility rules for public subsidies distinguish applicant firms by three size categories: small firms (fewer than 50 employees); medium-sized firms (50–249 employees); and large firms (250 employees or more).
19.
Additional dedicated public assistance may be available for craft firms.
20.
The non-assisted firms (T0 = 1) are eliminated if their PS0 is higher than the 99.5 percentile of the PS0 distribution of the entire group of firms receiving any form of assistance (T0 = 0).
21.
Firm size is operationalized through three categorical binary variables in place of a linear or quadratic functional form for the same reasons as explained in note 18.
22.
1st quartile (<€9661 GGE); 2nd quartile (€9661–25,685 GGE); 3rd quartile (€25,686–69,857 GGE); 4th quartile (>€69,857 GGE).
23.
1st decile (<€4085 GGE); 2nd decile (€4086–7586 GGE); 3rd decile (€7587–11,860 GGE); 4th decile (€11,861–17,532 GGE); 5th decile (€17,533–25,685 GGE); 6th decile (€25,686–37,187 GGE); 7th decile (€37,188–56,108 GGE); 8th decile (€56,109–89,350 GGE); 9th decile (€89,351–168,795 GGE); 90th–95th percentile (€168,796–269,302 GGE); 95th–99.5th percentile (€269,303–909,742); >99.5th percentile (>€909,742 GGE).
24.
The capital grants category also includes fiscal bonuses, which are non-refundable contributions to pay for interest rate expenses that do not offer any additional collateral guarantee to the underlying loan.
25.
26.
The regional program category includes the former national programs devolved to the regional government.
27.
Additional cross-tabulation by the intensity of the economic value of the incentives is avoided in specification VI because, once the incentives are separated between capital grants and soft loans, no significant differences are in place between the average (firm-level) economic intensity of the incentives of national/regional programs and that of the ERDF co-funded programs.
28.
To correctly interpret these results, it is important, once again, to keep in mind that the economic value of the incentives (expressed in terms of GGE) does not coincide with the total value of the subsidized investment made by the assisted firms. As a result, the average cost for each additional job attributable to the incentives should not be interpreted as the volume of the additional investments required to generate an additional job. Moreover, the economic value (in terms of GGE) of all of the incentives awarded as soft loans is generally quite low. Receiving incentives with an economic value in the lowest percentiles is therefore strongly correlated with the receiving of soft loans instead of capital grants. Because of this correlation, the impact heterogeneity across the different categories of economic value of the incentives should be considered as affected not only by the different monetary values of the incentives but also by the different types of assistance (soft loans versus capital grants). This employment impact heterogeneity across different types of assistance is specifically highlighted in the results summarized in .
29.
For such incentives with GGE values within the 2nd, 3rd and 4th quartile of the distribution, it is not possible to identify the employment impact of the soft loans. This is because, in all the program activity data used in the analysis, the GGE values of such incentives are always below the threshold of the 1st quartile (€9661), with the exception of three cases with a GGE value within the 2nd quartile threshold (€25,686).
30.
As already mentioned, it is important to emphasize that the differential impact estimates obtained for the various types of incentive are obtained controlling for the economic value of the subsidies operationalized as the cost to the public of the incentives (GGE) and not in the form of the total financing awarded to the assisted firms. In the case of soft loan incentives, it is worth reiterating that the GGE value is largely inferior to the total amount of financing received by the assisted firms for their subsidized investments.