



Abstract
Entrepreneurial ecosystem is the interacting socio-economic environment that facilitates entrepreneurs to start and develop their enterprises. A vibrant and supportive entrepreneurial ecosystem is necessary for the start-up and growth of an enterprise. The entrepreneurial action would largely depend on the perception of entrepreneurs about the ecosystem. In this context, a study was designed to understand the perceptions of actors (entrepreneurs) and observers (non-entrepreneurs) on various components of the entrepreneurial ecosystem. Data for this study were collected from 296 entrepreneurs and 315 non-entrepreneurs from India, who responded to a 77-item questionnaire by giving their ratings of various aspects of the ecosystem on a 5-point scale. Findings of the study showed that perceptions of the entrepreneurial ecosystem were significantly different for most of the subgroups. Most notable among these differences was those between entrepreneurs and non-entrepreneurs, where the mean scores on all dimensions were found to be significantly higher for non-entrepreneurs than for entrepreneurs except for entrepreneurial capability which was found to be higher for entrepreneurs. Hence, the hypothesis of actor–observer bias in the perceptions of entrepreneurs and non-entrepreneurs is supported.
Keywords
Introduction
The concept of actor–observer bias captures the possible differences in the explanation of similar situations by actors and observers. There can be many differences in the perceptions of actors and observers because of the differences in their attributions and judgements (Jones & Nisbett, 1971), self-perceptions (Libby, Shaeffer, Eibach, & Slemmer, 2007) and the intensity of their emotional reactions (Hung & Mukhopadhyay, 2012). The perceptions and behaviour of actors and observers change based on their experiences, personality, causal attribution and the situation they are in.
The actor’s explanation of their own behaviour is likely to be different from the way an observer explains the same behaviour (Finney & Helm, 1982; Malle, 2006). This may be because of the lack of sufficient information an observer gets about the actor’s situation or because of the biased perception. The actors tend to justify their own behaviour by giving more weightage to situational causes, whereas observers tend to attribute the behaviour to the actor’s dispositional (internal) causes (Wilson, Levine, Cruz, & Rao, 1997). Jones and Nisbett (1971) proposed the hypothesis that ‘actors tend to attribute the causes of their behaviour to stimuli inherent in the situation, while observers tend to attribute behaviour to the stable dispositions of the actor’ (p. 93). On the other hand, the judgement and confidence of independent observers on the probability of decision success and effectiveness will be higher than that of those who are actually into implementing the decision (Harvey, Koehler, & Ayton, 1997). The differences between actors and observers are due to different types of interest and involvement they have in the same situation. Actors are directly involved in the situation and experience direct information, whereas observers collect information from their observation of other’s actions. It can also be a form of ‘self-serving bias’ where the actors attribute the negative outcomes to the situational factors and positive outcomes to one’s own actions. Observers, on the contrary, tend to blame the actors for the negative outcomes of their actions and attribute the actors successes to external factors.
The present study is an attempt to understand the perceptual differences, if any, between entrepreneurs and non-entrepreneurs in terms of their views on the entrepreneurial ecosystem, also called the entrepreneurial framework conditions (EFCs) in some studies [e.g., the Global Entrepreneurship Monitor (GEM) studies, as reported on their site:
Actor and Observer Perceptions
The actor–observer bias (Jones & Nisbett, 1971; Malle, Knobe, & Nelson, 2007; Nisbett, Caputo, Legant, & Marecek, 1973; Watson, 1982) explains the differential attributions of the causes of behaviour and the context of one’s behaviour. As pointed out above, the perceptions of the environment by people in different roles may be different. In other words, actors may explain their own behaviour differently from the way observers would explain that behaviour (Malle, 2006). According to Dai, Dong, and Wyer (2012), actors conform but observers react to their environments. These authors further explained that actors conform by focusing their attention on the goal to which their synchronous behaviour is directed, and so may develop a ‘copying-others’ mind-set that generalises to later situations, whereas observers react by focusing on the actors’ behaviour independently of the goal to which it pertains. According to Malle et al. (2007), the observers try to make sense of other people’s behaviour, while the actors try to make sense of their own behaviour. Such observations by other authors are in conformity with the classic actor–observer asymmetry hypothesis proposed by Jones and Nisbett (1971), who stated that ‘there is a pervasive tendency for actors to attribute their actions to situational requirements, whereas observers tend to attribute the same actions to stable personal dispositions’ (p. 80).
As Dong, Dai, and Wyer (2015) have explained, people who are engaging (actor) in synchronous behaviour, that is, behaviour that matches others’ actions in time (Hove & Risen, 2009) can induce a more general disposition to copy others, which increases the tendency to conform to others’ preferences in an unrelated choice situation; and people who are observing others performing synchronous behaviour can induce psychological reactance and decrease conformity to others’ preferences. Hung and Mukhopadhyay (2012) found that actor’s and observer’s perspectives influence emotions. Actors are more likely to think about situational circumstances and observers are more likely to think about how others might evaluate them. The classic actor–observer bias suggests that participants who recall an obligation situation from the perspective of the message source (observer) will score more highly on this difference index than will participants who recall an obligation situation from the perspective of the target (actor) (Wilson et al., 1997).
It is interesting to note that the actor–observer bias is being examined from a variety of contexts and perspectives such as the self-serving bias, the internality norm, fundamental error, fundamental attribution error, etc. (Deschamps, 1997). The biases in internal and external attribution get inflated in groups than in cases of individuals making judgements on their own (Wallace & Hinz, 2009). Group-based biases in the reverse direction are manifested in the evaluation of groups by the leader, where the leader-member exchange status becomes a potent influence, resulting in more favourable evaluation of the ‘in-group’ as against the ‘out-group’ (Campbell & Swift, 2006). This may be because the ‘in-group’ is perceived as part of the principal actor (the leader), whereas the ‘out-group’ is a mere observer with reference to strategic decisions. Unlike in the case of strategy-making or action-planning, in the context of performance appraisal, the ‘out-group’ becomes the actors, whose performance is being evaluated by the observers (the leader and his ‘in-group’), who would hold the ‘out-group’ responsible for all their failings with hardly any role being attributed to the external factors. Such biased perceptions are a perennial source of irritants in any performance appraisal system where the appraisees are held responsible for their poor performance with no recognition of the constraints posed by external factors, although these biases can be mitigated to some extent by training and awareness-creation (Bernardin, 1989). These are examples of role-reversals possible with reference to the same groups and how they can change the nature of the bias.
One other interesting finding on the actor–observer bias is that occasionally there are cases of the reversal of attributions. For example, in a study of the attributions made about ‘Third World Poverty’, it was found that Australian students (observers) blamed the situation, whereas the Malawians (actors) blamed their own dispositions for their poverty (Carr & MacLachlan, 1998), which indicates a reversal of the traditional pattern of attributions. In a later study on the same issue, Campbell, Carr, and MacLachlan (2001) found that it is the ‘donor-orientation’ among the subjects, which causes the reversal of attribution—with the donors attributing the Malawian poverty to their situation and the non-donors attributing it to the Malawians’ disposition. It is therefore important to recognise the possible influence of such moderating variables in altering the pattern of attribution. One possible hypothesis in the case of entrepreneurs is that the internal locus of control (Chye Koh, 1996; Lüthje & Franke, 2003), which is identified as a dominant characteristic of entrepreneurs (Lüthje & Franke, 2003), may alter the direction of their attributions, so that they would blame themselves (not the ecosystem) for their failures. Therefore, there is a possibility that entrepreneurs would rate the ecosystem higher as compared to non-entrepreneurs.
While the aforementioned hypothesis may hold good for a particular category of internally directed entrepreneurs, the traditional pattern might be applicable for entrepreneurs in general, who would perceive themselves as actors, and non-entrepreneurs, who would perceive themselves as the observers. Thus, entrepreneurs may rate the ecosystem poorer than the providers of the ecosystem, such as governments, bankers, financiers, educational and research institutions, trainers and consultants, etc. Differences attributable to the self-serving bias of entre-preneurs and actor–observer bias between entrepreneurs and experts were identified in a study of the causes of entrepreneurial success and failure (Rogoff, Myung-Soo, & Dong-Churl, 2004). In the context of entrepreneurial success and failure, it is but natural that the entrepreneurs perceive themselves as actors and the experts as observers. However, when evaluating the quality of the entrepreneurial ecosystem, the ‘actors’ would be the providers of various elements of the ecosystem while the entrepreneurs are the ‘observers’ or beneficiaries, because they can play multiple important roles in the build-out of an entrepreneurial ecosystem. Hence, the providers are likely to rate the ecosystem more positively than the entrepreneurs. The present study attempts to compare the perceptions of entrepreneurs against those of the other stakeholders engaged in the creation and management of the entrepreneurial ecosystem.
Entrepreneurial Ecosystem
Entrepreneurial ecosystem (Feld, 2012; Foster et al., 2013) consists of diverse set of inter-dependent actors within a geographic region, which influence the formation of the entire group of actors and eventually delineate the trajectory of progress of the ventures as well as the economy as a whole (Spilling, 1996). In other words, the entrepreneurial ecosystem is a set of interdependent components which interact to generate and facilitate new venture creation over time (Van de Ven, 1993). Cohen (2006) defined the formal entrepreneurial ecosystem in terms of its constituents such as government agencies, regional administration, universities and research institutions, professional and support services (e.g., lawyers, accountants, consultants and suppliers), capital sources (e.g., venture capitalists, business angels and banks), talent pool and large corporations. In appreciating the contribution of these constituents towards facilitating entrepreneurship and new venture creation, there is a general tendency to assign a pre-eminent role to the government on account of the pervasive nature of its activities. Governments can make positive or negative influence on the climate for entrepreneurship through their policies on taxation, incentives, affirmative financial support (e.g., subsidies and grants) and the bureaucratic procedures often associated with applying for permits and licenses, besides implementing projects in partnership with private operators (Porter, 1998; Siegel, Wessner, Binks, & Lockett, 2003).
A major research project, called the Global Entrepreneurship Monitor (GEM), with the aim of understanding and comparing the entrepreneurial ecosystems of different nations, was launched in 1998 by the Babson College, USA, and the London Business School, UK. The project, which started as a partnership among researchers from about 30 countries, has now more than doubled its membership and extended its research areas to various aspects of the entrepreneurial ecosystem, which they called the Entrepreneurial Framework Conditions (EFCs). The distinction between EFC and the ecosystem is that the former does not include the entrepreneur while the latter does. The GEM research in 2001 started with the analysis of nine EFCs, which got enhanced to 14 in 2002 with the addition of five more (Manimala, 2002). Viewed from a functional perspective, EFCs could be defined as the facilitators of the entrepre-neurship phenomenon, which directly influence the existence of entre-preneurial opportunities, entrepreneurial capacity and preferences, which in turn determine the business dynamics (Manimala, P. Thomas, & Thomas, 2015). The nine dimensions of EFCs identified by the GEM 2014 study are: (1) access to finance, (2) government policies, (3) government programs for entrepreneurs, (4) entrepreneurship education, (5) R&D transfer, (6) commercial and legal infrastructure, (7) market openness, (8) physical infrastructure and (9) cultural and social norms (Singer, Amorós, & Arreola, 2014).
Objective
The major objective of the present study is to understand the biases, if any, in the perception of the entrepreneurial ecosystem by entrepreneurs and non-entrepreneurs. As noted earlier, both these groups can be actors and observers with respect to the different activities they perform in the ecosystem. Naturally their perceptions of their own actions and those of the others will be coloured by their self-serving biases. Entrepreneurs are expected to rate their own capabilities high and the facilitation received low. Conversely, the non-entrepreneurs are likely to rate the facilitation more favourably. The a priori objective of this study, therefore, is to test whether there are statistically significant differences between entrepreneurs and non-entrepreneurs with respect to their perception of the EFCs and entrepreneurial capabilities (ECs) (which together constitute the entrepreneurial ecosystem).
Method
Measures
The present study is a part of a larger study across four BRIC countries (Brazil, Russia, India and China) and Italy (which was included, as the project was initiated by an Italian institution) for understanding the influence of the entrepreneurial ecosystem on new venture creation. The original study used a 77-item questionnaire (Manimala, P. Thomas, & Thomas, 2013), with statements pertaining to the different aspects of the ecosystem, which were rated by the respondents on a 5-point Likert scale with scores ranging from 1 to 5 (1 = very poor; 2 = poor; 3 = average; 4 = good; 5 = excellent). The data collected from 611 respondents were subjected to factor analysis to identify the major dimensions of the entrepreneurial ecosystem. The details of the 11 factors that emerged in this analysis are provided in Annexure, which explored the perceptions of entrepreneurs and non-entrepreneurs on various aspects of the business environment and ECs in their respective countries. Out of the 611 Indian respondents, 296 were entrepreneurs [with two sub-groups of ICT companies (100) and non-ICT companies (182), while 14 were unspecified]. There were 315 non-entrepreneurs. The latter (non-entrepreneurs) consisted of government officials (44), bankers (31), general employees (34), students (202) and unspecified (4). Perceptions of the two main groups (entrepreneurs and non-entrepreneurs) were compared to test the actor–observer bias. Considering the fact that there were subgroups within these two major groups, it was also possible for us to make some comparisons across the sub-groups, which revealed some interesting differences. For the sub-group analysis, 18 respondents (14 from among entrepreneurs and 4 from among non-entrepreneurs, as mentioned earlier) were not included, as they had not specified their affiliations.
The reliability values (Cronbach’s α) of the 11 factors, along with their short forms (which will be used for designating them in the later analyses) are given below in the order in which they emerged in the factor analysis. Government support (GS-0.739), education and training support (ETS-0.907), support for internationalisation (SI-0.830), market entry facilitation (MEF-0.886), facilitation for women’s entrepreneurship (FWE-0.878), physical infrastructure support (PIS-0.834), professional and technical support (PTS-0.795), entrepreneurial capabilities (EC-0.801), socio-cultural support (SCS-0.737), funding support (FS-0.727) and access to information (AI-0.776). All Cronbach’s alpha values are above 0.7, which suggests that the factors are reliable (Nunnally, 1978). Subsequent analyses were based on the aforementioned factors (dimensions) of the entrepreneurial ecosystem. As the purpose was to identify the differences between or among the sub-groups, there were only two types of analysis required, which were:
T-test (used for testing the differences between two sub-groups) and ANOVA (used for testing the differences among more than two sub-groups at a time.
Data Analysis and Findings
Differences between Entrepreneurs and Non-entrepreneurs
Table 1 shows that there are significant differences in the perceptions of Entrepreneurs and Non-entrepreneurs on EC and all EFCs (p = 0.00) except the physical infrastructure support. As the infrastructure in India is uniformly rated low in many other studies including GEM (Manimala, 2002), it is not surprising that there is some kind of uniformity in the ratings on this dimension across the different groups. On all other EFCs, the ‘observers’ (non-entrepreneurs) scored higher than the ‘actors’ (entrepreneurs). The only dimension on which the latter scored higher is the ‘EC’, which incidentally is not an EFC. This is in conformity with the prior expectations based on the theories of actor–observer bias and self-serving bias. The actors rate their capabilities at a higher level and the support received at a lower level. A similar interpretation can be given from the perspective of the non-entrepreneurs, many of whom (government officials, bankers, trainers, consultants, etc.) are the actors with respect to the facilitation of entrepreneurship. Hence it is natural for them to rate the facilities at a higher level. Thus, the findings of the present study provide support for the hypothesis of ‘actor–observer’ bias.
Test of difference (t-test) for the Perceptions of Entrepreneurs (E) and Non-entrepreneurs (NE) on Entrepreneurial Ecosystem
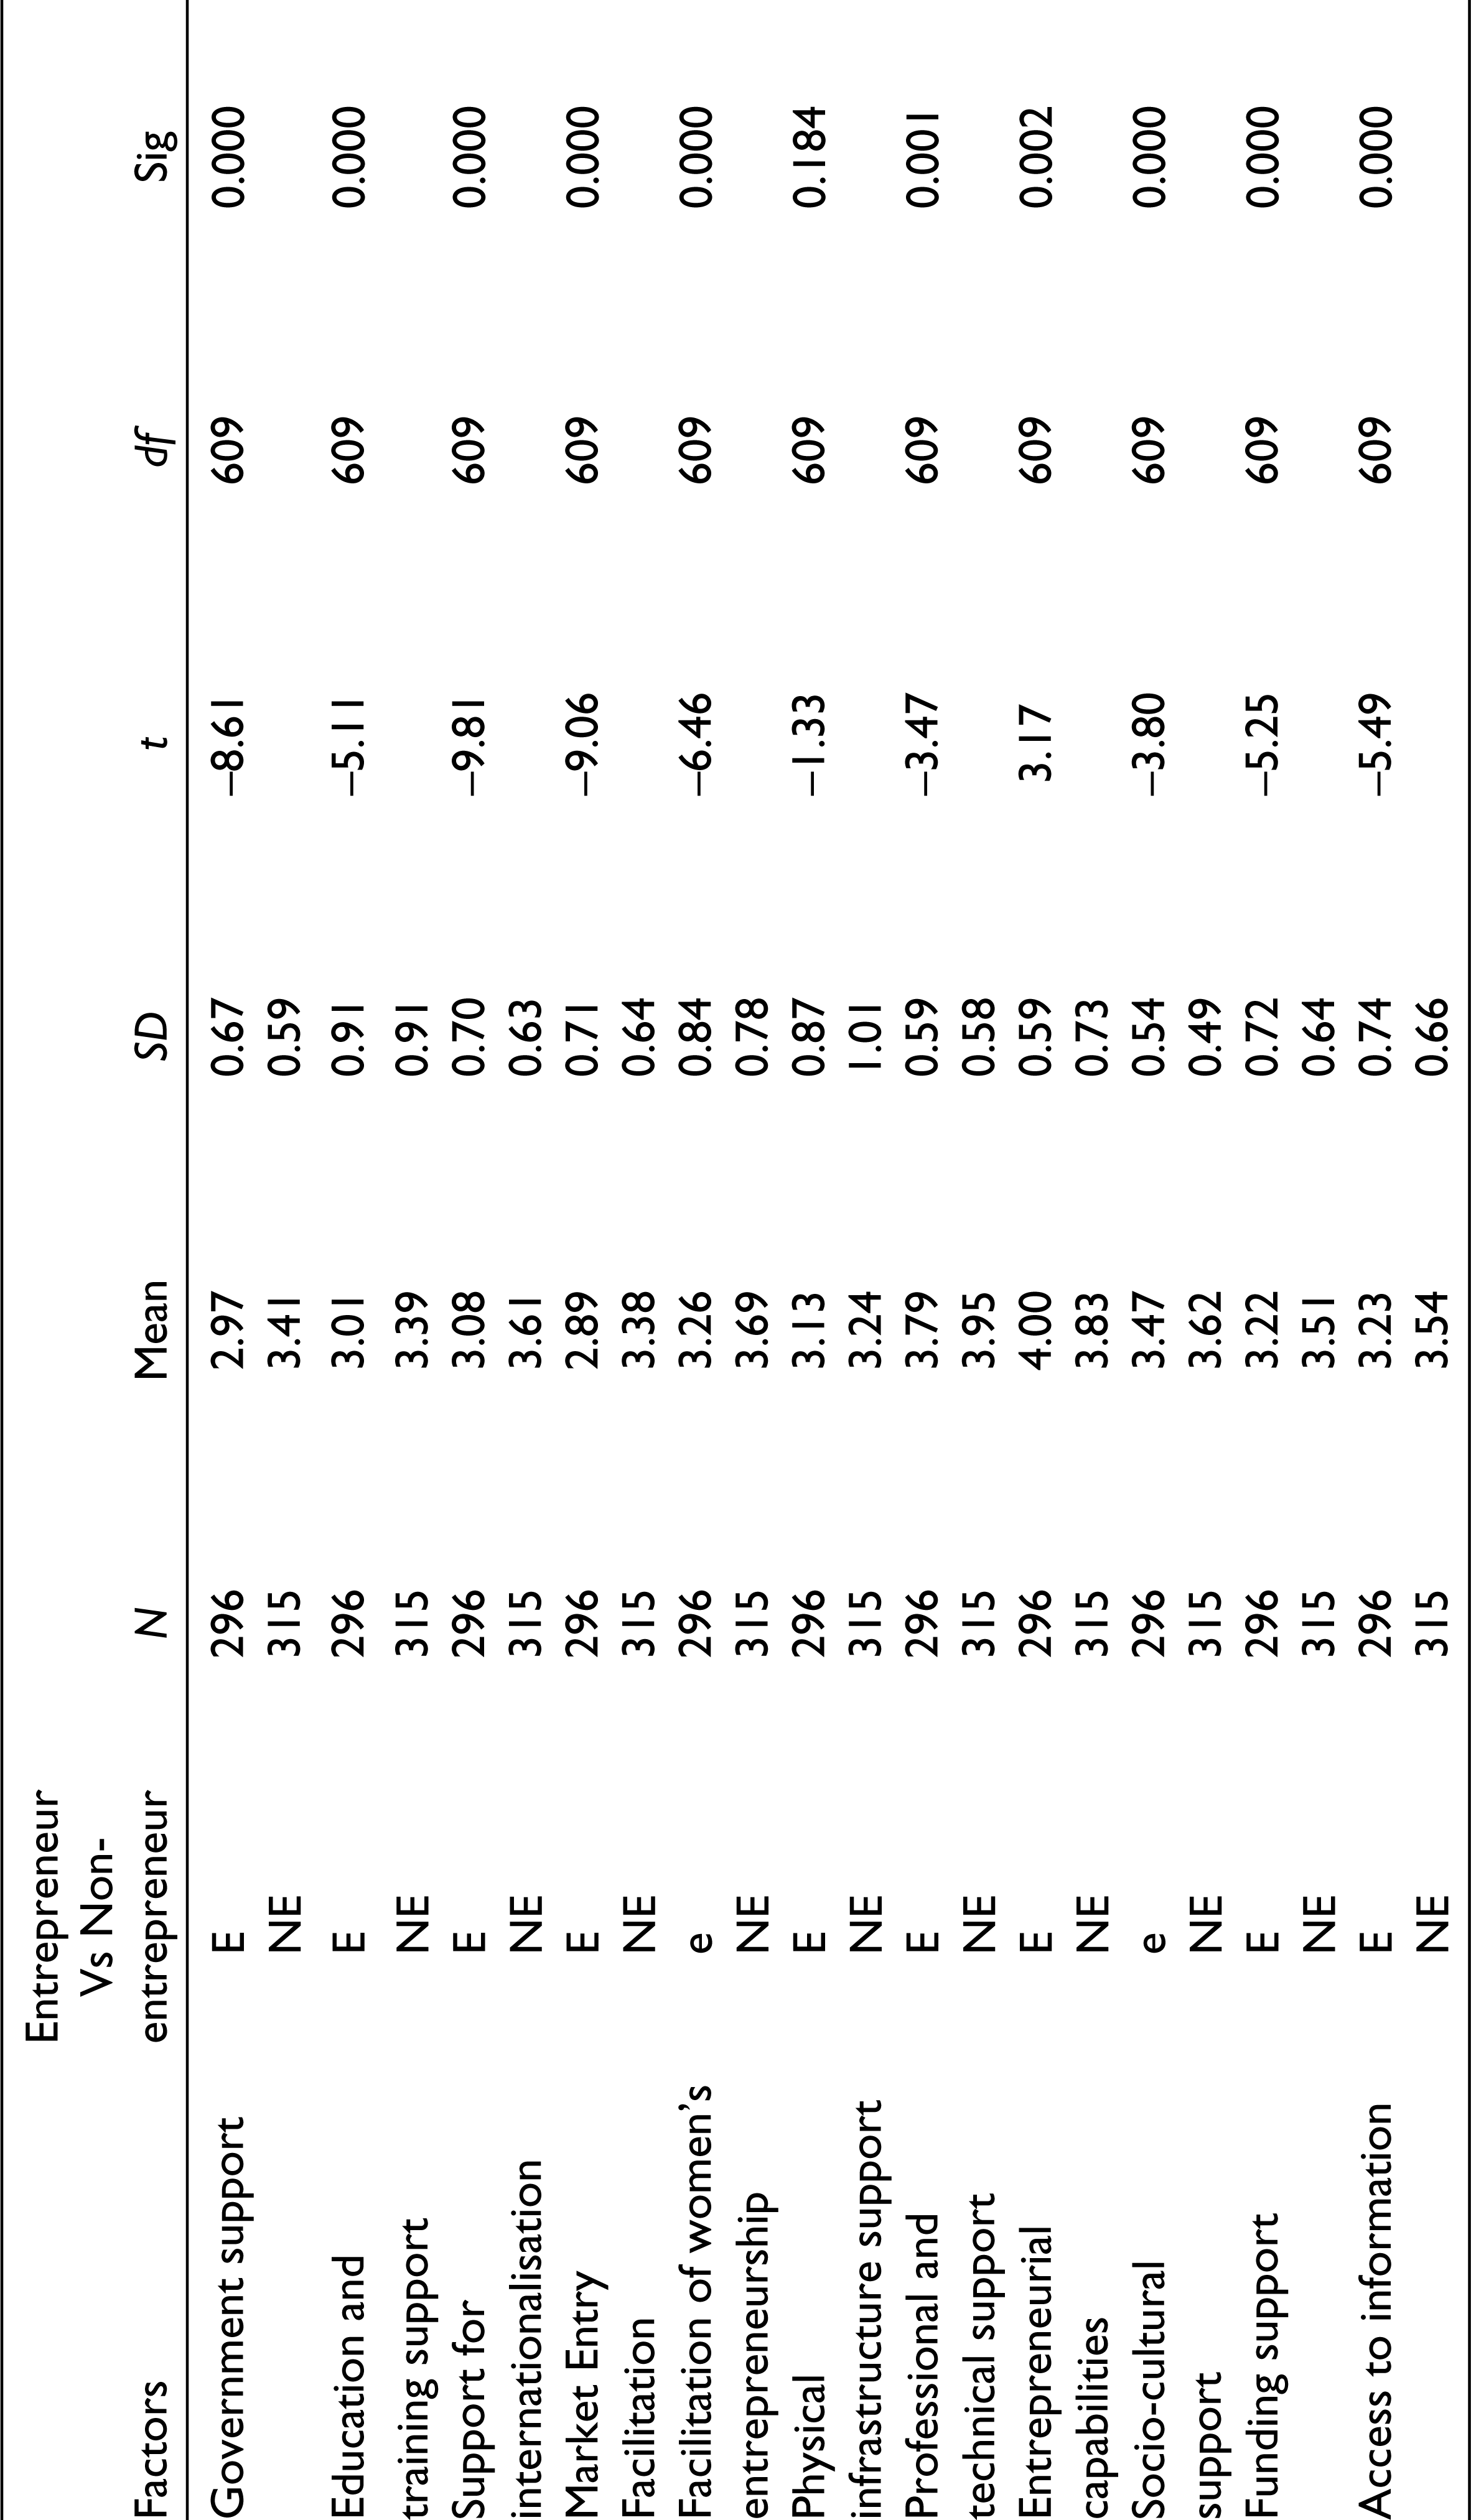
Interestingly, with reference to the physical infrastructure, where there is no difference between the two groups, it should be presumed that both of them are ‘victims’, in the sense that non-entrepreneurs also use the physical infrastructure.
An alternative hypothesis in this regard could be that, when the EFCs are uniformly good or uniformly bad, the ratings tend to become similarly high or low for all the groups, thus obliterating the impact of any actor–observer bias, whereas on an issue that is rated as average, there can be a wider range of opinions. India’s EFCs, according to GEM studies (Manimala, 2002), were rated in the average (except for the relatively low rating of the physical infrastructure), and so are likely to provoke the actor–observer bias.
A further observation that would be relevant in this context is that the uniformly lower scores given by entrepreneurs (actors) to all EFCs may be attributed to the fact that it is the actors (those doing the business) who would interact with the EFCs much more than the observers, and such interaction may have brought the limitations of these mediocre EFCs into sharper focus for the actors. As the EFCs in India are in general rated at the average level (GEM), it is possible that they have many shortcomings, which would get highlighted in interactions. On the contrary, if the EFCs were all maintained at the highest levels of quality, the perceptions could have been reversed or at least would have been similar (supporting the hypothesis proposed above on the perception of the uniformly good or uniformly bad EFCs).
The only item on which entrepreneurs (actors) scored higher than non-entrepreneurs (observers) is the EC. This is expected because it is probably the confidence in ones’ own abilities that made them venture out into a weakly supportive ecosystem, and their successes would have reinforced that confidence. There could also be the operation of the actor–observer bias in the traditional sense, which is also in conformity with the general theory of attribution, where the actors tend to attribute their successes to their own capabilities (internal attribution) and blame the environmental conditions for their failures (external attribution). Conversely, as pointed out above, the non-entrepreneurs are also susceptible to the ‘actor-bias’, as they scored higher on the facilitation factors, for which they (except for the student-group) may consider themselves to be responsible.
Differences among the Subgroups
Table 2 shows the perceptual differences among the sub-groups. As there are more than two sub-groups (six in the present case), the test of difference was done using ANOVA. The F-Statistic is significant (at p = 0.00) for all the 11 dimensions, which clearly indicates that there are differences among the subgroups in terms of their perceptions on the EFCs and EC. Based on the relative sizes of the average scores of the sub-groups, it is possible to make some observations on the differences in their perceptions.
Perceptual Differences among the Subgroups on Entrepreneurial Ecosystem: ANOVA
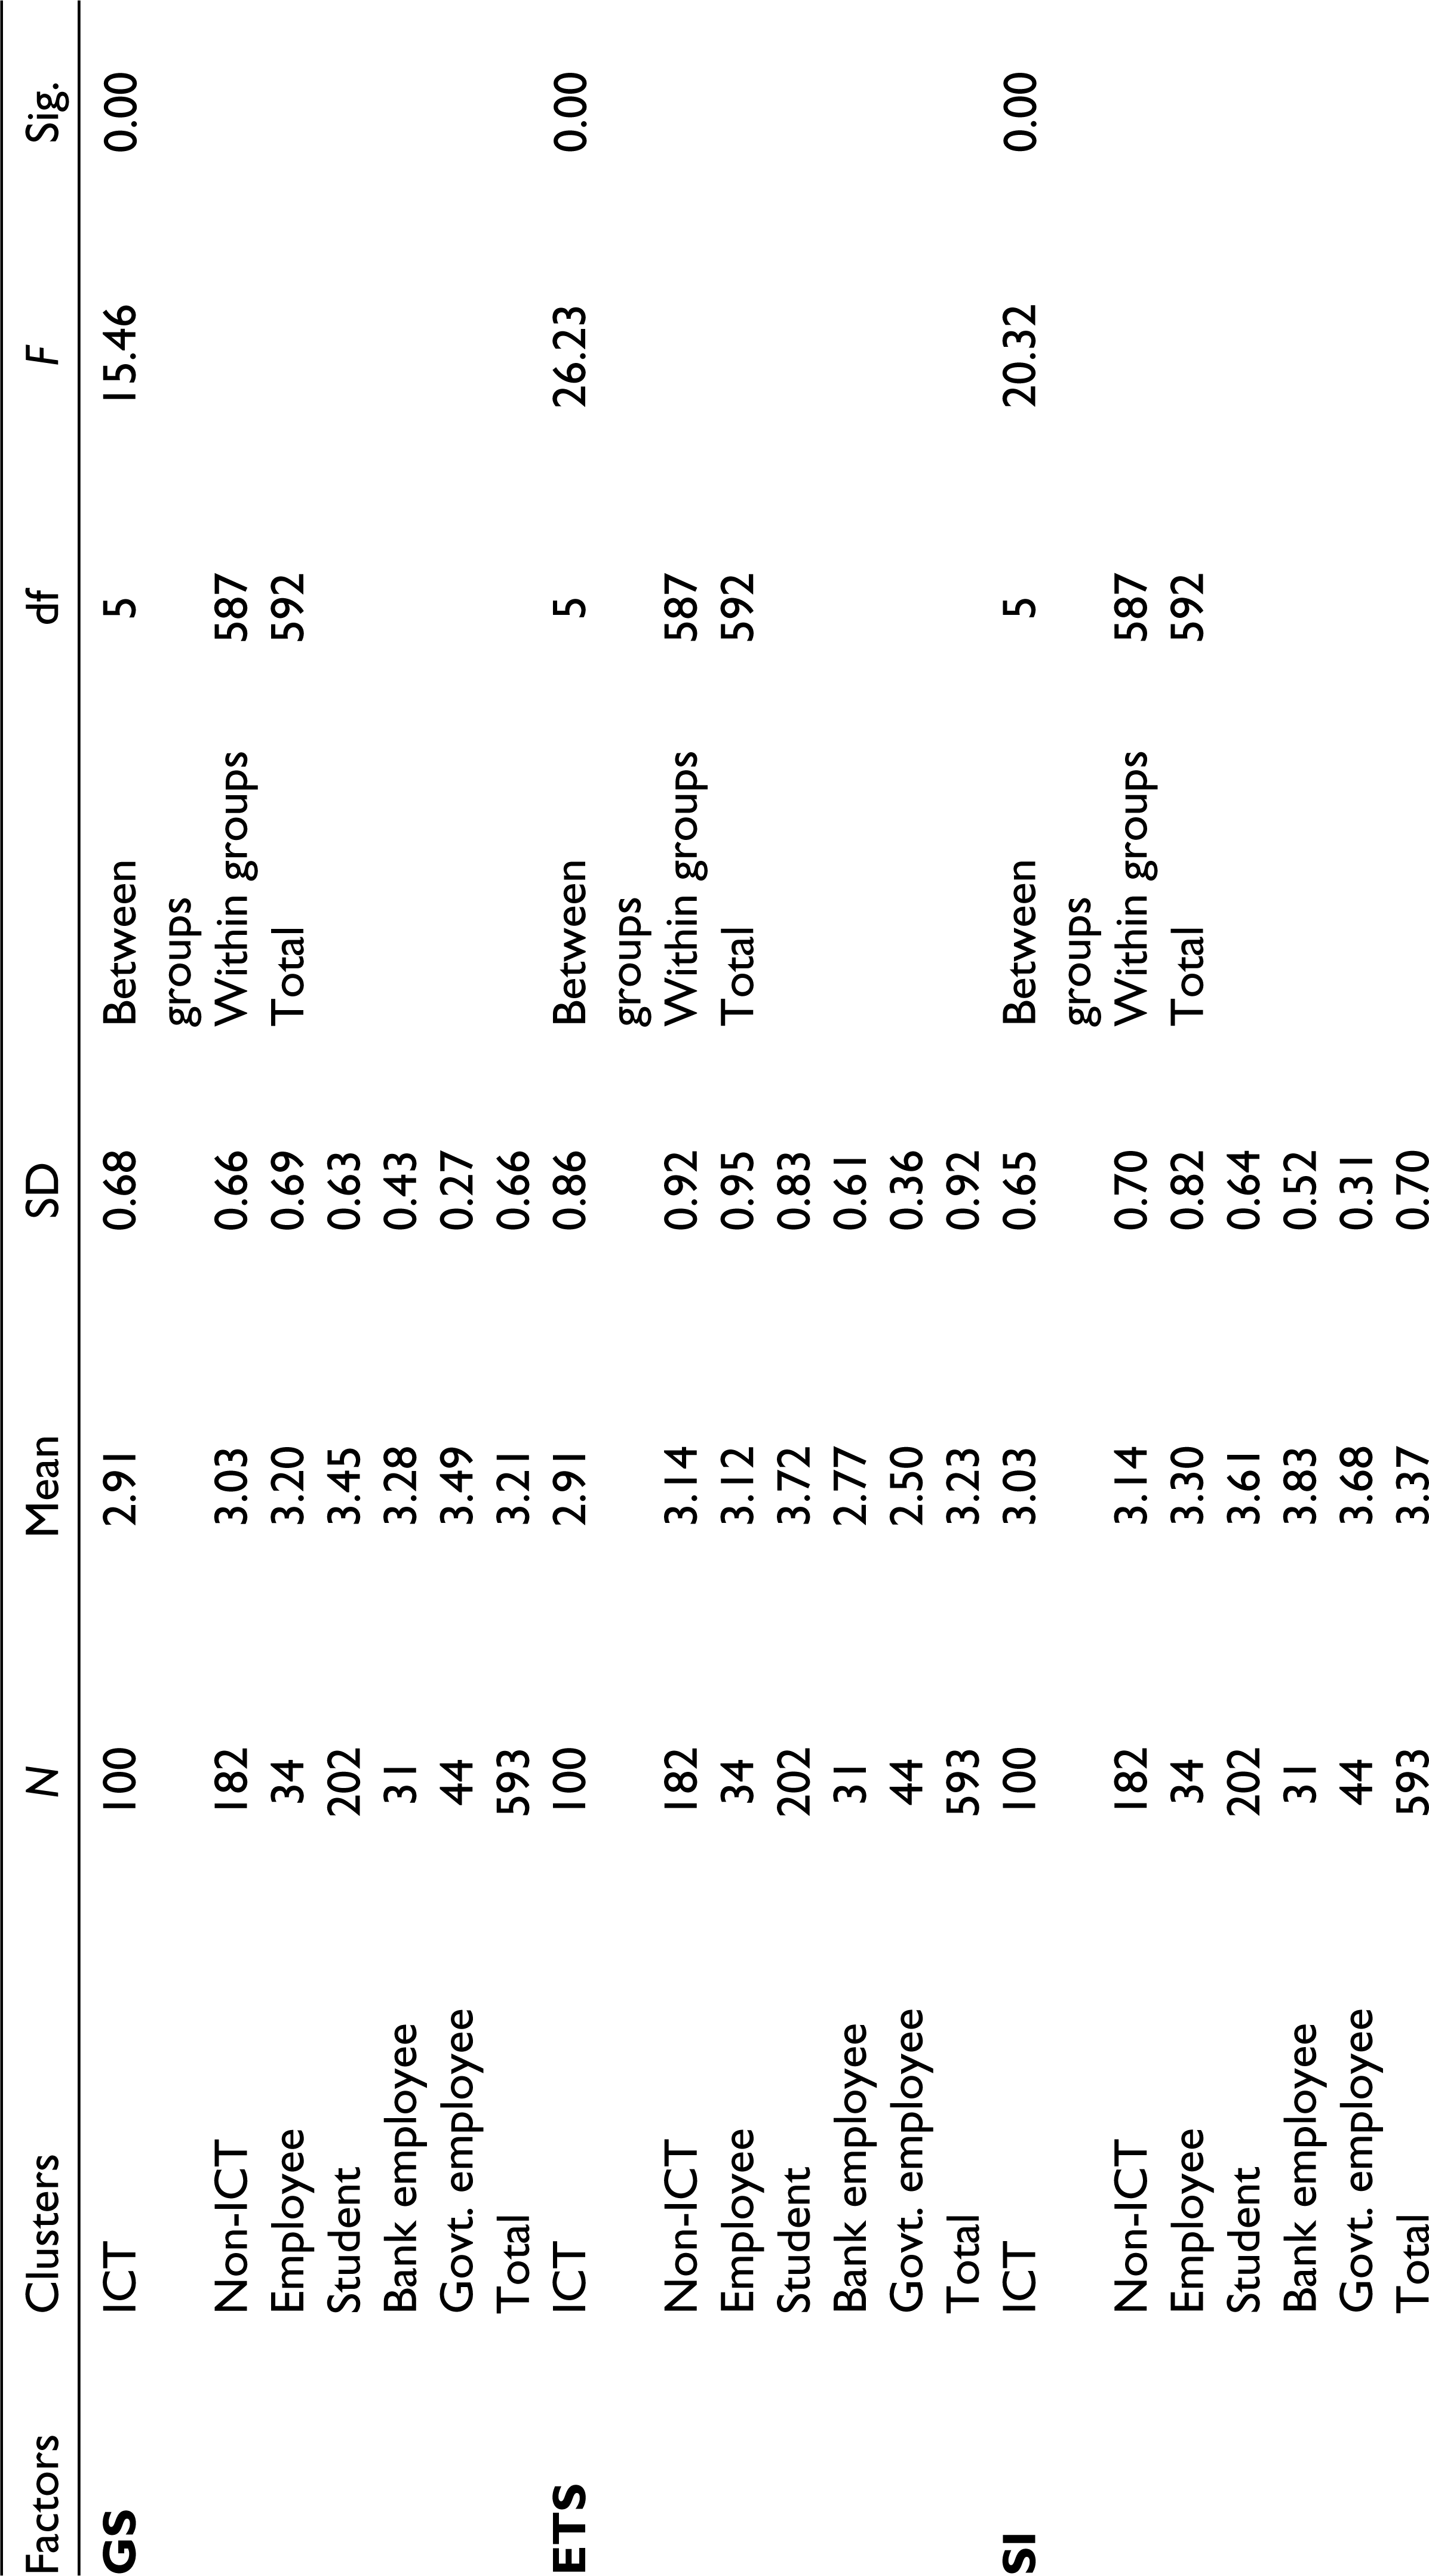
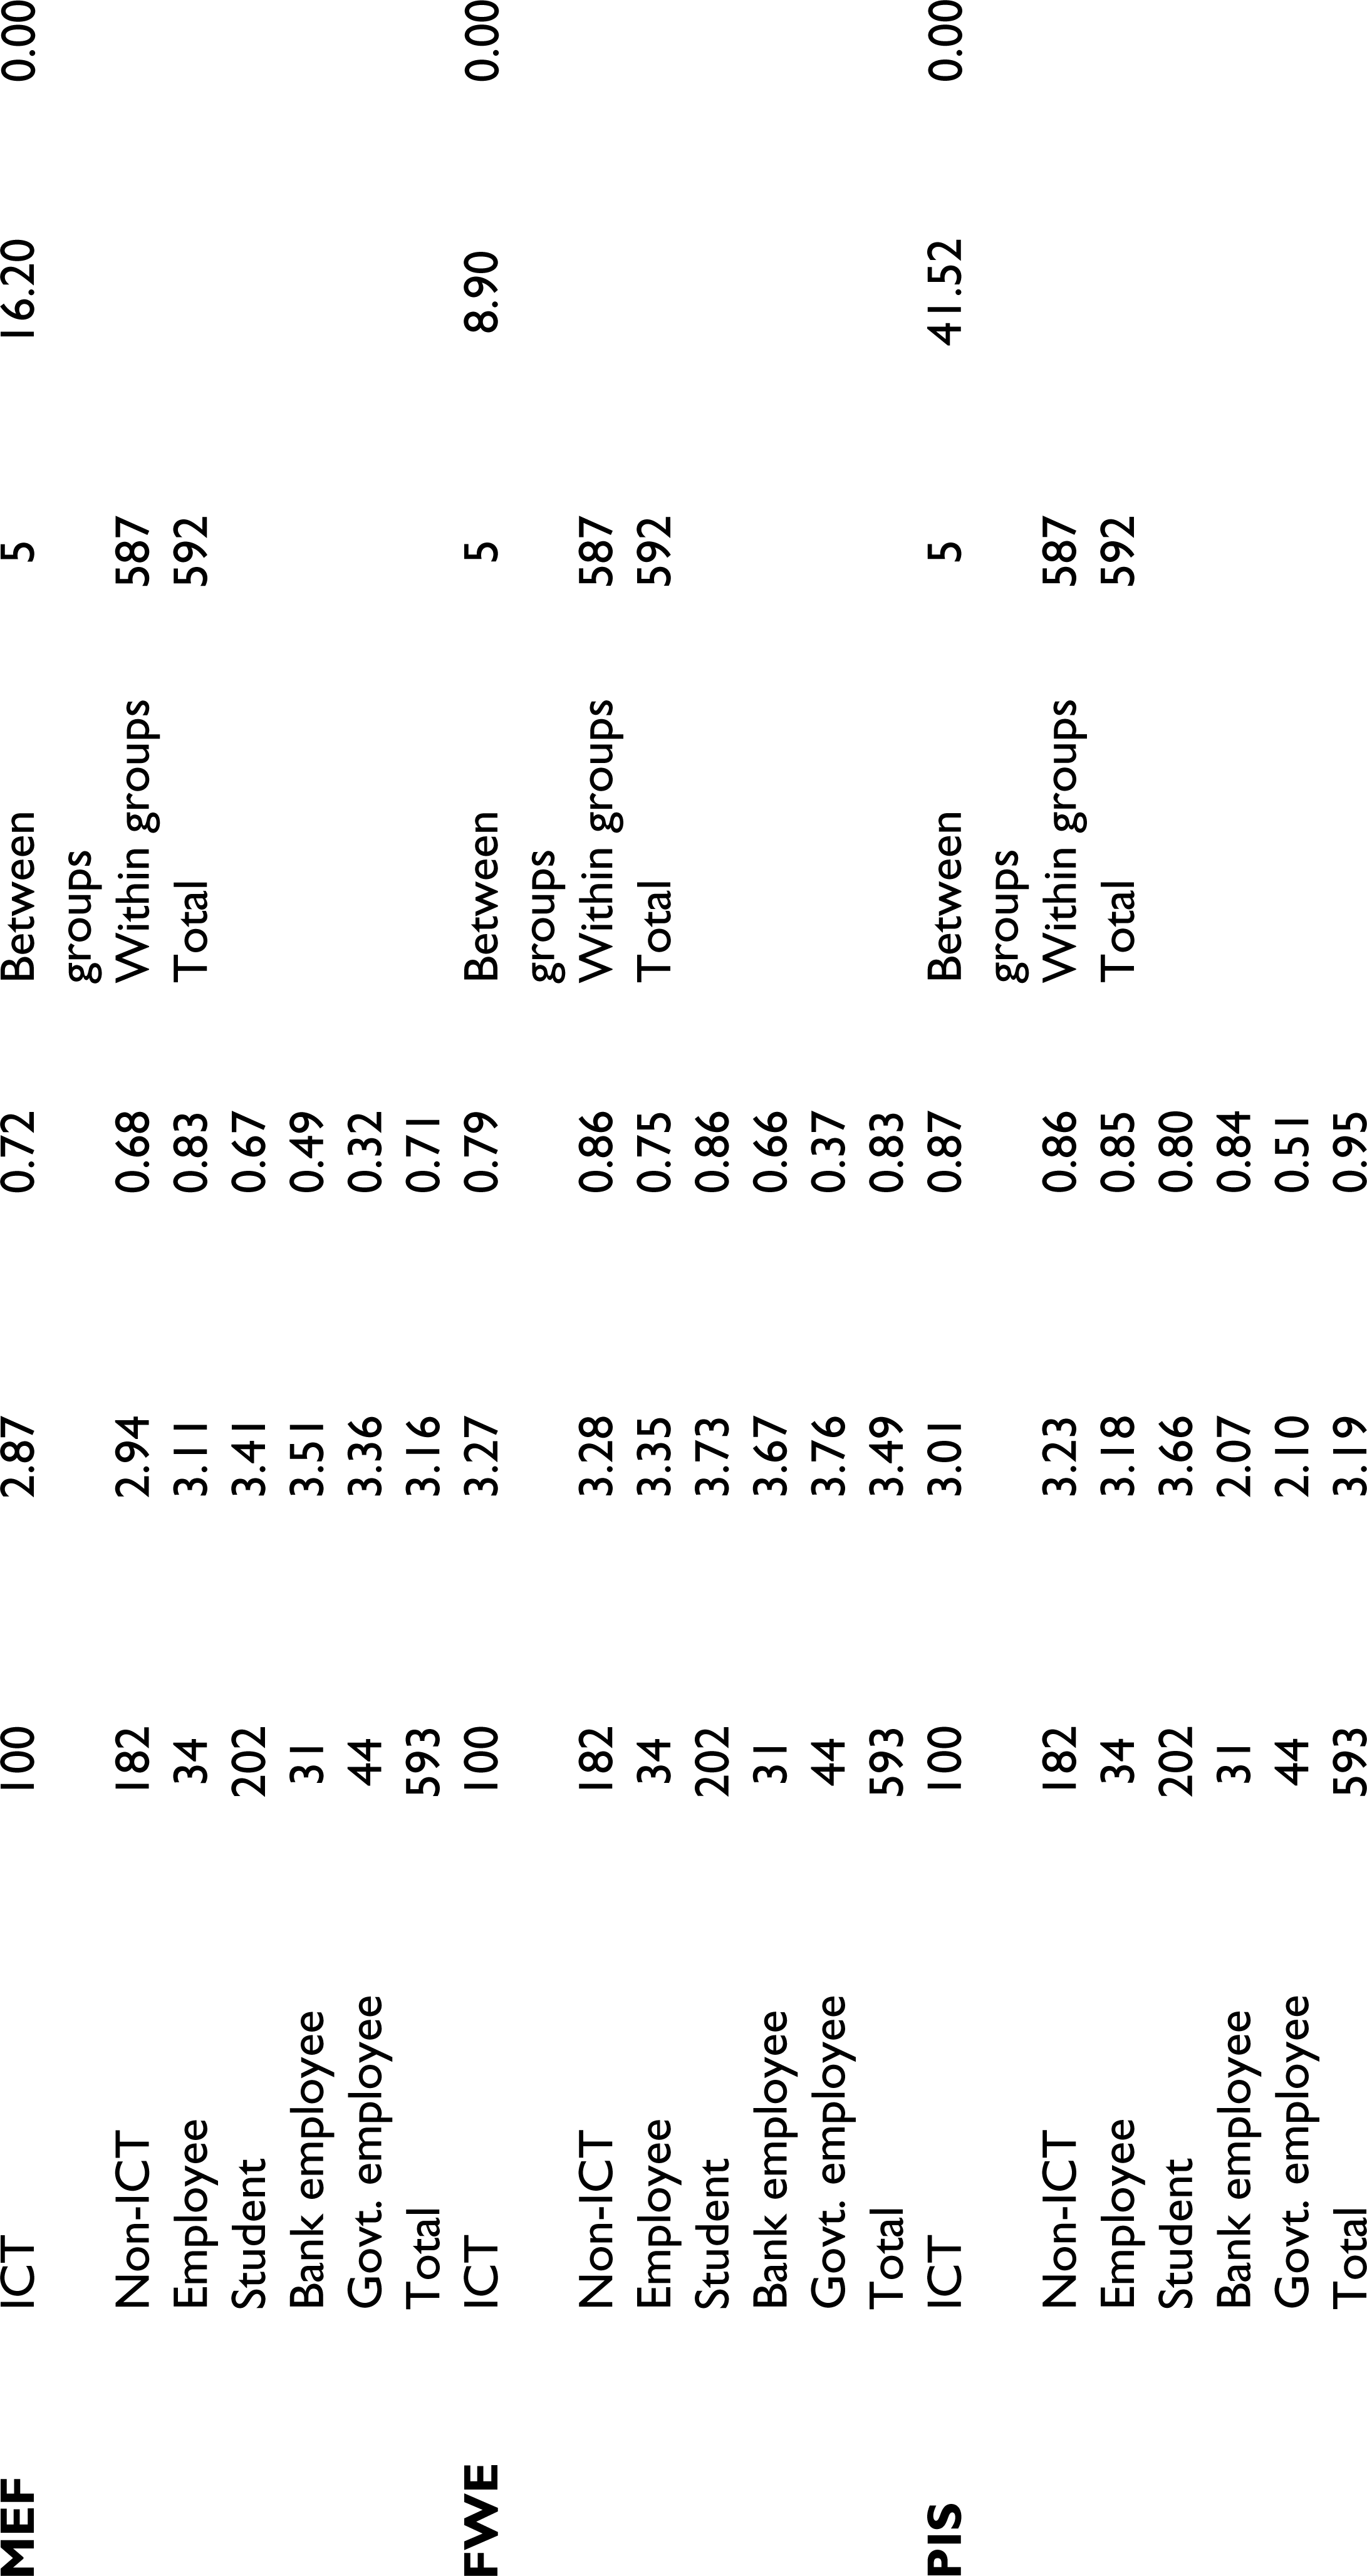
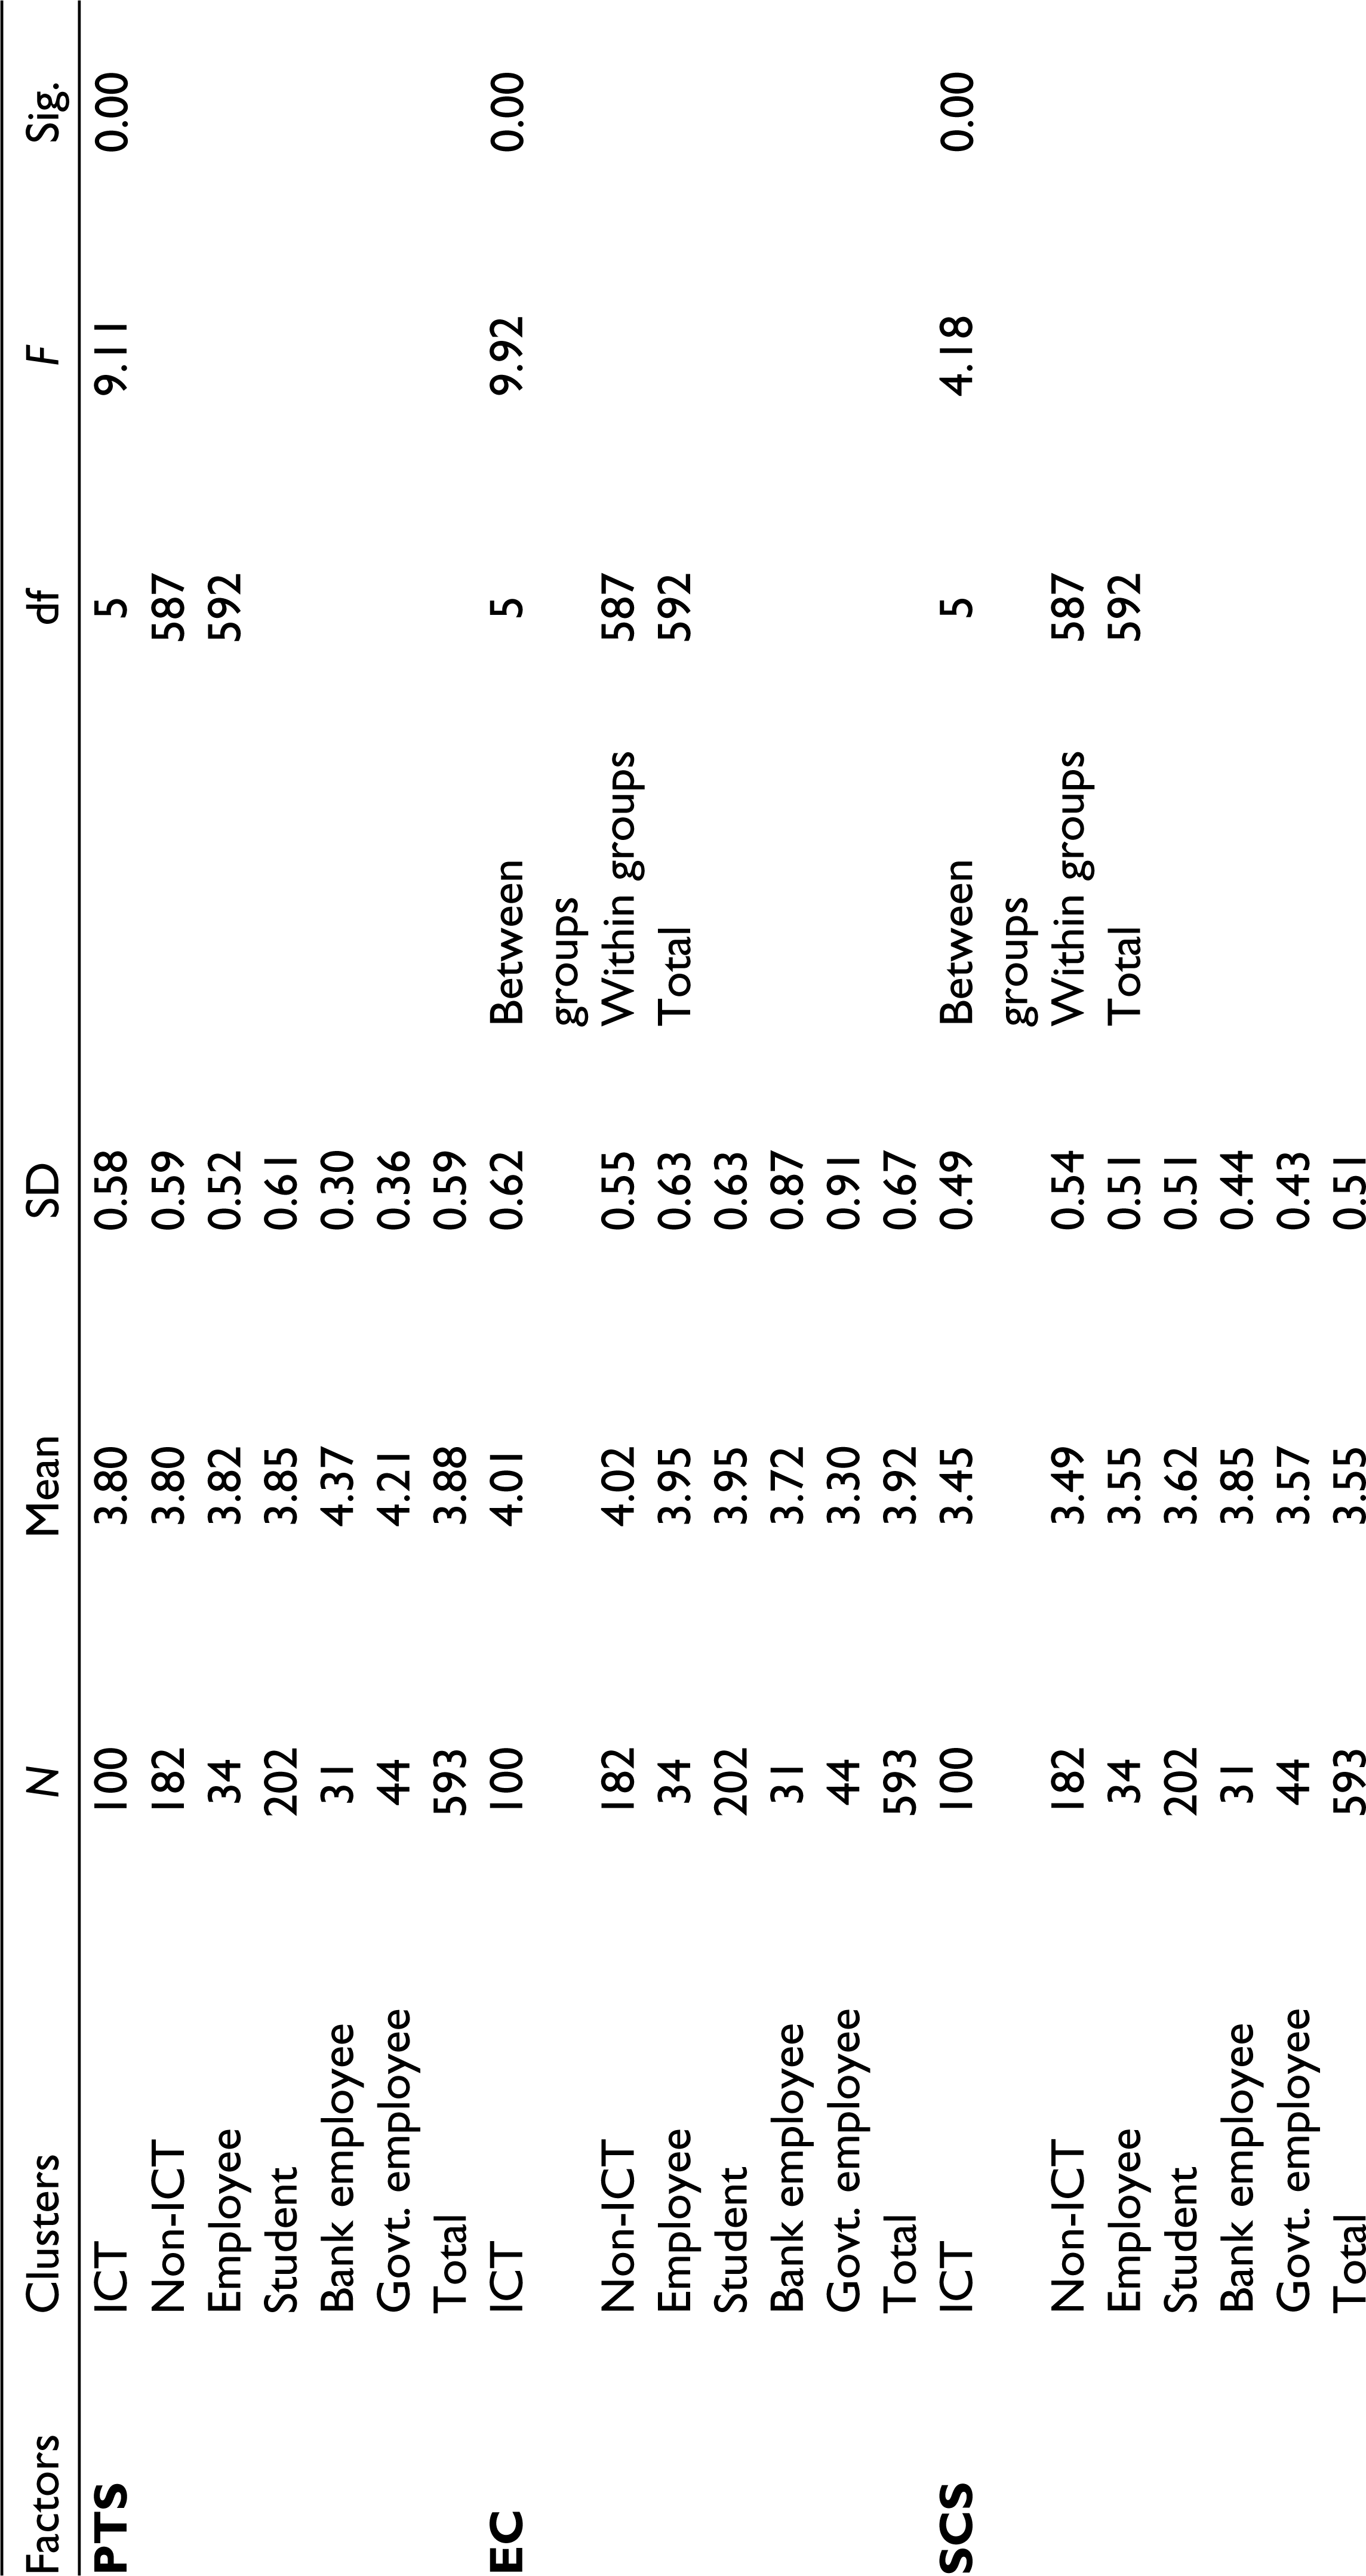

Between the ICT and non-ICT entrepreneurs, the latter scored higher on six dimensions, while they had more or less equal scores on five of them (namely, EC, professional and technical support, facilitation for women’s entrepreneurship, socio-cultural support, and access to infor-mation). It is interesting to note that ICT entrepreneurs have not scored higher than non-ICT ones on any of the dimensions. It seems that the various elements of the ecosystem created for the traditional industries would take a while to make adjustments to the newer types of industries.
Examining the high and low scores of the government employees, one can reasonably infer that they too are subject to the actor–observer bias in the reverse direction. Their lowest score is for entrepreneurial capability, followed by education and training, funding support and physical infrastructure. The rating of EC as their lowest by the government employees would indicate that the respondents were honest in doing the rating. Had they been high on EC, they would have become entrepreneurs rather than government employees. Of the three other EFCs, two (education and training and funding support) are provided by other agencies, and hence the government employees would not consider themselves to be the actors with respect to these, which may explain the low scores for them. As for the physical infrastructure in India, it should be pointed out that it is almost uniformly perceived as poor (Manimala, 2002), and since every citizen is a victim of it, the government employees cannot be an exception. The encounter with the harsh realities of the infrastructure on a day-to-day basis would have helped them to overcome the ‘actor–observer’ bias on this particular issue, and rate it as poor, even though it is a service provided by the government. (Please also see the graphically represented theoretical perspective on this in the sub-section on ‘Implications’ below, which shows that when the service is really poor, even the ‘actors’/service-providers tend to rate it low.)
The higher than average scores given by government employees are for: government support, internationalisation, professional and technical support, access to information, market entry facilitation, and facilitation for women’s entrepreneurship. All of these, except perhaps professional and technical support, are directly or indirectly related to the government policies and programmes. It is but natural that the government employees perceive themselves as the providers (and hence the actors) with respect to these EFCs. Hence these high ratings may be interpreted as resulting from an actor-bias—an attitude of having done one’s part well.
Comparing the average scores of the sub-groups, it is observed that students have given high ratings for most of the dimensions of the entrepreneurial ecosystem (education and training, government support, funding support, access to information, market entry facilitation, and facilitation for women’s entrepreneurship). They do have a moderately high score even on physical infrastructure support. It is heartening to see that the younger generation is optimistic about the entrepreneurial ecosystem in the country, which augurs well for the country, as it is this group that becomes the source of future entrepreneurs. Support for the students’ optimism is likely to come from the second highest scorers, namely the bankers who are the providers of a vital service to these budding entrepreneurs, especially in the early stages of their ventures.
It may be noted from the two tables that, in both the analyses, all the variables show significant differences among the subgroups, except for physical infrastructure support in Table 1. The possible reason for this one anomaly was explained above and has led to the development of a new theoretical perspective, as discussed below. The overall picture that emerges from the analyses is that the sub-groups are likely to be under the influence of the actor–observer bias or the self-serving bias and conform to a modified version of the general theory of attribution.
Limitations, Implications and Future Directions for Research
One of the limitations of the study was that, it was a joint initiative by five countries and hence the questionnaire items had to be restricted to the issues that were common to all five countries. Hence, it was not possible for us to incorporate a few India-specific issues in the questionnaire. It was for this reason, some of the dimensions identified (for example, facilitation for women’s entrepreneurship) is likely to get expanded to include all the disadvantaged sections of the society. Another limitation was that, it was difficult to get a perfectly random sample. In fact, the samples were selected mostly based on the willingness of the concerned respondents. Hence, we were not able to ensure exactly the same numbers in all the groups. However, this is not a very serious issue as the numbers in each subgroup are fairly large.
It may be noted that the only dimension where the difference is not significant for entrepreneurs and non-entrepreneurs is the physical infratructure. Considering the fact that, this was the poorest rated dimension for India in the GEM Study (Manimala, 2002), it is legitimate for us to propose an inverted ‘U’ relationship between the quality of a particular ecosystem dimension and the actor–observer bias. In other words, when the quality is extremely poor or extremely good, everybody feels it so and therefore there is little scope for different perceptions, and hence the actor–observer bias will be low or nil. On the other hand, if the quality is average, there is scope for different sections to perceive it differently, and hence the actor–observer bias would be high. This proposition (hypothesised relationship between the quality of the ecosystem dimension and actor–observer bias in the perception of the dimension), which could also serve as a hypothesis for future research, is depicted in Figure 1. Development of this proposition is a small but significant contribution of the present study to the theory on perception in general, and ecosystem perception in particular. The message for the practitioners and policymakers in this context is that, when they improve the ecosystem from a poor state, they cannot afford to be contended with an average status, but will have to strive to be excellent in order to make all segments of their clients equally happy.

One other inference from the study is that entrepreneurs are able to overcome the limitations of the ecosystem, if the ECs of the individual are well developed. Hence, it may be more productive for the policymakers and practitioners to focus on developing ECs. The limitations of the ecosystem can be overcome by developing ECs but the reverse may not happen. Even the best of ecosystems can be exploited only if there are people with ECs in the country.
Future research could include more country specific issues in their survey instruments. It should also be possible to test the Inverted ‘U’ Curve model of actor–observer bias in perceptions of the entrepreneurial ecosystem, using larger samples. Moreover, this hypothesis could be tested outside the realm of entrepreneurial ecosystem on perceptions of issues involving quality rating.
Conclusion
The research reported in this article on the perceptions of the entrepreneurial ecosystem in India by various subgroups of entrepreneurs and non-entrepreneurs is a part of a larger study conducted in BRIC countries (which were chosen for the study because of the high levels of entrepreneurial activity there in recent times). The focus of the study was the perceptions of the various stakeholders on the empirically identified dimensions of the entrepreneurial ecosystem, as it is the perceptions that serve as an important basis of human decision-making, although they may be biased. The analyses conducted as part of the study showed that biases are a reality and followed a pattern for the different subgroups of the stakeholders.
It was interesting to note that the highest rated three dimensions were related to three different stakeholders, namely (a) the individual entrepreneur, who scored high on EC, with an average score of 3.92 out of 5; (b) the other professionals, whose services (professional and technical support) were rated with an average score of 3.88; and (c) the larger society, whose supportive attitude (socio-cultural support) was rated with an average score of 3.55; whereas the average and below-average ratings were given to the services rendered by other agencies, like the bankers, the government and the other institutional support providers. Such a rating could be attributed to a self-serving bias reflecting an ‘I am OK, you are not OK’ syndrome. In this pattern of rating, one could also sense a confidence that the inadequacies of the extrinsic support system could be compensated for the individual entrepreneur’s competencies and peer-level/societal support.
Since a section of the respondents are entrepreneurs who have already taken the plunge with some degree of success, they will have a tendency to attribute their successes to their own capabilities and failures to external factors. The non-entrepreneurs in the sample (observers of the entrepreneurial action) may have the opposite tendency. In a limited way we tested the ‘actor–observer’ bias by comparing the perceptions of entrepreneurs and non-entrepreneurs on the EFCs and EC and found that there are significant differences between the two groups in terms of their perceptions on all dimensions, except for the Physical Infrastructure. One possible interpretation of this exception was provided above, along with the development of a new hypothesis (the inverted ‘U’ curve model of perceptual differences). The other differences were in the expected directions, with entrepreneurs scoring higher only on ECs and scoring lower on all the EFCs. Thus, the findings of the present study offer support for the presence of ‘actor–observer’ bias on the part of entrepreneurs.
Biases in perception (‘self-serving’, ‘actor–observer’ or others) are also confirmed by the sub-group analyses performed for all the dimensions. There are significant differences among the sub-groups in terms of their perceptions on all the dimensions, most of which are in the expected directions. One silver lining emerging from this analysis is the finding that the most optimistic sub-groups are the students and the bankers, which would hopefully ensure an adequate supply of confident entrepreneurs for the country in future and a financial system that is willing to support them.
Footnotes
Declaration of Conflicting Interests
The authors declared no potential conflicts of interest with respect to the research, authorship and/or publication of this article.
Funding
The authors disclosed receipt of the following financial support for the research, authorship and/or publication of this article: The authors gratefully acknowledge the funding support received from Fondazione Cariplo, Italy, and the professional inputs received from the academic partners from Italy (Fabio Corno of University of Milano–Bicocca) and the BRIC countries (Renata Lèbre La Rovere of UFRJ Brazil, Elena Pereverzeva of MIRBIS Moscow and Youzhen Zhao of Fudan University China) for the research reported in this article.
Appendix
Dimensions of the Entrepreneurial Ecosystem identified through Factor Analysis

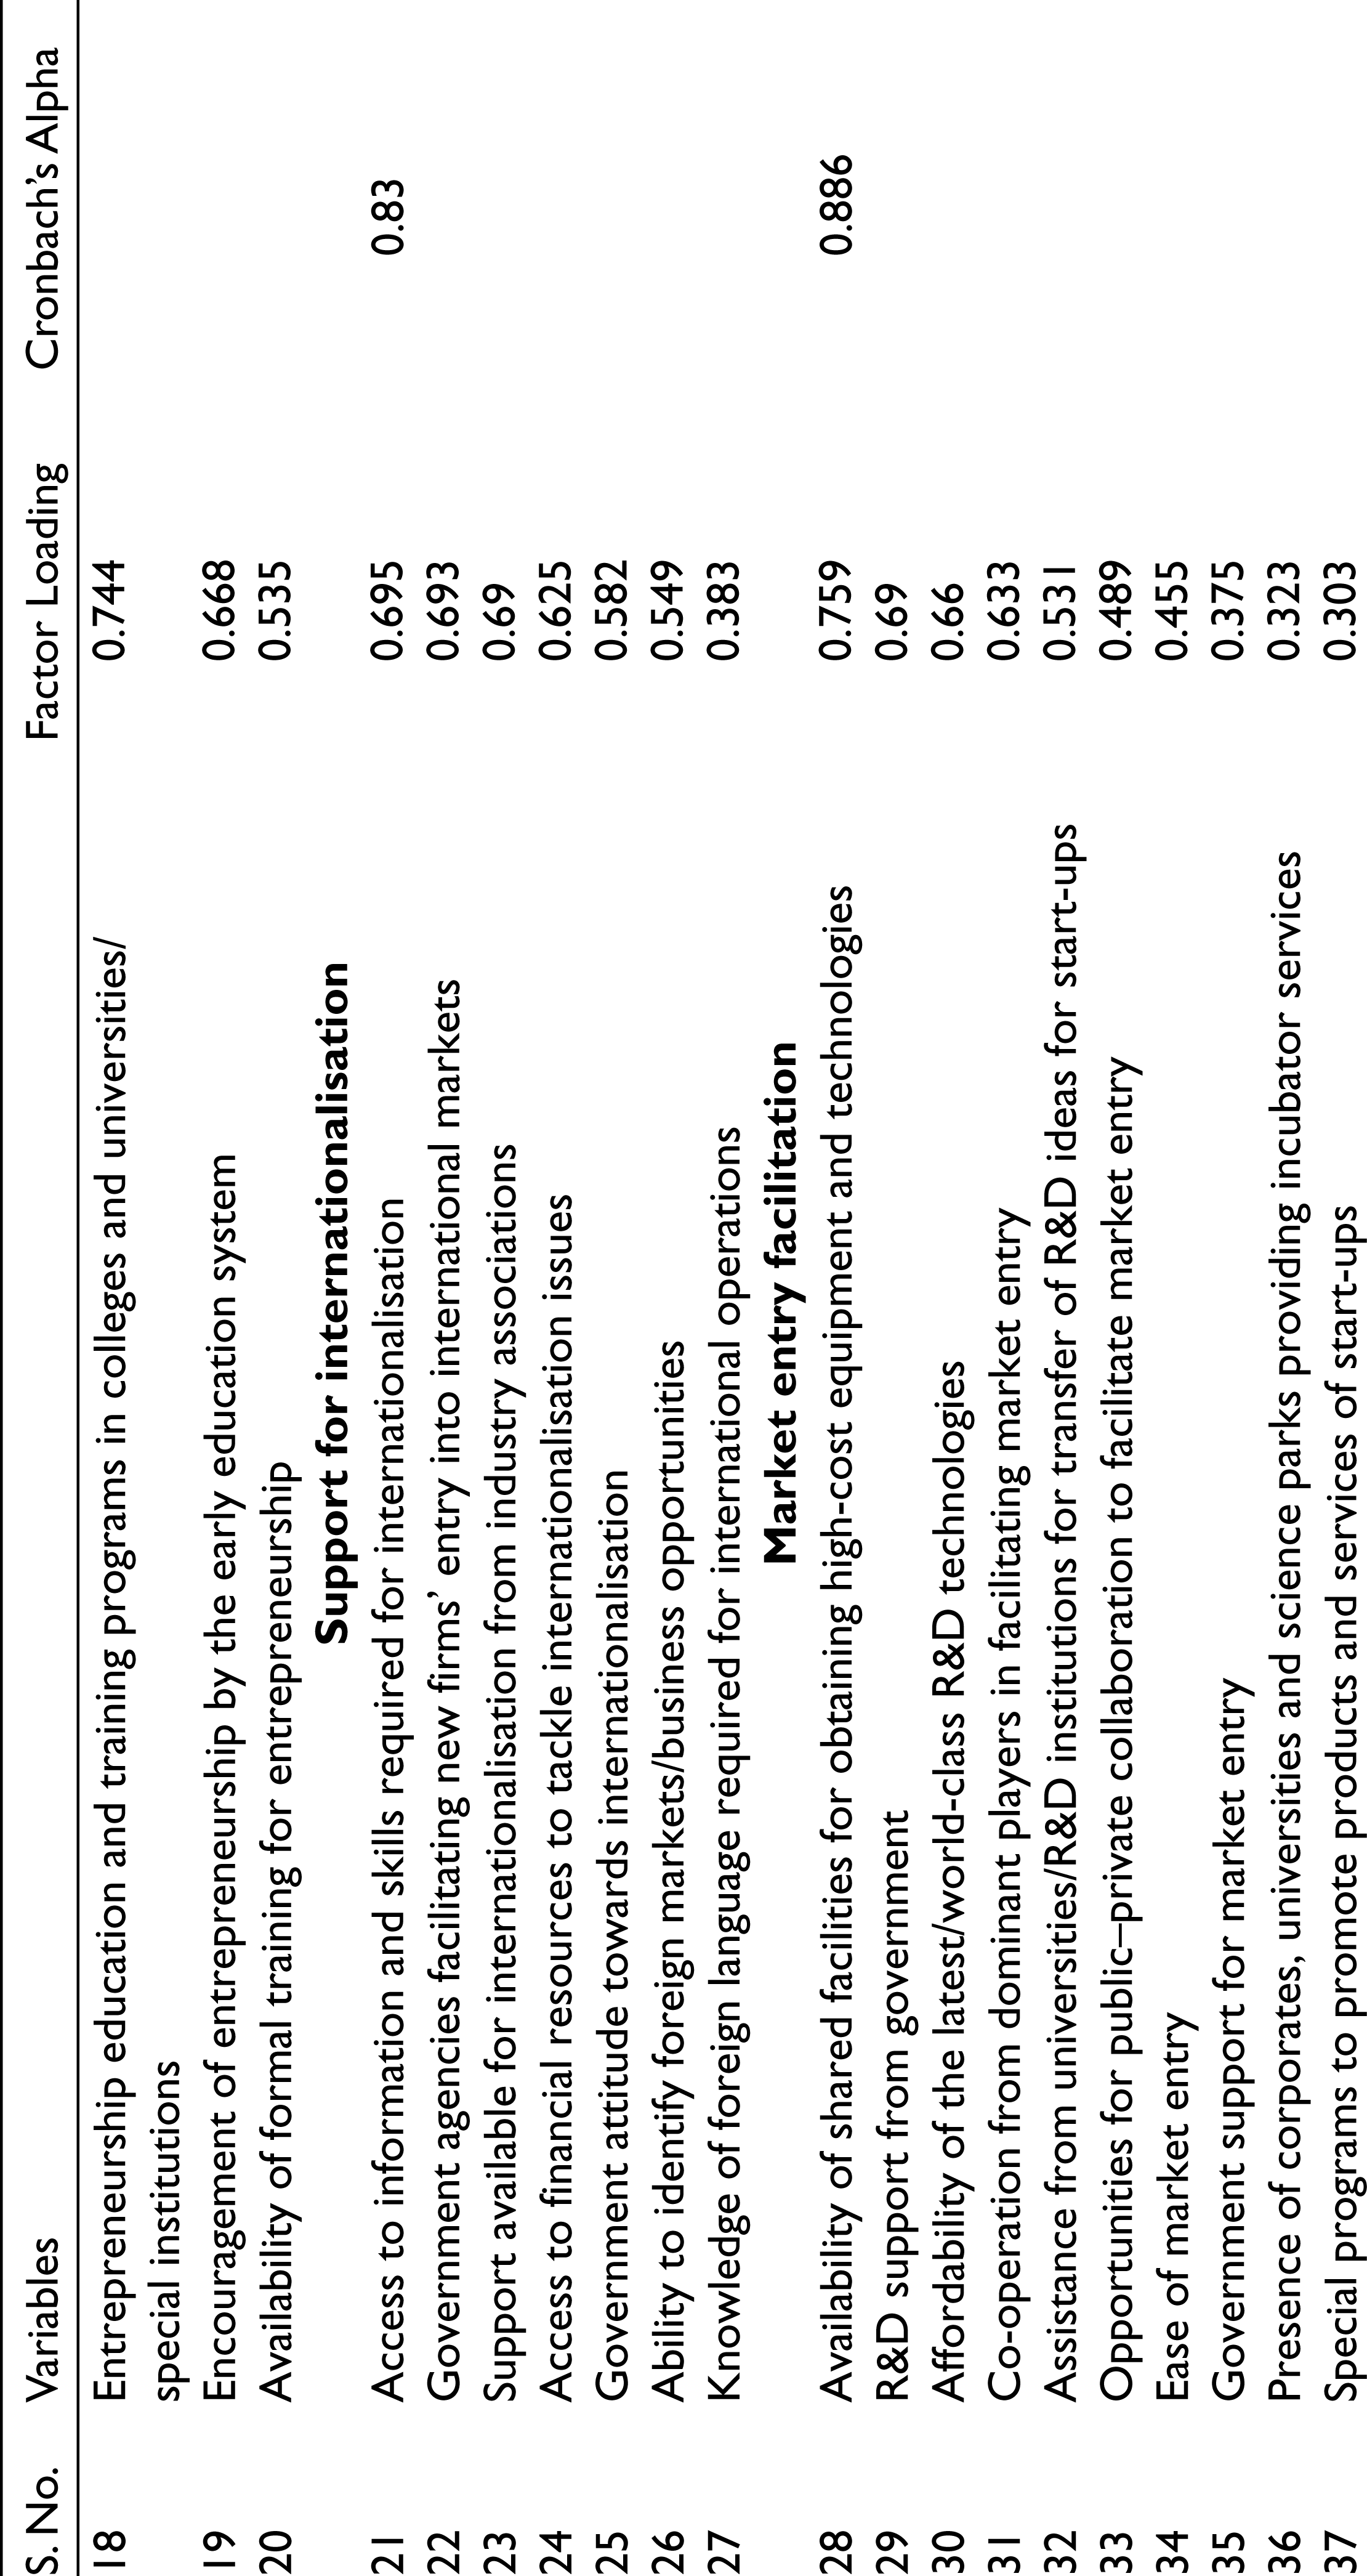


| Variables | Factor Loading | Cronbach’s Alpha |
| Favourableness of overall government policies | 0.692 | 0.739 |
| Support of new venture policies | 0.691 | |
| Availability of special government schemes and programs for start-ups | 0.582 | |
| Support of export and import laws and policies | 0.578 | |
| Ease of obtaining permits and licenses (value added tax code, etc) | 0.576 | |
| Support for developing industrial clusters | 0.564 | |
| Support of intellectual property rights (IPR) policies | 0.549 | |
| Government programs that facilitate networking opportunities | 0.529 | |
| Support of foreign direct investment (FDI) policies | 0.519 | |
| Availability of single window system for start-up formalities | 0.469 | |
| Incentives for sustainable and environment friendly business practices | 0.33 | |
| Favourableness of the taxation system | 0.454 | |
| Government policies against corruption | 0.4 | |
| Education system promoting autonomy and creative thinking | 0.856 | 0.907 |
| Encouragement of entrepreneurship by the general education system | 0.814 | |
| Encouragement of entrepreneurship at University level education | 0.808 | |
| Availability of start-up counselling and assistance at college/universities | 0.798 | |
| Entrepreneurship education and training programs in colleges and universities/special institutions | 0.744 | |
| Encouragement of entrepreneurship by the early education system | 0.668 | |
| Availability of formal training for entrepreneurship | 0.535 | |
| Access to information and skills required for internationalisation | 0.695 | 0.83 |
| Government agencies facilitating new firms’ entry into international markets | 0.693 | |
| Support available for internationalisation from industry associations | 0.69 | |
| Access to financial resources to tackle internationalisation issues | 0.625 | |
| Government attitude towards internationalisation | 0.582 | |
| Ability to identify foreign markets/business opportunities | 0.549 | |
| Knowledge of foreign language required for international operations | 0.383 | |
| Availability of shared facilities for obtaining high-cost equipment and technologies | 0.759 | 0.886 |
| R&D support from government | 0.69 | |
| Affordability of the latest/world-class R&D technologies | 0.66 | |
| Co-operation from dominant players in facilitating market entry | 0.633 | |
| Assistance from universities/R&D institutions for transfer of R&D ideas for start-ups | 0.531 | |
| Opportunities for public–private collaboration to facilitate market entry | 0.489 | |
| Ease of market entry | 0.455 | |
| Government support for market entry | 0.375 | |
| Presence of corporates, universities and science parks providing incubator services | 0.323 | |
| Special programs to promote products and services of start-ups | 0.303 | |
| Special schemes to help women entrepreneurs find financial support to start firms | 0.81 | 0.878 |
| Availability of special programs to assist women entrepreneurs start a new venture | 0.804 | |
| Availability of training and educational programs to enhance the skills of women entrepreneurs | 0.716 | |
| Government initiatives to promote networking among women entrepreneurs | 0.689 | |
| Encouragement for women to start new business in your society | 0.646 | |
| Availability of resources (such as water, electricity and raw materials) for business uses | 0.926 | 0.834 |
| Quality of physical infrastructure (such as roads, airports and harbours) | 0.838 | |
| Availability of affordable land for industrial use | 0.791 | |
| Availability of physical, transportation and ICT infrastructure | 0.331 | |
| Availability of suppliers and contractors | 0.428 | 0.795 |
| Quality of IT infrastructure | 0.782 | |
| Availability of affordable IT infrastructure services | 0.702 | |
| Availability of affordable Hi-Speed internet services | 0.626 | |
| Ease of obtaining phone and internet connections | 0.583 | |
| Availability of skilled manpower | 0.472 | |
| Availability of professional consultants (technologists, lawyers, etc.) | 0.398 | |
| Your belief that you can successfully run a business | 0.794 | 0.801 |
| Your ability to manage a business | 0.736 | |
| Your ability to take risk | 0.63 | |
| Your ability to quickly recognise start-up opportunities | 0.627 | |
| Your ability to organise the resources required for start-up | 0.515 | |
| Cultural support from community in promoting venturing and risk-taking | 0.731 | 0.737 |
| Cultural support in encouraging creativity and innovation | 0.614 | |
| Society’s acceptance of entrepreneurship as a desirable career choice | 0.556 | |
| Respect/recognition given to successful entrepreneurs in your society | 0.462 | |
| Equal entrepreneurial opportunities for young individuals in your society | 0.452 | |
| Family’s business background | 0.380 | |
| Gender equality for entrepreneurial opportunities | 0.360 | |
| Opportunities for new venture creation in your country | 0.350 | |
| Celebration of entrepreneurial success (by media and the public) | 0.330 | |
| Tolerance to venture failure in your society | 0.300 | |
| Availability of funds from private individuals/angel funds | 0.666 | 0.727 |
| Availability of venture capital funds | 0.649 | |
| Availability of bank loans | 0.539 | |
| Availability of government subsidies | 0.379 | |
| Availability of funding support from family and friends’ funds | 0.370 | |
| Availability of information regarding business opportunities | 0.756 | 0.776 |
| Availability of required information and assistance for start-ups | 0.698 | |
| Support from industry associations for networking, information and access to resources | 0.457 | |
| Presence of incubators and/or technology parks that offer one stop services for businesses | 0.311 | |