
Abstract
This study tries to estimate the incidence, intensity and inequality of Catastrophic Health Expenditure in India and its determinants using unit-level data from the four consecutive surveys of NSSO on ‘Healthcare Consumption and Morbidity’ spread across a 23-year period. For CHE incidence, a 10% threshold level of household consumption expenditure is considered. Additionally, socio-economic determinants of CHE were identified using multivariate logistic regression. Study reveals that the demand for healthcare services has increased gradually during the period 1995–2014 but this demand is primarily financed from out-of-pocket expenditures and hence leading to an increased risk of financial catastrophe, peaking at 23.45% in 2014. But a significant reduction in demand for healthcare is seen in the latest 75th round. Although the incidence of catastrophe has decreased, the inequality of catastrophic burden has increased. The results show that economic and social vulnerability have a significant impact on the likelihood of CHE incidence in households. The findings suggest that a targeted approach is required to alleviate the socially and economically vulnerable households from health expenditure catastrophe.
Introduction
The aim of any healthcare system is to provide timely access to health services to the people. This cannot be achieved without a well-functioning healthcare finance system (World Health Organization [WHO], 2010). In recent years, there has been a growing commitment to achieve Universal Health Care (UHC) whose three main goals are: equitable access, quality of service and protection against financial catastrophe from payments for the services. So, health policies should not only be concern about providing equitable access to health services to the population but also make the essential service affordable for them. A big concern in this regard is the impact of health expenditure on the economic status of the households who face illness. Most high-income developed countries have insurance policies in place to ensure the services are provided fairly equitable and affordable (Thomson et al., 2009). However, in low-to-middle-income countries (LMICs) like India affordability is a major concern, especially in the absence of prepayment systems where the payments for health services happen primarily on an out-of-pocket basis.
A fundamental concern of governments in striving for UHC is how to finance such a health system. There are two major approaches to funding a UHC system: Government financed, and Market-based. Government financing provides everyone living in the country with coverage that offers access to some basic level of care. Most people pay for these systems through taxes and other charges. For example, the United Kingdom has a ‘single-payer’ system where the government pays directly for the care provided. In some other cases, the government pays a part of the expenditure through the taxes collected, while the rest is paid for by the individuals and the employers directly. Conversely, in a market-based model, the cost of services is paid by private parties like employers and individuals. In these markets, private insurers have a huge role like in the United States where 220 million people pay for through employer-funded or privately funded health insurance policies (U.S. Census Bureau, 2020). However, India has neither a single-payer system nor the private insurance market integrated enough to achieve this.
The global average share of total health expenditure in GDP for 2018 was 9.85% (World Bank) while Indian health expenditure is less than half of it at 3.8% in 2017 (NHA, 2016–2017, National Health Systems Resource Centre, India, 2019). Also, public health spending accounts for only 32% of total health expenditure, which is 1.2% of GDP.
Due to this low public spending on healthcare in India is financed mostly by household out-of-pocket expenditure, which was 63.2% of total health expenditure in 2017. Such out-of-pocket payments can lead to personal and household catastrophe. The expenditure for medical care becomes financially catastrophic when it endangers the family’s ability to maintain its customary standard of living (Berki, 1986). With this understanding, the current study tries to find the incidence of Catastrophic health expenditure (CHE) and assess the household socio-economic indicators that determine the incidence of CHE due to out-of-pocket (OOP) payments for healthcare services in India.
Literature Review
Healthcare financing in many LMICs including India is heavily relied upon OOP payments of the individuals. Estimates from the consumer expenditures survey (CES) of 1999–2000 show that OOP expenditures in India amount to 5% of total household consumption expenditure, ranging from 2% in Assam to 7% in Kerala (Garg & Karan, 2008). Low levels of utilisation of public health facilities, only 45% in inpatient care and 20% in outpatient care, lead to seeking health services from private facilities driving up OOP expenditures in India (Ramani & Mavalankar, 2006). An analysis of the 75th round of the NSSO survey also supports this notion with ill episode-affected households spending 30.4% of consumption expenditure on health when visiting public facilities against spending 74.1% when visiting private facilities (Yadav et al., 2021). Such a high share of OOP health expenditure (OOPHE) is placing a significant financial burden on the population and becomes catastrophic when it crosses a certain threshold of total consumption expenditure (Sangar et al., 2018; Wagstaff & Doorslaer, 2003).
A comparison of the 52nd and 60th rounds of National Sample Survey Office (NSSO) surveys found that the average OOP share in consumption expenditure rose in richer households than the poorer signifying an over-medicalisation among the richer quintiles, while the poorer quintiles were facing more impoverishment than the richer quintiles (Ghosh, 2010). Analysis of three CESs (2000, 2005, 2012) showed that the poorest quintile of India saw a relative decline in the OOP spending on inpatient care, likely a result of foregoing care rather than benefitting from cashless publicly financed insurance schemes (Karan et al., 2014).
Studies comparing 60th and 71st round of NSSO surveys found significant rural-urban differences in the economic impact of OOPHE. The burden is higher on the poor in urban areas and the rich in rural areas. Also, rural households were more likely to resort to financial coping mechanisms like borrowing and the sale of assets to meet the OOPHE (Sangar et al., 2018). Nationally, the incidence of CHE was disproportionately concentrated among the rich in 2004, but in 2014 it was equally distributed among income classes due to the rise in CHE among the poor over time (Pandey et al., 2018). Average OOPHE also shot up in this decade. Richer households are found to be spending more on inpatient care while the poor were spending more on outpatient care. The CHE incidence decreased for outpatient care and increased for inpatient care (Akhtar et al., 2020). A study in Urban India showed a similar result with poor households bearing a high OOP spending burden ratio (0.57) compared to the rich (0.15) (Misra et al., 2013).
A study of household surveys from 59 LMICs found that the CHE incidence was high in transitional and Latin American countries and varies widely across countries. Three key reasons for CHE incidence were: the availability of health services requiring payment, low capacity to pay and the lack of prepayment or health insurance. So, moving the health system reliance off OOP payments would be the optimal solution to reducing CHE (Xu et al., 2003). Socio-economic factors, such as education level, age composition and geographical location impact the risk of incurring CHE among households (Aregbeshola & Khan, 2017; Su et al., 2006). An Indian study of CES 2004–2005 data using ‘ability-to-pay approach’ found that higher education and incomes reduce CHE incidence, while economic and social vulnerability enhances it (Pal, 2012). In Asian countries, a substantial portion of OOPHE is financed by borrowings and the sale of assets, leading to a reduced CHE shock on consumption in the short run. However, these coping mechanisms may lead to a much greater impact in the long run (Flores & Donnell, 2016). In India, such coping mechanisms account for as much as three-quarters of inpatient expenses (Flores et al., 2008). Coping mechanisms are more popular among the economically and socially vulnerable (belonging to SC/ST/OBC) in India (Gupta & Joe, 2013).
Healthcare utilisation is pro-rich, and the OOP burden is higher on the poorest population, meaning the OOP expenditure rises with ability-to-pay but the share of OOP expenditure reduces with increasing ATP (Chaudhuri & Roy, 2008; Khan et al., 2017). However, the introduction of a UHI scheme is found to improve the utilisation of healthcare services among the low-income classes. The introduction of UHI has resulted in doubling the number of outpatient visits and more than doubles the hospital admissions in the newly insured population (Cheng & Chiang, 1997). Health insurance schemes targeted at the poor help reduce the incidence of CHE. The introduction of Catastrophic Medical Insurance in China has reduced CHE incidence from 4.8% to 0.1% in covered expenses and from 15.5% to 7.9% for the total health expenditure (Zhao et al., 2020). Studies on health insurance in India found a positive impact of health insurance on illness reporting as well as reducing OOP and CHE. But improvements on the supply side are needed to increase health insurance participation among the poor (Ahuja & De, 2004; Hooda, 2015). A Study of 63 countries’ World Health Survey data showed the health systems also respond better to the poor with an increase in the public expenditure as a share of total health expenditure (Malhotra & Do, 2016).
With the help of NSSO surveys specific to ‘health and morbidity’, the current study tries to ascertain a picture of CHE incidence at a national level over a wider time compared to the previous literature and also analyses the impact of various socio-economic covariates on CHE incidence.
Data Description
The current study used the unit-level data collected by the NSSO to achieve the objectives. The data collected in four consecutive surveys of NSSO on ‘Healthcare Consumption and Morbidity’ spread across a period of 23 years. The included rounds are the 52nd (July 1995–June 1996), 60th (January–June 2004), 71st (January–June 2014) and 75th round (July 2017–June 2018). The surveys are longitudinal, studying morbidity patterns, utilisation of healthcare services and expenses incurred on medical services.
All four surveys use the same recall period for consumption and healthcare expenditures. A recall period of 1 month was used for consumption expenditure, while the recall periods for health expenditures were 365 days for inpatient care and 15 days for outpatient care. For the study, the expenditure and reimbursements on inpatient and outpatient cases are adjusted to a 30-day reference period. The data contains individual cases of hospitalisation, which are cumulated at the household level to gather a total healthcare expenditure estimate for the households in the survey sample. Similarly, the reimbursements are also aggregated at households and deducted from the total health expenditure to arrive at OOPHE. Since the survey data also lacks information on households’ income, monthly household consumption expenditure (HHCE) is used as a proxy.
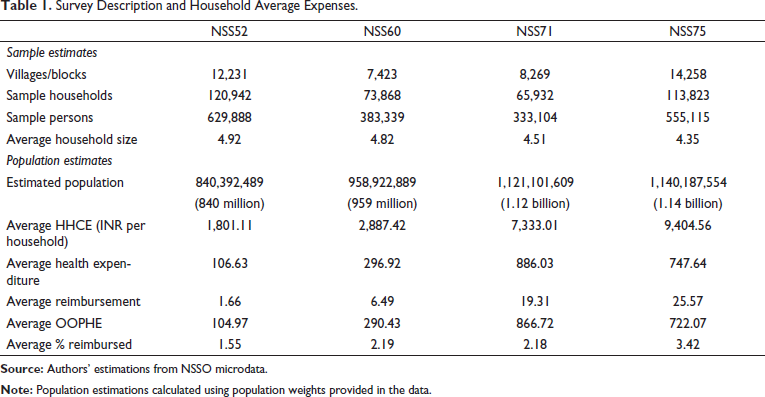
Table 1 depicts the sample sizes and population estimates for the four rounds of data. Additionally, average consumption and health expenditures per household are also estimated. Both the consumption and healthcare expenditures have seen a substantial rise from the 60th to the 71st round. The HHCE has risen further in the 75th round, however, the average health expenditure has gone down in the same period.
Survey Description and Household Average Expenses.
Methodology
In this study, a fixed threshold approach was followed to determine the incidence of household catastrophe (Pradhan & Prescott, 2002; Sangar et al. 2018; Wagstaff & Doorslaer, 2003). The present study sets 10% of HHCE as a threshold at which households expose themselves to significant health expenditure catastrophe. The current study measures the incidence, intensity and inequality of such catastrophic payments.
A household is marked as incurring CHE if 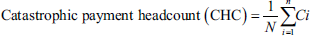
where N is the number of households,
The intensity of catastrophe is measured by measuring the average degree by which the share of expenditure exceeds the threshold level.
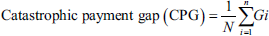
where N is the number of households and
An additional measure of Mean positive gap
To measure the inequality of catastrophe, concentration indexes (CIs) are calculated. For this purpose, income classes were formed by dividing the households into five quintiles based on the per capita monthly consumption expenditure (MPCE). A positive value of CI indicates a pro-rich distribution of CHE incidence that is, the richer households face more CHE incidence compared to the poor. Similarly, a negative CI indicates a pro-poor distribution of CHE incidence. A zero value indicates perfect equality while a value of ‘one’ indicates perfect inequality. Wagstaff and Doorslaer (2003) suggested weighted indices to understand whether the catastrophic payment burden is concentrated among the poor or the better off. A rank weighted index is simply the estimated measure multiplied by the complement of its CI.
Multivariate logistic regression was used to find the household characteristics that determine the incidence of CHE, owing to the binary nature of the dependent variable. The dependent variable is the incidence of household CHE and is classified into two categories: households facing CHE or not facing CHE.
Let the probability distribution of
The logistic probability distribution function can be:
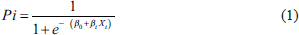
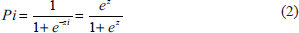
where

Equation (3) represents what is known as the (cumulative) logistic distribution function.
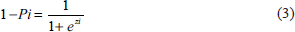
Therefore, we can write
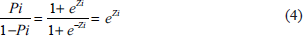
Now Pi
The current study reports the ORs for the independent variables, which include socio-economic characteristics of the households, such as the sector, religion, social class, type of employment, household size and income class. Demographic burden (people aged 60 and above), gender and education level of household head were also used as predictor variables along with the medical insurance status of the household.
The current study has a few limitations. The loss of income due to ill health episodes was not included in the analysis, possibly underestimating the catastrophe. Also, in adjusting the inpatient and outpatient expenditures over a uniform period of 30 days, the study might have overestimated the burden of outpatient expenses. Also, the literature survey identified two different approaches in the analysis of CHE, the fixed threshold approach and the ability-to-pay approach. The ‘capacity-to-pay’ approach has not been used in the current study, due to limitations of NSS health survey data, where food and non-food expenditures are not a part of the questionnaire.
Results
Incidence, Intensity and Inequality of CHE
Table 2 depicts the incidence, intensity and inequality of CHE among Indian households disintegrated among rural and urban areas in the four rounds of NSSO surveys.
Incidence, Intensity and Inequality of Catastrophic Health Expenditure in India.

Incidence
The incidence of CHE has risen in Indian households from 1995–1996 to 2014. 52nd round saw the least incidence with 11.15% of households facing CHE with 11.47% incidence in Rural and 10.27% in Urban. This period also witnessed the least OOPHE share in consumption expenditure at 5.83%. The average OOPHE share is also significantly higher in the rural areas at 6.32% than in urban at 4.9%. In the 60th round, the incidence has risen drastically to 19.69% nationally, with a higher incidence in rural areas at 20.38% compared to the urban at 17.92%. The OOPHE share also almost doubled during this time to 10.06%, with 11.11% in Rural and 8.46% in urban settings. This sudden rise signifies rising demand for healthcare services during the decade between 1995 and 2004.
This rising trend lingered to the 2010s with the 71st round witnessing the highest incidence at 23.45%. The rural-urban gap also come down markedly to 23.61% and 23.12% respectively. The OOPHE share crept up to 11.82 but the rural-urban disparity shrunk to 12.46% and 11.82%. However, the latest round witnessed a contraction in CHE incidence to 16.69%, with rural and urban incidences fairly similar to the national aggregate at 16.97% and 16.12% respectively. This contraction in demand for healthcare services can also be witnessed in OOPHE share. The consumption expenditures have risen in both urban and rural settings but the OOPHE dropped from the previous rounds, resulting in an average share of 8.47% in rural, and 6.77% in urban amounting to a national aggregate of 7.68%.
Intensity
CPG and MPG are used to measure the intensity of CHE. Like with incidence, intensity is also lowest in the 52nd round with national CPG of 3.59% and MPG of 32.17%. The CHE intensity is also higher in rural areas than the urban. The intensity has risen drastically across the next decade and peaked in the 60th round with a CPG of 11.70% and MPG of 59.47%. The rural-urban disparity was also drastic with rural areas witnessing 13.83% CPG and 67.90% MPG compared to the urban intensity of 6.22% CPG and 34.74% MPG, suggesting that rural households had to spend a higher share of consumption expenditure on health service and the households facing CHE are also crossing the threshold by huge margins.
The next two rounds saw a significant drop in the intensity of catastrophic payments. During the 71st round, the CPG and MPG have come down to 9.35% and 39.86% respectively, and rural-urban gaps have also reduced. This intensity has further come down in the 75th round to 6.01% CPG and 36% MPG. This reduction in intensity during the last two rounds could be attributed to the drastic rise of household consumption expenditures in years since the 60th round.
Inequality
CIs are used to measure inequality in the distribution of CHE incidence and intensity. The CIs show a pro-rich distribution of CHE incidence during the 52nd round (CI = 0.0894). The richer households were more likely to cross the 10% threshold level of consumption. This pro-rich distribution is seen both in Rural (CI = 0.1270) and Urban (CI = 0.0230) settings. In the 60th round, a similar pro-rich distribution was seen at the national level (CI = 0.0249) as well as in rural areas (CI = 0.0683), but the urban areas witnessed a pro-poor distribution (CI = −0.0375), meaning poorer households were more likely to face CHE than rich, indicating higher demand for health services among poor in urban compared to the poor in rural.
The rural-urban difference in inequality carried to the 2010s with both the 71st and 75th rounds witnessing pro-rich distribution in the rural households (CIs: NSS71 = 0.0292; NSS75 = 0.0178) and pro-poor distribution in the urban households (CIs: NSS71 = −0.0518; NSS75 = −0.0758). During the 71st round, the CI was pro-rich, but insignificant (p > 0.05), indicating an equal distribution of CHE incidence across income classes, resulting from rising OOPHE and CHE incidence among the poor in both rural and urban areas. However, in the 75th round, the CI has turned pro-poor (CI = −0.014), suggesting that at national level, the CHE incidence has transformed from pro-rich in 1995–1996 to pro-poor in 2017–2018. This means that poor households are increasingly more likely to face CHE than the rich.
In terms of inequality in the intensity of catastrophic payments, the CPG was significantly pro-rich distributed in the 52nd round (CI = 0.1284) but the MPG was insignificant. The CPG and MPG for the 60th round were insignificant (p > 0.05). In the last two rounds, however, the intensity is significantly pro-poor distributed suggesting that the poor households are more likely to cross the threshold by higher margins than the rich.
Determinants of CHE Incidence in Indian Households
The results of the logistic regression, depicted in Table 3, show that many of the socio-economic aspects have a significant impact on the CHE of the households. Households in urban areas were less likely to face CHE than the ones in rural India during the 52nd Round (OR:0.76) and 60th Round (OR:0.79). However, the 71st and 75th found an insignificant impact of Sector on the incidence.
Determinants of CHE Incidence in Indian Households.

The parenthesis next to each variable contain the base criteria used for the regression.
Unlike the Sector, religion is found to have a significant impact on the incidence of CHE across all rounds. People practising minority religions face significantly high odds facing CHE due to OOP expenditure compared to the majority of Hindus. Households belonging to Christianity were most likely to face CHE during the 60th Round (OR:1.37) and the 71st Round (OR:1.49). The other religious minorities (viz., Sikhism, Jainism, Buddhism, Zoroastrianism etc.) were the most likely to face CHE in the 75th round (OR:1.27).
However, households pertaining to socially vulnerable classes (castes) were significantly less likely to face CHE compared to the non-vulnerable ‘Other Castes’. Scheduled tribes are the least likely to face CHE across all rounds with odds of 0.64, 0.56, 0.56 and 0.60. Scheduled Castes were also significantly less likely to face CHE during the 60th, 71st and 75th rounds with Odds of 0.91, 0.89 and 0.84 respectively. Other backward classes are also facing lower odds in the last two rounds (ORs: 0.90 and 0.86). This phenomenon of non-vulnerable classes facing less CHE likelihood could be hinting at the underutilisation of healthcare and low out-of-pocket payments for health services.
The results also indicate that economic vulnerability is an impact factor for CHE incidence. When compared among the five quintiles of HHCE, the quintiles Q2 through Q5 were more likely to face CHE than Q1, that is, the poorest quintile in the 52nd Round (ORs: Q2-1.15, Q3-1.24, Q4-1.72, Q5-2.40) and 60th Round (ORs: Q2-1.11, Q3-1.17, Q4-1.34, Q5-1.30). During the 70th round, income class was an insignificant factor, but the relationship reversed in the 75th round with richer households much less likely to face the CHE than the poor (ORs: Q2-0.86, Q3-0.90, Q4-0.94, Q5-0.71). This is consistent with the CIs of the respective rounds. The first two rounds have the burden of OOP concentrated in richer households while the burden has slowly shifted to the poorer households in the latest round.
The type of household, that is, employment type is an insignificant factor in assessing households’ likelihood of CHE incidence. Household size, however, is a significant factor with larger households (with 5 or above members) more likely to face CHE than small households during the first three rounds (ORs: NSS52-1.35; NSS60-1.38; NSS71-1.24). The size of the household is an insignificant factor during the latest 75th round. Demographic Burden is another major factor impacting the CHE incidence in Indian households. Households with members above 60 years of age are more than twice as likely to face CHE in the latest 75th round (OR: 2.44).
Households with female heads were less likely to face CHE during the 52nd round (OR: 0.84) compared to the households with male heads, but gender has been an insignificant factor in the remaining rounds. The education level of the head of the household is also fairly insignificant across the rounds. Only the households with heads literate at the primary to a secondary level have any significant Odds of facing CHE. These households were more likely to face CHE compared to the households with illiterate heads during the first three rounds. Level of education is an insignificant factor in the 75th round. Medical Insurance was an insignificant factor in the first round but later, the households with medical insurance were more likely to face CHE than the households without medical insurance (ORs: NSS60-2.14; NSS71-1.25, NSS75-1.29), suggesting a better utilisation or more demand for healthcare in these households.
Conclusions
To design an appropriate health policy, it is important to identify households who are more vulnerable to OOPHE burden. The findings of the current study reveal that the demand for healthcare services has increased gradually during the period 1995–2014 but this demand is primarily financed from out-of-pocket expenditures and hence leading to an increased risk of financial catastrophe. But in the latest round, the 75th round of the survey, the CHE incidence has reduced drastically. A reduction in OOPHE is witnessed, which could not be attributed to reimbursements either. Table 1 shows a substantial reduction in total health expenditure per household. This sudden reduction in the share of health expenditure in consumption expenditure suggests a contraction in demand for healthcare services. The present article has managed to identify a few household characteristics that influence the chances of household catastrophe due to out-of-pocket healthcare payments. The results show that economic and social vulnerability (religion and social group) have a significant impact on the likelihood of CHE incidence in the households. The results also show that a household can face CHE irrespective of the type of employment they rely on or the gender and education endowments of the household head and having medical insurance might result in better utilisation of health services.
Between the 71st and 75th rounds, India’s per capita government health spending has gone up from ₹913 in 2013–2014 to an estimated ₹1,657 in 2017–2018 (NHP, Central Bureau of Health Intelligence, India, 2019). This monetary increase in public spending could have helped alleviate the catastrophic burden on Indian households. However, the share of public spending is only 32% of total health expenditure in India. 68.1% of health spending is private, with 63.2% coming out of pocket (NHA, 2016–2017, National Health Systems Resource Centre, India, 2019). Another reason for the high OOP expenditure is the lack of insurance coverage. Only 14% of the rural and 19% of the urban populations have medical insurance, of these, only 13% of rural and 9% of urban population are covered by government healthcare schemes (NSS, 2019, Ministry of Statistics and Programme Implementation, 2020). Table 1 also shows that only 3.4% of total household health expenditure is reimbursed in 2018, indicating a low insurance penetration in India.
More alarmingly, the catastrophic burden is moving from the rich to the poor. During the earlier rounds, the richer households were bearing the burden of CHE more, but the latest round witnessed a shift to poorer households both in rural and urban areas. The results suggest that a targeted approach is required to alleviate the socially and economically vulnerable households from health expenditure catastrophe. State and Central governments have health insurance schemes, such as Rajiv Aarogyasri Health Insurance Scheme (RAS), Rashtriya Swasthya Bima Yojana (RSBY) and Chief Minister’s Comprehensive Health Insurance Scheme (CMCHIS), to alleviate the poor from financial catastrophe due to healthcare spending but they have not been able to reduce OOP burden (Karan et al., 2017). This could be due to limited outpatient cover and low insurance caps, like in the case of flagship program RSBY where outpatient episodes are not included, and the inpatient cover is capped at ₹30,000/- (~US$400) for a family of five on a floater basis. However, the central government has a new scheme, Ayushman Bharat Pradhan Mantri Jan Arogya Yojana (PM-JAY) to achieve the vision of UHC. This scheme is an improvement over the RSBY due to increased coverage of up to ₹500,000/- (~US$6,700) and no limitation on family size and age. This scheme is set to apply for 10.74 crores (107.4 million) households belonging to a poor and vulnerable populations (PM-JAY Report, 2020, National Health Authority, India, 2020). This could be a crucial step in the right direction to alleviate catastrophic payment burdens in Indian households.
Footnotes
Availability of Data and Material
The study used a data set that is available online in the public domain.
Declaration of Conflicting Interests
The authors declared no potential conflicts of interest with respect to the research, authorship and/or publication of this article.
Funding
The authors disclosed receipt of the following financial support for the research, authorship and/or publication of this article: This study was supported by the grant provided as fellowship to the first author by University Grant Commission, New Delhi.