



Abstract
The current study contributes to the existing literature on the relationship between corporate governance (CG) and social performance (SP) of microfinance institutions (MFIs) by introducing CG index for the first time purely in the perspective of Asian MFIs. Moreover, this research also investigates the existence of endogeneity by checking the reverse causality between CG and SP as many previous studies highlighted the endogenous nature of many governance and performance variables. Using a panel of 173 MFIs in 18 Asian countries for the period of 5 years, a comprehensive CG index (CGI) based on seven internal governance mechanism variables is constructed as an indicator of the overall CG mechanism of MFIs. By employing generalized least squares (GLS) model, our results indicate insignificant impact of CG on many SP variables which are attributed to the endogenous nature of this relationship as the significance of results improved by studying relationship in reverse direction by employing ordered logit model. Our results indicate that SP is an important determinant of CG mechanism of MFIs even after controlling for MFI-related characteristics.
Introduction
The organizations that provide small-scale services to the microenterprises and poorest of the economy who are excluded from traditional financial sector services are termed as microfinance organizations. These services are both financial and non-financial. Financial services include microcredit, deposit services, micro-insurance, micro-leasing and money transfer (Ledgerwood & White, 2006), while non-financial services include trainings in different fields and social services like education, healthcare etc. In case of Asian economies, MFIs were established primarily to reduce poverty and improve living standards of overall society. Thus, they play a major role in the economic and financial development of a region. They bring about women empowerment and gender equality as most of the MFIs of Asia work to offer services exclusively to women. Other benefits of the development of microfinance in a region are education for children, provision of better health services and improved standard of living of people and increased employment levels etc. This is why it is very important to facilitate and strengthen the microfinance sector of this region as it works not only with the financial mission but also with the social mission as well.
A well-developed and strong corporate governance (CG) system can play a very important role in defining and protecting the mission of an organization. The OECD principles of CG (2004) defined CG as the process of setting objectives and means for achieving those objectives. Campion Linder and Katherine (2008) defined CG in MFIs as the process of protecting and defining MFIs mission. Good CG system brings many benefits to the MFIs, such as performance improvement, agency cost reduction, improved image of MFIs, increased market trust, access to financial sources and so on. Quality of governance and leadership in MFIs differentiate the stronger MFIs from the weaker ones, because governance of an institution affects its quality of management, strategy and decision-making and growth (CSFI, 2012).
There are lot of studies that provide the evidence of the link between CG practices and financial performance of firms suggesting either good governance leads to improved financial performance in firms (Chen, Kao, Tsao & Wu, 2007; Fernandez & Gomez-Anson, 2006; Mitton, 2002; Morck, Shleifer & Vishny, 1988; Oxelheim & Randoy, 2003; Randoy & Goel, 2003; Welbourne, 1999; Wruck, 1989) or CG itself is affected by prior firm’s performance (Cho, 1998; Farooque, Zijl & Dunstan, 2007a; Farooque, Zijl, Dunstan & Karim, 2007b; Loderer & Martin, 1997). These studies have basis in Jensen and Meckling’s (1976) agency theory, which states that well-defined CG system is an effective tool in reducing conflict of interest between managers and shareholders of firms and improves the overall performance. Sinha (2006) pointed out that if firms are managed with the objective of shareholder’s wealth maximization instead of profit maximization, the overall CG mechanism of firms is improved through well-defined goals and objectives, information symmetry between managers and shareholders and development of effective strategies for goal achievement. However, there are few studies that stress upon studying the relationship between CG and SP (Byron & Post, 2016; Khan, Muttakin & Siddiqui, 2013; Jamali et al., 2008; Post & Byron, 2014).
Stakeholder theory takes us one step ahead by advocating that firms should be managed in the interest of all stakeholders, such as customers, employees and society, instead of only shareholders. Hence, it can be said that corporate social responsibility (CSR) is a missing link between CG and performance, which can be used strategically to resolve conflicts between managers and shareholders of firm (Freeman, 1984). Jensen (2002), Scherer, Palazzo and Baumann (2006), Harjoto and Jo (2011), Jo and Harjoto (2011, 2012) found evidence of conflict-resolution hypothesis using CSR as a missing link between CG and firm performance.
Recently, microfinance sector, which was developed primarily in response to increasing level of poverty in Asia (Daher & Sout, 2013), is experiencing ‘mission drift’ from its primary social goals to profit maximization (Cull, Demirguc & Morduch, 2007; Gonzalez, 2010; Hermes & Lensink, 2007; Schmied, 2014; Sinha & Chaudhary, 2011; Vanroose, 2007). Mersland and Strom (2008, 2009), Coleman and Osei (2008), Manderlier, Bacq, Giacomin and Janssen (2009); Bassem (2009), Tchuigoua (2010), Aboagye and Otieku (2010), Hartarska and Mersland (2012) and Galema, Lensink and Mersland (2012) found evidence of how CG practices in MFIs can help them in fulfilling their social responsibility. However, this is the only one dimension of CG and social responsibility relationship that has been addressed in microfinance literature. Ackerman (1973) pointed out that firm’s social orientation is not only derived by the manager’s good intentions but also should be a constant part of firm’s business practices. De Graaf and Herkströter (2007) asserted that CSR of a firm is entrenched into its governance structure, which makes it possible to incorporate stakeholder’s interest in business processes. Jamali et al. (2008) suggested that CG and SP are overlapping concepts, with CG as a pillar of CSR and CSR as a dimension of CG. In fact, more and more firms are integrating CSR concepts in their business practices using special corporate responsibility committees in their governance structures (Spitzeck, 2009). Many of the firms are also recognizing that CSR practices should be reflected in the day-to-day activities of firm, before they can be integrated into the firm’s policies (Gupta, 2012). Labie and Mersland (2011) suggested the incorporation of stakeholder’s approach in CG and performance literature of MFI to broaden its vision that would help in identifying how MFIs are really managed in relatively un-regulated and market ill-disciplined governance structure of microfinance? Mori and Mersland (2014) proved that the board structure and performance of MFIs is greatly influenced by the stakeholder’s representation. Microfinance, which provides financial services to poorest and under-privileged people of the society, is relatively riskier sector of economy with the most pressing risks facing this industry are risk of over-indebtedness, credit recovery and quality of management and governance (CSFI, 2014). Black, Jang and Kim (2006) found that if riskier firms followed the stakeholder perspective and increased their social responsibility activities then they can reduce the agency conflict and improve their CG structure in MFIs.
In case of Asian economies, microfinance sector was established in response to the prevailing poverty conditions when Muhammad Yunnus started his micro-lending programme and led the way to the formation of Grameen bank or ‘village bank’ in Bangladesh, which offer group lending services to women (Daher & Sout, 2013). The MFIs secure the unique positioning in Asian economies to enhance the social stability by alleviating the poverty and improving the employment conditions of this region (Sarkar & Singh, 2006). Therefore, they play a major role in the economic and financial development of a region. Moreover, the main establishment of MFI’s was based on the social betterment of overall society by improving the living standard of poor and needy people of the society especially in the case of Asian region. Among the social development programmes of MFIs, women empowerment and gender equality are highlighted as most of the MFIs of Asia offer services exclusively to women. Other benefits of the development of microfinance in a region are education for children, improved health and standard of living of people, and increased employment levels etc. On the basis of the above-mentioned arguments, it is worth-full to incorporate the stakeholders approach to examine the CG and SP relationship. Thus, this study explores the nexus of CG and SP of Asian MFIs in the perspective of stakeholder theory.
The article is organized as follows. Second section discusses the relevant literature followed by research methodology presented in third section. The descriptive and empirical analysis is presented in fourth section followed by conclusion and recommendations at the fifth section.
Literature Review
Different researchers have studied the relationship between CG and firm performance in different sectors and have found problems of endogeneity. Dalton, Johnson and Ellstrand (1999) performed meta-analysis and found positive relationship between board size and firm performance. Meta-analysis cannot determine the direction of causality so it was not clear whether board size increases performance or vice versa; so they concluded that future research was needed for assessing the direction of causality. Borsch and Koke (2002) surveyed different papers on CG and found certain econometric problems in those empirical studies. Most common problem which they noticed was that certain variables were assumed to be exogenous but were actually endogenous. They claimed that reverse causality is present in the relationship of CG and firm performance. Cho (1998) studied the relationship of ownership structure, investment and corporate value in 326 manufacturing firms of Fortune 500. Evidence of endogeneity was found in the results, and it was concluded that investment affects value of firm which further affects ownership structure while ownership structure had no effect on corporate value. Gruszczynski (2006) studied CG ratings as endogenous variable and concluded that companies having high profits and low debt ratio will probably have good CG ratings.
Lehn et al. (2009) studied the determinants of board size and composition. Firm size, growth opportunities, geographical distribution and M&A activity were considered as important determinants of board size and composition. Farooque et al. (2007b) also studied CG endogenously and found evidence of reverse causality between performance and CG in listed firms of Dhaka stock exchange for period of 8 years. Valenti, Luce and Mayfield (2011) studied the impact of firm performance changes on board composition and found board size and outsiders in board decreased after performance decline. The evidence of leadership structure as an endogenous issue was also provided by Chen, Lin and Yi (2008). They found that firms which changed their leadership structure were experiencing declining performance and their performance did not improve after changing leadership structure.
Elsayed (2007) found that there is no impact of leadership structure on corporate performance in Egyptian public-limited firms. Whole sample was divided into three sub-groups on the basis of performance, and significant positive relationship was found between both variables in low performance sub-group. Hillman and Cannella (2007) studied the presence of female directors in board as an endogenous variable in a sample of 1,000 US firms and found female board member likelihood to be greatly determined by the organizational size, nature of industry and formal network of the organization. Adams and Ferreira (2009) found the negative impact of gender diversity on financial outcomes of US firms. They attributed these negative results more robust than the previous studies, claiming positive relationship between two variables as they addressed the issue of endogeneity in performance and gender diversity relationship. In the end, they highlighted the importance of studying endogeneity in gender diversity and performance regressions. Wintoki et al. (2012) also highlighted the issue of endogeneity in governance and performance relationship and claimed that the past research on performance– governance relationship claiming positive or negative relationship between the two variables is biased and accredited this biasness with the unaddressed problem of endogeneity in previous literature.
In the context of microfinance, limited literature is present on the issue of endogeneity in governance and performance relationship. However, there are few studies that have studied this relationship endogenously.
Hudon (2006) studied the relationship between MFI management and performance using an un-weighted mean of four management indicators as a response variable. Results suggested that MFIs having greater outstanding loans are better managed. Mori and Mersland (2014) found significant impact of presence of stakeholders on board on the overall structure of boards and organizational performance. Both funders, that is, donors and creditors, were associated with small-sized boards, while the presence of employees on boards was associated with larger board size. Results also suggested the presence of one-tier board structure in MFIs having customers or creditors as board members. Strom, D’ Espallier and Mersland (2014) answered the question whether female leadership in MFIs improves their governance and financial performance and found the presence of weaker governance mechanism and improved performance in MFIs having female leadership. Previous researches claim the results of governance–performance relationship to be biased because of the endogenous nature of both variables. As the major source of endogeneity is reverse causality, the relationship of CG and performance runs in both directions. Thus, if the SP of firms is determined by their CG structure, then the CG mechanism of firms must also be determined by their SP. Therefore, this study focuses on the issue of endogeneity and studies the impact of SP of MFIs on their CG mechanism.
Objectives
Handful of studies have explored the impact of CG practices on MFIs performance but the issue of endogeneity present in CG and performance relationship is still an under-researched area so this study is an addition in the literature by focusing on the reverse causality between both variables. Moreover, comprehensive index of CG mechanism is still another gap especially in the context of Asian MFI’s. The incorporation of stakeholder approach along with agency theory in the CG and performance relationship is another missing link in previous studies that this study overcomes. Therefore, present study set the following objectives keeping in focus the above-mentioned research gap on the CG and SP nexus of MFIs. It focuses on the issue of endogeneity by investigating reverse causality between CG and SP in the MFIs of Asia. First, it studies how CG can improve social orientation in microfinance sector of Asia? Second, it investigates the issue of endogeneity by investigating reverse causality between CG and SP in the MFIs of Asia. It also answers the question whether more socially responsible MFIs of Asia are also better in their governance structures? Third, present study also identifies the significant SP indicators that best drives the CG mechanism of MFIs in Asia.
Rationale of the Study
This study contributes to the existing literature of CG and MFI performance by constructing a comprehensive index of seven CG variables, related to leadership and ownership dimensions, purely in the perspective of microfinance sector of Asia. It provides more detailed and combined effect of overall CG mechanism on MFI performance in the form of CGI, which is considered as more effective approach and is still an under-researched area, especially in microfinance (Bebchuk et al., 2009; Gompers, Ishii & Metrick, 2003). Moreover, this study investigates the relationship between CG and SP of MFIs, hence, stressing upon the incorporation of stakeholder approach along with agency theory in the CG and performance relationship. Another very important contribution of this study is the investigation of reverse causality between CG and performance by first studying how CG can improve social orientation in microfinance sector of Asia and later answering the question whether more socially responsible MFIs of Asia are also better in their governance structures. Present study also provides important policy implications for policymakers and practitioners of microfinance by identifying the significant SP indicators that best drives the overall CG mechanism of MFIs in Asia.
Methodology
The Construction of Corporate Governance Index (CGI)
Prior studies provide evidence of the link between CG practices and performance in microfinance (Aboagye & Otieku, 2010; Bassem, 2009; Boehe & Cruz, 2013; Coleman & Osei, 2008; Galema et al., 2012; Hartarska & Mersland, 2012; Hartarska & Nadolnyak, 2007; Manderlier et al., 2009; Mersland & Strom, 2008, 2009; Mori & Mersland, 2014; Polanco, 2005; Strom et al., 2014; Tchuigoua, 2010; Thrikawala, Locke & Reddy, 2013). However, all these studies provide separate investigation of different characteristic of CG and ignore their combined effect which is considered as more effective approach (Bebchuk et al., 2009; Gompers et al., 2003). Chen et al. (2007) highlighted the importance of combined measure of all CG variables by pointing out that certain characteristic of CG may complement other characteristic or may actually be a proxy for some other characteristic. Based on the above literature, we construct an index of seven CG variables, related to leadership and ownership dimensions, from the perspective of microfinance sector of Asia.
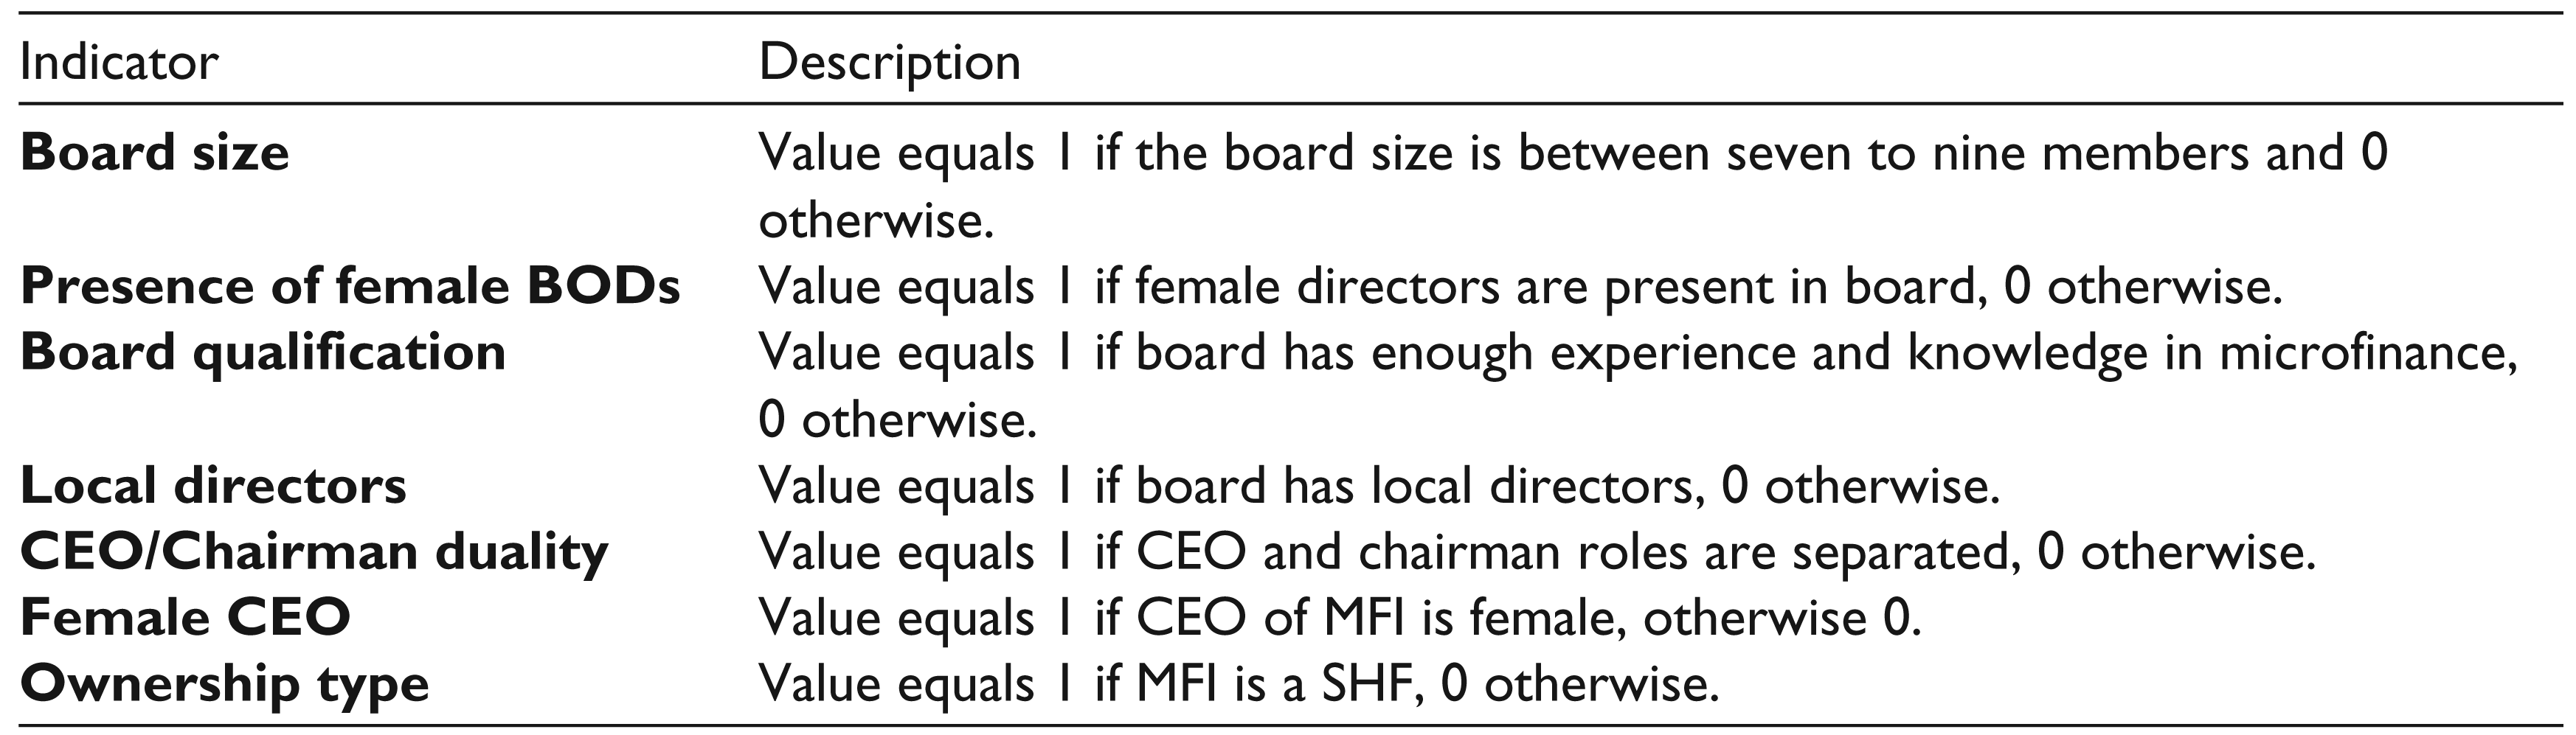
The CGI is used as a proxy for overall CG mechanism of MFIs. Each variable included in CGI is given value equal to 1 for the characteristic that is considered to be effective, for the overall performance of MFIs, 0 otherwise. Index is calculated by the sum of all indicators values. Maximum index value is 7 indicating effective governance mechanisms, while lowest index value is 0 indicating weakest governance mechanisms in MFIs. Table 1 shows the brief description of the indicators used for the construction of CGI for MFIs.
Social Performance
The SP of MFIs of Asia is measured on the basis of two dimensions: one dealing with final outcome, that is, outreach and second dealing with the internal process of MFIs, that is, female employees in an MFI. Females in many rural and conservative areas, especially in Asia, do not feel comfortable in speaking to males. Campion et al. (2008) considered it as a barrier for MFIs in achieving their social mission, as most of the loan officers in MFIs are male members. So MFIs should consider this operational issue and should hire more female loan officers, which could target women easily. Female loan officers to total loan officers are used as a proxy for female employees in MFIs.
Outreach of MFIs is measured on the basis of their depth and scope of services and their loan size. Depth of outreach measures the extent to which MFI reaches the poorest of the economy that have no access to financial sector of the economy (Woller, 2006). Usually women and people living in rural areas are considered as poor who have no access to financial services offered by the commercial sector. Strom et al. (2014) used gender bias and rurality bias as indicators of outreach. Depth of outreach is measured as the ratio of women borrowers to total borrowers and borrowers located in the rural areas as compared to total borrowers (Mersland & Strom, 2008; Rauf & Mahmood, 2009).
Description of CG Indicators
Diversity of products offered by an MFI is termed as its scope of outreach (Schreiner, 2002; Woller, 2006). Schreiner (2002) defined scope between products as offering both lending and savings services. The MFIs offering savings services to its clients have better outreach than MFIs offering only lending services. Ratio of women savers to total savers is used to measure the scope of outreach (Rauf & Mahmood, 2009). Type of savings offered by the MFI also determines its scope of outreach. Voluntary savings services are preferred over compulsory savings services by the MFI and shows better outreach (Woller, 2006). Ratio of voluntary deposit accounts to total deposit accounts is also used as an indicator of scope of outreach.
Loan size is another measure of outreach as it can be used as a proxy for assessing the reach of MFIs to the poor. This can be done by taking into account the average outstanding loan (AOL). The AOL and ratio of AOL to per capita GNI were used as indicators of loan size by Polanco (2005), Christen (2001) and Christen, Vogel and McKean (1995). This study measures loan size as ratio of AOL to per capita GNI.
Control Variables
Literature provides evidence that larger the age of a firm, better will be its CG practices (Black et al., 2006). This may be because older firms have more experience and have had more time to improve their internal governance. Black et al. (2006) measured age of a firm as Ln (years). Mori and Mersland (2014) and Strom et al. (2014) measured age of an MFI as number of years of operation of MFI. Crombrugghe, Tenikue and Surede (2008) used log of years as a proxy for age of MFIs. This study measures age as log of years since establishment of MFIs.
According to Black et al. (2006) size of a firm is a variable other than performance that could affect the CG choices. They measured firm size as Ln (assets). Mori and Mersland (2014) measured size of MFIs as logarithm of assets. Strom et al. (2014) used total assets as a proxy for size of MFI. This study uses log of total assets of an MFI as a proxy for size of institution.
Risk of a firm is also an important determinant of the effectiveness of governance system in firms (Black et al. 2006). Mersland and Strom (2009); Hartarska and Mersland (2012) and Mersland & Strom (2008) used portfolio risk as an indicator of overall risk of MFI measured as portfolio at risk 30 days (PAR 30). This study measures risk of MFI as PAR 30. The PAR 30 is defined as the value of all outstanding loans considered at risk because payments are 30 days past due.
Black et al. (2006) considered regulatory status as the most important indicator affecting governance in firms. Hartarska (2005) included ‘supervised’ as an external control variable in governance performance relationship and measured it as a dummy variable with value 1 if MFI was supervised by banking authority, 0 otherwise. In this study, regulatory status is measured as a dummy variable having value 1 if MFI is regulated by a banking authority, 0 otherwise.
The MFIs offer many types of lending services to its customers like group lending, individual lending etc. Cull et al. (2007) defined three types of MFIs on the basis of their lending methodology: individual lenders, group lenders and village banks. Mersland and Strom (2009) considered loan methodology as an important dimension in MFIs governance performance studies. They measured lending methodology as a dummy with value 1 if MFI offered mainly individual lending services. This study uses three dummies for lending methodology variable: first MFIs offering individual lending services; second MFIs offering group-lending services; and third MFIs offering both types of lending services.
According to legal structure, MFIs can be classified into five types: banks, rural banks, NBFIs, NGOs and credit unions or cooperatives CGAP (2008). Governance practices differ in MFIs according to their legal status (Council of Microfinance Equity Funds, 2012). For example, legal status of an MFI determines the ownership structure of MFIs and the decision-making power in them (Lapenu & Pierret, 2006). So there is a need to control for MFIs according to their legal status. This study measures legal status as five dummy variables of banks, rural banks, NBFIs, NGOs and credit unions.
Human development index (HDI) and GDP per capita are used as country controls as this study revolves around the MFIs of Asia and there is a need to control for country-specific effects. Human development index is a UNDP indicator covering standard of living, knowledge and life expectancy. The GDP per capita is a world development indicator calculated as total output of economy divided by number of people in an economy. Mersland and Strom (2009) used HDI to control country-specific effects in their study of CG and performance. Strom et al. (2014) used HDI and GDP per capita to control for country-specific changes.
Sample and Data
Microfinance sector in Asia was originated with the mission to offer financial services to the poor, who had been excluded from the conventional financial services. The region is the main recipient of microfinance, and given its vast population, also has the largest number of poor households in the world. In 2010, about 63 per cent of the world’s extreme poor lived in East Asia and the Pacific (246 million) as well as in South Asia (507 million) 1 . This population forms an immense client base for microfinance, which has not gone unnoticed. Therefore, we focus on the microfinance sector of Asia as it can play an important role in financial and economic development of a region.
Our data for this study primarily come from the Microfinance Information Exchange (MIX) market 2 website. Where around 1,044 MFIs located in 18 countries of Asia, that is, Armenia, Azerbaijan, Bangladesh, Cambodia, China, Georgia, India, Indonesia, Jordan, Kazakhstan, Kyrgyzstan, Nepal, Pakistan, Philippines, Russia, Sri-Lanka, Tajikistan and Vietnam, have shared their data. Out of these, 418 MFIs have given a rating of four diamonds and above by the MIX market based on the transparency and reliability of the data shared. Our final sample reduces to a total of 173 MFIs in 18 Asian countries for the period of 5 years from 2007 to 2011 because only MFIs rated by the third party rating agencies have been included. Moreover, data for variables used in the construction of CGI index have been extracted from the rating reports and the annual reports of respective MFIs. Those rating reports have been accessed from the Rating Fund website 3 . Data for HDI have been collected from United Nations development Program (UNDP) website 4 , while data for GDP per capita are taken from the World Bank website 5 .
Following models are developed to study the impact of SP on overall CG mechanism of MFIs:
where Xi’β = β1WTB + β2RTB + β3WTD + β4VTD + β5AOL per capita GNI + β6FTL

where Xi’β = β1WTB + β2RTB

where Xi’β = β1WTD + β2VTD

where Xi’β = β1AOL/GNI

where Xi’β = β1FTL

where CGI=Corporate governance index, PAR 30=portfolio at risk 30 days, HDI= human development index, RS1=Regulated MFIs, LM1=Individual lending, LM2=Group lending, LS1=Banks, LS2=Rural banks, LS3=NBFIs andLS4=NGO.
Analysis
Descriptive Statistics
The CGI is a main dependent variable of the study and is composed of seven CG indicators, namely, board size, female directors, international directors, board qualification, female CEO, CEO/chairman duality and ownership type. The CGI is an ordinal variable whose values could range from 0 to 7. The description of CGI is shown in Table 2.
The descriptive analysis of all predictors and control variables involved in this study is shown in Table 3. Descriptive statistics shows that the average age of the microfinance sector is only 12 years, which proves that the microfinance sector of Asia is still very young and is in its early stages. However, one MFI in our sample is as old as 39 years. Minimum value of 0 indicates that MFIs established in year 2007 have also been included in our sample. This study uses log of years since establishment as predictor of the age of MFI. The average size of the microfinance sector of Asia is 90,911 dollars as measured by the mean of total assets.
The values of average women to total borrowers and women to total depositors are 0.72 and 0.323, respectively, which shows that 72 per cent borrowers and 32.3 per cent depositors of all selected MFIs are women. Minimum value of 0 indicates that some MFIs in our sample have no female borrowers or depositors while maximum value of 1 indicates that some MFIs in Asia target only female clients. Average rural to total borrowers of 0.594 indicates that 59.4 per cent clients of the MFIs included in sample belong to rural areas. Some MFIs in our sample do not target rural clients as can be seen from the minimum value of 0 while some MFIs are the specialized rural banks that only target population living in rural areas as can be seen from maximum value of 1. The mean of voluntary to total deposit account is 0.248, which means that 24.8 per cent of all deposit accounts in selected MFIs of Asia are voluntary. Some MFIs only offer compulsory savings services as can be seen by the minimum value of 0, while some MFIs offer only voluntary savings services as can be seen by maximum value of 1. The means of female to total loan officers is 0.19. This shows that on average female loan officers in our sample are only 19 per cent of total loan officers. Minimum value of 0 indicates that some MFIs do not hire any female employees while in some MFIs all loan officers are female. Standard deviation for female to total loan officers is 0.26. The AOL/per capita GNI have a mean value of 0.29 with the minimum value of 0.023 and maximum value of 1.02. Lower AOL/per capita GNI indicate small loan size and better outreach. Standard deviation of AOL/per capita GNI is 0.24.
Description of CG Index

Totally, 75 per cent MFIs of our sample are regulated by some regulatory or banking authority, while remaining 25 per cent are non-regulated. Totally, 12 per cent of our sample is composed of regular banks, 6 per cent rural banks, 47 per cent non-banking financial institutions, 31 per cent NGOs and 4 per cent credit unions. In total, 21 per cent MFIs of Asia included in our sample offer individual lending, 23 per cent group lending and remaining 56 per cent offer both kinds of lending services.
Figure 1 depicts the overall CG mechanism of MFIs of Asia according to their regulatory status. Regulated MFIs have a better system of overall CG as compared to the non-regulated MFIs. The value of median is same for both regulated and non-regulated MFIs, that is, four however the greater variation in the non-regulated MFIs depicts the overall better CG in regulated MFIs. Variance in CG index for regulated MFIs is 1.29 compared to the variance of 1.47 for non-regulated MFIs. Minimum value of CG index for regulated MFIs is 3 compared to the minimum value of 2 for non-regulated MFIs, showing that all regulated MFIs have overall CG index score of at least 3.
Figure 2 depicts the overall CG mechanism in MFIs of Asia according to their legal status. The CGI is used as a proxy for overall CG system and the highest CGI score of 5 for both regular banks and rural banks indicate that both have almost same level of CG system. However, the value of variance in CGI for regular banks is 0.920 and for rural banks is 1.469. The value of variance in CGI for regular banks is low compared to that of rural banks, which shows that regular banks are the highest performing MFIs in terms of CG system. The lowest performing MFIs are the credit unions having the median of 4 with the variance of 1.176.
Descriptive Statistics Summary of the Variables


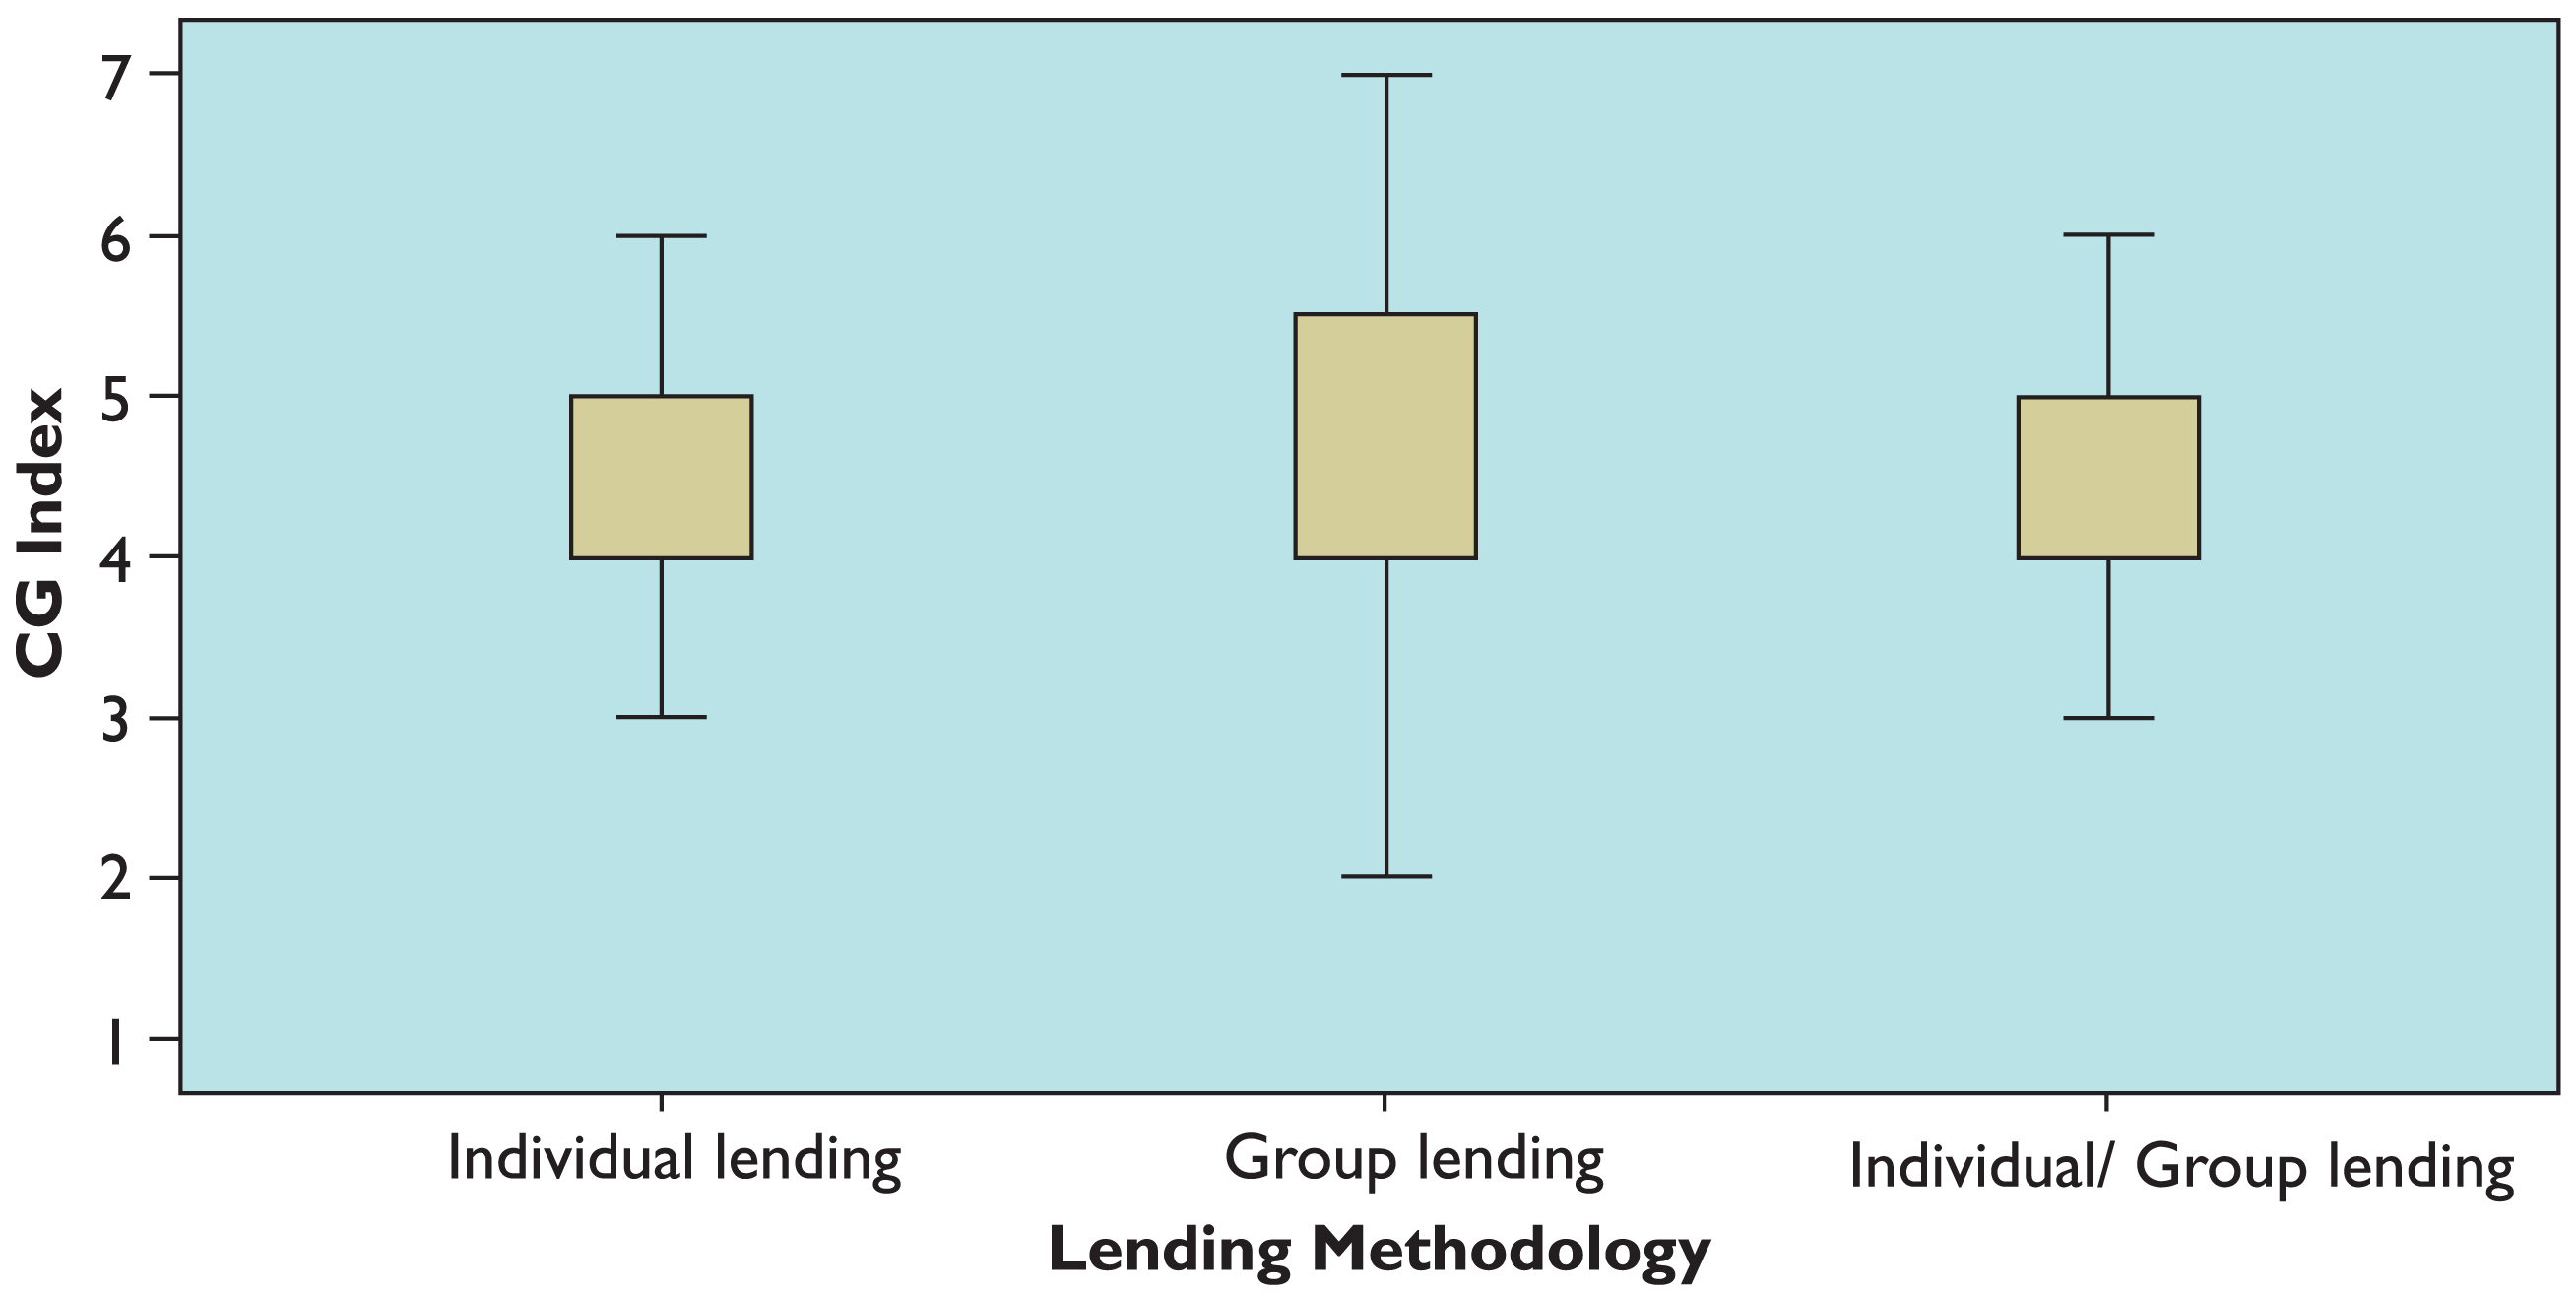
Figure 3 depicts the overall CG mechanism of MFIs according to the lending type offered by them. The MFIs that offer both individual and group lending services have the best CG system as can be seen by the highest CGI score of 5. The MFIs that offer one type of lending service that is either individual or group have CGI score of 4. However, the variation in group lending methodology is more as the variance of CGI for individual lending is 0.999 and for group lending is 1.407. The MFIs that offer both kinds of services have the best system of CG.
Empirical Analysis
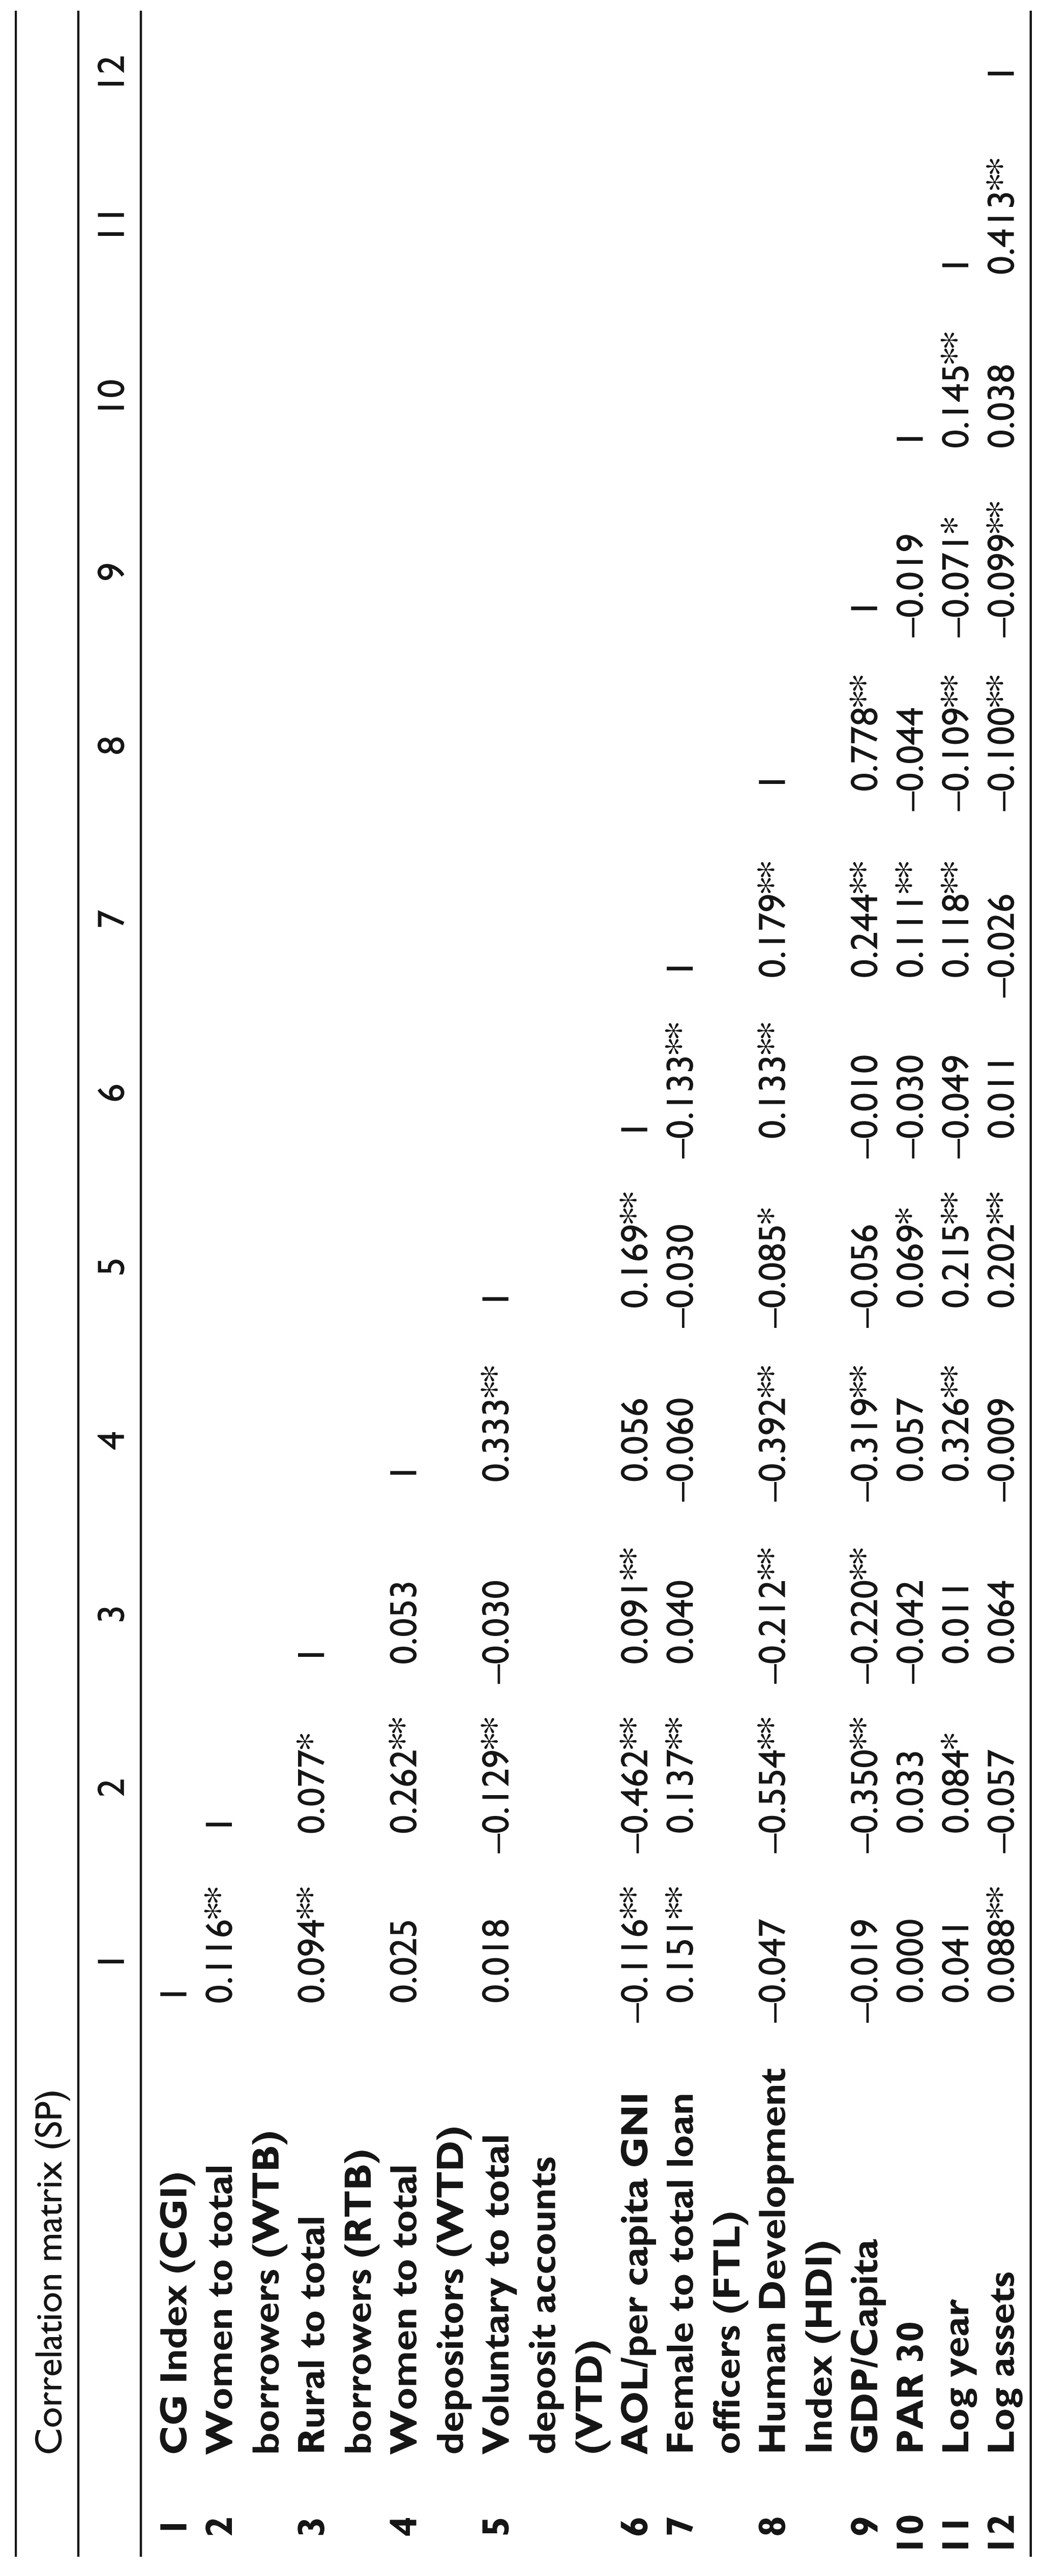
Table A1 provides the correlation between CGI and SP, control and categorical variables. There is highly positive and significant correlation between WTB and CGI, which shows that MFIs that target more female clients and work with the mission of women empowerment have better governance system in their setup because they target underprivileged members of the society. These MFIs hire more female employees because females are better equipped with the women client needs; hence, significant positive correlation is seen between WTB and FTL. The RTB and FTL are also highly significantly positively correlated with CGI, which shows that MFIs that target villages and rural areas and hire more female loan officers in those areas have better governance systems. Negative and highly significant correlation between AOL per capita GNI and CGI also proves the fact that MFIs which are more socially oriented make more efforts in improving governance system, as negative AOL per capita GNI means small-sized loans and better outreach. These results are in-lined with the findings of Strom et al. (2014), who found negative correlation between average loan and CG variables even if their correlation was not significant. Results also show positive correlation between WTD and VTD with CGI but this relation is not significant. Significant correlation is also present in almost all SP indicators with each other, that is, WTB, RTB, WTD, VTD, AOL per capita GNI and FTL, which shows that all of these indicators are different dimensions of one variable, that is, SP. There is positive and significant correlation of log year with SP indicators. This shows that MFIs which are more mature and have more experience are working with the social objectives. Table A1 is attached in appendix.
In order to analyse the reveres causality in CG and performance relationship in MFIs of Asia, regression analysis is carried out in two parts: the first part focuses on the impact of CG mechanism of MFIs on their SP, while the second part analyses the reverse-causality in governance and performance relationship by studying the relationship in reverse direction, that is, the impact of SP on CG mechanism of MFIs.
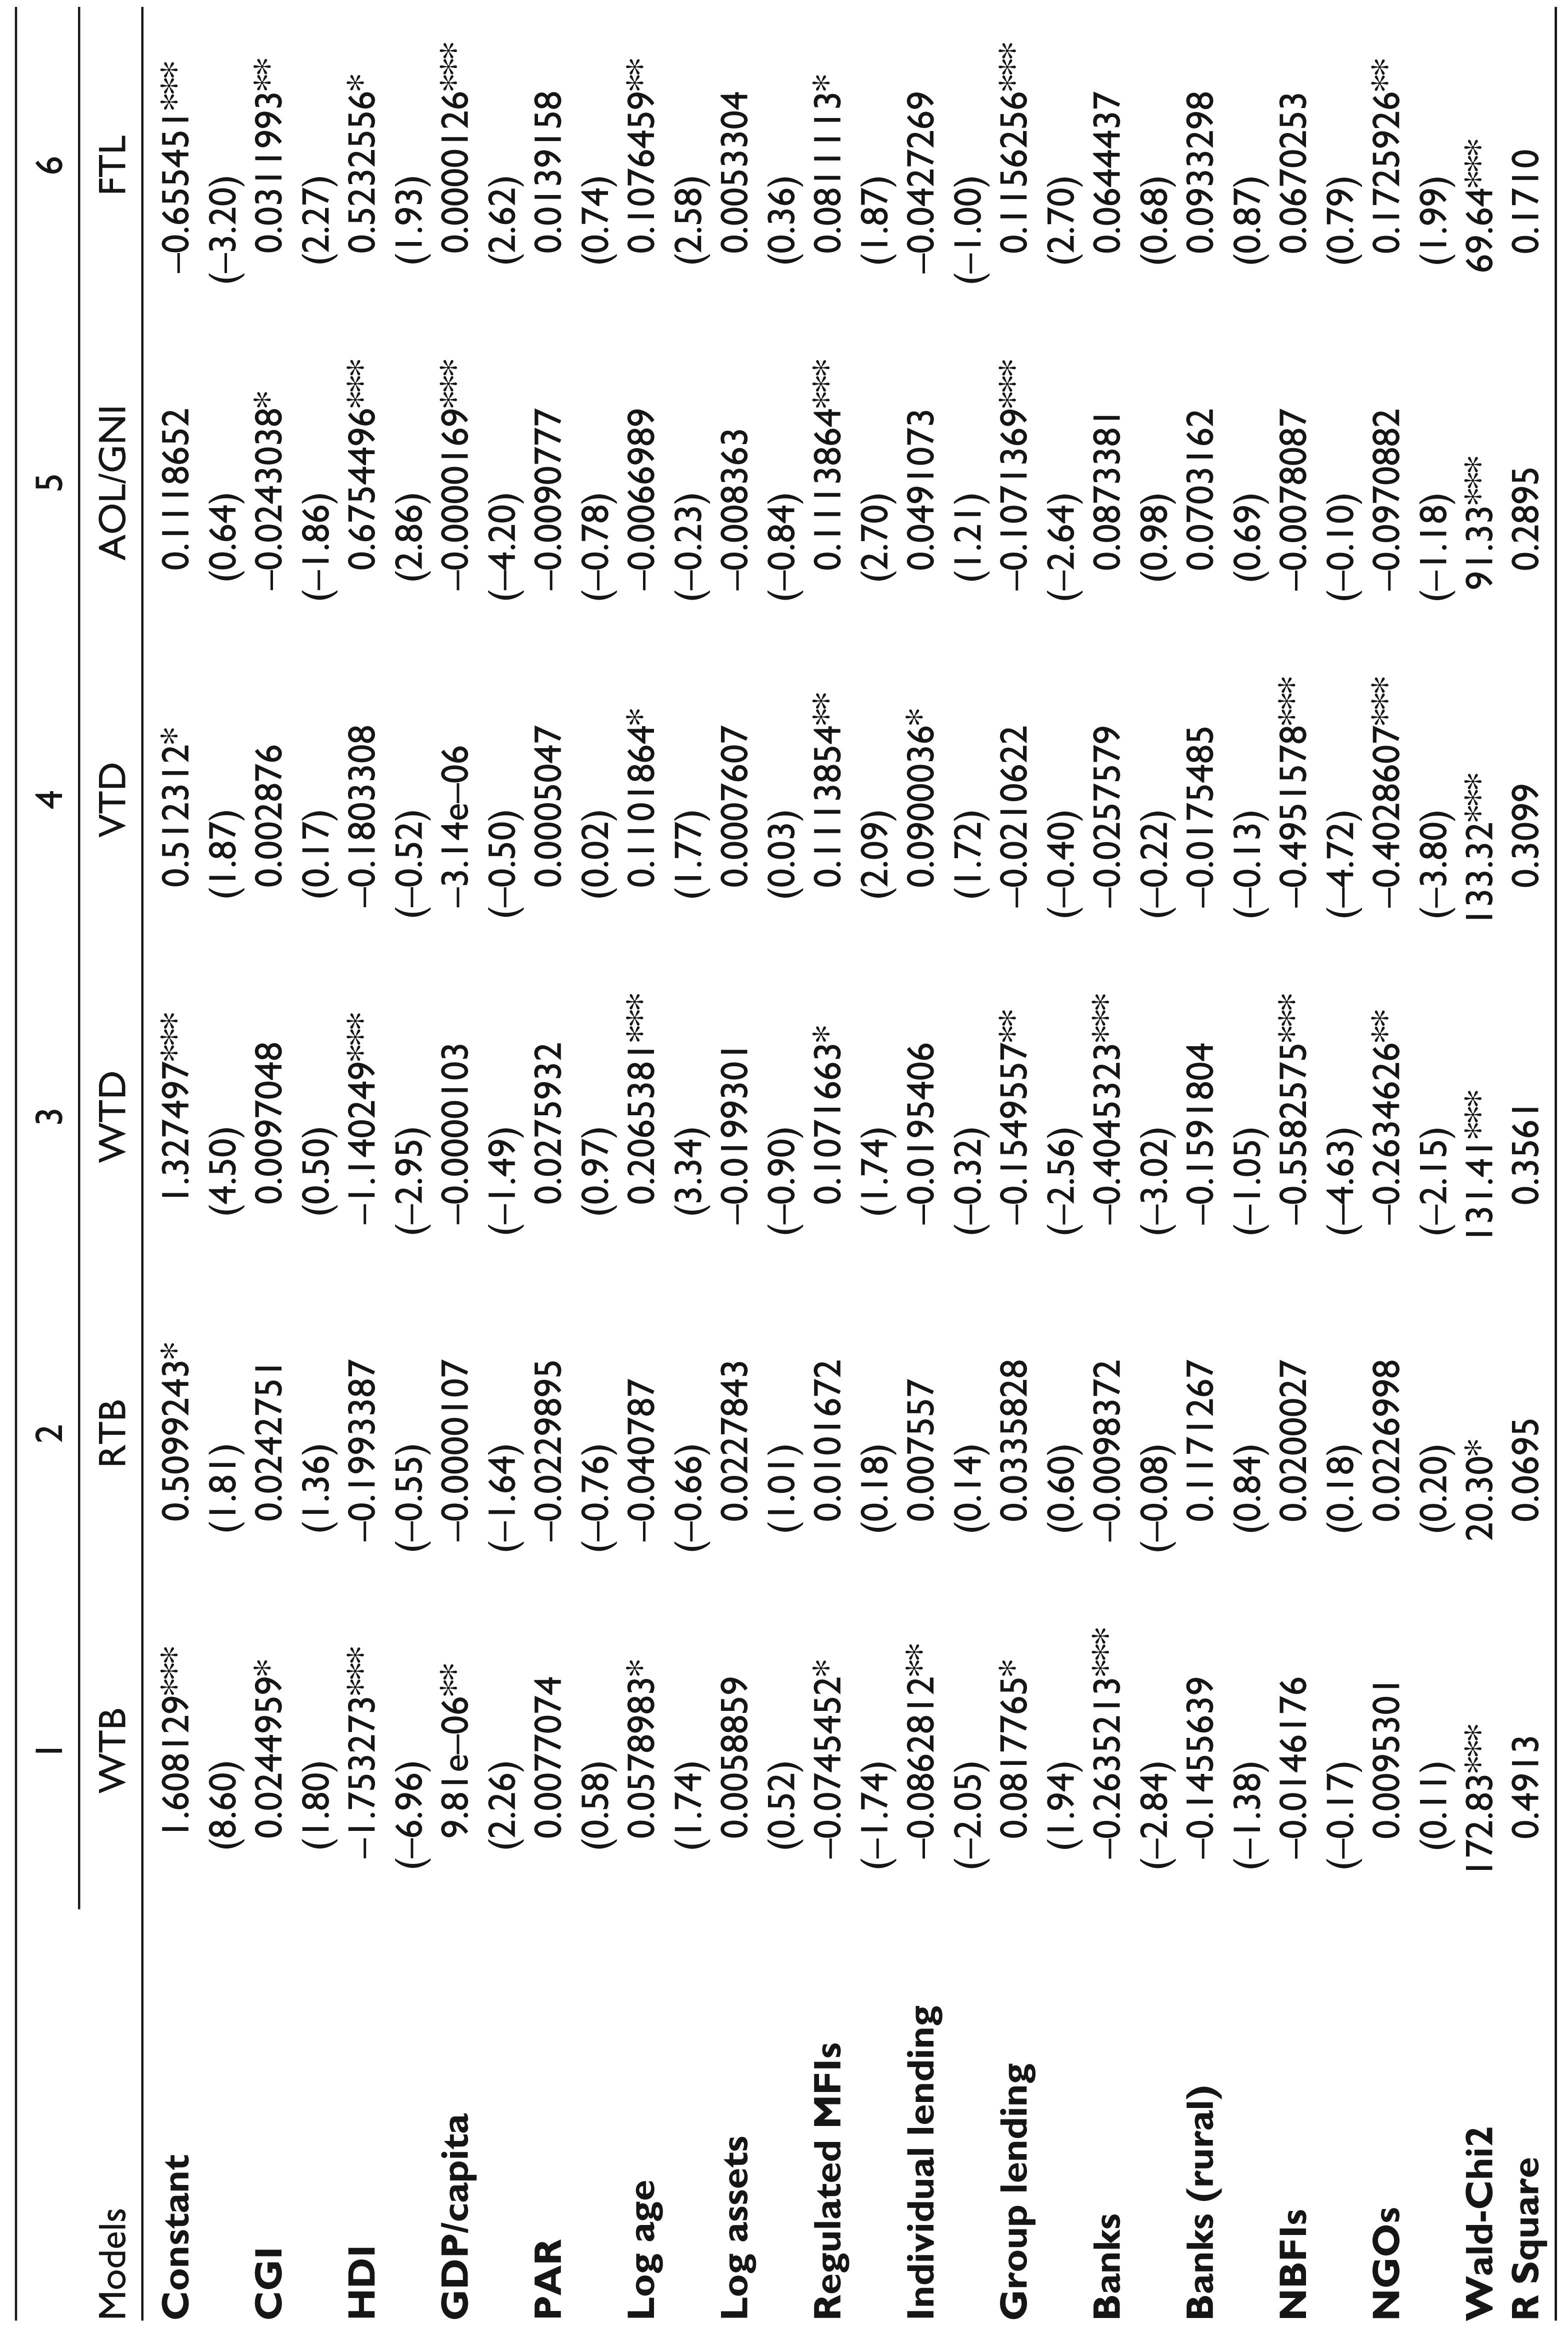
Generalized least square (GLS) models for panel data are used for analysing the impact of CG mechanism on MFIs SP. Table B1 shows the GLS model results for the impact of CGI on SP. Table B1 is attached in appendix A.
By employing random effects model, it is seen that CGI has insignificant impact on RTB, WTD and VTD. The insignificant impact of CG mechanism on outreach of MFIs shows that good governance practices in MFIs do not necessarily mean the social orientation of those MFIs. Outreach of MFIs does not improve with better governance practices. However, WTB and loan size are significantly determined by the CG of MFIs at 10 per cent significance level. The significant results of FTL also show that MFIs having good governance practices hire more female loan officers.
The insignificant results of many SP variables with the CG mechanism of MFIs could be attributed to the endogenous nature of governance and SP relationship. As reverse-causality may exist in this relationship so, the SP of MFIs may determine the governance practices in those MFIs. In this regard, next section studies the impact of MFIs’ SP on their CG mechanism.
Impact of Performance on CG Mechanism
The CGI constructed in this study is an ordinal variable with values from 0 to 7 in ascending order. The models for ordered response variable are the most suitable option for this kind of response variable (Wooldridge, 2010). The ordinal variable CGI is related to the continuous latent variable CGI*, which measures CG mechanism of MFIs. The linear model for CGI* is equal to
where β = k x 1 and Xi’ does not contain a constant.
The value of CGI* is unknown unless it crosses certain threshold points (α1, α2, α3, α4, α5, α6).
where CGI = 1 if α–∞ < CGI* ≤ α1, CGI = 2 if α1 < CGI* ≤ α2, CGI = 3 if α2 < CGI* ≤ α3, CGI = 4 if α3 < CGI* ≤ α4, CGI = 5 if α5 < CGI* ≤ α6 and CGI = 6 if α6 < CGI* ≤ α∞.
Gruszczynski (2006) used ordered logit model for estimating relationship between CG and firm performance for ordered response variable, firm CGI ratings. This study also estimates ordered logit model for the ordinal variable CGI for explaining the relationship between CG and SP in MFIs of Asia.
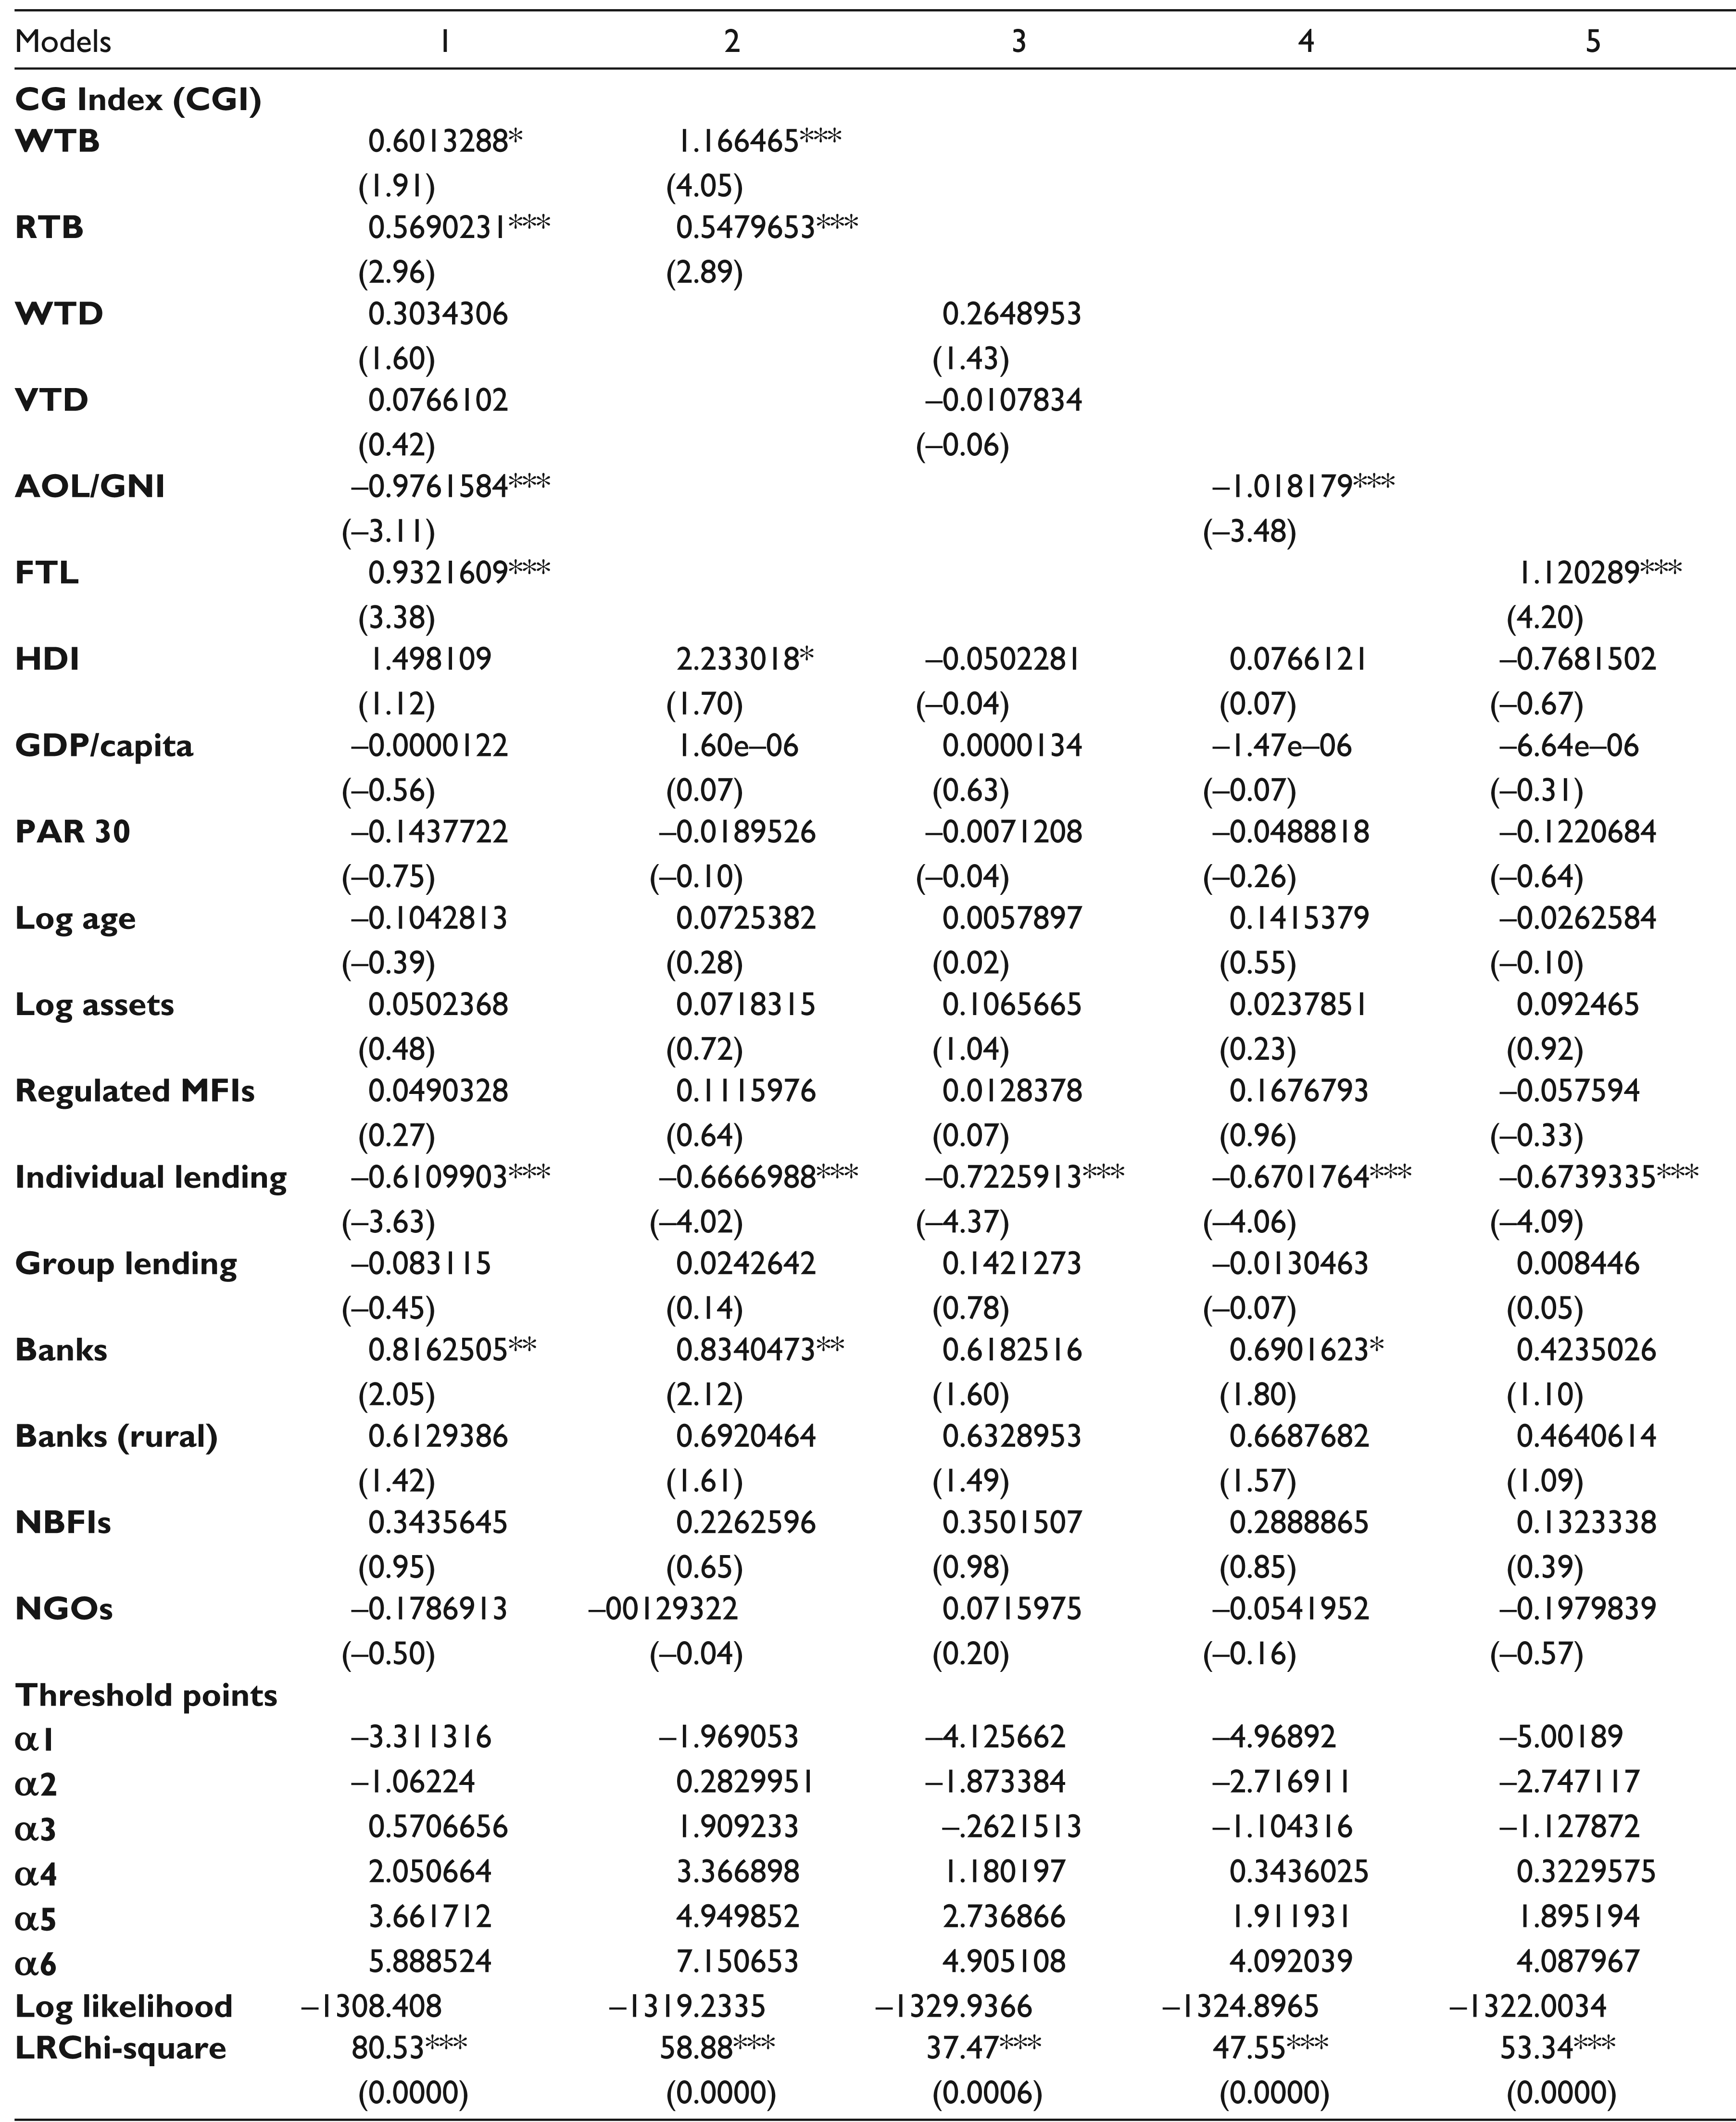
Table 4 provides ordinal logit regression results for SP and CGI. Model 1 measures the aggregate impact of all SP indicators on CGI in the presence of control variables. Models 2 to 5 measure the individual effect of each SP indicator on CGI by controlling the effect of control variables. The values of chi-square show that models depicted in Table 4 are significant at 1 per cent level of significance, which indicates that model is valid.
Variable WTB has a positive and significant relationship with CGI at 10 per cent level of significance in model 1. This shows that MFIs which are more socially oriented and work with the mission of women empowerment are more likely to have better governance mechanism in their setups. We attribute this finding of our research to the fact that the governance structure of institution is greatly determined by its strategic vision (Lapenu & Pierret, 2006) and as most of the MFIs of Asia work with the mission of women empowerment, female leadership is preferred over male leadership because of the communication problems faced by female members of Asian society. Female leadership reduces information asymmetry problems and enhances the overall governance system in MFIs (Mersland & Strom, 2009).
The RTB also has a positive relationship with CGI and this relationship is highly significant at 1 per cent significance level, which shows that MFIs targeting specifically rural population are more likely to have better governance systems. This could be because, MFIs that target poor people living in local rural areas are more prone to credit and default risks. So these MFIs need better monitoring and control practices in their operations to minimize those risks and to tap into local market networks (Mersland & Strom, 2009). The MFIs which have more local operations and target local areas are better able to monitor and control those operations effectively on day-to-day basis, because of better access to local markets and reduced costs like travelling expenditure etc. (Lapenu & Pierret, 2006). These results are also in-lined with the results of Black et al. (2006) who found that riskier firms need stricter monitoring systems hence they have better governance present in them, and the MFIs serving poorest are more prone to default and credit risks. Model 1.1 measures the individual effect of depth of outreach on CGI in the presence of control variables. Results of WTB have improved a lot from 10 per cent significance level to 1 per cent significance level in model 2 as WTB was highly correlated with all other SP indicators as was seen in correlation Table A1.
Ordered Logit Regression Results for Models 1 to 5
(ii) Omitted variables are non-regulated MFIs, MFIs with individual and group lending, and credit unions.
The results of WTD and VTD show positive and insignificant relationship of scope of outreach and CGI which shows that MFIs offering diversity of products may not necessarily have better governance system than those offering few products and services. These results are also consistent when the effect of WTD and VTD is seen individually on CGI in model 3 by controlling the effect of control variables. We attribute these contrasting results for the significance of depth and scope of outreach to the small average age of microfinance sector of Asia, that is, 12 years as can be seen in Table 3. As most of the MFIs are young entrepreneurial firms, optimal level of governance has not settled in this sector (Strom et al., 2014).
The results of AOL per capita GNI are negative and highly significant at 1 per cent significance level, which shows that the MFIs that offer small-sized loans are more likely to have better governance mechanism. As smaller sized loans are linked with better outreach to poor (Crombrugghe et al., 2008), the MFIs working with social objectives are more likely to have better governance. This maybe because smaller sized loans are offered mostly to poor in the group liability format, which is used by MFIs as a cure for increased repayment and credit risk in this sector because smaller loans offered in groups are easier to monitor and keep track of (Mersland & Strom, 2009). Group-based lending also brings monitoring and control by group members on each other as default of one member can affect whole group (Hermes & Lensink, 2007). The results of AOL per capita GNI are same in both models 1 and 4, that is, negative and statistically significant at 1 per cent significance level. These results are in-lined with the results of lending methodology, which again shows that MFIs offering only individual lending services are less likely to have good governance system than MFIs offering group or both types of lending services. These results are consistent in all models from 1 to 5 with individual lending being negative and highly significant at 1 per cent significance level. Another reason for good governance in group lending type is reduced information asymmetry problems in those MFIs. Since groups are arranged in the manner that people living in closer vicinity are arranged into one group. These people are better informed and have social ties with each other (Hermes & Lensink, 2007).
The result of FTL shows positive and significant impact of presence of female employees in MFIs on CGI. These results are also consistent when the impact of FTL is checked collectively with other SP indicators in model 1 and individually in model 5. This shows that MFIs having more female loan officers have better governance system. We attribute these findings to social mission and gender mandate of microfinance sector of Asia. As most of the Asian MFIs target women clients, having female loan officers enhances their information networks about local markets and reduces information asymmetry problems (Campion et al., 2008).
Results of variable log assets are consistent in all models. Results show positive and insignificant impact of MFI size on their CGI. These findings are in-lined with the findings of Black et al. (2006) even though these results are insignificant. Nevertheless, consistent positive sign indicates that larger MFIs have more complex structures so they need more defined CG mechanism. We attribute the insignificance of the relationship to the fact that microfinance is an infant industry still in its development stages. These results could improve with better data set covering larger time period. Legal status also shows consistent results in different models, that is, banks having significant positive relationship with CGI. These results show that MFIs which are banks have better governance system and we attribute these results to the larger size and complex structure of banking MFIs. As it can be seen in correlation Table A1, that banks and log assets are positively and significantly correlated with each other indicating that banks are the largest of all legal types of MFIs.
Conclusion
The MFIs provide financial services to the underprivileged and poor people and serve the market where traditional financial institutions fail to reach. This makes the growth of this sector an essential factor in the development of the whole economy. Lack of good governance practices is considered a main obstacle in the development of microfinance sector in different policy guidelines because good governance helps MFIs in protecting their social missions. In this regard, this study focuses on the role of good CG in microfinance and studies the relationship between SP and CG mechanism of MFIs of Asia. Many researches claim that the results of many governance-performance studies in literature are biased because of the issue of endogeneity in this relationship. As the major source of endogeneity is reverse causality, this study responds to the need of literature in this regard by studying the impact of performance on CG, this relationship has never been studied in microfinance domain.
Using a panel data of 173 MFIs of Asia for a period of 5 years from 2007 to 2011, regression analysis of the study is carried out in two parts. First part studies the impact of CG on MFIs SP while the impact of SP on overall CG mechanism of MFIs is analysed in the second part of the analysis. The results show that social orientation of MFIs does not improve with good governance practices, except smaller loan size and presence of female loan officers. The insignificant results of many SP indicators could be attributed to the endogenous nature of governance and performance relationship as the significance of results improved when that relationship was studied in reverse direction, which confirmed that endogeneity exists and there is a reverse-causality in CG and performance relationship of MFIs of Asia.
Managerial Implications
Revealing results emerge from this study, which have important implications for future researches and policymakers. Depth of outreach of MFIs plays an important role in governance practices of MFIs, which shows that MFIs which works with the mission of women empowerment and poverty alleviation have good governance practices. This finding is also supported by the descriptive analysis which shows that rural banks have best governance practices compared to other legal types of MFIs. We link these findings to the increased credit risk in those MFIs, because MFIs need better governance system to enter into risky market networks. Smaller loan size and presence of female loan officers also play very important role in enhancing the governance mechanism of MFIs and this could be due to improved information networks in those MFIs.
Given the revealing results of SP as a determinant of CG practices of MFIs, policymakers and regulators should give special treatment to this sector. While developing policies of CG practices, specific nature of microfinance sector of Asia should be kept in mind. Practitioners are able to strengthen and improve the overall CG of their institutions on the basis of SP. Similarly, policymakers and regulators of the microfinance sector are able to use these findings when making policies and regulations on governance mechanism of MFIs. This study also opens new avenues of research for academicians and researchers. Findings of this research could be cross checked and validated in regions outside Asia and in sectors other than microfinance. The CG index based on internal governance mechanism for MFIs is also provided in this study, which could help them in structuring and reshaping their governance mechanism according to their previous performance.
Limitations of the Study
The study has following shortcomings and limitations:
First limitation of the study is related to generalization of results to other regions of the world. As this study focuses on the relationship of CG and MFI performance of Asia, results can have limited generalizability to other regions. Data for CG variables are harder to get and rare variation occurs in the variables of CG during short period of analysis. So there is need to conduct study using more than 5 years of analysis. Given the non-availability of data for CG variables in microfinance sector, many of the CG variables could not be incorporated while constructing CG index in this study.
Future Research Recommendations
Based on the conclusion drawn from this study and its shortcomings, this study has following recommendations for future researchers:
Research can be conducted with a larger sample and better data set of more than 5-year time period to provide convincing evidence of the relationship between CG and MFIs performance and to improve the generalizability of results. Findings of this study could be cross-checked and validated in regions outside Asia and in sectors other than microfinance. Comparative analysis of microfinance sector can be done with other financial sectors of economy using same governance and performance variables. Better index of CG in the microfinance perspective can be constructed using more governance variables, which would provide a framework for MFIs to strengthen and develop their governance practices.
Footnotes
Acknowledgements
This article was presented by main author Dr Ahmad Nawaz in Fourth European Research Conference on Microfinance held in University of Geneva on June 1st to June 3rd, 2015.
The authors are also grateful to the anonymous referees of the journal for their extremely useful suggestions to improve the quality of the article. Usual disclaimers apply.
Appendix A
Correlation matrix of SP and CGI
| Correlation matrix (SP) |
|||||||||||||
| 1 | 2 | 3 | 4 | 5 | 6 | 7 | 8 | 9 | 10 | 11 | 12 | ||
|
|
|
1 | |||||||||||
|
|
|
0.116** | 1 | ||||||||||
|
|
|
0.094** | 0.077* | 1 | |||||||||
|
|
|
0.025 | 0.262** | 0.053 | 1 | ||||||||
|
|
|
0.018 | –0.129** | –0.030 | 0.333** | 1 | |||||||
|
|
|
–0.116** | –0.462** | 0.091** | 0.056 | 0.169** | 1 | ||||||
|
|
|
0.151** | 0.137** | 0.040 | –0.060 | –0.030 | –0.133** | 1 | |||||
|
|
|
–0.047 | –0.554** | –0.212** | –0.392** | –0.085* | 0.133** | 0.179** | 1 | ||||
|
|
|
–0.019 | –0.350** | –0.220** | –0.319** | –0.056 | –0.010 | 0.244** | 0.778** | 1 | |||
|
|
|
0.000 | 0.033 | –0.042 | 0.057 | 0.069* | –0.030 | 0.111** | –0.044 | –0.019 | 1 | ||
|
|
|
0.041 | 0.084* | 0.011 | 0.326** | 0.215** | –0.049 | 0.118** | –0.109** | –0.071* | 0.145** | 1 | |
|
|
|
0.088** | –0.057 | 0.064 | –0.009 | 0.202** | 0.011 | –0.026 | –0.100** | –0.099** | 0.038 | 0.413** | 1 |
Appendix B
GLS Model Results for Impact of CGI on SP
| Models | 1 | 2 | 3 | 4 | 5 | 6 |
| WTB | RTB | WTD | VTD | AOL/GNI | FTL | |
|
|
1.608129*** (8.60) |
0.5099243* (1.81) |
1.327497*** (4.50) |
0.512312* (1.87) |
0.1118652 (0.64) |
–0.655451*** (–3.20) |
|
|
0.0244959* (1.80) |
0.0242751 (1.36) |
0.0097048 (0.50) |
0.002876 (0.17) |
–0.0243038* (–1.86) |
0.0311993** (2.27) |
|
|
–1.753273*** (–6.96) |
–0.1993387 (–0.55) |
–1.140249*** (–2.95) |
–0.1803308 (–0.52) |
0.6754496*** (2.86) |
0.5232556* (1.93) |
|
|
9.81e–06** (2.26) |
–0.0000107 (–1.64) |
–0.0000103 (–1.49) |
–3.14e–06 (–0.50) |
–0.0000169*** (–4.20) |
0.0000126*** (2.62) |
|
|
0.0077074 (0.58) |
–0.0229895 (–0.76) |
0.0275932 (0.97) |
0.0005047 (0.02) |
–0.0090777 (–0.78) |
0.0139158 (0.74) |
|
|
0.0578983* (1.74) |
–0.040787 (–0.66) |
0.2065381*** (3.34) |
0.1101864* (1.77) |
–0.0066989 (–0.23) |
0.1076459** (2.58) |
|
|
0.0058859 (0.52) |
0.0227843 (1.01) |
–0.0199301 (–0.90) |
0.0007607 (0.03) |
–0.008363 (–0.84) |
0.0053304 (0.36) |
|
|
–0.0745452* (–1.74) |
0.0101672 (0.18) |
0.1071663* (1.74) |
0.1113854** (2.09) |
0.1113864*** (2.70) |
0.0811113* (1.87) |
|
|
–0.0862812** (–2.05) |
0.007557 (0.14) |
–0.0195406 (–0.32) |
0.0900036* (1.72) |
0.0491073 (1.21) |
–0.0427269 (–1.00) |
|
|
0.0817765* (1.94) |
0.0335828 (0.60) |
–0.1549557** (–2.56) |
–0.0210622 (–0.40) |
–0.1071369*** (–2.64) |
0.1156256*** (2.70) |
|
|
–0.2635213*** (–2.84) |
–0.0098372 (–0.08) |
–0.4045323*** (–3.02) |
–0.0257579 (–0.22) |
0.0873381 (0.98) |
0.0644437 (0.68) |
|
|
–0.1455639 (–1.38) |
0.1171267 (0.84) |
–0.1591804 (–1.05) |
–0.0175485 (–0.13) |
0.0703162 (0.69) |
0.0933298 (0.87) |
|
|
–0.0146176 (–0.17) |
0.0200027 (0.18) |
–0.5582575*** (–4.63) |
–0.4951578*** (–4.72) |
–0.0078087 (–0.10) |
0.0670253 (0.79) |
|
|
0.0095301 (0.11) |
0.0226998 (0.20) |
–0.2634626** (–2.15) |
–0.4028607*** (–3.80) |
–0.0970882 (–1.18) |
0.1725926** (1.99) |
|
|
172.83*** | 20.30* | 131.41*** | 133.32*** | 91.33*** | 69.64*** |
|
|
0.4913 | 0.0695 | 0.3561 | 0.3099 | 0.2895 | 0.1710 |
(ii) Omitted variables are non-regulated MFIs, MFIs with individual and group lending, and credit unions.