



Abstract
Background. Unlike traditional
Purpose. This article aims to present
Method. We used communication about
Results. Three scenarios are designed and analysed to challenge the
Contribution. The system dynamics-based simulation/gaming framework contributes to communicating about complex water resources issues.
Keywords
Mental models represent our assumptions about the causes, consequences, and effective solutions of a problem or an issue at stake (Doyle & Ford, 1998). Our mental models include concepts (i.e. ideas, facts) and relationships that a person considers relevant for a particular issue. On making judgments and decisions, we use our mental models to selectively perceive information and interpret their meaning and relevance (Pahl-Wostl, 2007).
Experimental research in decision making and cognitive science show that our mental models experience several flaws, simplifications, and biases especially on trying to understand and manage complex and dynamic situations such as managing common pool resources (Dörner, 1996). For example, after a series of experiments to study how subjects manage a common resource, Moxnes (2001) indicates that misperceiving the feedback interactions between decisions and system’s processes may cause mismanagement decisions that may end with a resource crisis. Flawed mental models may:
lead to erroneous inferences about the dynamics of the system of interest (Sterman, 2008);
lead to less informed decisions and attitudes towards management policies and other stakeholders (e.g. blame, responsibility displacement, mistrust) (Pahl-Wostl, 2005);
inhibit communication and shared understanding among stakeholders (Tabara & Pahl-Wostl, 2007);
breed conflicts among stakeholders about policies and their outcomes (Kolkman, Veen, & Geurts, 2007).
Unlike traditional methods, simulation/gaming has the capacity to communicate about the complexity and uncertainty aspects of managing natural resources (Barreteau, Le Page, & Perez, 2007). This article aims to present a system dynamics based simulation/gaming framework for communicating to the public about water issues in Australia using the Australian Capital Territory as a case study. The article is organized around three objectives.
First, we present the case for using simulation/gaming based approaches for communicating about water resource issues.
Second, we present an overview about the ACT as a case study application. We describe the system dynamics modelling framework, along with model testing results.
We present the simulation/gaming framework that we used to implement the modelling framework. We use three scenarios to demonstrate how the framework can be used to challenge stakeholders’ mental models.
Communicating About Water Issues
Effective learning and communication mechanisms are essential to improve the mental models of different stakeholders about complex water issues (Meadows, 2006). Effective communication methods provide information that:
is tuned to stakeholders’ needs (Assaf et al., 2008);
covers the system’s biophysical and human processes, and their relevant interactions (Hjorth & Bagheri, 2006);
matches the scale of the problem and decisions (Dietz, Ostrom, & Stern, 2003);
addresses uncertainty about future issues(Folke, Hahn, Olsson, & Norberg, 2005).
Traditional communication methods, such as disseminating information through bill inserts, newsletters and Save Water campaigns, provide superficial and blanket information that cannot address such information requirements. First, they provide either too specific information about water saving (i.e. hints and tips) or too broad information (e.g. the importance of water conservation). This level of information does not promote a sufficient understanding of the system’s holistic structure, behaviour, and how local decisions contribute to the problem causes and solutions (Lorenzoni, Nicholson-Cole, & Whitmarsh, 2007). In stakeholder engagement literature, a lot of emphasis has been on the need to get the public on board by providing information that helps them build a holistic understanding of environmental and resource management problems (e.g. Hjorth & Bagheri, 2006). Jensen (2002) argues that effective education to foster pro-environmental behaviour should address four questions: why the problem occurs (i.e. causes), what are the effects, how to make a change, and what is the future direction.
Second, traditional methods represent a one-way teaching channel through which experts send information about what they think the public should know rather than need to know or want to know (Sandman, 1991). Wynne (1991) and Burgess, Harrison, and Filius (1998) describe such an approach as a deficit or top-down communication model because it considers the public as empty vessels which need to be filled with necessary information. Otway (1987) and Tesh (1999) criticize this assumption and argue that communication about risk is a partnership where experts bring their technical knowledge and the public bring their perceptions and views. Therefore, effective risk communication should be grounded on deep investigation of the mental models of audiences so the message can be tailored to their values and issues of concern (Bostrom, Morgan, Fischhoff, & Read, 1994).
Third, traditional methods overlook the mental biases and flawed causal assertions that people can self-derive from the disseminated information. For example, communicating about storage levels may tell people if the amount of water in reservoirs has increased or decreased. But, it does not give insights to the causes driving this change which may lead to erroneous inferences about the reservoirs dynamics. For example, an observer may refer an increase in storage levels to increase in inflows or a decrease in water use. In fact, reservoirs levels may increase even if inflows have decreased and water use has increased (as long as the inflows are still above the outflows). Sterman and Sweeney (2002) describe such cognitive bias as correlational mental models or pattern matching heuristic. Cognitive biases and flawed mental models may lead to less informed decisions and attitudes towards management policies. Sterman (2008) attributes the low public support for climate change policies to a poor intuitive understanding and erroneous reasoning about climate change dynamics.
Finally, communication policies usually aim to sell water saving by using the climate change message. The communicated message often suppresses the uncertainty about the future of water resource by enforcing a single version of future to encourage the public to accept and comply by adopted management policies. This approach has its limitations. First, it makes use of fear-inducing representations of climate change and its effects on water supply. O’Neill and Nicholson-Cole (2009) find that fear-inducing messages may be catchy but are ineffective tools for motivating pro-environmental engagement because fear:
cannot be maintained for a long time,
can damage trust in authorities, and
may lead to unintended responses (e.g. denial of the problem).
Instead, the authors recommend that:
Nonthreatening imagery and icons that link to individuals’ everyday emotions and concerns in the context of this macro-environmental issue tend to be the most engaging (O’Neill & Nicholson-Cole, 2009, p. 355).
Second, messages in communication about the effects of climate change on water resources often suppress the uncertainty surrounding the whole issue. The credibility of such information is much undermined by the conflicting information in media and political debate about climate change.
Unlike traditional methods, simulation/gaming has the capacity to communicate about the complexity and uncertainty aspects of managing natural resources (Barreteau et al., 2007). Simulation/gaming provides a cognitively mediated environment where stakeholders can self-explore a system with manageable number of variables and relationships. Coupled with a set of scenarios, stakeholders may examine the long term and system-wide outcomes of their decisions under different plausible futures. Experiential learning encourages stakeholders to challenge their mental models about the system behaviour, the relevance of their decisions as well as other’s decisions (i.e. thinking globally and acting locally) (Kolb, 1984). Simulation/gaming allows stakeholders to examining the dynamic coherence of their models or the consistency between the intuitive simulation and the logically deduced behaviour (Lane & Olive, 1998).
Water Communication Policies in the ACT
This research focuses on The ACT as a case study for using simulation/gaming for communicating about water availability problems. The ACT is the political capital of Australia with population size up 360,000 capita. As a part of Sothern-eastern Australia, the ACT lies in the Upper Murrumbidgee River catchment, and receives water from two major sub-catchments: Cotter and Googong.
Since the beginning of the new millennium, the ACT has been experiencing one of the worst droughts on records (ACT Government, 2004). In 2006, severe bushfires burnt most of Cotter catchment and threatened water security of the city. Whether the recent drought is a part of long terms change in climate conditions or climate variability, predictions show more frequent and intense droughts, and increasing risk of bushfires (Chiew, Young, Cai, & Teng, 2011; Lucas, Hennessy, Mills, & Bathols, 2007).
The ACT Government responded to the drought situation by preparing the ACT’s sustainable water management strategy: Think Water, Act Water (ACT Government, 2004, 2014). The strategy includes a wide range of supply and demand management strategies to maintain water security for the ACT. The strategy recognizes the importance of communication and public awareness about water issues as key instrument for managing water use and achieving demand reduction targets set in the ACT Government (i.e. 25% reduction in per capita use by 2023). As a result, a number of mechanisms have been set up to facilitate communication about water issues, including:
a campaign to inform residents about water conservation practices (e.g. shorter shower campaign),
a range of informational resources such as brochures, newsletters and bill inserts,
a web site with extensive information (www.actew.com.au),
media campaigns to market planned infrastructure projects, and
road-side electric billboards to regularly communicate water levels in the reservoirs.
As discussed earlier in the article, we argue that the current approach rely on traditional methods that experience several limitations that may inhibit effective communication, and consequently active engagement in water saving activities. Motivated by the potential of simulation/gaming in providing better communication methods, this research project was started as a partnership between University of New South Wales and the communication office in the ACT water utility company.
System Dynamics Modelling
System dynamics (SD) is a systems methodology for thinking and communicating about complex systems by creating conceptual and quantitative causal models. A conceptual SD model captures the complex structure (i.e. causal relationships, feedback loops, and delays) that is assumed to endogenously generate the systemic behaviour (Simonovic, 2002). SD uses stocks and flows to represent the causal structure of a system. Stocks (or levels) characterize the system state, such as the amount of water stored in a reservoir. Stocks change over time through mechanisms or flows, such as water supplies and releases from a reservoir. When SD-based computer software (e.g. POWERSIM, VENSIM) is used to run the model, the change in the values of stocks and flows are simulated over time.
SD is widely used in water resource applications (Winz, Brierley, & Trowsdale, 2009), especially to inform planning studies, for example (Guo et al., 2001). SD modelling provide methods and tools can be used to effectively communicate about complex interactions, such as feedback and delays, especially for stakeholders with no or minimal technical background (Stave, 2003; Tidwell & Van Den Brink, 2008). Yet, the potential of SD in integrating knowledge for the purpose of supporting public communication and education about water issues has not been fully exploited yet (Williams, Lansey, & Washburne, 2009).
Understanding Users’ Mental Models
Understanding end users’ mental models and relevant issues is a prerequisite for designing useful simulation/gaming tools. This premise is shared in research fields that inform this work: environmental modelling and software (e.g. Jakeman, Letcher, & Norton, 2006), risk communication (e.g. Morgan, Fischhoff, Bostrom, & Atman, 2002), and SD modelling (Forrester, 1992). For this, model development must follow a participatory modelling process through which stakeholders’ input (i.e. knowledge and views) provides the basis for the model design and implementation (Voinov & Bousquet, 2010).
The modelling process cascaded through four phases. In the problem structuring phase, the objective was to elicit, analyze and understand the mental models that stakeholders (i.e. users and managers) have about the situation. We used a semi-structured interviews and a cognitive mapping technique. Based on the results, we designed a series of conceptual causal diagrams to capture the important issues, variables, and cause-effect relationships that articulate the ACT water system. In the model formulation phase, we used POWERSIM, a SD modelling platform, to build and test a quantitative SD model. Finally, we used the model for scenario analysis. The detailed description of the process undertaken is beyond the scope of this article. It can be found in (ElSawah, McLucas, & Mazanov, 2013).
System Dynamics Modelling Framework
Overview
The design of the modelling framework is guided by two criteria. First, the framework is designed to represent an integrated view of the key biophysical and social processes that influence water resource supply and demand. Second, it has a modular and transparent structure. From a communication perspective, this framework facilitates learning about the model structure and underlying assumptions. From a modelling perspective, this expedites development/ testing and promotes future model reuse and expendability. Figure 1 is an overview of the modelling framework and interactions among components. In the following, we provide a description of the individual components. Whereas the proposed framework is developed with a focus on the ACT’s context, it can still be transferred to other semi-arid and arid regions. A full documentation of the model can be found in the appendix.

Integrated framework for the ACT water management model and interactions among model components.
Rainfall-Runoff Component
The ACT is a rainfall-dependent region. A lumped semi-distributed hydrological model is built to represent the ACT catchments (i.e. Cotter and Googong). The model feeds on climate data (i.e. rainfall and evaporation data) to simulate the inflows from catchments to the reservoirs. Figure 2 shows the causal structure underlying the catchment component. We use Coyle’s (1996) conventions for drawing influence diagrams.

The causal structure that generates the behaviour of water runoff in the catchments.
Two stocks control water runoff: surface water and soil moisture. Surface water is a virtual stock (i.e. for modelling purpose only) at which rainfall is accumulated before it infiltrates into the soil (Loop B1). Soil moisture is the moisture content of the soil. The level of moisture is governed by three processes: water infiltration, evapo-transpiration and runoff. Rainfall water infiltrates into the soil until the soil becomes fully saturated (i.e. Infiltration capacity equals zero). Loop B2 is a balancing loop which adjusts the infiltrated water to the soil’s saturation level. Loop B3 controls the amount of water required for Evapo-transpiration. When the soil approaches its saturation, water starts to runoff (Loop B4).
On comparing the simulated inflows to the actual inflows in Cotter and Googong catchments, it is observed that the model produces an adequate representation of base flows but fails to predict peak flows (See Figure 3). Whereas modelling purpose determines which part of data is important for model evaluation (Crout et al., 2008, p. 20), capturing the timing and magnitude of peak flows is irrelevant given that the main interest is simulating base flows rather than predicting flood peaks.

The historical and simulated inflows in the Cotter catchment (in ML).
Bushfires Component
This component simulates the occurrence of bushfire events in the catchments in response to changes in catchment conditions, climate conditions and random triggering events (e.g. lightning). To account for a catchment’s vulnerability to a fire occurrence, we developed an index called Soil Moisture Deficit Percentage (SMDP) to indicate soil dryness. The SMDP index varies on a scale from 0 to 100 depending on soil dryness. The following formula is used to calculate the SMDP:

Based on literature, the model assumes a maximum field capacity of 200mm (e.g. Finkele, Mills, Beard, & Jones, 2006). To trigger a fire, SMDP must be at its high risk zone (i.e. greater than 75%). This threshold elicited from discussions with an expert in bushfire modelling through informal expert elicitation session. A triggering event is a prerequisite condition for a fire occurrence. The threshold probability of triggering an event occurrence varies seasonally, with fires more likely to occur in hot dry summer than in wet and cool seasons. Figure 4 illustrates the mechanism used for triggering a bushfire event. To validate the simulation behaviour, the simulation was run 100 times for the period 1980 to 2008. Through this period, two bushfires occurred, in January 1980 and January 2003 (Worthy & Wasson, 2006). The model reproduced both events with probability 0.90.
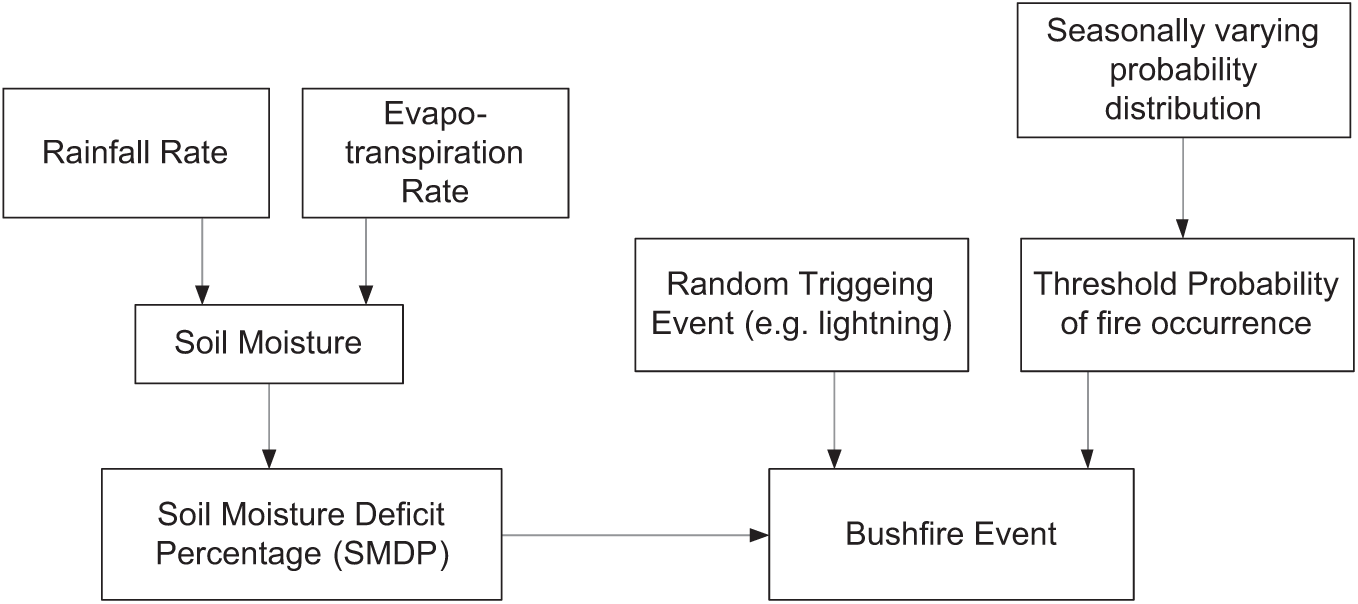
The mechanism used in the model to trigger bushfire events.
Ecological Component
In addition to consumptive use, the ACT is obliged to release environmental flows in order to sustain river-dependent ecosystems. This component generates environmental flows from the Cotter and Googong reservoirs. Release rates are monitored and changed regularly to adapt to changes in inflows and urban water use. The policies used to determine releases follow the Environment Protection Authority (EPA) guidelines (ACT Environment, 2006). This captures the decisions taken on the current environmental flow regime without considering impacts on water quality and ecological responses.
Urban Water Use Component
This component simulates urban use in response to changes in population size, climate conditions, and the effect of demand management policies. Population size is simulated based on future growth rates projected by the Australian Bureau of Statistics (ABS). In 2015, the ACT will commence to supply water to neighbouring cities such as Yass and Murrumbateman. To account for additional demand, the population served across borders is assumed to be an additional 1.6% growth of the ACT population (ACTEW Corporation, 2009).
In the model, per capita use is disaggregated into residential use per capita (i.e. household use) and non-residential per capita use (i.e. use in the industrial sector and public places). Linear regression is used to generate a base or unrestricted daily per capita use as a function of net-evaporation rate (i.e. rainfall rate subtracted from evaporation rate). To isolate the effects of water restrictions, water use data from January 1993 to November 2002 are used to calibrate the regression parameters. Non-residential and residential indoor water uses are directly calculated from the population size and per capita indoor use.
Given that domestic irrigation water use is the major driver of the ACT’s water demand, the dynamic analysis focuses on the variables and feedback loops that govern the behaviour of domestic irrigation. At a household level, irrigation use is an outcome of a range of structural (e.g. installing a dripper system) and behavioural decisions (e.g. the frequency and timing of irrigation). In the model, behavioural decisions are modelled at an aggregate level as a binary decision of whether to comply or not to comply with the restrictions, a standard norm for representing irrigation use. The Bass diffusion model is used to represent how people make judgments about changing their behaviour (i.e. switch from being complier to a non-complier and vice versa) (Bass, 1969; Sterman, 2000) based on their salient decision rules. Figure 5 shows the causal structure underlying the domestic irrigation behaviour. Feedback loops govern the growth and decay of the two stocks: compliers and non-compliers. As the number of compliers increases, the probability that any additional person becomes a complier increases. This reinforcing (Loop R1) increases the rate of compliers (i.e. water saving becomes a social norm). However, as more people decide to join compliers, the remaining number who are susceptible to compliance decreases, and hence, the rate of people becoming compliers drops (Loop B8). Two similar mechanisms govern the stock non-compliers.
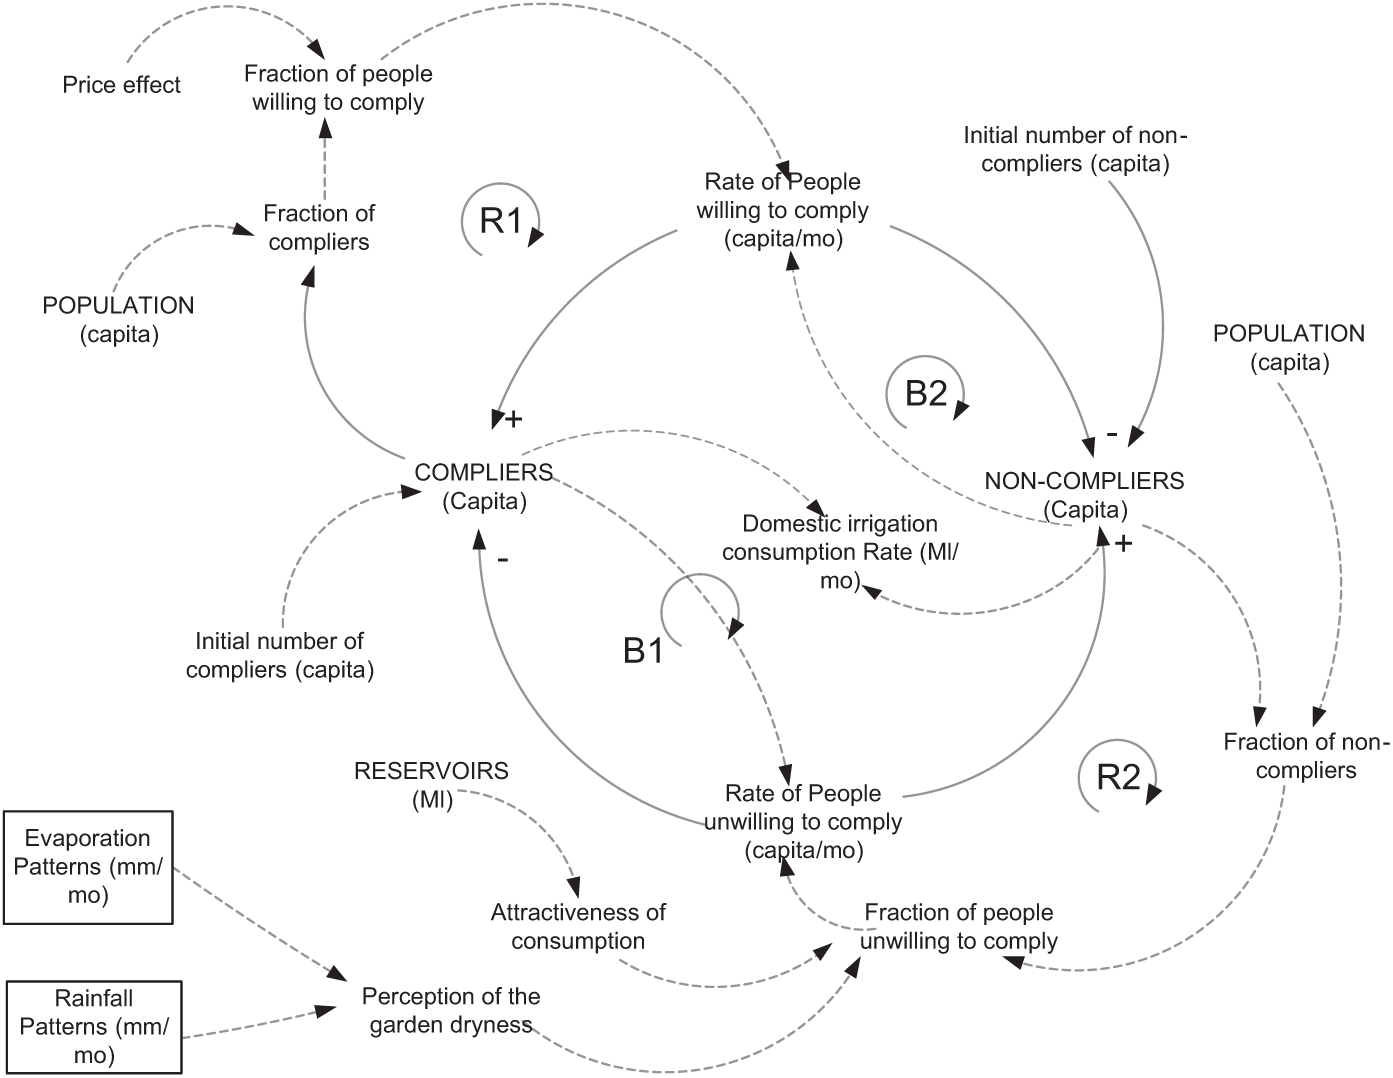
The causal structure that governs the behaviour of domestic irrigation use.
Decision rules are derived from the findings of interviews with the water users in the problem structuring phase (ElSawah et al., 2013). First, it is assumed that perceptions of the garden dryness have a significant effect on irrigation decisions (i.e. when it is dry, I will water my garden anyway). Second, attractiveness of water use increases with an increase in storage levels. Both rules are formulated using normalized non-linear functions as described in Sterman (2000). Third, the numbers of compliers and non-compliers are not allowed to reach zero, as some people will never change their behaviour. As identified through interviews, this group represents either loyal water savers or people who see that water saving is entirely ineffective. Due to lack of disaggregated data for the ACT’s use, the simulated household’s use could not be tested against actual data.
Policy Levers Component
This component incorporates the effects of a portfolio of supply and demand management options incorporated into the model structure. Selection of policies is based on insights drawn from interviews with users and managers. Two types of supply options are considered: rainfall-dependent (e.g. enlarging the reservoir’s capacity) and rainfall-independent option (e.g. direct abstractions from the Murrumbidgee River). For each option, the model considers the time delay required for project completion as well as incurred costs (i.e. capital and operating costs). This includes the costs shifted to users in terms of an increase in water price.
Demand management includes a set of residential/non-residential measures and instruments. Water efficiency measures are the decisions or actions which directly contribute to water saving, such as installing a rainfall water tank or having a water-wise garden design. Instruments are the decisions which indirectly contribute to water saving by creating the context to undertake conservation measures, such as price increases and restrictions (Turner et al., 2008). To model the effect of efficiency measures, percentage reduction in per capita use is used as an indicator of effectiveness. The model enables users to determine the percentage of the population that adopts a given conservation measure. The remaining population have their use set at the basic per capita use. Because people take time to adopt conservation measures, the rate of adoption varies over a constant time period until the full effect is realized. For each water efficiency measure, this component calculates the amount of water use for both adopter and non-adopter groups.
Reservoirs Component
The reservoir component is the core of the model as it links water inflows and outflows processes. In essence, it represents a dynamic and spatially-aggregated water budget for the ACT region (See Figure 6). This component includes the rules for reservoir operation and water allocation. For example, urban water use and environmental requirements are assigned equal priority unless a policy is designed to cut-off environmental flows. Also, when a bushfire event occurs, the reservoir is closed because of deteriorated water quality.

The inflows and outflows that influence the behaviour of water reservoirs.
Building Confidence in the Model
Before using the model for analysing policies, it is essential to build confidence in the model structure and behaviour. A variety of tests was performed to assess the model structure and behaviour, including (Sterman, 2008): (1) extreme conditions tests, and (2) behaviour replication tests.
Extreme Conditions Tests
It is essential to perform extreme condition test to ensure that the model exhibits a logical behaviour under unexpected changes in inputs (i.e. shocks). The model’s response was tested under three extreme conditions:
extremely dry conditions: if rainfall rates are set to zero, while evaporation rates are increased by 50%;
extremely wet conditions: if evaporation rates are set to zero, while rainfall rates are increased by 50%;
extreme demand conditions: if per capita use is doubled, while inflows remain unchanged.
Results indicate that the model is robust with the extreme input. Figure 7 shows the output of one of the extreme value testing (i.e. extremely dry conditions). As shown, the reservoirs level dramatically falls to minimum storage level (i.e. 20% of capacity) as defined in the model.
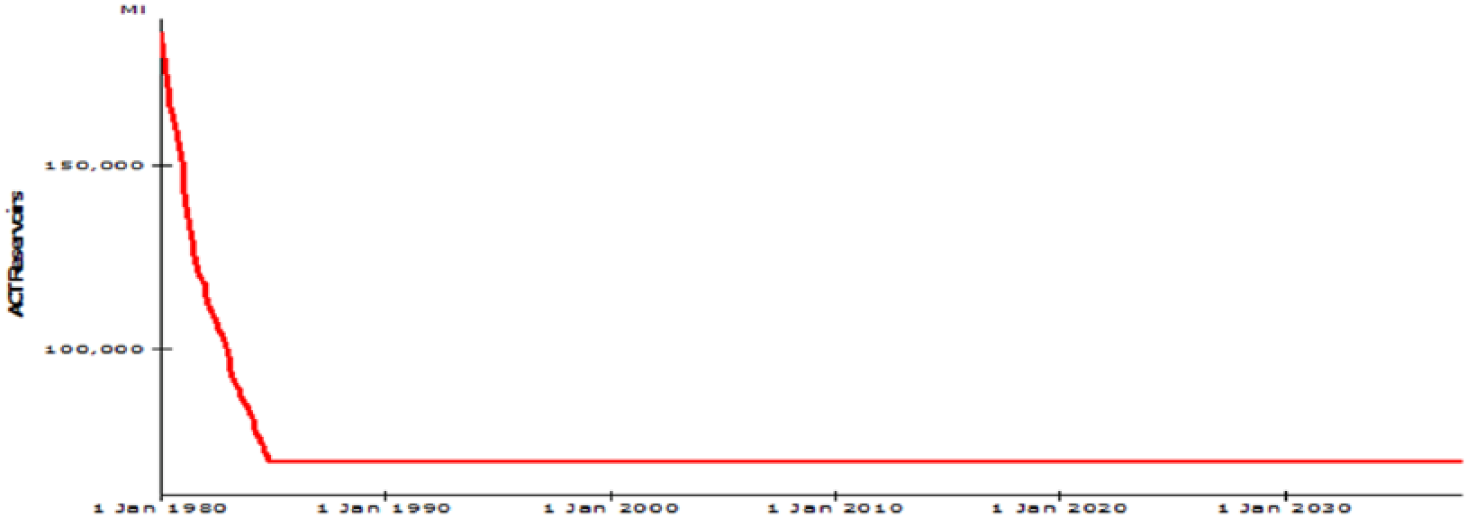
The results of the extreme condition test performed on the ACT reservoirs variable.
Behaviour Replication Test
The purpose of behaviour replication test is to ensure that the model satisfactorily reproduces the historical behaviour of the system. On comparing the simulated inflows to the actual inflows in Cotter and Googong catchments, it is observed that the model does not produce an adequate representation of peak flows (See Figures 8 and 9). According to (Crout et al., 2008, p. 20), modelling purpose determines which part of data is important for model evaluation. Because the main interest is simulating base flows rather than predicting flood peaks, capturing the timing and magnitude of peak flows is irrelevant. Therefore, peaks flows observations are excluded from the calibration series. The calculated Mean Absolute Percentage Error (MAPE) is approximately 20% and 18% for Cotter and Googong respectively. This result is quite satisfactorily given that historical inflows data are not based on empirical measurements rather a result from other rainfall-runoff models. In addition, the performance of the stocks of water in the ACT’s reservoirs was examined. Results indicate a MAPE of approximately 9% (See Figure 10).

The historical and simulated inflows in the Cotter catchment (in ML).

The historical and simulated inflows in the Googong catchment (in ML).

The historical and simulated amount of water in the ACT reservoirs (in ML).
Gaming Framework
The model is embedded in a gaming framework to facilitate players’ interaction with the underlying structure. The framework includes the following elements (See Figure 11):
Scenarios are stories which describe future changes in external drivers (e.g. climate change effects, population growth). At the beginning of the game, players set up a plausible version of future based on their views on how the world may change.
Roles refer to the responsibilities that players choose to experience in the game. Based on the role (i.e. user or manager), players experiment various decisions. For example, a manager role allows players to build new infrastructure and reflect on the implication of such policy.
Indicators are performance measures that players choose to view based on their values and interests. The simulator provides indicators at individual level (e.g. water bills) and community level (e.g. storage levels and community consumption).

The gaming framework in which the model is embedded.
This gaming framework provides players with a learning opportunity where they expose their assumptions about the future and effective management options, and get feedback about outcomes. The interactive simulator can be used in two modes: on-line mode as a web-based communication tool to engage a large number of the ACT residents in learning about water issues, and in a collaborative mode as a vehicle to facilitate dialogue among experts and users in public hearings and community gatherings.
Scenario Analysis
In this section, for demonstration purpose, we report two scenarios that were discussed by water users and managers, and how the model is used to assess their outcomes. First, scenario A simulates the future of water availability if the assumptions about drivers and management policies remain unchanged (i.e. business-as-usual). This implies the following assumptions:
Climate conditions follow the same historical patterns as identified from available data records for the period 1980 to 2008. This implies that the middle of the future 28 years will be relatively wet, and the latter part will be relatively dry.
Population increases according to the medium growth scenario of the ABS.no change in environmental flow releases
Water use follows the same patterns as observed since 2005.No infrastructure is added to the water supply system.
Second, scenario B assesses the impacts of extending the reservoir’s capacity if population growth is high and environmental flows are cut-off. This scenario addresses an ongoing political debate about sustainable growth. Scenarios are run for the period (2009-2039) using a monthly time step.
In both scenarios, the amount of inflows declines steadily with an annual mean reduction rate of 26%. This is because inflows are driven by rainfall and evaporation patterns rather than reservoir capacity. In wet periods, enlarging reservoir capacity is an effective option because it reduces overflows and provides additional buffer. However, in dry periods, the reduction in inflows goes beyond the capacity barrier. In scenario B, urban demand increases where the 90th percentile of annual increase is 35% compared to 14.3% in scenario A. This increase is the combined effect of population growth (607,000 compared to 515,000 in scenario A) and the feedback effect of water availability on consumption decision making.
It should be noted that scenario B represents an extreme case because it assumes that environmental flows can be completely cut-off. In contrast, adding a new infrastructure system will necessarily lead to an increase in the ACT’s environmental obligations in order to sustain ecological systems may be affected by the dam. It is still uncertain how environmental requirements and releases will change (ACTEW Corporation, 2009).
Although scenario B represents an extreme case, it can be used to challenge mental models about the robustness of infrastructure under various climate and population changes. Also, results reveal the unanticipated effects of perceptions of water security on consumption decisions.
Conclusions and Future Work
Unlike traditional communication methods, simulation/gaming can play a significant role in improving the mental models that stakeholders have about the complexity and uncertainty of water resource management. In this article, we presented a SD based modelling framework that can be used to simulate the dynamics of water supply and demand in response to changes in uncontrollable drivers (e.g. climate change) and management policies (i.e. supply and demand options). The model integrates the key biophysical and social processes that influence water reservoirs. Model development followed a participatory modelling process where both expert and community perspectives are incorporated in the model conceptualization.
The model is embedded in a gaming framework to facilitate interaction with the model. The interactive simulator can be used in two modes: on-line mode as a web-based communication tool to engage a large number of the ACT residents in learning about water issues, and in a collaborative mode as a vehicle to facilitate dialogue among experts and users in public hearings and community gatherings. The model can be transferred to other arid and semi-arid application areas.
In future, it is essential to assess the utility of the model in terms of its learning effects (i.e. summative assessment). First, a controlled experiment will be designed to explore if the mental models of the players have changed prior and post interacting with the model. Second, a longitudinal experimental study will be designed to examine whether the cognitive learning effects (if any) may lead to changes in the way people actually use water. Behavioural measures will be used to assess changes, such as water bills before and after the experiment.
Footnotes
Appendix
Acknowledgements
The authors would like to acknowledge the contribution of ACTEW Corporation in providing data and expert knowledge that supported the development of the model. Special thanks to the Australian Water Association (AWA) for recognizing this work by rewarding the first author its prestigious post-graduate research award. Also, the authors would like to acknowledge the constructive feedback received from the two anonymous reviewers and special issue editor: Dr Levent Yilmaz.
Author Contributions
All authors contributed equally to this article, in content and in form. SES developed the model and wrote the manuscript. AML provided close assistance and guidance on the model development and reviewed the manuscript. JM provided guidance on collecting data used to build the model and interpret results, and reviewed the manuscript.
Declaration of Conflicting Interests
The authors declared no conflicts of interest with respect to the authorship and/or publication of this article.
Funding
The authors disclosed receipt of the following financial support for the research, authorship, and/or publication of this article: This research was funded by the University of New South Wales Global Scholarship. In-kind support was provided by ACTEW Corporation to support the development of a web-based Graphical User Interface for the developed model.
Author Biographies
Contact:
Contact:
Contact: