
Abstract
We examined whether the Cross-Cultural (Chinese) Personality Assessment Inventory-2 (CPAI-2), developed by the combined emic–etic approach, could provide useful information for us to understand the relations between personality and the key academic major groups in the Chinese context. Participants in this study included 989 university students from 9 universities in Hong Kong. Discriminant analysis showed that the personality traits measured by the CPAI-2 could significantly differentiate among six academic major groups, confirming the utility of personality variables as predictors of career-relevant choice in non-Western cultures. Among the 28 CPAI-2 personality scales, 7 significantly differentiated the 6 major groups in our multivariate analysis of variance. Two of these scales reflect universal intellectual styles while the other five were relational in natural. Among these five relationship-oriented scales, Extraversion versus Introversion and Leadership correspond to similar etic constructs in Western measures while the other three (i.e., Renqing, Social Sensitivity, and Face) are emic constructs. The information provided by these emic constructs can assist career counselors to be more sensitive to the cultural context of career choice of Chinese young people.
This study examined the utility of using personality variables as predictors of career-relevant choice in a non-Western culture. We also investigated whether the emic constructs measured by the Cross-Cultural (Chinese) Personality Assessment Inventory-2 (CPAI-2) could provide useful information for us to understand the relations between personality variables and the key academic major groups among Chinese college students. Research has found that people who choose different college major groups appear to be systematically differentiated in personality profiles. For example, De Fruyt and Mervielde (1996) measured the Big Five personality traits (Costa & McCrae, 1992) by a Dutch version of the Revised NEO Personality Inventory (NEO-PI-R) and found that the Big Five personality traits could differentiate among 21 academic major groups in Belgium. Their discriminant analysis found that the percentage of correct classification of the 21 major groups was 11.7% when the five personality factors of the NEO-PI-R were used as the predictor set, which was about two and a half times greater than the chance probability of randomly selecting a major group from the 21 major groups. When all the 30 personality facets of the NEO-PI-R were used as the predictor set, the percentage of correct classification of the 21 major groups was 27.7%, which was about six times greater than chance.
Similarly, a recent study by Larson, Wei, Wu, Borgen, and Bailey (2007) showed that the Big Five personality traits measured by a Chinese version of the NEO Five-Factor Inventory (NEO-FFI) could also differentiate among academic major groups in Taiwan. Their discriminant analysis found that the percentage of correct classification of four academic major groups was 45.1% for males and 38.5% for females when the five personality factors were used as the predictor set, which were about two times and one and a half times greater than chance, respectively.
To investigate the relationship between personality and academic major groups more comprehensively, Larson, Wu, Bailey, and Gasser (2010) used the Multidimensional Personality Questionnaire ([MPQ] Tellegen, 2000) as the personality measure. Six personality scales of the MPQ can be used as markers of the Big Five and the remaining five MPQ personality scales can be treated as additional traits beyond the Big Five. Their discriminant analysis found that the percentage of correct classification of nine major groups was 28.0%, which was two and one half times greater than the chance probability of randomly selecting a major group from the nine major groups. This study showed that in addition to the Big Five markers, the non-Big Five markers of the MPQ (i.e., harm avoidance and traditionalism) also have impact on selection of academic major.
These studies have shown that there are distinctive personality profiles for different academic major groups in both Western and Chinese samples. So far, the personality profiles found in the Chinese sample were depicted by an “imported” personality measure. Although there are good guidelines for translation and adaptation of “imported” assessments (e.g., International Test Commission, 2000), “imported” tests might still have two limitations. First, the personality constructs measured by the “imported” instruments are imposed-etic concepts. When we apply them to the local culture, we are assuming that they are universal concepts that are cross-culturally relevant (Cheung & Leung, 1998). However, whether these constructs are universally applicable should be an empirical question rather than an assumption. Second, some relevant indigenous constructs (i.e., the emic concepts) may be less salient in the imported measures because they are usually less differentiated and relevant in everyday life in the Western culture than they are in the local culture (Yang, 2006). To address these problems, some cross-cultural psychologists have suggested the use of the combined emic–etic approach for developing culturally relevant assessment (Cheung, van de Vijver, & Leong, 2011; van de Vijver & Leung, 1997).
Using this approach, the test developer would first derive the personality measure indigenously (e.g., using local literature and local descriptors) and then compare this personality measure with the widely used personality theories derived in other cultures (e.g., five factor model). The parts that are universal to all the cultures being compared may be viewed as derived-etic personality constructs and the parts that are unique to a particular culture should be viewed as emic personality constructs for that culture (Berry, 1989). For example, the CPAI-2 (Cheung, Leung, Song, & Zhang, 2001) was developed based on the combined emic–etic approach in the Chinese context.
The CPAI-2 consists of both derived etic personality constructs resembling the constructs covered by the main Western personality theories and emic personality constructs that are important to the understanding of personality in the Chinese context: when the CPAI-2 and the NEO-FFI were jointly factor analyzed, the personality scales from the first three CPAI factors (i.e., Social Potency/Expansiveness, Dependability, and Accommodation) loaded on the five factors of the NEO-FFI, whereas the personality scales from the Interpersonal Relatedness factor of the CPAI-2 loaded on a sixth factor beyond the five factors measured by the NEO-FFI (Cheung, Cheung, Zhang, et al., 2008). The personality scales from the Interpersonal Relatedness factor could cover the emic personality constructs that complement the derived etic constructs of the CPAI-2. Previous studies using the CPAI/CPAI-2 have demonstrated its usefulness as a culture-relevant personality measure in the Chinese context (see Cheung, Zhang, & Cheung, 2010). In this study, we investigated the utility of the CPAI-2 in differentiating the personality correlates among academic major groups.
Traditional Asian culture emphasizes collectivism rather than individualism (Kim, Atkinson, & Umemoto, 2001). While Western styles of education usually encourage young people to think and make judgments independently, traditional Asian styles of education socialize young people to become an interdependent self, which would focus on how a person is related to others and how to maintain interpersonal harmony (Markus & Kitayama, 1991). Thus, some researchers have argued that the career-relevant choices of young people from collectivistic cultures are not necessarily a choice of their own will but a compromise between their parents’ expectations and their personal preference (Leong & Chou, 1994). For example, Tang (2002) found that parents’ preferred choices were significantly correlated with the actual career choices of Chinese students, but the students’ ideal occupational choices were not. This kind of finding suggests that the role of personality in career-relevant choices among Chinese might not be as important as that among Western students. This suggests that counselors should consider more the relational or family factors rather than just the personal preferences. However, Larson et al. (2007) showed that the Big Five personality traits measured by a Chinese version of the NEO-FFI could significantly differentiate among academic major groups in Taiwan, suggesting that personality do play an important role in career-relevant choices in the Chinese context. In this study, we adopt the CPAI-2 to examine again whether personality variables are important for career-relevant choice as well as to identify culturally relevant personality concepts that can describe the personality profile of the key academic major groups in the Chinese context in a more sensitive way.
Based on the existing empirical findings, we expected that the personality scales on the CPAI-2 as a whole could significantly differentiate among the six academic major groups. Specifically, on one hand, we expected that the universal scales on the CPAI-2 could significantly differentiate among the academic major groups in ways that are similar to the previous findings. On the other hand, given that the Chinese culture is more collectivistic and interdependent than the Western culture (Hwang, 2009), social-oriented personality traits are usually more differentiated and influential in a Chinese context. Therefore, we expected that the emic relationship-oriented scales of the CPAI-2 could also reveal meaningful patterns.
Method
Participants
A total of 989 Hong Kong university students were included in this study. There were 599 (61%) female students and 390 (39%) male students, with an average age of 21.02 (SD = 1.60). They were recruited from nine universities in Hong Kong as part of a larger study related to personality and career development. The 989 students whose major subjects could be classified into 1 of the following 6 academic major categories were included in this study: engineering (n = 220), science (n = 197), creative industry (e.g., architecture, visual arts, and creative media; n = 62), human services (i.e., social work, counseling, education, and psychology; n = 147), business (excluding accounting; n = 219), and accounting (n = 144). Participants included 317 students in Year 1, 314 students in Year 2, 292 students in Year 3, and 66 students in Year 4 or above. The proportion of students in the six major categories is similar to that of the overall student population actually pursuing a degree under that academic program category in the nine universities in Hong Kong in 2009–2010 (University Grants Committee of Hong Kong, 2010).
Measures
The CPAI-2 (Cheung, et al., 2001) was used as the personality measure of this study. The CPAI-2 Form B consists of 28 normal personality scales and 3 validity scales with a total of 341 items (see Cheung, Cheung, & Leung’s, 2008 appendix for a brief description of each CPAI-2 scale). We used the traditional Chinese character version of the CPAI-2 in this study with a 5-point rating scale response format. Respondents were asked to rate the extent to which each statement depicting a personal characteristic or typical behavior described their own personality, from 1 (least) to 5 (most). The Cronbach’s αs of the 28 personality scales ranged between .47 and .88 (the median Cronbach’s α was .74) in the current sample (see Table 1 for the Cronbach’s αs of all CPAI-2 personality scales). The internal consistency of some of the CPAI-2 scales were lower because the CPAI research team has retained items that had lower item-total correlations but fit the broad bandwidth of the more complex conceptual content of the scales, in order to balance the bandwidth versus fidelity consideration in scale construction (Cheung, Cheung, Zhang, et al., 2008).
Means and Standard Deviations of CPAI-2 by Major Group

Note. CPAI-2 = Cross-Cultural (Chinese) Personality Assessment Inventory-2; ANOVA = analysis of variance. Subscripts (a–c) indicate significant mean level differences among the corresponding majors at the p < .05 level (differences were assessed by pairwise comparison with Bonferroni adjustments).
* indicates that the mean of that CPAI-2 scale differed significantly across majors at the p < .05 level (differences were assessed by univariate ANOVA with Bonferroni adjustments).
Personal Background
Each participant was asked to supply personal information about his or her gender, age, university, year of studies, and major subject. These participants came from more than 50 academic majors, in which more than 20 majors consisted of less than 20 participants. To maintain the power of our analysis at an acceptable level, we thus grouped these major subjects into six major groups based on their similarity: engineering and technology (e.g., civic engineering, mechanical engineering, and Internet and multimedia technology), science (e.g., physics, biology, and chemistry), creative industry (e.g., architecture, creative media, and design), human services (e.g., social work, education, and psychology), business (e.g., business administration and marketing), and accounting.
Procedure
The data reported in this study were collected as a part of a larger study related to personality and career development in Hong Kong. We sent e-mail invitations to potential participants via the nine universities in Hong Kong. We used a web-based survey to collect data from the participants. Their participation was voluntary and they took the survey anonymously. With the consent of the participants, they were entered into a lottery which offered 30 prizes of HK$1,000 each. We only selected the participants whose majors form the six groups listed above for this study.
Data Analysis
Corresponding to the research questions, two main statistical procedures were employed. Multivariate analysis of variance (MANOVA) was used to determine whether the six academic major groups scored differently in the 28 CPAI-2 scales, followed by univariate analysis procedure to examine the specific differences of personality dimensions among different major groups. Discriminant analyses were adopted for examining the predictive power of the CPAI-2 personality scales on participants’ college major groups.
Results
Preliminary Analyses
The means and standard deviations of the 28 CPAI-2 scales of each major group were summarized in Table 1. We conducted a MANOVA to examine whether the six academic major groups scored differently in the 28 CPAI-2 scales. To examine whether there were any gender by major interaction effects, we also entered gender as one of the independent variables. The analyses found a significant main effect of major group, multivariate Wilks’ λ F(140, 4695) = 2.29, p < .001, η2 = .06; and gender, multivariate Wilks’ λ F(28, 950) = 5.32, p < .001, η2 = .14; but no significant Gender by Major Group interaction, multivariate Wilks’ λ F(140, 4695) = 1.17, p > .050, η2 = .03.
Univariate ANOVAs were conducted on the 28 CPAI-2 scales using a Bonferroni adjustment (p = .05/28 = .002). The means of Divergent Thinking, Leadership, Aesthetics, Extraversion, Face, Renqing, and Social Sensitivity were significantly different across the six major groups (p < .002). To determine which of the six major groups were different from one another in each of these CPAI-2 personality scales, we conducted follow-up pairwise comparisons with Bonferroni adjustments and the results were also shown in Table 1.
The human services group scored significantly higher on the divergent thinking scale than the engineering, the science, and the accounting groups. The human services and the business (nonaccounting) groups scored significantly higher on the leadership scale than the engineering, the science, and the accounting groups. The human services and the business (nonaccounting) group also scored significantly higher on the Social Sensitivity scale than the engineering, the science, and the accounting groups.
The business (nonaccounting) group scored significantly higher on the Extraversion, Face, and the Renqing scales than the science major group. The business group also scored significantly higher on the Extraversion scale than the accounting group and scored significantly higher on the Renqing scale than the engineering group.
The creative industry group scored significantly higher on the aesthetics scale than the engineering, the science, the business (nonaccounting), and the accounting groups. The engineering group scored higher on this scale than the accounting group, and the human services group scored higher on this scale than the business (nonaccount) and the accounting groups.
Discriminant Analyses
We conducted two discriminant analyses. The criterion variable of the two analyses was academic major group (k = 6). In the first discriminant analysis, the predictor set included gender only. In the second discriminant analysis, the predictor set consisted of gender and the 28 CPAI-2 scales. Gender segregation in majors is prevalent in universities worldwide, despite the increase in the proportion of women enrolled in universities. In our present sample, the gender proportions in the six major groups are not balanced. We control the effect of gender by inputting it as the first predictor and then examine the additional utility of personality beyond the effect of gender (Larson, Wu, Bailey, & Gasser, 2010). Although using a categorical variable as a predictor would violate the assumption of multivariate normality, which may increase the misclassification rate (Finch & Schneider, 2006; Tabachnick & Fidell, 2007), we followed the common practice adopted in previous studies for easier comparison of the results between our studies and the previous ones. For all the analyses, we set a priori probabilities as all groups equal, to balance out the effects of unequal number of participants in each major. This procedure is adopted in previous studies when the ratio of group sizes in the sample does not represent the corresponding ratio in the population (Tabachnick & Fidell, 2007). Table 2 presents the corresponding hit rates, jackknife hit rates, squared canonical correlations, and Wilks’ λs. The first analysis showed that gender itself significantly differentiated the six academic major groups with a hit rate of 19.7% (Wilks’ λ = .895, p < .001), but it was only slightly over one time greater than the chance probability of randomly selecting a major group from the six major groups (1/6 = 16.7%). The second analysis showed that gender and the 28 CPAI-2 scales in combination significantly differentiated the six academic major groups with a hit rate of 38.1% (Wilk’s λ = .625, p < .001), which was over 1.9 times greater than the probability of selecting an academic major group using gender alone as the predictor (19.7%). We adopted Tabachnick and Fidell’s (2007) suggestions and calculated whether there was a significant difference between the two values of Wilks’ λ (i.e., gender versus gender and 28 CPAI-2). The results showed that the additional predictors (i.e., the 28 CPAI-2 scales) significantly improved the hit rates for participants’ academic major groups beyond the effect of gender alone, F(145, 4781) = 2.44, p < .001. The original prediction rate of each academic major group was 41.8% for engineering and technology, 26.9% for science, 62.9% for creative industry, 36.1% for human services, 37.4% for business, and 40.3% for accounting.
Discriminant Function Results for Predictor Sets Examining College Students’ Major Groups
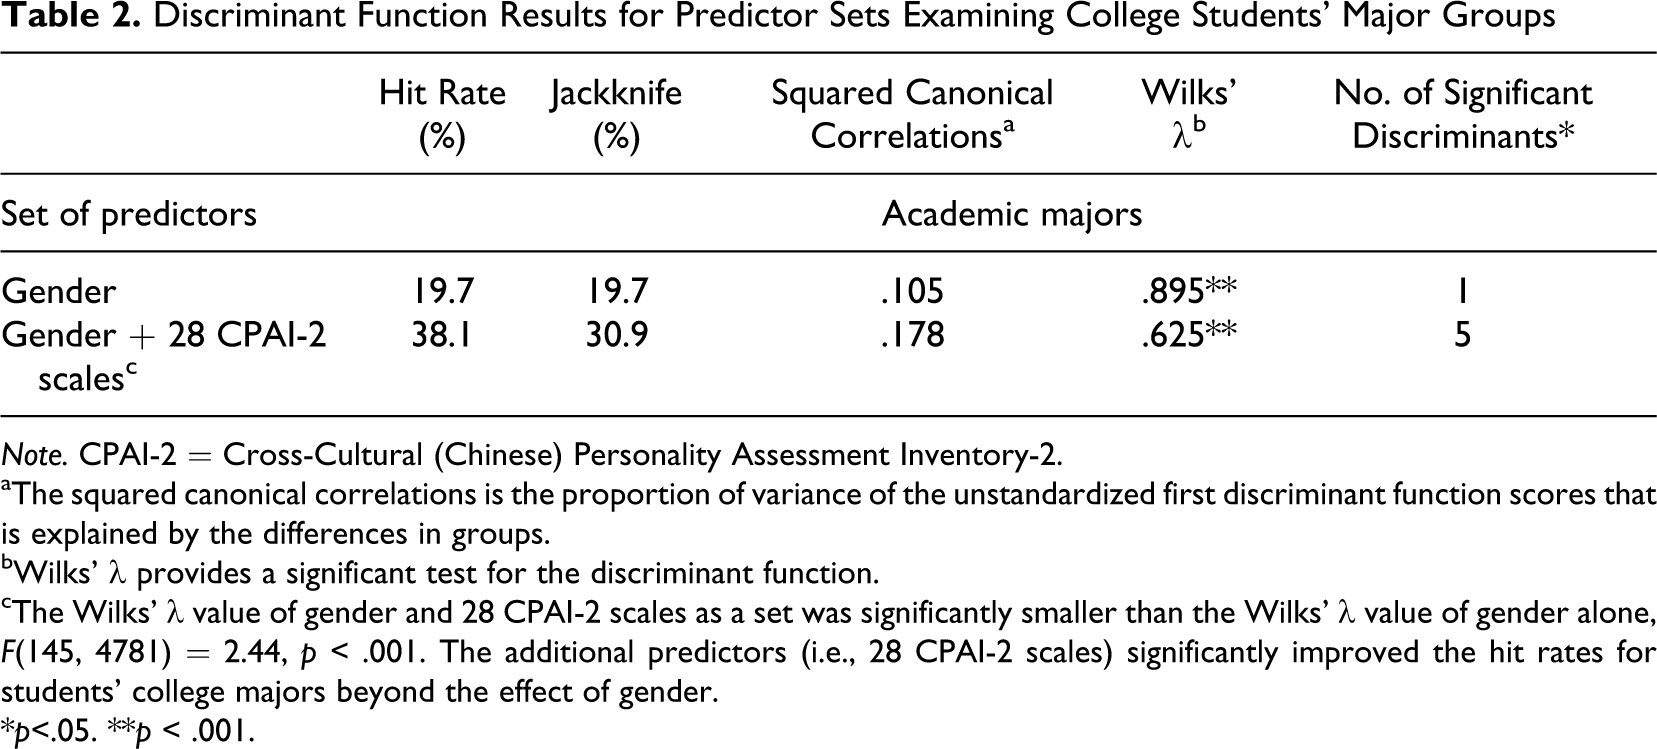
Note. CPAI-2 = Cross-Cultural (Chinese) Personality Assessment Inventory-2.
aThe squared canonical correlations is the proportion of variance of the unstandardized first discriminant function scores that is explained by the differences in groups.
bWilks’ λ provides a significant test for the discriminant function.
cThe Wilks’ λ value of gender and 28 CPAI-2 scales as a set was significantly smaller than the Wilks’ λ value of gender alone, F(145, 4781) = 2.44, p < .001. The additional predictors (i.e., 28 CPAI-2 scales) significantly improved the hit rates for students’ college majors beyond the effect of gender.
* p<.05.
** p < .001.
Table 3 provides the group centroids for the five significant functions and the structure matrix that provided specific information about which CPAI-2 scales had contributed to the discrimination among the six academic major groups. The first function separated the engineering group from the human services and the business (nonaccounting) groups. The corresponding structure matrix reveals that gender, the Logical versus Affective Orientation scale, the Extraversion versus Introversion scale, and the Social Sensitivity scale had the highest correlations (>|.30|) with the function. Gender was an important predictor simply because of the disproportionate number of male students in engineering and females students in human services majors. The second function separated the business (nonaccounting) group from the creative industry group. The corresponding structure matrix reveals that aesthetics and the self versus social orientation had the highest correlations (>|.30|) with the function. The third function separated the engineering group and human services group from the accounting group. The corresponding structure matrix reveals that novelty, diversity, leadership, aesthetics, extraversion versus Introversion, Responsibility, Meticulousness, and Traditionalism versus Modernity had the highest positive/negative correlations (>|.30|) with the function. The fourth function separated the human services group from the creative industry and business (nonaccount) groups. The corresponding structure matrix reveals that Divergent Thinking, Emotionality, and Internal versus External Locus of Control had the highest correlations (>.30) with the function. The fifth function separated the engineering and the creative industry groups from the science group. The corresponding structure matrix reveals that the Face scale had the highest correlations (>.30) with the function.
Group Centroids and Discrimant Structure Matrix for Discriminant Analyses of the CPAI-2 as Predictor of College Students’ Major Groups

Note. N = 989. CPAI-2 = Cross-cultural (Chinese) Personality Assessment Inventory-2.
Discussion
This is the first study to examine the role of the CPAI-2 as a culturally relevant measure in differentiating academic major groups in a Chinese context. Our findings are consistent with previous studies that examined the role of universal personality constructs (e.g., Larson, Wei, Wu, Borgen, & Bailey, 2007), showing that personality can significantly differentiate Chinese students’ academic major groups. Although some scholars suggested that families’ expectation would strongly influence Chinese students’ career-relevant decisions (Tang, Fouad, & Smith, 1999), our findings suggest that the individuals’ personality also play an important role, confirming the utility of personality variables as predictors of career-relevant choice in non-Western cultures that are more collectivistic. Among the 28 personality scales, 7 significantly differentiated the major groups in our MANOVA. Two of the scales reflect intellectual styles (i.e., divergent thinking [sample item: “I can easily link up ideas that appear unrelated”] and Aesthetics [sample item: “I like drawing or doing calligraphy in my spare time”]) while the other five scales were relational in nature. Among these five relationship-oriented scales, Extraversion versus Introversion and Leadership correspond to similar etic or universal constructs in Western measures, while Renqing, Social Sensitivity, and Face represent the emic or indigenous constructs.
Etic Relationship-Oriented Personality Constructs of the CPAI-2
In the joint factor analysis of the CPAI-2 and the NEO-FFI, the Extraversion versus Introversion and Leadership scales loaded on the same factor as the three Extraversion facets of the NEO-FFI (Cheung, Cheung, Zhang, et al., 2008). It means that we can treat these personality scales as derived etic construct resembling parts of the Extraversion factor in the five-factor model. Extraversion versus Introversion measures the degree to which an individual enjoys social gatherings and interpersonal interactions (sample item: “I am very talkative when I am with a group of people”) while Leadership measures the degree to which an individual enjoys influencing and leading others (sample item: “When several people are working together on something and there is no leader around, I will take over”). In our study, business and human services majors scored highest on these scales. These two scales also helped separate the human services and engineering major groups (scored higher) from the accounting major group in the third function and the Extraversion versus Introversion scale helped separate the human services and business major groups (scored higher) from the engineering major group in the first function of the discriminant analysis. According to Larson, Rottinghaus, and Borgen’s (2002) meta-analysis, the Extraversion factor had positive correlations with Holland’s measure of enterprising and social interests. Our results are quite consistent with their findings, except for the difference between the accounting major group and the engineering major group found in the third function. Although other similar research studies did not explicitly highlight this kind of differentiation (Larson et al., 2007; Larson et al., 2010), the structural matrix of Larson et al. (2010) did reveal a similar (but smaller) differentiation pattern in their second discriminant function when MPQ personality scales were used as the predictors. Although the correlations between their second discriminant function and the MPQ Social Potency and Social Closeness scales were only .19 and .23, respectively, the trend of their result is quite consistent with our findings.
Emic Relationship-Oriented Personality Constructs of the CPAI-2
Previous findings have shown that the Interpersonal Relatedness personality factor of the CPAI-2 is an emic factor distinct from the five factor model (Cheung, Cheung, Zhang, et al., 2008). In the joint factor analysis of the CPAI-2 and the NEO-FFI, the Renqing scale loaded on the sixth Interpersonal Relatedness factor (Cheung, Cheung, Zhang, et al., 2008). It means that we can treat Renqing as an emic construct representing an indigenous construct beyond the five-factor model. Renqing measures the extent to which an individual adheres to the Chinese cultural norms of social interaction and social exchange. The forms of interaction involve courteous rituals, exchange of resources, reciprocity, maintaining, and utilizing useful ties, and nepotism (Cheung, et al., 1996; sample item: “When dealing with institutions, things can work out more smoothly through the connections of friends working inside”). Cheung, Fan, and To (2008) found that senior-level executives scored higher on the Renqing scale than junior-level executives, middle-level executives, and the Hong Kong normative samples. They suggested that business practitioners in the Chinese context might need to understand the cultural-specific standards of social exchange in order to succeed. Consistent with their findings, our study found that business major group scored the highest on Renqing among the six major groups and the Renqing scale marginally helped (.27) separate business major group from nonbusiness major groups in the second function of the discriminant analysis. Although the Cronbach’s αs of the Renqing scale was lower than .70 as in previous studies, the CPAI research team has retained items that had low item-total correlations to fit the broad bandwidth of the conceptual content of the scale (Cheung, Cheung, Zhang, et al., 2008). However, its lower reliability is recognized as a limitation.
The Social Sensitivity scale measures the degree to which an individual is sensitive to how others think and feel (Cheung, Cheung, Zhang, et al., 2008; sample item: “I am good at sensing other people’s emotions”). In the joint factor analysis of the CPAI-2 and the NEO-FFI, the Social Sensitivity scale double loaded on the factor with the three Extraversion facets of the NEO-FFI (.50) and the sixth Interpersonal Relatedness factor (.39; Cheung, Cheung, Zhang, et al., 2008). In our study, human services and business major groups scored higher on this scale, which also helped to separate these two groups from the engineering major group in the first function of the discriminant analysis. When we compared its relative contribution to that of the Extraversion versus Introversion scale, we found that its contribution to the first function of the discriminant analysis was higher than the Extraversion versus Introversion scale.
Finally, Face measures the degree to which an individual is concerned with protecting, maintaining, and enhancing one’s image in terms of approved social attributes (Cheung, et al., 1996; sample item: “Sometimes I will insist on giving a friend a decent gift even if it means borrowing money to buy it.”). Although Face loads on the Dependability factor of the CPAI-2, it has a double loading on the factor with the three Neuroticism facets of the NEO-FFI (.41) and the Interpersonal Relatedness factor (.22) in the joint factor analysis (Cheung, Cheung, Zhang, et al., 2008). In our study, the science and engineering major groups scored lowest on Face, while the business major group scored highest on this scale among the six majors. As the prospective jobs of business students usually involve more interpersonal interactions than the prospective jobs of science and engineering majors, the mean difference might reveal that Face is not simply a marker of neuroticism, it is more interpersonally connected and more relevant to the image management in the Chinese culture. This finding suggests that business students might have a higher tendency to protect, maintain, and enhance their self-image in terms of approved social attributes.
Implications for Career Counseling and Limitation
The results of this study have two implications for career counseling. First, our studies validated the utility of personality variables as predictors of career-relevant choice in the Chinese context. This finding disagrees with the argument that personal preferences are not related to career-relevant choice in the Chinese culture (e.g., Tang, et al., 1999). Although parents’ expectations play a critical role in the career decision-making process of Chinese young people (Leong, 1986), our findings suggest that personality dispositions and personal preferences also play an important role in the career choice of Chinese young people. Second, our findings show that the emic relationship-oriented personality scales of the CPAI-2 could also reveal meaningful patterns. For example, business and human services major groups not only enjoy social interactions and making new friends more than other majors as the universal personality trait (i.e., Extraversion) described, they are also more sensitive to how others think and feel (i.e., Social Sensitivity). Furthermore, another two emic personality traits (i.e., Renqing and Face) indicated that business majors have a higher tendency to adhere to the Chinese cultural norms of social interaction/exchange and concern with one’s social image than other majors do. The results support the utility of the CPAI-2 as a culturally relevant personality measure in career assessment. The information provided by the emic personality measures can assist career counselors to be more sensitive to the cultural context of career choice of Chinese young people in guiding them to make better decisions.
This is the first study that adopts a combined emic–etic approach to study the personality correlates of career choice. We recognize there are a number of limitations. First, the hit rate of gender and personality together accounted for 38.1% only, even though the prediction is much better than random selection or by gender alone. It shows that while personality is an important factor affecting career decision, other factors also influence young people’s choice of majors (e.g., their own academic results, the career prospects of the program, parental expectations, and the market trend). Second, although our sample size is relatively large and we have recruited participants from all the universities in Hong Kong, we should be cautious in generalizing our findings to other Chinese contexts (e.g., other cities in China) until cross-validation studies have been conducted. Finally, as the focus of our study was only to identify the personality constructs that can differentiate among college major categories, we did not collect additional outcome variables like satisfaction with the college major and school performance. To understand the relationship between personality and educational outcomes, future research studies should collect additional outcome variables (e.g., grade point average [GPA] and self-reported satisfaction).
Footnotes
The authors declared no potential conflicts of interest with respect to the research, authorship, and/or publication of this article.
The authors disclosed receipt of the following financial support for the research, authorship, and/or publication of this article: partially by the Hong Kong Government Research Grants Council Earmarked Grant CUHK4715/06H and Direct Grant #2020871 of the Chinese University of Hong Kong.