
Abstract
The anthropologist Edward Hall wrote extensively on the concept of polychronicity in which he documented the differences between people and cultures in the extent to which they differentially managed their daily activities in the context of space and time. In the work reported here, we have broadened the definition of the polychronicity concept that we define as the capacity of the individual to tolerate multiple sources of stimuli and information occurring in both time and space without suffering psychological distress or disorientation. In earlier work, summarized in several publications, we have constructed and validated a 25-item measure of individual capacity for tolerating stimulus loads across the following five information processing dimensions namely, information load, interpersonal load, change load, activity structure, and time structure. Several previous studies by our research group have found significant connections to a variety of behavioral criteria, including the capacity for visual and motor multitasking, arousal levels, speed of processing, and cross-cultural differences. In this article, we report on how we have augmented the number of items in each of the five dimensions, performed item analysis, reassessed the internal consistency reliability of the five subscales, and evaluated the validity of the new subscales against several criteria with a contemporary sample of 431 employed adults drawn from each of the Realistic, Investigative, Artistic, Social, Enterprising, and Conventional (RIASEC) categories of Holland’s taxonomy.
The anthropologist Hall (1959) wrote extensively on the concept of polychronicity in which he documented the differences between people and cultures in the extent to which they differentially managed their daily activities in the context of space and time. Since Hall’s seminal work, he (Hall, 1959, 1966), Sommer (1969), Wohlwill (1970), Mehrabian and Russell (1974), Haase (1986), and others have broadened the definitions and applications of the polychronicity concept that we define here as the capacity of the individual to tolerate multiple sources of stimuli and information occurring in both time and space, without suffering psychological distress or disorientation. In the literature of cognitive psychology, these concepts are closely related to the human factor aspects of information processing (Wickens & Flach, 1988), multitasking (König, Bühner, & Mürling, 2005; Meyer & Kierasm, 1997a, 1997b; Pashler, 1994), and serial and parallel processing (Logan, 2002).
Our first version of the Environmental Preference Inventory (EPI) defined a 25-item measure of individual capacity for tolerating stimulus loads across the following five information processing dimensions namely, information load, interpersonal load, change load, activity structure, and time structure (the subscale definitions with prototypical item content is shown in Table 1). Several published studies by our research group have found significant connections to a variety of behavioral criteria, including the capacity for visual and motor multitasking, arousal levels, speed of processing (Haase, 1986; Haase, Lee, & Banks, 1979; Dumont & Vamos, 1975), cross-cultural differences (Haase et al., 2011), and partial origins in biologically based Pavlovian temperament (Haase et al., 2014). In previous studies (Haase et al., 2014), we have also investigated the factor structure across several samples. Throughout these several studies, it has become increasingly apparent that the 25-item version of these five dimensions possessed less than optimal reliability, although the concurrent and construct validity have been amply demonstrated despite these psychometric deficiencies.
Definitions, Prototypical Items, and Internal Consistency Scale Reliabilities of the Five Subscales of the EPI.
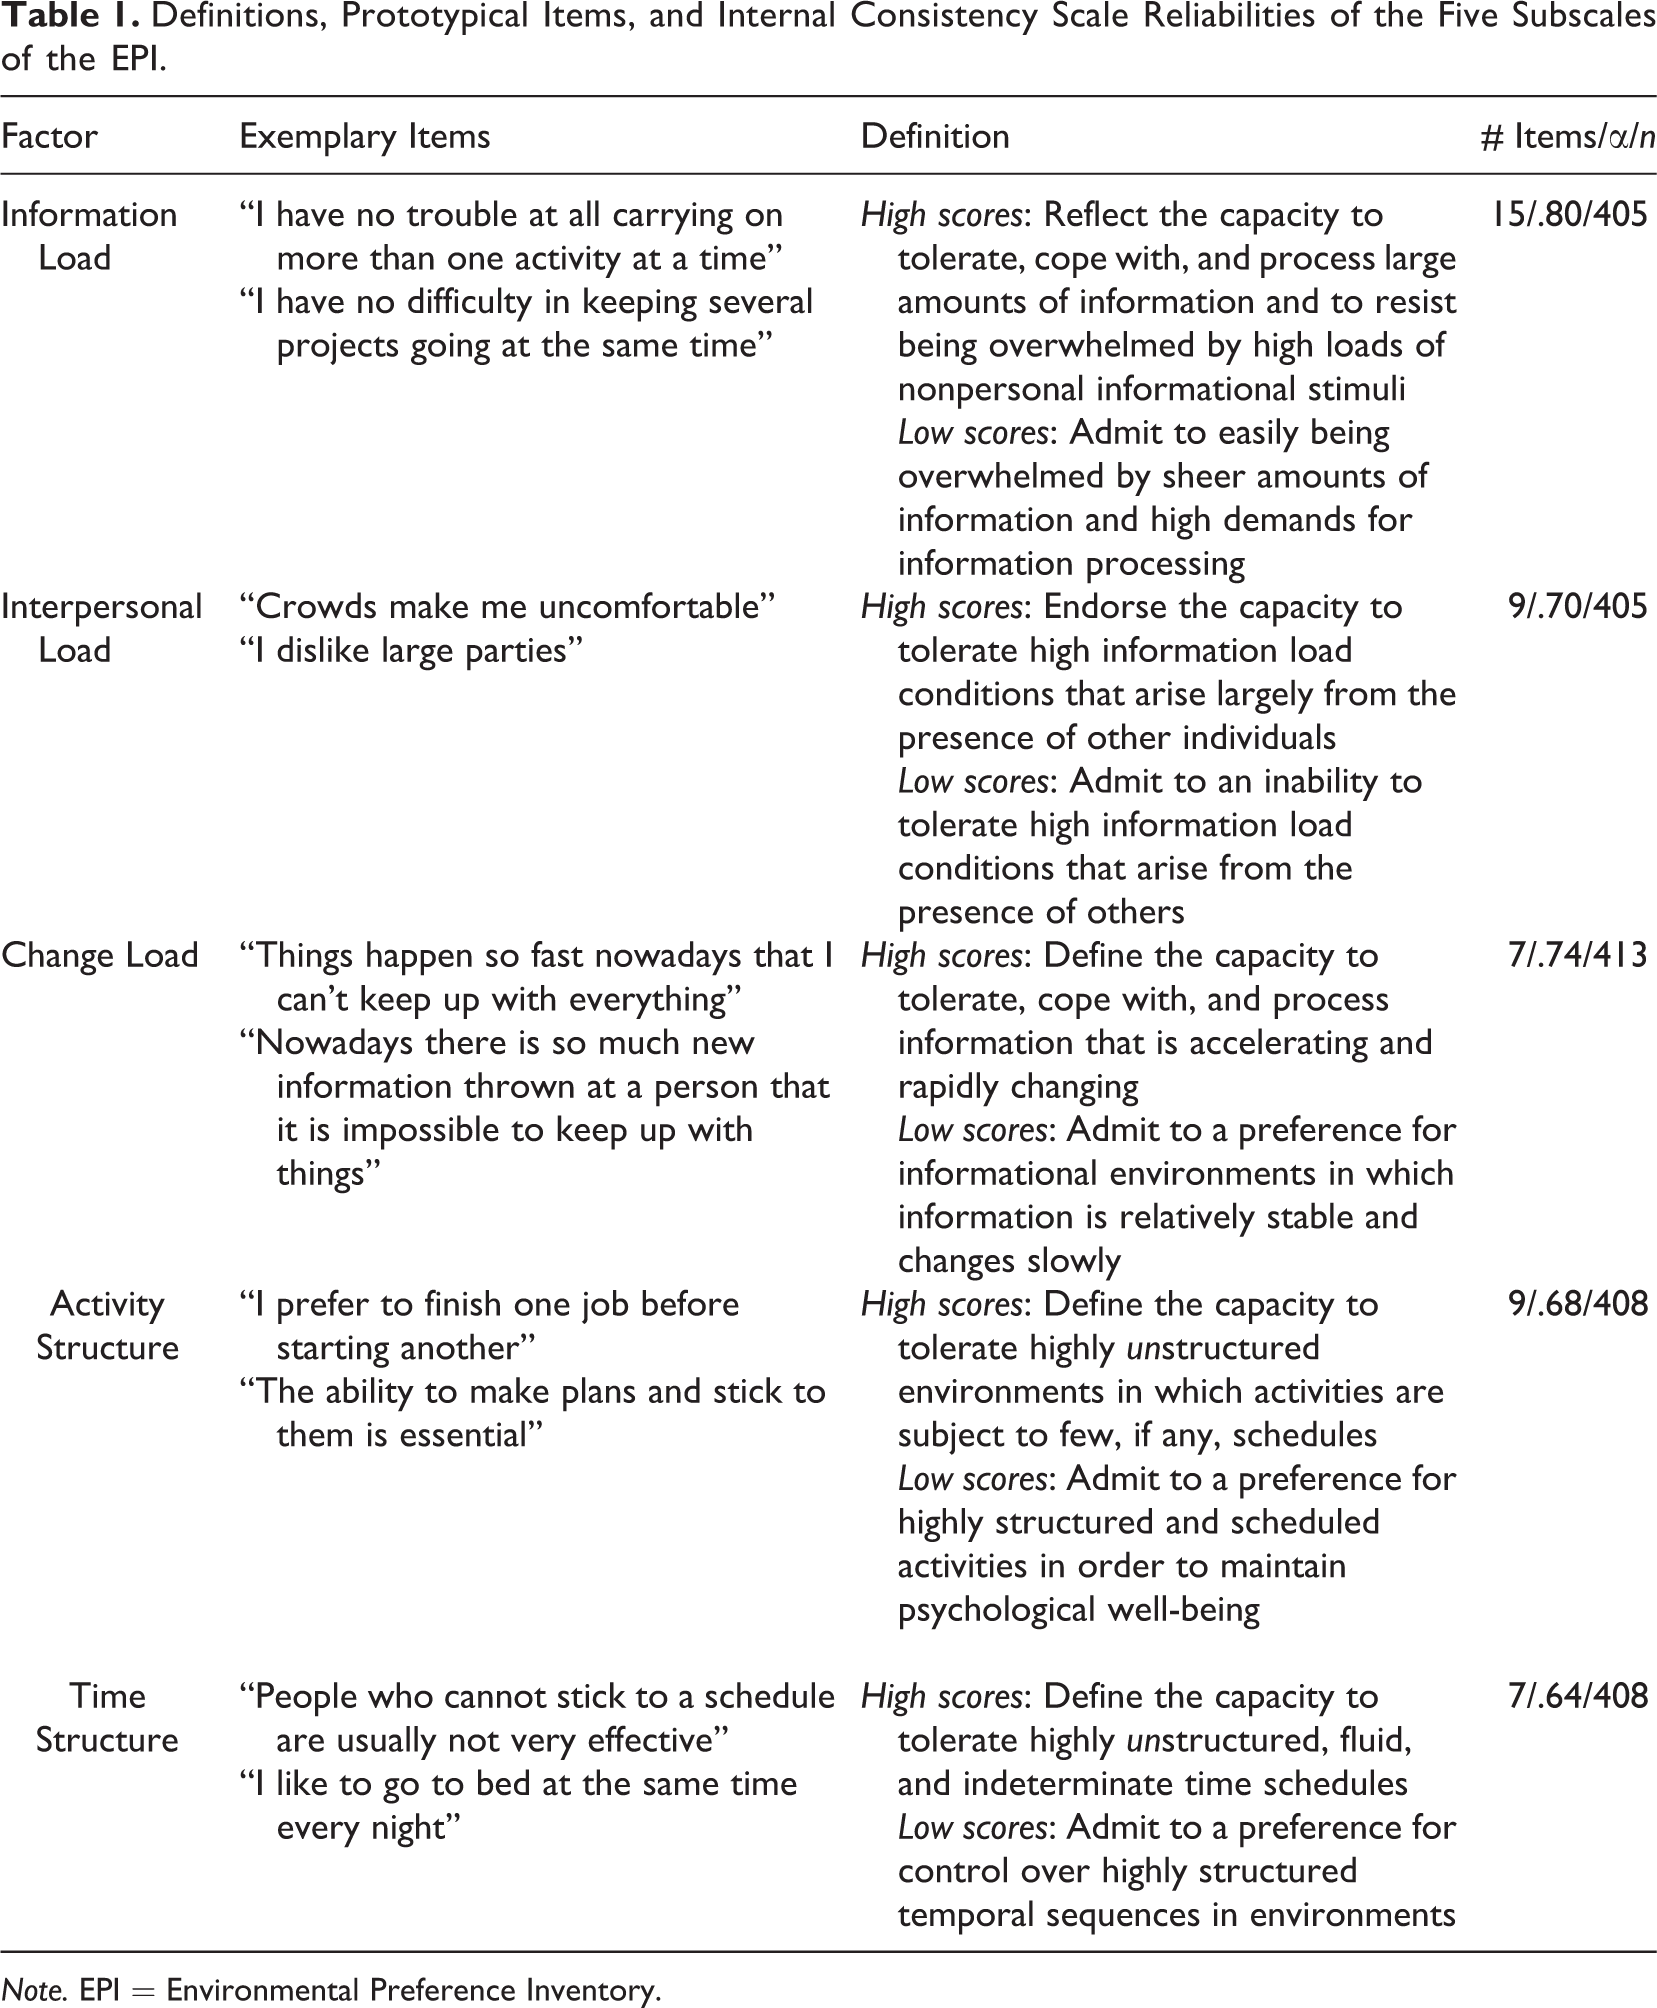
Note. EPI = Environmental Preference Inventory.
In this article, we reiterate the description of the initial factors of the scales, report on how we augmented the number of items in each of the five dimensions, performed item analysis, reassessed the internal consistency reliability of the five subscales, and evaluated the validity of the new subscales against several relevant criteria with a contemporary sample of 400 employed adults covering Holland’s Realistic, Investigative, Artistic, Social, Enterprising, and Conventional (RIASEC) taxonomy. We investigated the capacity of these revised scales to discriminate between occupational groups (RIASEC categories) and showed that the newly revised scales are significantly related to a nomological network of theoretically predictable measures, including measures of Pavlovian temperament, measures of intrinsic, and extrinsic work motivations in one’s chosen occupation as well as occupational longevity, satisfaction, and success. In the following sections, we introduce the constructs of the EPI, review the available past research with the constructs, present the methods we employed to refine the measurement of the five factors of the model, and present the current reliability and validity of the new form of the instrument. In addition, we describe the development, use, and classification adequacy of a 42-item interest inventory that we called the Career Preference Inventory (CPI) whose purpose is to tie together the constructs of the EPI to previously magnitude estimated scale values of the demand characteristics of the same 42 occupation names.
The Five Dimensions of the EPI
The Definitions of the Scales and the Added Items
In this current revision of the items of the EPI, we preserved the original five theoretical constructs that comprise this measure of the self-rated capacity to tolerate stimulus and information overload. The five dimensions of (1) information load, (2) interpersonal load, (3) change load, (4) time structure, and (5) activity structure are summarized in Table 1. The prototypical items in each subscale exemplify the definition of the subscales. Information load from nonpersonal sources, interpersonal sources, and rapidly changing stimuli constitutes the first three factors of information load with individuals ranging from declaration of no difficulty in dealing with challenging information conditions, to individuals who have little self-rated capacity for tolerating rich or densely populated environmental stimulus conditions. The factors of time and activity structure discriminate between individuals who have little problem dealing with highly unstructured environments in terms of time and activity and individuals who report considerable distress in environments where time and activities are highly unstructured—these individuals tend to prefer environments that are more controlled and structured in terms of time and scheduled activities. The constructs that identify each of these dimensions are focused on an individual’s self-assessment. Our ultimate goal for the EPI is to have a mechanism by which the profile of information processing capacities of the individual can be matched to the profiles of the magnitude estimated, information processing, demand characteristics of 42 occupations organized around Holland’s RIASEC codes (the 42 occupation names are discussed in a later paragraph describing the CPI). We do not pursue the magnitude estimated profiles further here. They are detailed in Haase, Ferreira, Santos, Aguyao, and Fallon (2008) and Haase et al. (2011).
In so far as lack of reliability may well be a function of too few items per construct, we added items to each of the five subscales. The original EPI consisted of 5 items per scale. We augmented each of the scales and expanded the number of total items from 25 to 47. The items are displayed in Tables 2 and 3 along with the subscales to which each item belongs. While adding items to the scales, we attempted to keep the content as similar as possible in order to preserve the homogeneity of each scale.
The Environmental Preference Inventory (EPI).
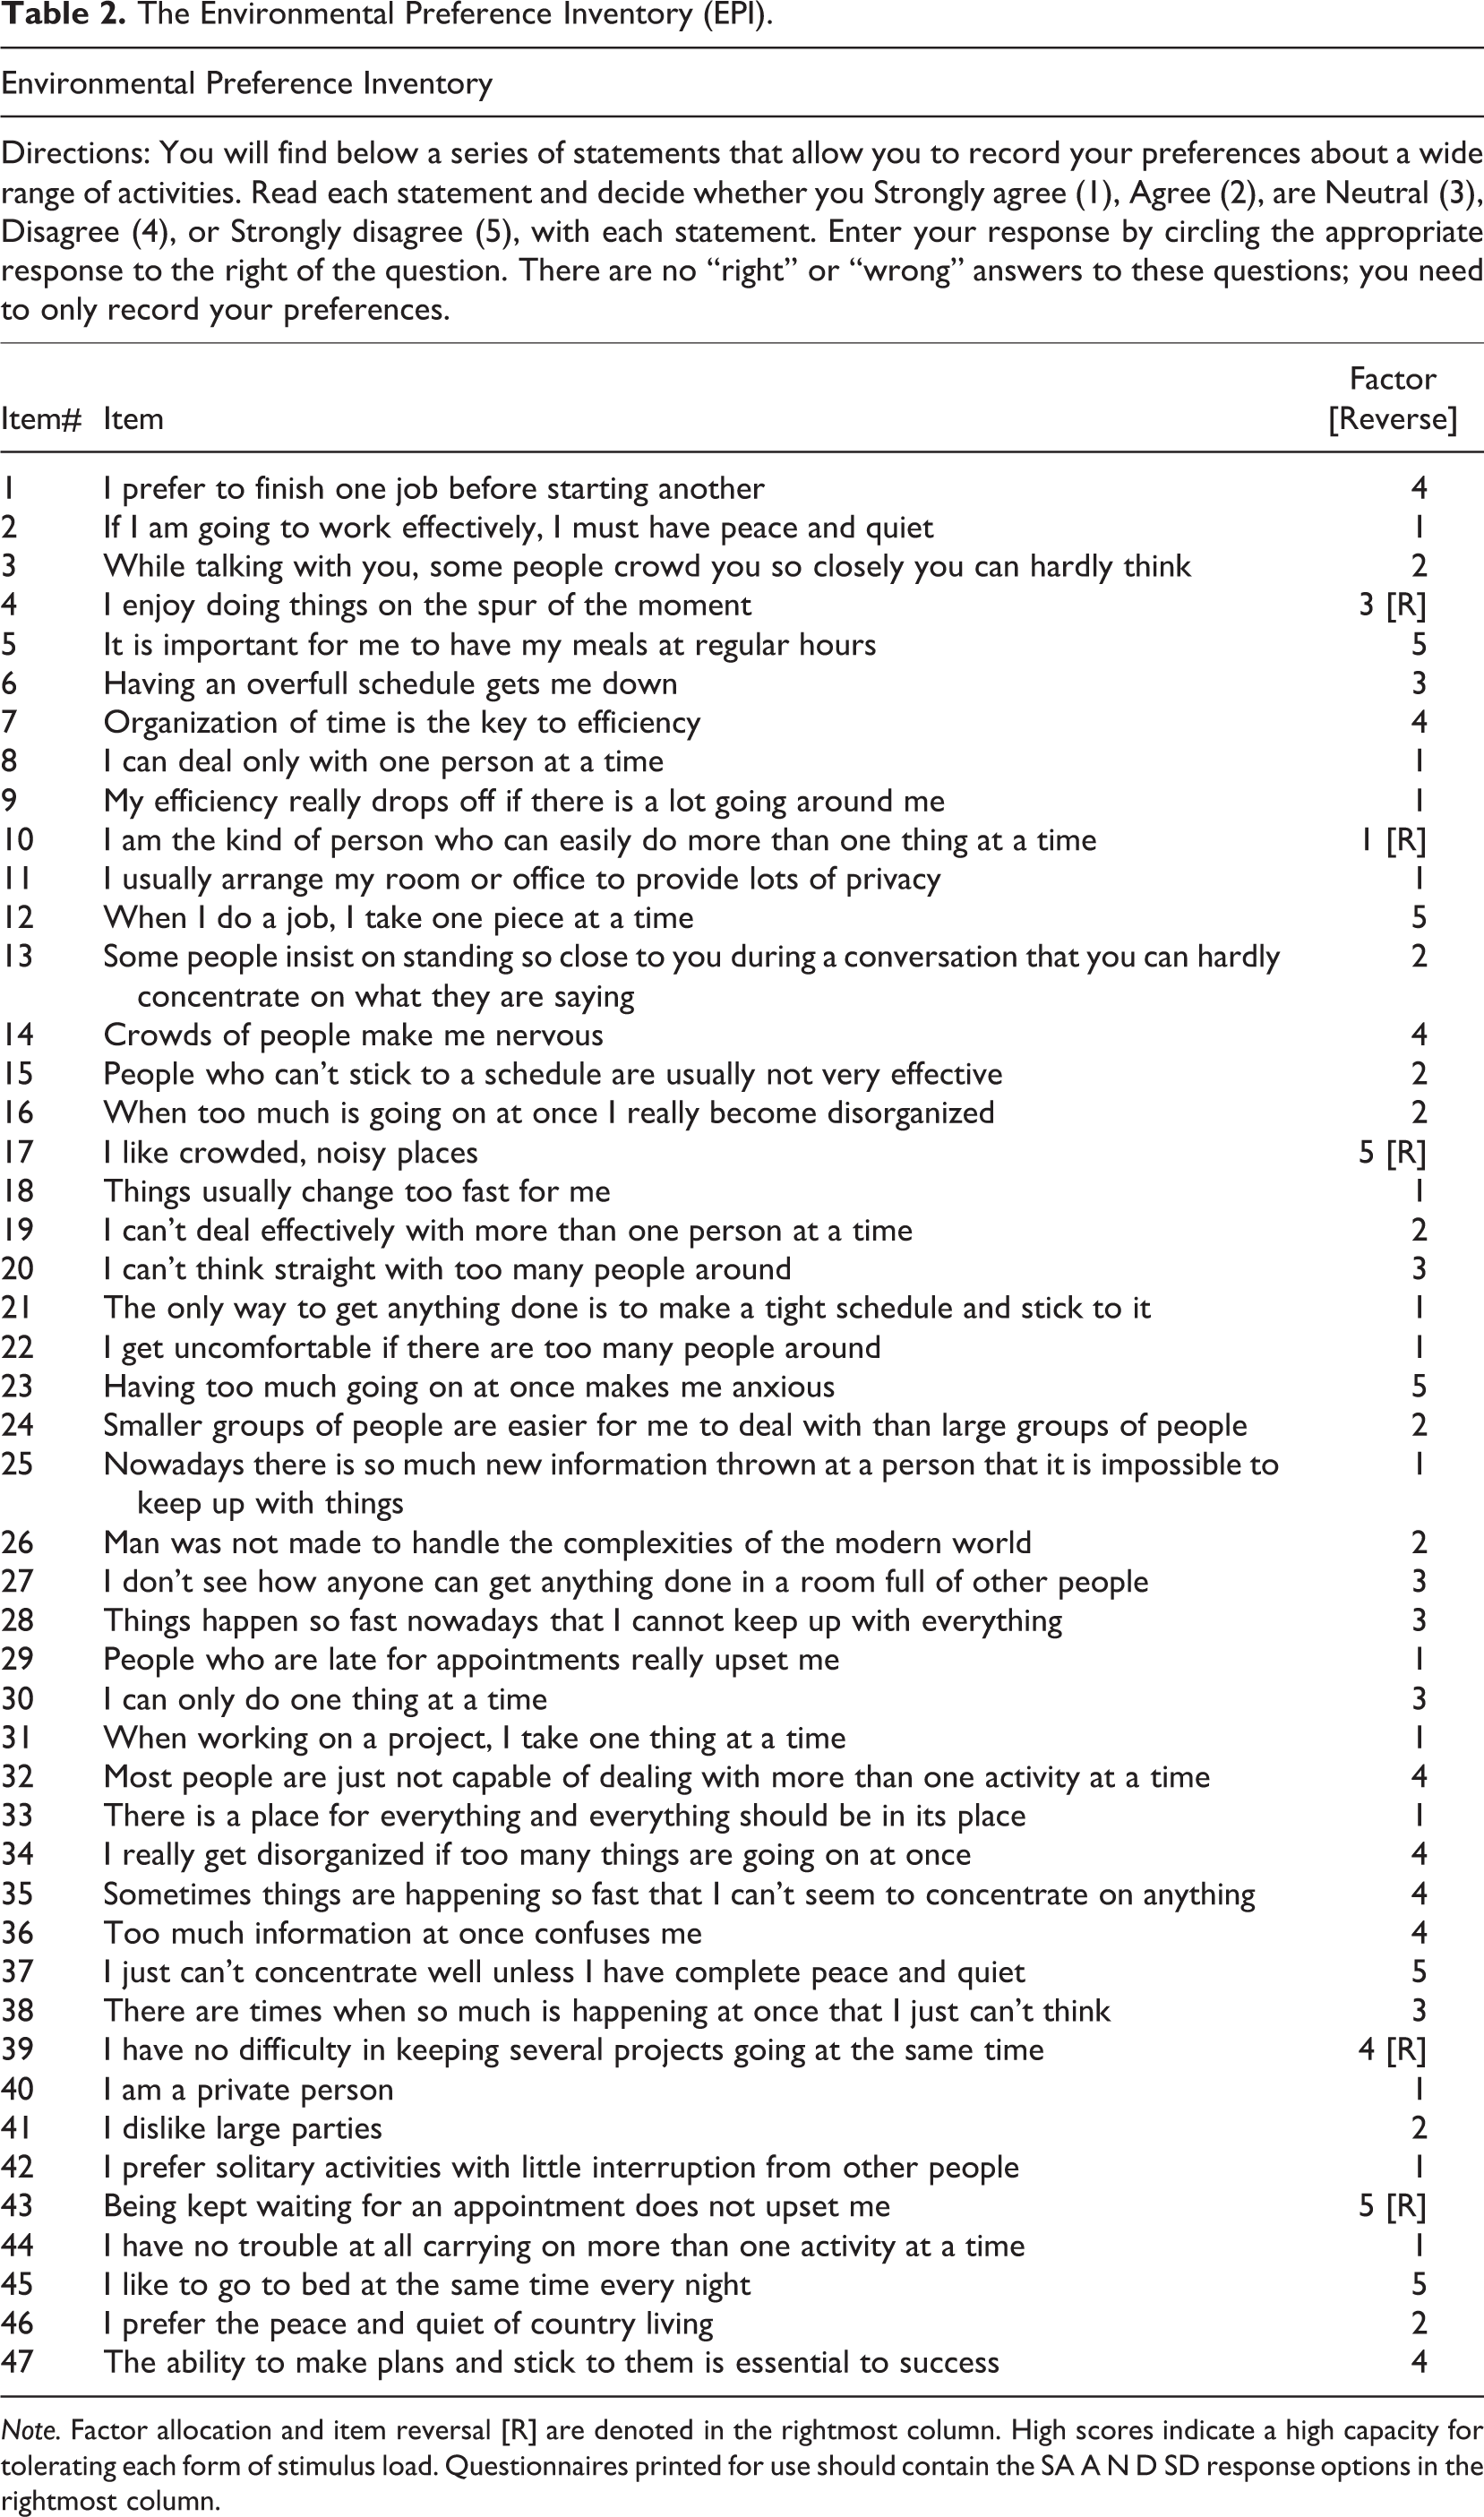
Note. Factor allocation and item reversal [R] are denoted in the rightmost column. High scores indicate a high capacity for tolerating each form of stimulus load. Questionnaires printed for use should contain the SA A N D SD response options in the rightmost column.
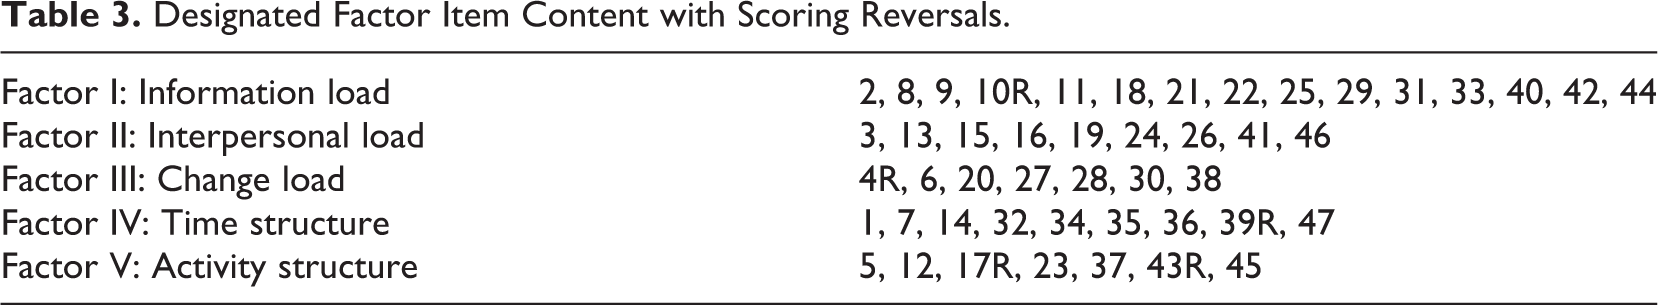
Designated Factor Item Content with Scoring Reversals.
The Sample
Most of the previous work with the constructs outlined above has been completed with college students. In the current work, we recruited a sample of Portuguese employed adults deliberately selected to represent the six occupational groupings of Holland’s (1997) RIASEC types. We purposefully sampled electricians (n = 17), pharmacists (n = 71), journalists (n = 124), teachers (n = 112), real estate agents (n = 48), and accountants (n = 59). A person was included in the sample whether they had educational background appropriate to the occupation and had been employed in that occupation for at least 1 year prior to their participation in the study. This sample consisted of 431 employed adults who had complete data for the EPI, the CPI, the Pavlovian Temperament Scales, and demographic questions. This group consisted of 46% females of an average age of 36 years (range 19–73), with a work experience that ranged from 1 to 40 years (mean = 11.7 years), and who rated themselves as moderately satisfied (mean = 2.6, range = 1–4) and moderately successful (mean = 3.0, range = 1–4).
Item Analysis and Internal Consistency Reliabilities of the EPI
We computed the correlations between each item and its intended scale as well as the correlations between each item and its opposite scales. An item was retained in the final subscale if it correlated more highly with its own scale than with the other subscales. The number of items, ranging from 14 to 7 per subscale, which met these criteria and were kept for further analysis are listed in Table 4 along with the number of respondents who completed each subscale and the internal consistency reliability estimated by Cronbach’s α. The reliabilities of the scales are considerably higher than that had been the case for the former 25-item scale and the most part are respectable ranging from .80 to .64. The internal consistency reliability for the total score was found to be α = .93.
The 42 Items of the Career Preference Inventory (CPI).
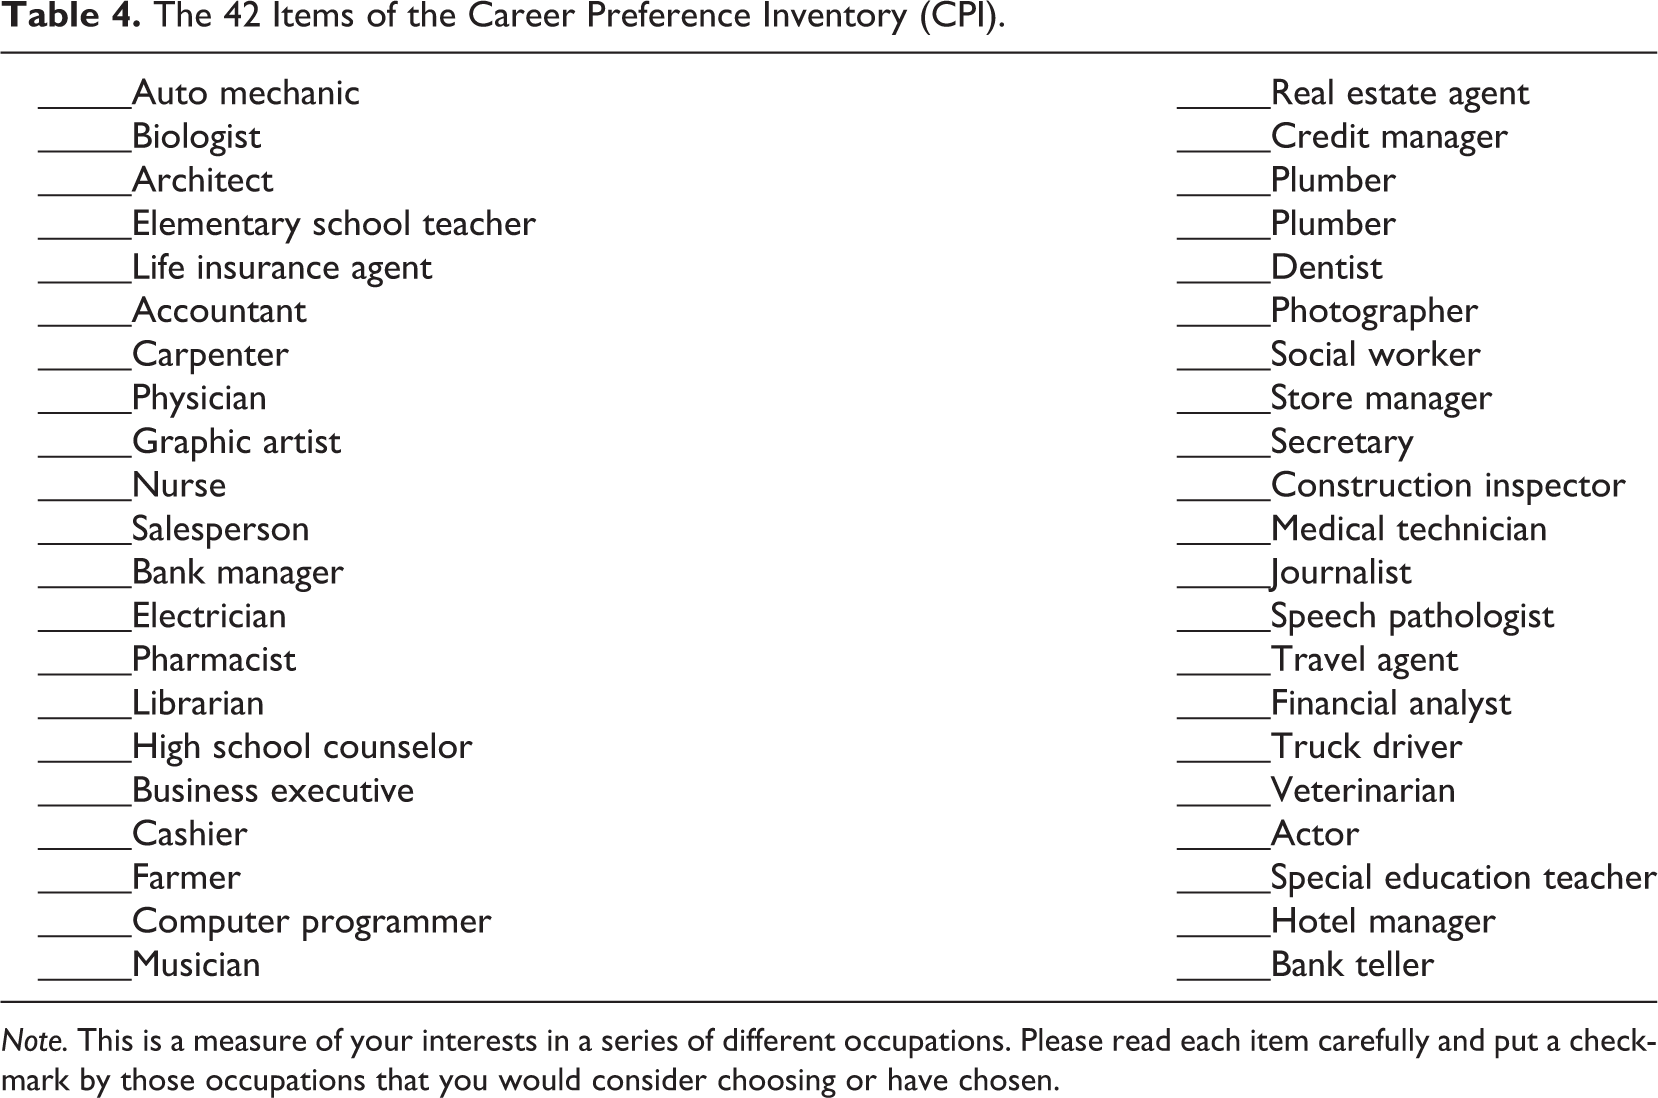
Note. This is a measure of your interests in a series of different occupations. Please read each item carefully and put a checkmark by those occupations that you would consider choosing or have chosen.
The Items and Scoring of the EPI
The 47 items of the EPI are presented in Table 2. The information processing dimension to which each item belongs is listed in the left most column of the table. Of the 53 original items, the 47 items listed in Table 2 survived the item analysis stage. The response alternatives are Likert-type 5-point scales, with 1 being Strongly agree and 5 being Strongly disagree. The factor correspondence is noted in the rightmost column of Table 2, along with the items that must be reversed are designated with an “[R].” The syntax of an SPSS scoring program, and instructions for its use, has been included in Table 9. The EPI can, of course, be hand scored according to the factor-specific scoring key listed in the five rows of Table 3.
The Confirmatory Factor Structure of the EPI
The original intent of the EPI was to contain five distinct dimensions. Both exploratory and confirmatory factor analyses on the data of several previous samples (see Haase et al., 2014, for a summary of these analyses) suggested that a second-order factor defining two clusters of first-order factors was the most plausible factor structure of these concepts. Consequently, we fitted the confirmatory factor structure that is displayed in Figure 1 to a subset of 389 participants who had complete data on all subscales of the EPI. The model was fitted by maximum likelihood asymptotic distribution-free methods (Browne, 1984) as implemented in STATA 13.

First- and second-order, 5-factor model of the information loads of the Environmental Preference Inventory (EPI).
The five-factor, second-order confirmatory factor analysis (CFA) fit the data well with a nonsignificant asymptotic distribution free ,
The CPI
As part of our ongoing research program in this domain, it is our intention to be able to match magnitude estimation scaled profiles of the information processing demand characteristics of RIASEC occupations (see, e.g., Haase et al., 2011) with the same, but self-assessed, profile of information processing capacities of the individual as measured by the EPI. To accomplish these goals, we needed a simple method, similar to the method used by Holland’s (1997) self-directed search, to assess interest in each of the six Holland RIASEC types. We included the same 42 occupation names that have elsewhere been magnitude estimation scaled for their information processing demand characteristics (see Haase et al., 2008; Haase et al., 2011). 1 We ensured that the occupation names chosen for the previous scaling (1) represented each of the RIASEC types, (2) existed in both Portugal and the United States, and (3) appear as occupation names on both the Strong Interest Inventory (SII; Harmon, Hansen, Borgen, & Hammer, 1994) and the Vocational Preference Inventory (VPI; Holland, 1997). The CPI shown in Table 4 is a list of those 42 magnitude estimation scaled occupations. In order for the EPI to be maximally useful, one must triangulate occupational interest (the CPI or other method of RIASEC classification), a profile of individual tolerances for information processing demands (the EPI), and a profile of occupational demand characteristics (the magnitude estimation scaled values of RIASEC occupations). In the study, we are reporting here, we have a unique opportunity to assess the validity of the CPI because we have the most appropriate criterion group—each of the respondents was an employed adult with anywhere from 1 to 40 years in that chosen occupation (median = 10 years) and who reported being generally satisfied with their work on a 1–4 Likert-type scale (median = 2.7). The CPI is scored by summing the checked occupations in each RIASEC category and scores can range from 0 to 7. The corresponding bivariate distribution of the RIASEC high-point code classification crossed with the actual RIASEC occupation of the respondents is shown in Table 5.
Cross Classification of RIASEC Codes Obtained by the CPI and Actual Occupation.

Note. A percentage correct classifications of CPI RIASEC to actual occupation is 64%. RIASEC = Realistic, Investigative, Artistic, Social, Enterprising, and Conventional; CPI = Career Preference Inventory; KR = Kuder–Richardson.
The Kuder–Richardson 21 internal consistency reliabilities range from .58 to .80 and suggest adequate reliabilities of the separate RIASEC occupation-to-CPI categories. The cross classifications by CPI and occupation are significantly related, ,
As part of the attempt to establish the construct validity of the EPI, we also hypothesized that individuals within different RIASEC occupations would possess different characteristic levels of capacity for tolerating information processing demands. We conducted a 6-group (RIASEC occupation) one-way, multivariate analysis of variance on the five subscales of the EPI. The results of this omnibus analysis based on 324 respondents with complete data revealed that the optimal linear combinations (Haase, 2011; Tabachnick & Fidell, 2007) of the EPI subscales significantly differentiated the occupational groups, Pillai’s Trace V = .16,
We take these collective results as evidence of the construct validity of the CPI and conclude that its use in classifying future research participants in RIASEC categories is warranted. It can be used 2 in conjunction with the EPI to locate the individual within the RIASEC classification scheme and allow that person to select an occupationally matched magnitude estimated profile of demand characteristics of 42 occupations across the EPI load dimensions of information, interpersonal, and change loads, and time and activity structure.
The Relationships of the EPI to Measures of Pavlovian Temperament
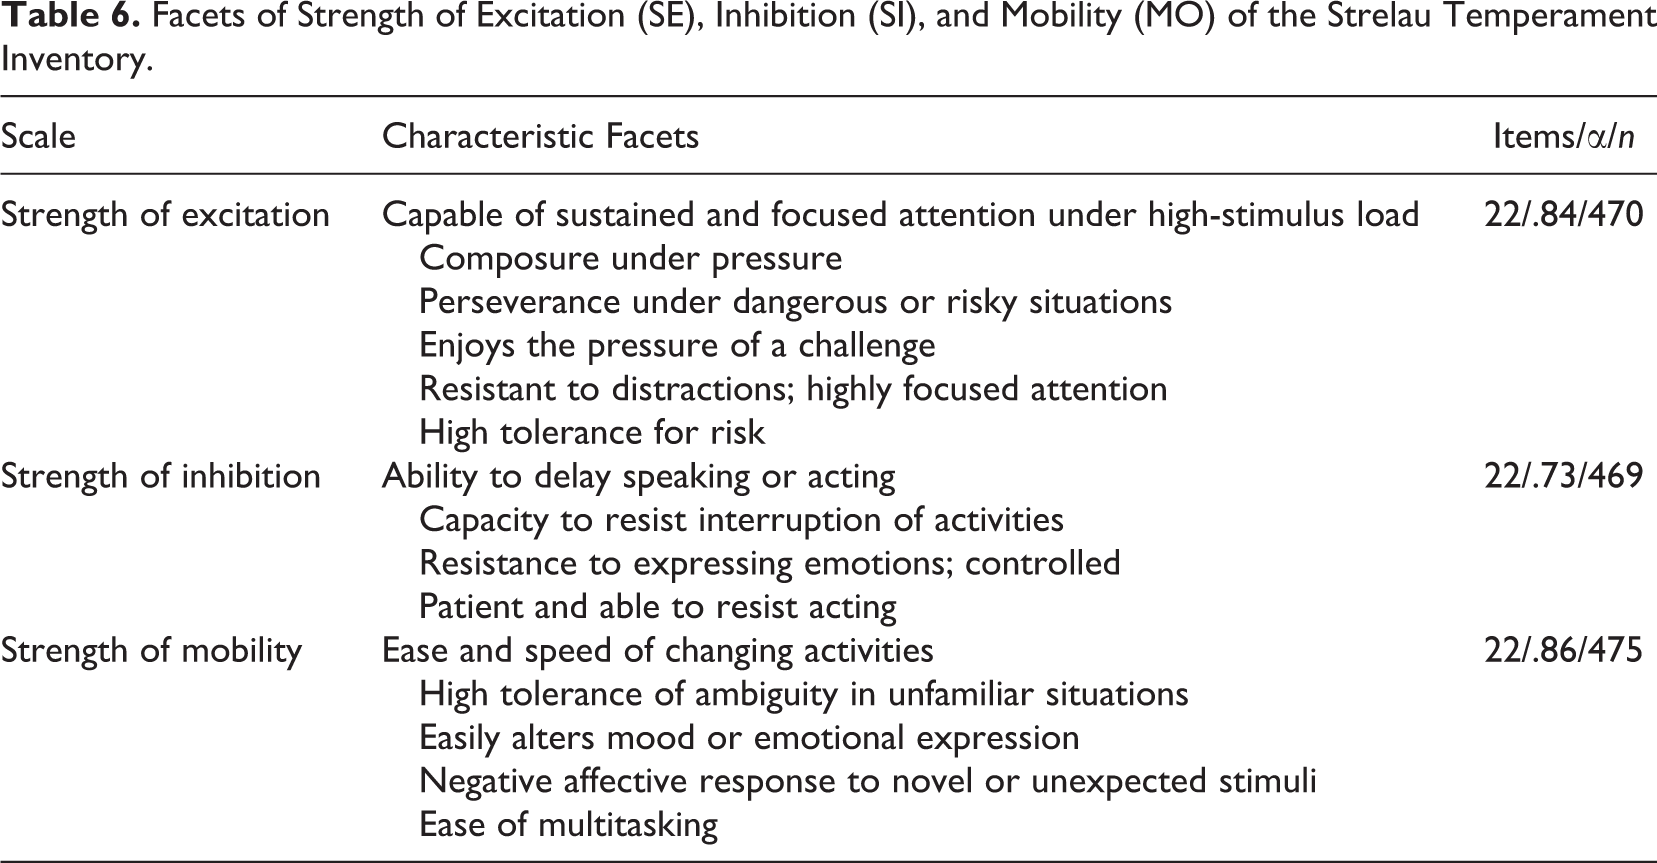
Our primary conceptual assertions about the five dimensions of the EPI are that the constructs measured by that scale reveal a profile of the capacities of the individual to tolerate information overload. As such, we have hypothesized that the five dimensions of polychromic information processing capacity are rooted in the physiological arousal mechanisms of the individual. In his studies of classical conditioning, Pavlov (1951) articulated a system of biologically based temperament that he asserted was based on the operating capacity of the central nervous system capacity. He called this phenomenon strength of the nervous system and argued that these temperamental characteristics literally predicted the “working capacity of the cells of the central nervous system” (195, p. 213). Throughout Eastern Europe, and particularly in Russia and Poland, generations of scientific adherents to the Pavlovian system of temperament have generated extensive evidence of the behavioral and physiological correlates and consequences of variation in strength with respect to excitation (SE), inhibition (SI), and mobility (MO) of the nervous processes (Table 6; Nebylitsyn & Gray, 1972; Strelau, 1972, 1997). In Western psychology, these Pavlovian constructs are remarkably similar to, and highly correlated with, Eysenck’s (1967) constructs of extroversion, neuroticism, and psychoticism in so far as Eysenck (1967) articulated his causal theory of personality in which he aligned extroversion to Pavlov’s excitation–inhibition axis and related neuroticism to Pavlovian mobility of the nervous processes. In contemporary psychological science, Pavlovian constructs have been most clearly explained by Gray’s neuropsychological theory of personality called reinforcement sensitivity theory (1975; Gray & McNaughton, 2000), as differential sensitivity to reward and punishment. Evidence for the neurophysiological basis of personality and temperament is reviewed by Corr and Perkins (2006).
In our studies with an earlier form of the 25-item EPI (Haase et al., 2014), we have found significant relationships between the five dimensions of the EPI and Strelau’s (1972; Strelau, Angleitner, & Newberry, 1999) paper-and-pencil measure of Pavlov’s excitation, inhibition, and MO. In this study, we have replicated that series of associations with the revised and augmented EPI. The characteristic facets of Pavlov’s strength of excitation (SE), strength of inhibition (SI), and mobility (MO) are outlined in Table 6. It is clear that excitation—the capacity to withstand significant amounts of information overload without behavioral disruption—and mobility—the ability to rapidly shift attention and activities and multitask—should be related to our five dimensions that assess information processing capacity. We suspect that inhibition—the ability to ignore competing stimuli—will be less predictive of our polychromic constructs of information processing. The means, standard deviations, and bivariate correlations between the five dimensions of the EPI and Strelau, Angleitner, and Newberry’s (1999) Pavlovian Temperament Survey measures of excitation, inhibition, and mobility based on a sample of 339 respondents with complete data are presented in Table 7. The internal consistency reliabilities reported in the rightmost column of Table 6 confirm that the generally respectable reliabilities of the three Pavlovian temperament scales reported by Strelau et al. (1999) were also found in the present data with Cronbach’s α = .84, .73, and .86, respectively, for the excitation, inhibition, and mobility scales.
Facets of Strength of Excitation (SE), Inhibition (SI), and Mobility (MO) of the Strelau Temperament Inventory.
Correlations Between the Dimensions of the Environmental Preference Inventory (EPI) and Pavlovian Temperament
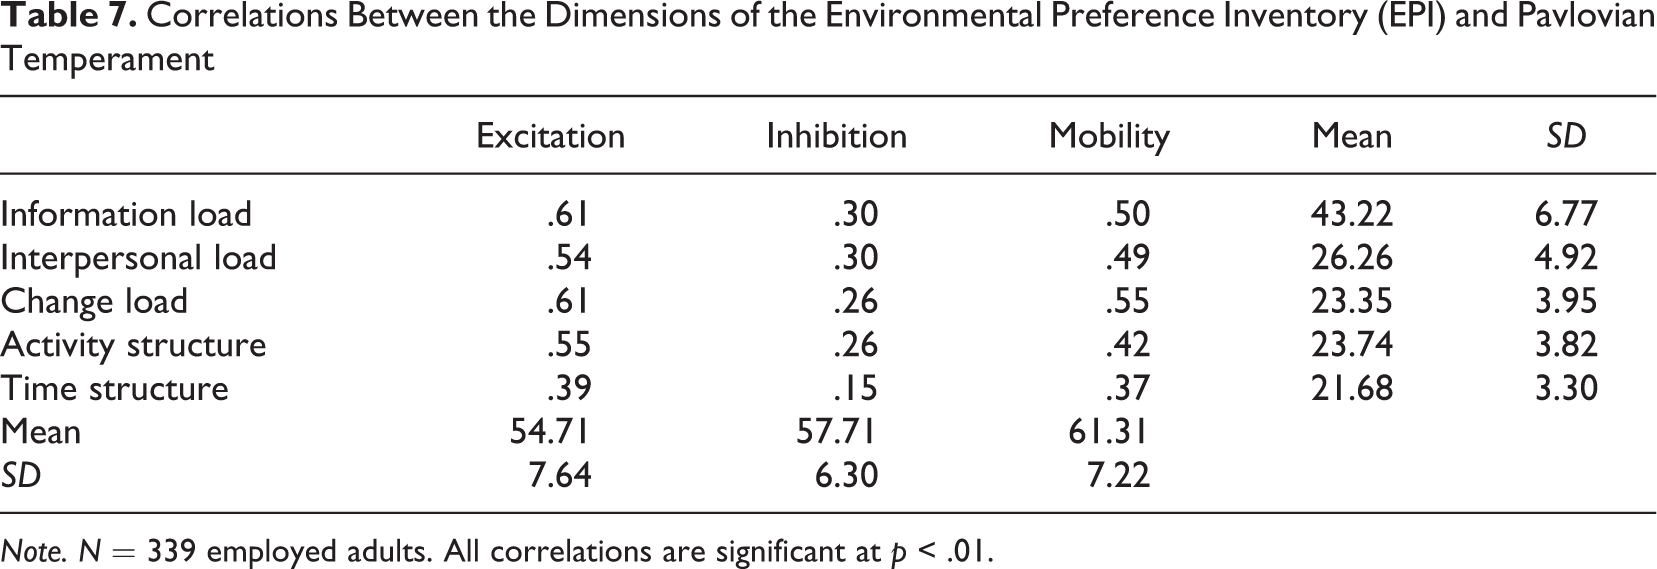
Note. N = 339 employed adults. All correlations are significant at p < .01.
The EPI dimensions are significantly related to all of the Pavlovian dimensions, but the relationships appear strongest for the information demands and the excitation and mobility factors. The optimal weighted linear combinations of these two sets of variables (l and m) established by the structure coefficients of the canonical correlation rlm
, Pillai’s Trace V = .52, 
and,
All three loadings of the Pavlovian temperaments are significantly different from zero by conditional tests of the canonical coefficients (Haase, 2011; STATA, 2013) but only the information, interpersonal, and change load factors of the EPI are significantly different from zero. Clearly, the first optimal relationship is defined by an underlying factor of information processing of the EPI and the excitation and mobility scales of the Pavlovian temperament instrument—both sets of scales focus on endurance and capacity for intense or prolonged stimuli. In this sense, the information processing capacities of individual as measured by the EPI appear to be closely related to the neurological capacity for tolerating stimulus load that is a biologically based, temperamental variable that is established early in life. There is mounting evidence in the neuroscience literature that such temperamental characteristics are related to brain function, which in turn can be shown to be conditioned by psychological and cultural experience (Kitayama & Park, 2010). The second significant canonical root of this analysis revealed that only the activity (+.16) and time (−.30) dimensions of the EPI and all three of the Pavlovian scales (excitation = +.13, inhibition = −.12, and mobility = −.10) were conditionally significant loadings on the second root. The bipolar root suggests that having no difficulty managing chaotic time structure is most related to the ability to tolerate intense and prolonged stimulation, while the ability to tolerate fluidity of activity schedules is most related to the neurological capacity to suppress interruption and to maintain cognitive focus in tasks as well as the ability to shift tasks and attention rapidly with no negative behavioral consequences. All in all, we take these findings as increased validity of the possible biological basis of the capacity to tolerate information processing demands as measured by the EPI.
The Relationships of the EPI to the Actual RIASEC Occupations
Our general hypothesis about the differences in self-assessed capacities for tolerating information loads across RIASEC occupations were tested by assessing EPI profile differences across the six actual occupational groups for the 324 respondents that had complete data. A 6 (RIASEC group) × 5 (EPI subscales) split plot analysis of variance revealed a significant main effect for RIASEC group, F(5, 318) = 3.01, p = .011, a significant main effect for EPI profile, F(3, 1,272) = 1,119.72, p = .001, and a significant RIASEC × EPI Profile interaction, F(17, 1,272) = 2.01, p = .001. The means of the RIASEC groups for each subscale in the profile are given in Table 8. One aspect of understanding the interaction is the switching rank order of self-estimates of the RIASEC groups depending on the load considered. For example, the electricians have the lowest tolerance of information load compared to the artistic journalists who have the highest capacity/tolerance for nonpersonal information loads. Conversely, real estate agents (an enterprising occupation) and teachers (a social occupation) have the highest capacity for tolerating high demands for interpersonal information, although the realistic electricians show far less capacity for this source of stimulation. These distinctions make some intuitive sense given the differing interpersonal interactional demands of the realistic, enterprising, and social occupations. In yet another instance, artistic (journalists) and enterprising (real estate salespeople) occupations claim the highest capacity for tolerating rapidly changing stimulus conditions, while the social (teachers) and realistic (electricians) occupations report far less tolerance of this type of cognitive demand. Other instances can be found among the mean differences given in Table 8, but the above-mentioned examples should suffice to help further document the face, content, and construct validity of the EPI.
Means and Standard Deviations of the EPI Dimensions by RIASEC Group.
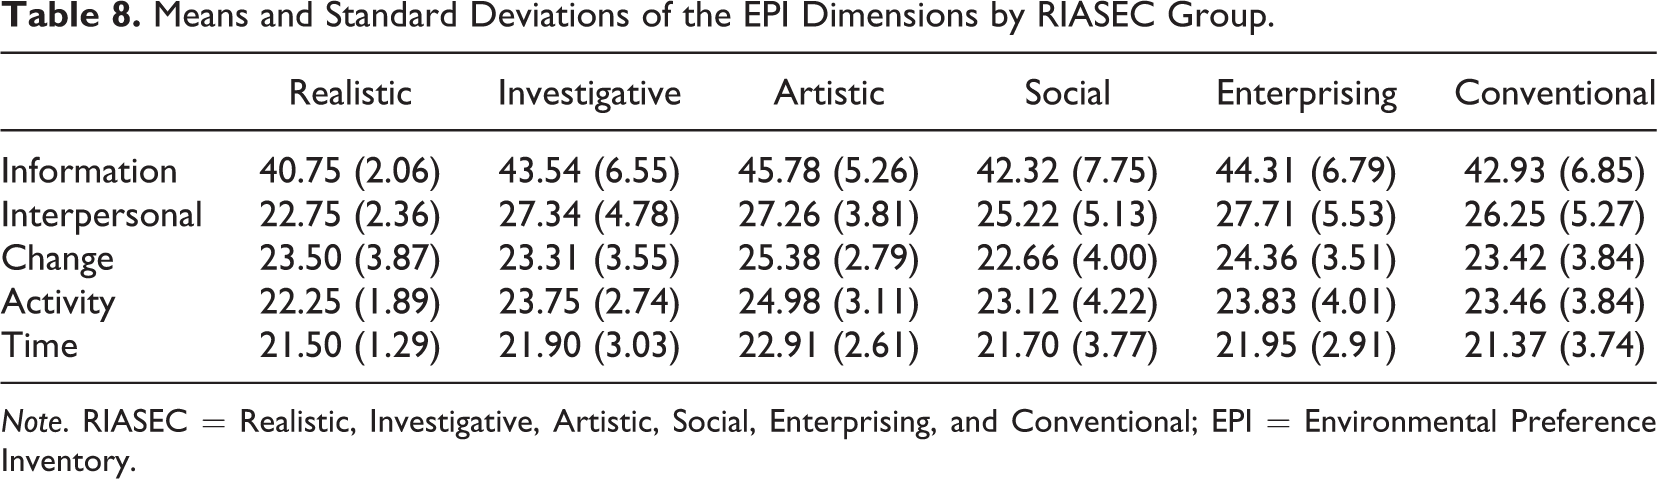
Note. RIASEC = Realistic, Investigative, Artistic, Social, Enterprising, and Conventional; EPI = Environmental Preference Inventory.
Discussion
We are encouraged by the initial evaluation of the reliability and validity of the new version of the EPI that has been reviewed here. The reliabilities of the subscales and the total score are certainly adequate for research purposes and the findings that the EPI can significantly discriminate between RIASEC occupational groups—both by the CPI and as measured by the RIASEC categories of the actual occupations held by the respondents studied here. Second, the scales of the EPI have been found to be significantly, and substantially, related to a series of biologically based Pavlovian temperaments that have been shown to be highly sensitive to central nervous system activity and the capacity to deal with intense environmental stimuli (Strelau et al., 1999). These results are consistent with the previous research that has also connected the EPI constructs and the Pavlovian temperament measures of excitation, inhibition, and mobility to cultural differences (Haase et al., 2014). Also consistent with previous research, and which adds to the construct validity of the EPI, is the very well-fitting CFA model of the five subscales of the EPI. The first- and second-order factor structures clearly replicate the structure found in previous samples and is conceptually meaningful. The tolerance of information, interpersonal, and change load factors are paramount in this scheme but clearly augmented by a distinct pair of capacities for tolerating fluidity in structuring time and activities in the occupational domain.
We are encouraged by the incipient development of this nomological network of validity found here and in other evaluations of the constructs (Fernandes, 2013). We feel confident enough at this point to share the items of the EPI (Tables 2 and 3) in the hopes that other researchers will find it useful and thereby add to the nomological network of validity that has begun here. In order to facilitate the use of the EPI, we have included the SPSS syntax (Table 9) that can be used to score the instrument.
SPSS Syntax for Scoring the EPI.
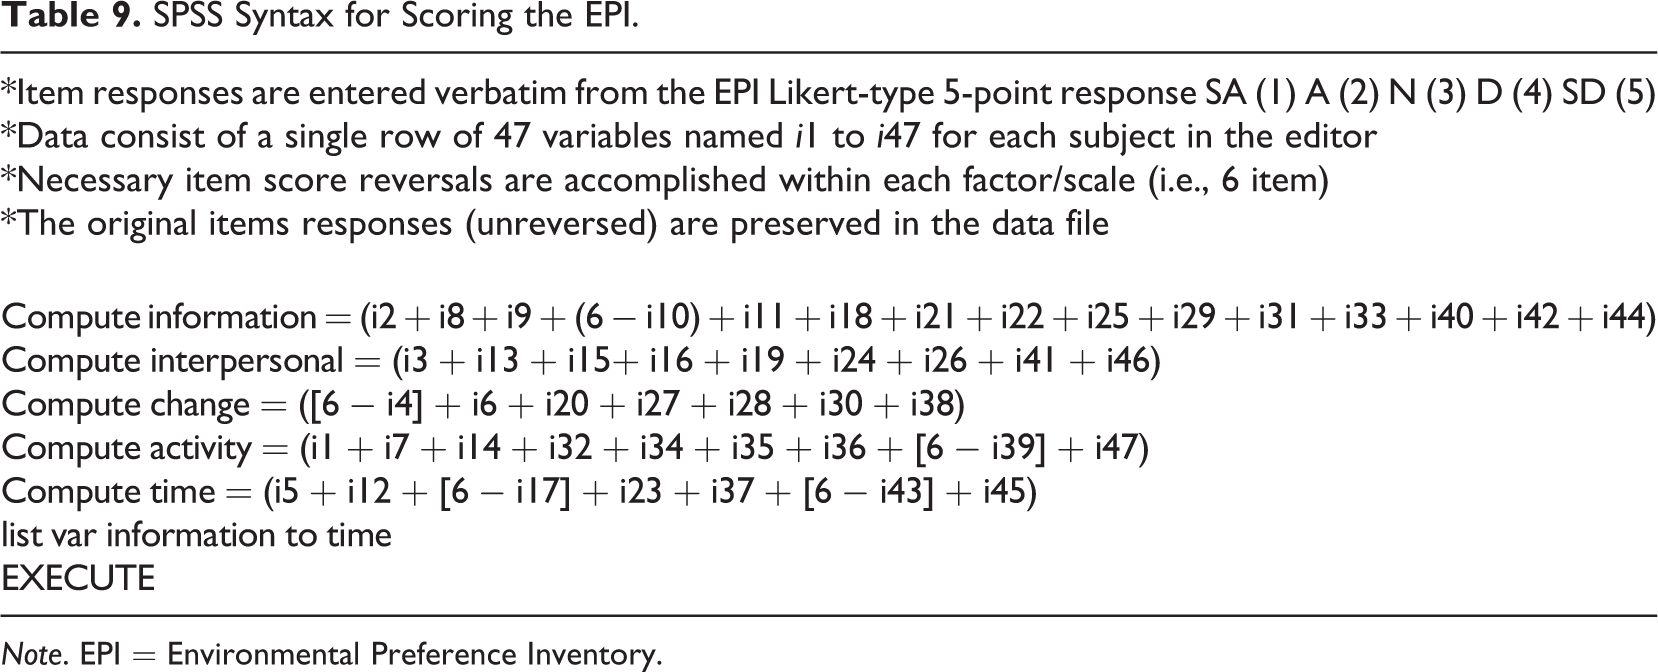
Note. EPI = Environmental Preference Inventory.
In addition to the EPI, we are also encouraged by the content, concurrent, and construct validity of the CPI that is also presented here in its entirety (Table 4). The correspondence of RIASEC classification by the CPI and the actual occupation among our respondents who have been in the occupation for at least 1 year (median = 10 years) and who report being generally satisfied (median = 2.7 on a 1–4 Likert-type scale) is, in our judgment, impressive (68% correct classification rate), and naturally we find this to be encouraging. However, our main motivation in constructing the CPI with its 42 occupations organized around the six RIASEC categories was to define a set of occupations that (1) existed in both the United States and Portugal, (2) appeared on both the SII and VPI, and (3) could be scaled by magnitude estimation with respect to the demand characteristics of each occupation with respect to the five factors of information load, interpersonal load, change load, time, and activity structure. Now that we have established confidence in the psychometric characteristics of the EPI, our ultimate goal is to match the profiles of the self-assessed capacity for tolerating information processing loads of an individual with the profile of each of these 42 occupations in terms of their demand characteristics on the same five dimensions—in essence, a person–environment (P-E) fit approach to matching individual capacities with the demand characteristics of RIASEC occupations. The magnitude estimation scaled values of the 42 occupations across these five information dimensions can be found in Haase et al. (2011).
It is our intention in the next phase of this program of research to augment these scaled values with additional data from employed adults in the United States in order to replicate, verify, and extend the utility of the P-E fit process we have presented here. When these scaled values are available, our ultimate goal is to create a tool that can be useful in career counseling by which individuals who differ in their self-assessed capacities for tolerating different types of information overload can be matched with one or more profiles of the 42 occupations that we have scaled to define the demand characteristics of that occupation across the same five dimensions of information processing load. Ultimately, we hope that this matching process will help individuals make even more informed vocational and career decisions.
Footnotes
Declaration of Conflicting Interests
The author(s) declared no potential conflicts of interest with respect to the research, authorship, and/or publication of this article.
Funding
The author(s) received no financial support for the research, authorship, and/or publication of this article.