
Abstract
Research and development (R&D) investments are a key issue for companies. In an increasingly competitive economy, R&D can be a source of competitive advantage. Therefore, a profuse research line on the reasons that can motivate firms for R&D investment has emerged. Theoretical frameworks include the resource-based theory, the creative destruction model, the domestic competitive pressure model, and the exposure to international competition model, among others. However, the culture of the country is not widely used as an explanatory variable. Therefore, in this article we will test the extent to which R&D intensity in European countries may be explained by cultural dimensions. Our study included observations from 6,919 firm-year data from 1,517 firms in a sample of 13 European countries. The results support the idea that culture influences R&D intensity.
Introduction
Research and development (R&D) activity is a well-organized process of knowledge creation, production, diffusion, and applications. It entails innovation in scientific technology, in management measures, and in social and political systems (Wang, 2010).
R&D investments represent a large effort in many nations. According to the Organisation for Economic Co-Operation and Development (OECD; 2017), in 2015, the United States spent US$462 billion on R&D, which is equal to 2.8% of the gross domestic product (GDP). Some European countries also made a noticeable effort. Table 1 (column 1) shows ranges of 1.2% to 3.3% of GDP for selected European countries.
R&D Investments (% of GDP).
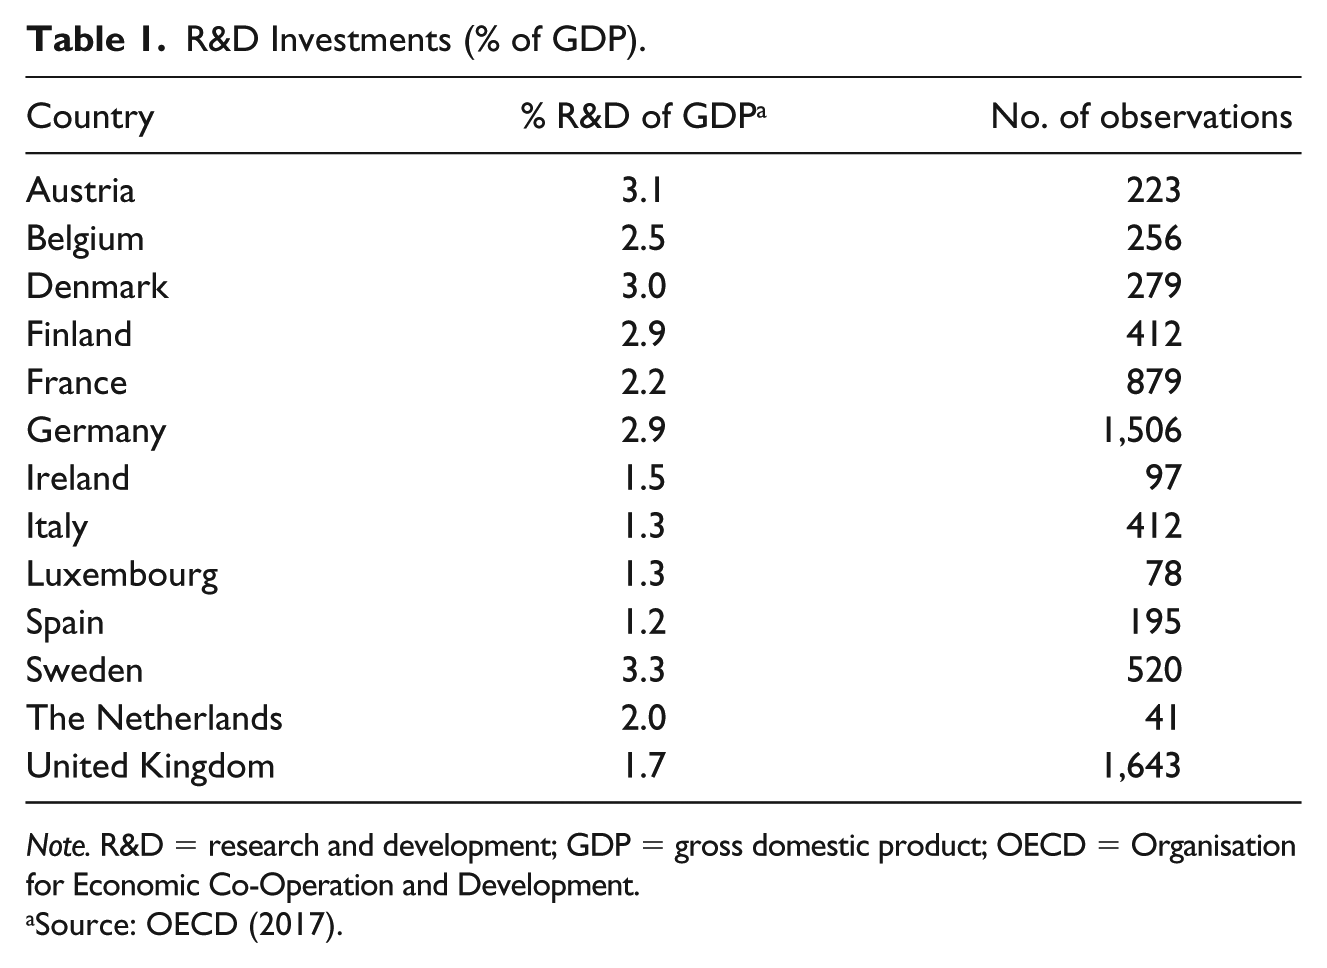
Note. R&D = research and development; GDP = gross domestic product; OECD = Organisation for Economic Co-Operation and Development.
Source: OECD (2017).
The reason for this significant investment effort is due to the fact that R&D allows firms to create new or improved technology. Hence, R&D is of great importance in businesses as the levels of competition, production, and methods are rapidly increasing. Nowadays, R&D is a core part of the modern business world. In fact, major decisions in firms are made while taking into account R&D issues.
Over the past 50 years, both the popular and academic literatures have come to consider R&D as a primary measure of innovation and technological progress for firms (Lerner & Wulf, 2007). This is because R&D is the first phase of technological innovation. It consists of obtaining new knowledge applicable to the company’s business needs, which eventually will result in new or improved products, processes, systems, or services that can increase the company’s sales and profits.
There is a circular relation among R&D investments and profitability. Investment in knowledge and skills by means of R&D may expand the technological opportunities; the increased knowledge endowment in turn enhances the profitability of entrepreneurial activity by facilitating recognition and exploitation of new business opportunities (Acs, Braunerhjelm, Audretsch, & Carlsson, 2009). Kothari, Laguerre, and Leone (2002) found that R&D investments provide tangible long-term benefits to the firm. Nevertheless, the majority of R&D projects fail to provide the expected financial results, and the successful projects must also pay for the projects that are unsuccessful or terminated early by management.
In addition, knowledge is characterized by increasing returns to scale and because of the uncertainty and the incomplete appropriability of R&D returns due to knowledge spillovers, private investment in R&D is expected to be below the optimum social level (Arrow, 1962). In this context, it is not surprising that the main justification for public intervention is the correction of these market failures (Czarnitzki & Lopes-Bento, 2013).
Many theoretical frameworks have been developed to investigate the determinants of R&D intensity: Schumpeterian Models (Schumpeter, 1961), the endogenous growth theory (Aghion & Howitt, 1999), the resource-based theory (Murovec & Prodan, 2009; Wernerfelt, 1984), among many others. However, the national culture of the country has not been widely used as an explanatory factor.
Therefore, in the present study we employ the cultural relativity theory (Hofstede, 1980, 1983) that theorizes that the specific value systems of the country can account for divergences in the types of strategies implemented by enterprises originating from different countries. Among such strategies we can include those relative to R&D issues.
The remainder of the article is structured as follows: Section 2 provides the hypotheses to be tested, Section 3 discusses the methodology of this research, including data gathering and empirical methods, Section 4 presents the results and, finally, Section 5 is devoted to exposure of the summary and conclusions.
Research Hypotheses
R&D is closely linked to innovation (Mairesse & Mohnen, 2010). Therefore, researchers usually use R&D expenditures as proxy for innovation. Moreover, the intensity of innovation depends on Technological Regime (Breschi & Malerba, 1997) described in terms of opportunity and appropriability conditions (Winter, 1987), cumulativeness of technological knowledge, nature of the relevant knowledge base (Malerba & Orsenigo, 1995), the means of knowledge transmission, and communication. All of these factors are influenced by the national culture. For example, Rosenbusch, Brinckmann, and Bausch (2011) point out that national culture has been directly related to various aspects of innovation. Examples include national differences in invention and innovation rates (Shane, 1993), cross-national product innovation diffusion (Dwyer, Mesak, & Hsu, 2005), R&D activity and productivity (Couto & Vieira, 2004), investments in innovation (Allred & Swan, 2005), and entrepreneurial technology alliance formation (Steensma, Marino, Weaver, & Dickson, 2000). Otherwise, appropriability conditions are influenced by the legal system of the country. Many researchers have found a linkage between cultural values and legal systems (e.g., Gray, 1988; Hope, 2003; La Porta & Lopez-de-Silanes, 1998). In fact, La Porta, Lopez-de-Silanes, and Shleifer (2006) legal system families and Hofstede’s (1980) regions are practically the same in Western European countries. Finally, Chen, Sun, and McQueen (2010) studied the impact of national cultures on structured knowledge transfer. They found that when a provider and recipient are located in countries with different cultures, there will be a decrease in the likelihood of successful knowledge transfer. Therefore, Laitinen (2013) concluded that cultural influences need to be taken into account when studying knowledge sharing. These results allow us to affirm that national culture probably plays a central role in the R&D investments. As Dimitratos, Petrou, Plakoyiannaki, and Johnson (2011) argue, the culture of the country in which the firm is based influences strategic decision-making processes. National culture may be a major variable likely to affect the development of cognitive and thinking styles of managers (Abramson, Keating, & Lane, 1996; Sternberg, 1997).
Hofstede’s (2001) definition of national culture as the collective mental programming of people of a particular nationality is widely used. He suggests that people share a collective national character which represents their cultural mental programming. This mental programming shapes the values, attitudes, competence, behavior, and perceptions of priority, specific to that nationality. It is easy to observe that culture cannot be easily measured as “it is largely invisible and unconscious” (Hofstede, 1980).
The original Hofstede framework consisted of four dimensions: power distance index (PDI), individualism index (IDV), uncertainty avoidance index (UAI), and masculinity index (MAS). Later, two additional dimensions were added to this framework (Hofstede, Hofstede, & Minkov, 2010): long-term orientation (LTO) and indulgence (IND). However, Minkov et al. (2018), in a recent article, provide a reconceptualization of the long-term orientation dimension and propose a new national flexibility versus monumentalism index.
Although the application of Hofstede’s model to national culture studies has been subject to criticism (Shenkar, 2001) or revised (Minkov et al., 2018), the fact is that the validity, reliability, stability, and value of Hofstede’s cultural framework has been confirmed in various studies (Tsui, Nifadkar, & Ou, 2007).
However, we expect that only certain aspects of national culture directly affect firm-level R&D investments. We have included in the section on hypotheses development, only the dimensions for which the association with the firm R&D investments has a theoretical rationale. These rationales and hypotheses are explained in the following subsections.
Power Distance
Power distance is the extent to which the less powerful members of institutions and organizations within a country expect and accept that power is distributed unequally. According to Hofstede (1994), organizations in high power distance countries centralize decision-making activities in a few hands. Cultures that are high in power distance are illustrated by decisions being made by superiors without consultation with subordinates, whereas cultures that are low in power distance, will have a more participative and egalitarian relationship between superiors and subordinates. High power distance is an obstacle to open communication, true involvement-winning contexts, and transparency of the “rules of the game.” It also inhibits employee perception of positive and exemplary behavior by management. Prior studies consistently show that high power distance inhibits adoption, diffusion, and innovation (Gaspay, Dardan, & Legorreta, 2008; Vlachogiannis, 1997).
Nevertheless, in countries whose national culture has a low PDI organizational structures are fairly decentralized with flat hierarchical pyramids and limited numbers of supervisory personnel (Hofstede, 1994). Moreover, management in low power distance countries is more likely to delegate decision-making power than in high power distance countries (Earley, 1999; Newburry & Yakova, 2006). Due to the presence of economies of scale in R&D and the existence of a necessary critical mass, R&D is often a centralized activity. Accordingly, we propose Hypothesis 1 as follows:
Uncertainty Avoidance
Uncertainty avoidance is the degree to which the members of a society feel uncomfortable with uncertainty and ambiguity. Organizations in countries with low uncertainty avoidance generally show characteristics such as promotion of innovations (Waarts & Van Everdingen, 2005), minimally formalized management, and the impulsion of innovation by rules (Hofstede, 2001). Strong uncertainty avoidance cultures are averse to risk, and this hampers the emergence of new ideas and the implementation of innovations, even more so (Gaspay et al., 2008).
R&D investments are characterized by highly uncertain payoffs (Shi, 2003). This is because the technical success of R&D cannot be guaranteed. There is always the risk that the planned performance specifications are not met, that the time for project completion be stretched out, and that the R&D and manufacturing costs be higher than forecasted. So, we expect that uncertainty avoidance will influence decision makers’ views toward the appropriateness of investing in R&D (Lewellyn & Bao, 2015).
In societies with high uncertainty avoidance, there is a preference for consistency and structure over change and uncertainty (House, Hanges, Javidan, Dorfman, & Gupta, 2004). Due to the idea that the outcomes and benefits of R&D investment are uncertain, it is logical to expect this type of investment to be lower in high uncertainty avoidance cultures. Therefore, we hypothesize the following:
Masculinity
A masculine society places greater value on success, money, and personal accomplishments, whereas a feminine society places greater emphasis on caring for others and the quality of life. In a masculine society, individuals are more aggressive, ambitious, and competitive, whereas individuals in feminine societies are more modest, humble, and nurturing (Blodgett, Bakir, & Rose, 2008). In a feminine society, managers generally use intuition as much as logical thinking to solve problems. In moderately masculine societies managers are more aggressive. Hence, we propose Hypothesis 3 as follows:
Long-Term Orientation
Long-term orientation describes how every society has to maintain some links with its own past while dealing with the challenges of the present and future. Societies prioritize these two existential goals very differently. For instance, normative societies, which have a lower score on this dimension, prefer to maintain time-honored traditions and norms while viewing societal change with suspicion, for example. On the contrary, pragmatic societies, which have a higher score, show an ability to easily adapt traditions to changing conditions which is a strong propensity to save and invest, and thriftiness and perseverance, in achieving results.
Then, as expected returns of R&D investment are obtained in the long term, we hypothesize the following:
Methodology, Sample, and Variables
Delimitation of R&D Expenses
Although accounting guidelines exist for categorizing R&D expenses, they still involve a subjective component or decision by the managers of the firm. For instance, the modification of an existing product in hope of securing a potential client might be considered R&D, while the modification of an existing product for an actual client would not likely be considered as R&D. In addition, R&D can occur in formal R&D departments or individual operational units, making the allocation decision even more subjective. R&D in smaller firms or in operational units often involves people who spend 50% of their time on research activity and 50% supporting current operations (Kleinknecht & Reijnen, 1991). By their nature, these fine distinctions between expense types appear subjective, even if they have the same impact on accounting profit. While the accounting guidelines for recognizing R&D are detailed, they appear to afford managers as substantial discretion about recording outlays as operational or R&D expenses.
This study collects and uses data from the EU Industrial R&D Scoreboard and covers the period of time between the years of 2005 and 2013. The EU Industrial R&D Scoreboard comprises data from the top 1000 R&D investing companies based in the EU in each year. Data are accessible at http://iri.jrc.ec.europa.eu/scoreboard.html.
In this article, the R&D intensity ratio was measured using the R&D investment to net sales ratio. We used the ratio form to correct the effect of firm size. According to Sasidharan, Lukose, and Komera (2015), we focus on R&D intensive firms for various reasons. First, there is an increasing interest in how innovative firms finance their investments, and innovative firms are often characterized by high R&D. Second, high R&D firms are characterized by high investment opportunities, high information asymmetry, and agency problems. Investors may interpret external capital rising (instead of relying on internal funds) as a sign of overvalued equity (or) as a signal that managers are anticipating disappointing earnings from the existing business (Myers & Majluf, 1984).
The initial database consists of 9,000 firm-year data. Countries with less than 5 firms/year were discarded. Firms with data available only for 1 year and those in years where the sales were less than 100€ million were excluded. The effective sample consists of 6,919 firm-year data of 1,517 firms in 13 countries. This sample constitutes an unbalanced panel, that is, that we have different data inclusion periods for the different companies, according to the availability of data.
Hofstede Variables
To study the cultural factors in R&D intensity, the Hofstede model has been used. As indicated above, Hofstede’s model of national culture includes six dimensions: power distance, individualism versus collectivism, uncertainty avoidance, masculinity versus femininity, long-term orientation, and indulgence versus restraint. The cultural dimensions represent independent preferences for one state of affairs over another that distinguish countries (rather than individuals) from each other.
Hofstede developed his original model as a result of using factor analysis to examine the results of a worldwide survey (116,000 questionnaires) among thousands of employees of the company International Business Machines (IBM) between 1967 and 1973. Initially, Hofstede proposed four dimensions along which cultural values could be analyzed: power distance, individualism versus collectivism, uncertainty avoidance, and masculinity–femininity. A fifth dimension (long-term orientation) was added in 1991 to distinguish the difference in thinking between the East (China) and the Western countries. The sixth dimension (indulgence vs. restraint) was added in 2010 to capture more recent research conducted around themes of happiness (Hofstede et al., 2010).
The country scores on the dimensions are relative because culture can only be used meaningfully by comparison. The data for these variables were obtained from Hofstede et al. (2010). Moreover, country scores are provided by Geert Hofstede by his Country Comparison Tool, available at https://www.hofstede-insights.com/product/compare-countries/.
Control Variables
Several control variables were considered for the research. First, we included firm size. The effect of firm size on R&D investments has been frequently studied. Schumpeter (1961) argues that large firms are relatively more innovative than small ones. Economies of scale in R&D or the existence of a necessary critical mass make research difficult for small firms. Moreover, R&D are risky investments so large firms can reduce the failure exposure (Kochhar & David, 1996). According to Fishman and Rob (1999), larger companies often have more capital with better management capabilities and, therefore, have more investments in R&D. Galende Del Canto and Suárez González (1999) also suggest that larger companies are more likely to engage in R&D. Relevant empirical results also suggest that R&D expenditures increase as the sales and number of employees increase (Lai, Lin, & Lin, 2015; Park, Jaeun, & Kim, 2010; Tsai & Wang, 2004).
Nevertheless, Holmstrom (1989) argues that, due to their existing reputation, large firms are highly risk-averse to embark on innovative activities. However, the situation is less severe in smaller firms. Therefore, prior evidence on this issue may be controversial. While some researchers found a positive relationship between R&D intensity and firm size (Kumar & Saqib, 1996), others found a negative (but weak) relationship (Comanor, 1967; Lee & Sung, 2005). Moreover, Scherer (1965) found that R&D intensity increased with firm size up to an intermediate level, and then increased only in certain industries. Size is included in our regression model to control for its potential impact on R&D intensity. Firm size is measured by the natural logarithm of the number of employees of the firm (available in the EU Industrial R&D Scoreboard at http://iri.jrc.ec.europa.eu/scoreboard.html). The square of the firm size is also included to allow the modeling of nonlinearity in the firm size-R&D intensity relationship.
In addition, previous research efforts argue that profitability is an important internal determinant factor of R&D investments. This is because R&D involves a high degree of risk and uncertainty. Then, from the internal perspective of the enterprise, it generally requires a large amount of capital and long-term financial support. Both factors are favored if the company has large profits, and profitable companies should be more prone to take financial risks relating to R&D activities (Coad & Rao, 2010; Lai et al., 2015). Nevertheless, less profitable companies could increase their R&D activity as a means to overcome profitability problems by increasing the competitive abilities of the firm. So profitability is included in the regression to control for its potential impact on the R&D intensity (available in the EU Industrial R&D Scoreboard at http://iri.jrc.ec.europa.eu/scoreboard.html).
In the empirical literature on the determinants of firm R&D effort, the capital intensity of the firm has been largely ignored. This is surprising because technological innovations are typically embodied in new machinery (embodied technological change). Furthermore, DeLong and Summers (1991) argue that countries with high capital investment rates tend to be those with high productivity growth. Aghion and Howitt (1999) extend their basic model and demonstrate how the introduction of capital in the intermediate production can establish a positive correlation between innovation and capital intensity. Capital intensity has both a positive and significant influence on R&D intensity. This finding is in line with the results of Bound, Cummins, Griliches, Hall, and Jaffe (1984), and those of Hottenrott and Peters (2011), among many others. These authors conclude that an increase in capital intensity encourages the adoption of new technologies, resulting in the increase in R&D expenditure. To sum up, it is well motivated to include capital in the analysis of firm R&D and to expect a positive correlation between firm capital intensity and R&D intensity. In this article, we used the capital expenditure (available in the EU Industrial R&D Scoreboard at http://iri.jrc.ec.europa.eu/scoreboard.html).
We also included as control variables the remaining cultural variables of the Hofstede’s framework: namely Individualism (IDV) that describes the relation between the group and the individual, and Indulgence (IND), defined as the extent to which people try to control their desires and impulses, based on the way they were raised.
Finally, there are also a number of industry characteristics that are likely to determine firm’s R&D investments, so in turn, we controlled them for the industry effect. Cohen and Klepper (1992) develop a simple model in which firm R&D intensities are determined by unobserved R&D-related capabilities that are allocated probabilistically across firms within an industry. Previous researchers show that levels of R&D intensity differ among sectors (Cohen, Levin, & Mowery, 1987). It is possible to identify medium-high R&D intensity sectors (between 2% and 5%), medium-low R&D intensity sectors (between 1% and 2%), and low R&D intensity sectors (less than 1%; Hernández et al., 2014). In this research, we identify 10 industries according to the Industry Classification Benchmark (ICB).
The Model
Having into account the considerations exposed in prior subsections, the variables we considered for our analysis are summarized in Table 2.
Variables in the Model.
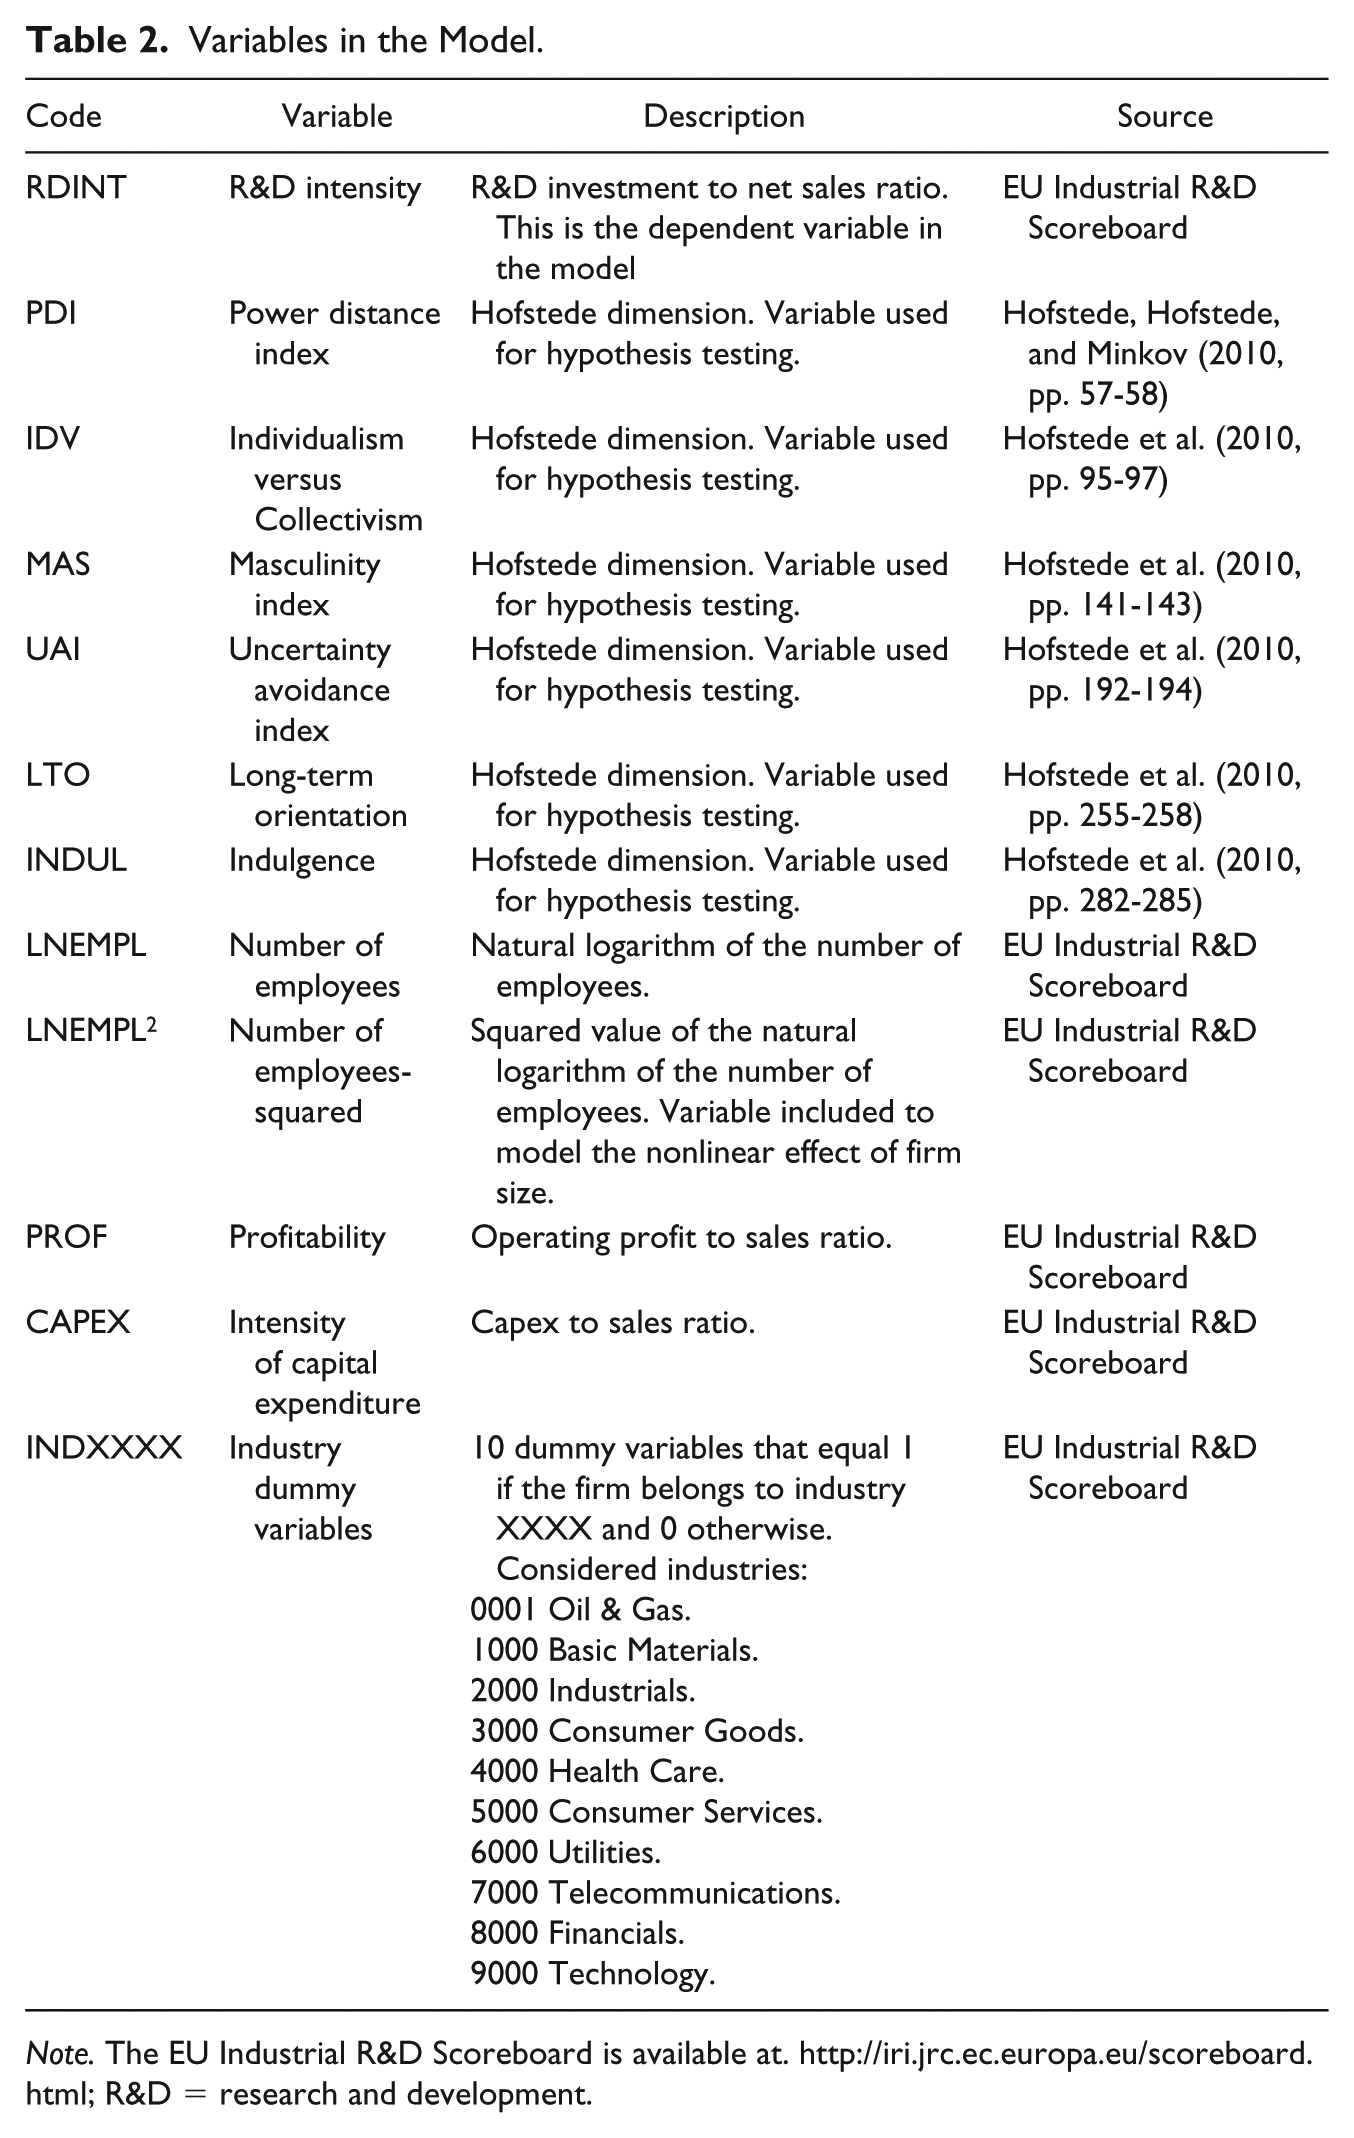
Note. The EU Industrial R&D Scoreboard is available at. http://iri.jrc.ec.europa.eu/scoreboard.html; R&D = research and development.
We estimated a panel regression model in which RDINT is the dependent variable. Hofstede scores regarding power distance, masculinity, uncertainty avoidance, and long-term orientation are the independent variables used to assess the formulated hypotheses. As previously indicated, we also included some controls in the model as independent variables, namely individualism, indulgence, the number of employees, the profitability, and the capex to sales ratio. The number of employees was entered in logarithmic form. The squared value of the logarithm of the number of employees was also included, in order to model a nonlinear effect of firm size, as explained in the section “Hofstede variables.”
We must emphasize that the variables used to assess our hypotheses (the Hofstede scores) remain invariant along the studied period, preventing us from using a fixed effects panel regression model. We estimated a random effects model, in turn.
For our analysis, we considered a final sample of 1,517 companies. The sample breakdown by industry and by countries are displayed in Tables 3 and 1 (column 2), respectively.
Sectors in the Sample.
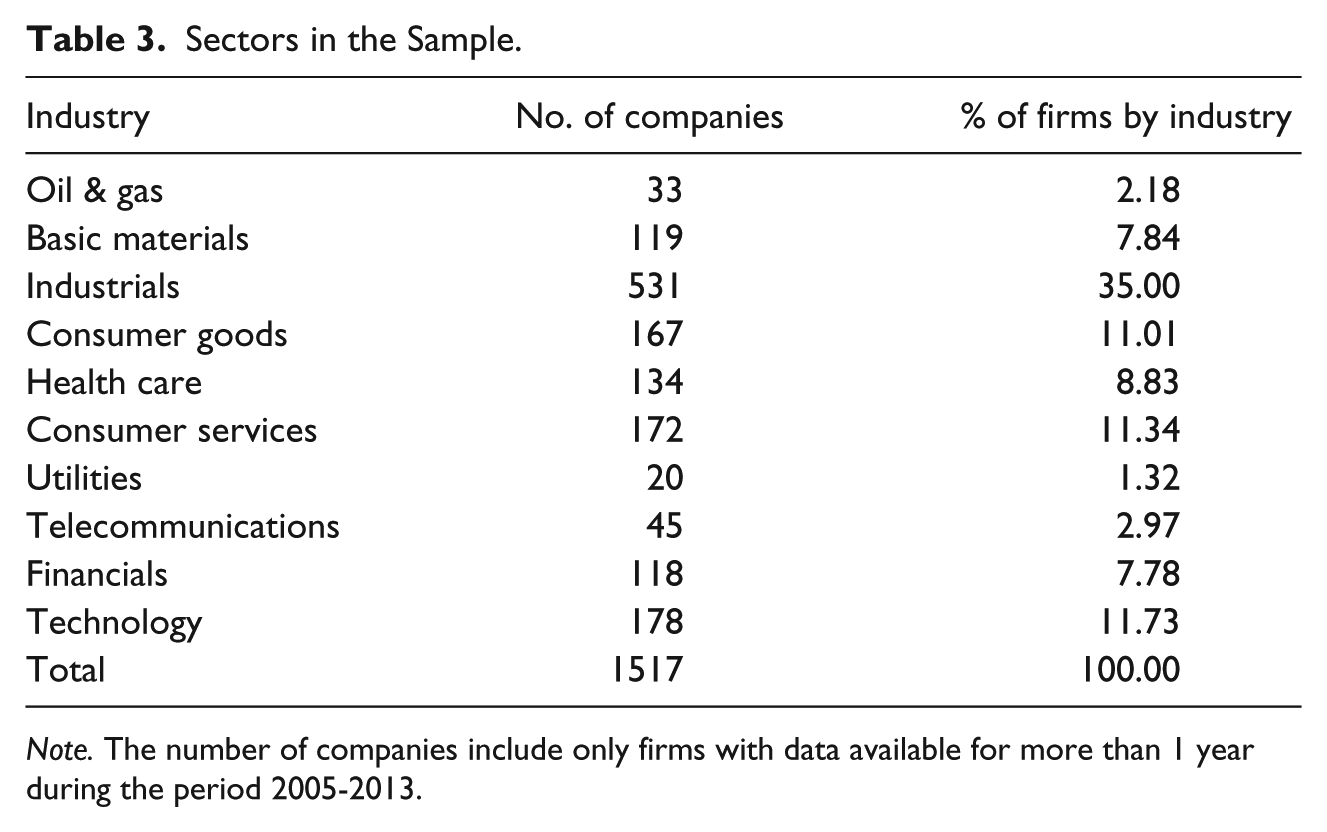
Note. The number of companies include only firms with data available for more than 1 year during the period 2005-2013.
The time span we considered for our analysis is during the years 2005 to 2013. We gathered 6,919 observations. As indicated before, for many companies, we did not have data available for one or more years. In turn, our sample is an unbalanced panel. The number of available observations by industry and year is displayed in Table 4.
Panel Breakdown by Industry and Year.
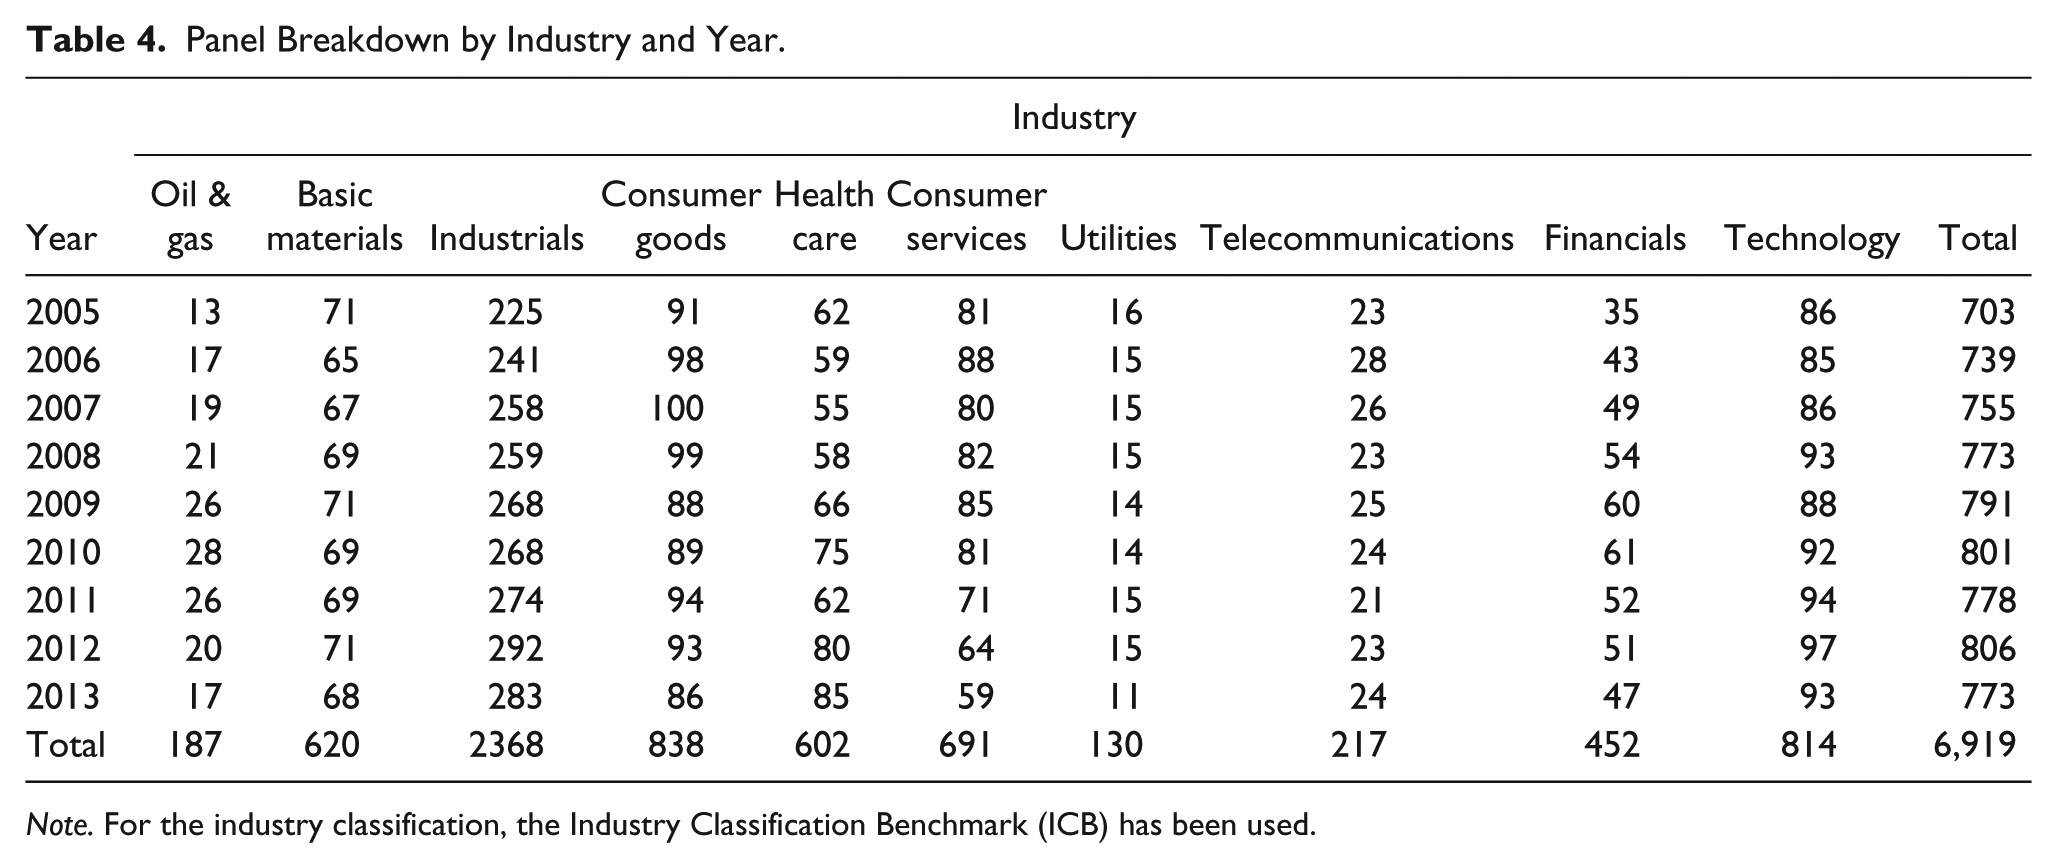
Note. For the industry classification, the Industry Classification Benchmark (ICB) has been used.
Results
Descriptive Statistics
Table 5 shows the main statistics for the variables comprising the values of each cultural index as defined by Hofstede. As indicated above, these values remain invariant along the considered time span, and this prevented us from using a fixed effects panel regression model.
Descriptive Statistics for the Culture Indices.
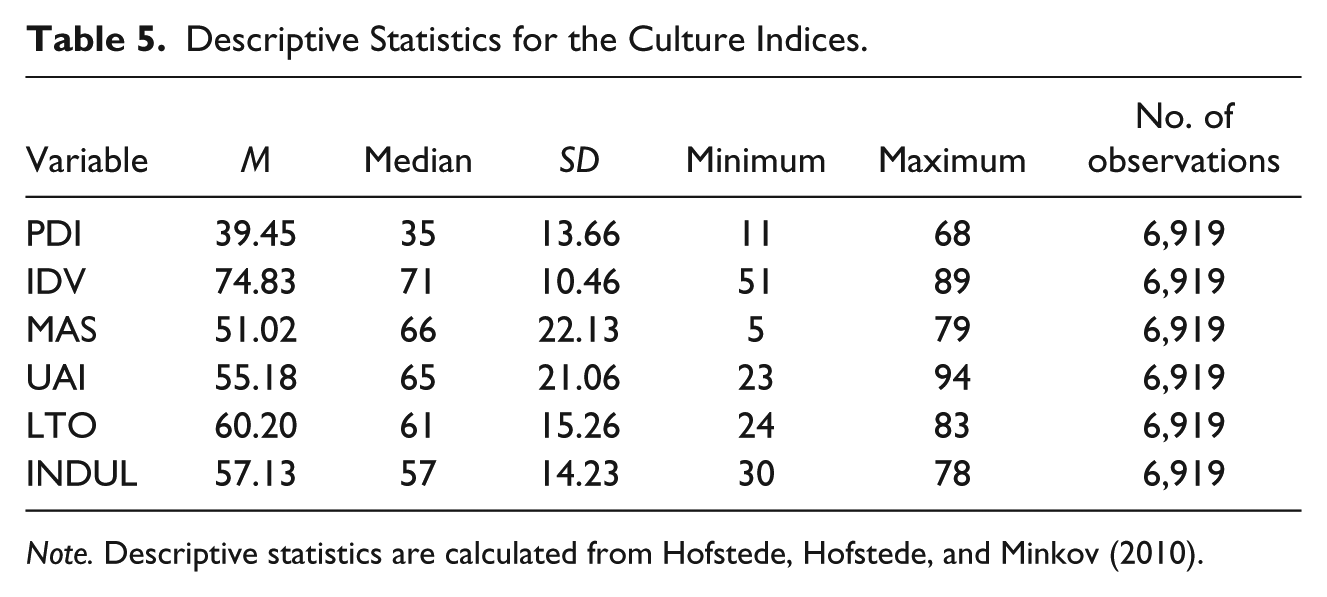
Note. Descriptive statistics are calculated from Hofstede, Hofstede, and Minkov (2010).
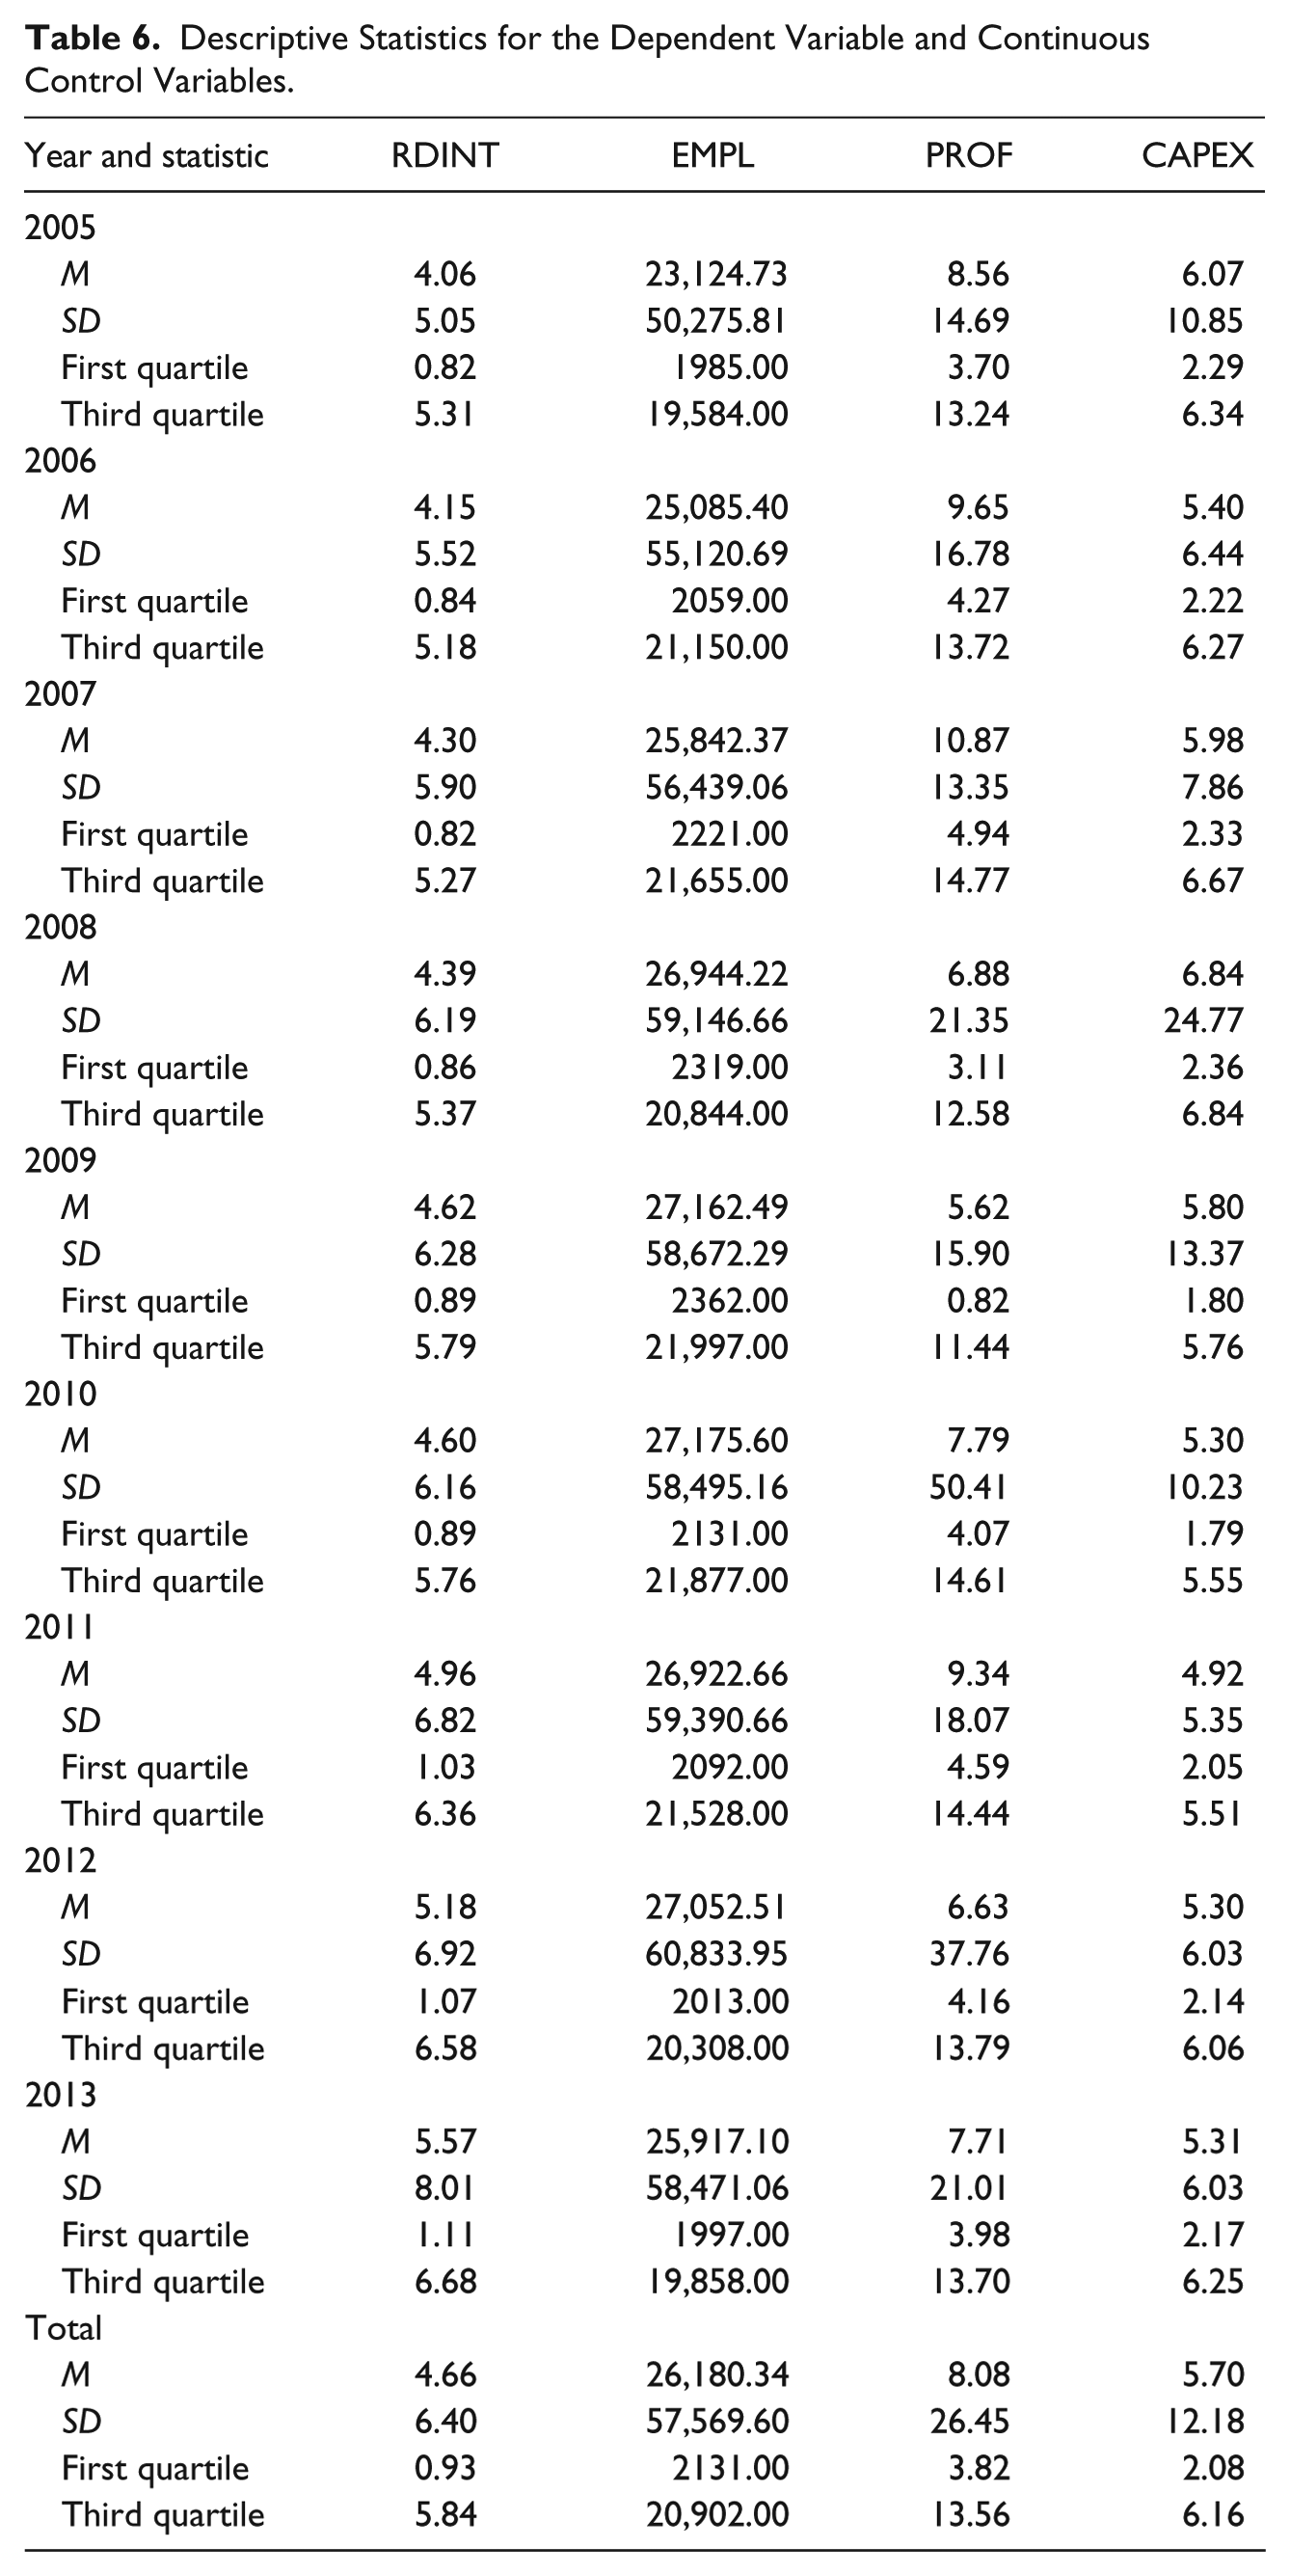
Table 6 shows the main descriptive statistics for the dependent variable in the regression model (RDINT) and the continuous control variables. For the sake of readability, statistics for the number of employees were computed prior to the transformation using natural logarithms.
Descriptive Statistics for the Dependent Variable and Continuous Control Variables.
Regression Equation
The results of the panel regression analysis are displayed in Table 7. For each of the variables in the model, we show the coefficient estimate, the standard error, and the corresponding z value. To avoid perfect collinearity, we excluded one of the industry dummy variables. We discarded the dummy for industry 2000, as this is the one that has more observations in the sample.
Results of the Panel Regression Model.
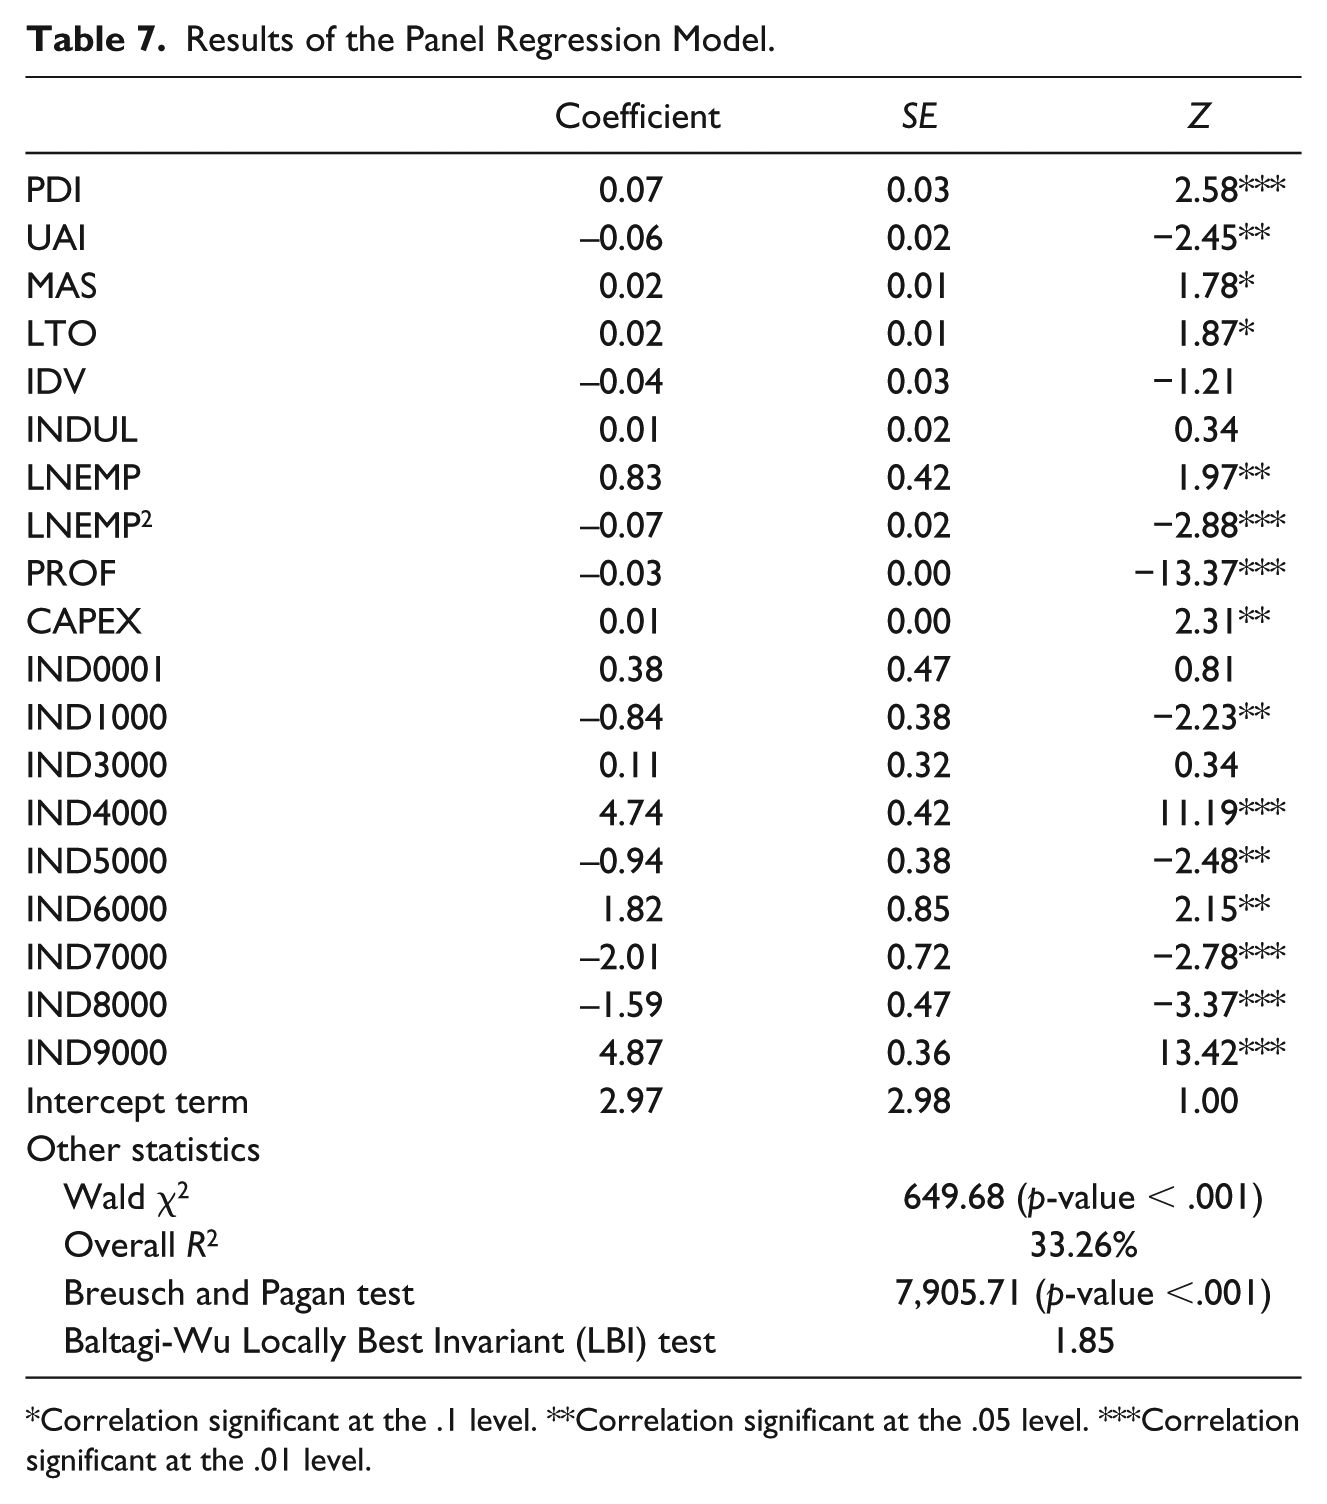
Correlation significant at the .1 level. **Correlation significant at the .05 level. ***Correlation significant at the .01 level.
We also computed some additional statistics, namely the Wald χ2 test and the overall R2 value. To assess the pertinence of estimating a random effects regression model instead of a simple ordinary least squares (OLS) regression, we conducted the Breusch and Pagan Lagrangian multiplier test. The results evidence that the panel variance is significant, and the use of the panel approach is justified. To test for autocorrelation, we used the Baltagi and Wu (1999) test statistic. This test is analogous to the Durbin–Watson statistic for unbalanced panel data. It is generally considered that autocorrelation is a concern if the statistic is below 1.50 (Evans & Schwartz, 2014). As can be seen in Table 7, the value for our model is above such threshold.
With regard to the hypotheses testing, it is evidenced that PDI has a significant and positive influence on RDINT (p < .05). Our data give support to H1. For the case of UAI, the influence is significant and negative (p < .05). Then, we can assert that our evidence strongly supports H2, and we can conclude that a low uncertainty avoidance predicts R&D activities in companies. For the case of MAS and LTO, there is only a slight evidence of a significant and positive influence (0.05 < p value < .10). This means that H3 and H4 are only partially supported, and the masculinity and long-term orientation of societies exert only a weak influence on R&D intensity of companies.
Regarding the control variables, for the Hofstede indices not included in the hypotheses modeling (IDV and INDUL) our results suggest that they do not have a significant influence on RDINT. For the case of the other control variables, firm size, as expected, seems to exert a significant and positive effect on RDINT. Such influence seems to decrease as size increases, as the coefficient of the squared size is negative. Also as expected, CAPEX has a significant and positive effect. With regard to industry dummies, most of them are significant at the usual significance levels, thus confirming the influence of sectoral ascription on the R&D activity of the firm. Nevertheless, Coad (2017) in an international study (seven global regions) found a large amount of heterogeneity in R&D intensities among firms in the same sector. The findings highlight the importance of considering the cultural factor in the R&D intensity. Finally, for the case of firm profitability its effect on RDINT is significant and negative. This suggests that less profitable companies tend to increase their R&D activity, probably as a means to overcome the problem by increasing the competitive abilities of the firm.
Other Robustness Checks
Apart from the Breusch/Pagan and Baltagi/Wu tests, we conducted a series of additional robustness checks to further assess the validity of our model. First, we repeated the estimation process using a robust estimation procedure. The main results, which are shown in Table 8, are qualitatively similar to those reported above, with a certain increase in the significance levels of the variables used to test the formulated hypotheses.
Results of the Robustness Checks.

Correlation significant at the .1 level. **Correlation significant at the .05 level. ***Correlation significant at the .01 level.
In addition, and taking into account that the dependent variable (RDINT) is positively skewed (skewness = 3.94) and leptokurtic (Kurtosis = 29.46), we controlled the influence of outliers by first removing observations above the 99% percentile of RDINT, and re-estimating the model. Results, which we also display in Table 8, are qualitatively the same (the only differences are that the significance of the coefficient for LTO increases and that of MAS decreases). Similar results were obtained when we removed both observations above 99% percentile and below 1% percentile of RDINT. The main statistics of this estimation process are shown in Table 8.
Furthermore, we must take into account that firms in the same country show the same values for the country-specific indicators. This means that the standard errors may be downward-biased. Thus, we conducted a multilevel regression model to control this effect, considering as group variables the year of the observation and the country of the firm. The results of this model are displayed in Table 8. The only differences with respect to those reported in the prior section are an increase in the significance of LTO and a decrease in the significance of MAS.
Finally, we estimated some additional models whose results we do not report due to space limitations and the lack of significant differences with respect to the results previously reported. First, we used net sales instead of the number of employees as proxy for firm size. The main results remained also unchanged. Second, we included some growth rates as additional control variables. These variables are 1-year and 3-year growth rate for R&D expenditure, 1-year and 3-year growth rate for net sales, 1-year growth rate for RDINT, and 1-year growth rate for Capex. Any of these variables proved neither to be significant nor to qualitatively modify the reported results.
Discussion and Conclusion
R&D entails a huge amount of firm resources. Therefore, the R&D intensity of the firm is a strategic decision. Although different theoretical frameworks have been used to explain the R&D intensity, there are important arguments to claim that national culture has a great influence on such decisions.
Our results clearly show the predictiveness of some of the dimensions of national culture in R&D intensity. Specifically, there is a positive linkage between power distance and R&D intensity. In addition, a positive but weak relationship is found with masculinity and long-term orientation. In contrast, uncertainty avoidance reduces the R&D intensity of the firm.
Results obtained in this research suggest that politics aiming at increasing the R&D intensity of European firms should consider national cultural features. For example, in countries with high uncertainty avoidance it might be important to promote initiatives that reduce uncertainty.
Regarding the control variables, one remarkable result we found is the positive and nonlinear (concave) effect on R&D intensity of firm size. That is, the positive effect of size decreases as firm size increases. As our sample comprised only big firms, this result may not be easily generalized to other types of companies. So, an interesting future research line is to also consider smaller firms, or to conduct a specific study for Small and Medium Enterprises. In addition, another limitation of the present research is that we only considered the firms for which R&D investment data were available. This could be considered a bias in Small and Medium Enterprises.
Finally, we must also remark that this study covers 13 European countries, so their results cannot be generalized to other regions. Therefore, it would be important to expand the number of countries and examine the linkage between R&D intensity and the dimensions of national culture in other cultural settings (e.g., Asian countries). The use of other models for the description of business/national culture is also a promising avenue of research.
Footnotes
Acknowledgements
The authors thank the comments of two anonymous reviewers and Carol R. Ember, Editor of Cross-Cultural Research. All errors that remain in the article are our exclusive responsibility.
Declaration of Conflicting Interests
The author(s) declared no potential conflicts of interest with respect to the research, authorship, and/or publication of this article.
Funding
The author(s) disclosed receipt of the following financial support for the research, authorship, and/or publication of this article: This work was supported by the Spanish Minister of Economy and Competitiveness (Grant ECO2014-52519-R).