
Abstract
When questionnaire data with an ordered polytomous response format are analyzed in the framework of item response theory using the partial credit model or the generalized partial credit model, reversed thresholds may occur. This led to the discussion of whether reversed thresholds violate model assumptions and indicate disordering of the response categories. Adams, Wu, and Wilson showed that reversed thresholds are merely a consequence of low frequencies in the categories concerned and that they do not affect the order of the rating scale. This article applies an empirical approach to elucidate the topic of reversed thresholds using data from the Revised NEO Personality Inventory as well as a simulation study. It is shown that categories differentiate between participants with different trait levels despite reversed thresholds and that category disordering can be analyzed independently of the ordering of the thresholds. Furthermore, we show that reversed thresholds often only occur in subgroups of participants. Thus, researchers should think more carefully about collapsing categories due to reversed thresholds.
Keywords
Ordered rating scales are widely used in the assessment of personality, attitudes, and other latent variables. For example, in the Revised NEO Personality Inventory (NEO-PI-R; Costa & McCrae, 1992), participants respond on a 5-point Likert-type scale with the options strongly disagree, disagree, neutral, agree, and strongly agree. Another example for an ordered rating scale is the response categories never, sometimes, often, and always. With ordered rating scales the underlying assumption is that endorsing a higher response category implies a higher trait level.
Models in the framework of item response theory (IRT) such as the Rasch model (Rasch, 1960) for dichotomous items or the partial credit model (PCM; Masters, 1982) for polytomous items define the probability of a response in a certain category as a function of the respondent’s latent trait level and item characteristics. In the Rasch model, only one item parameter is estimated, namely, the difficulty of the item. In modeling responses from ordered rating scales according to the PCM, the “difficulty” of each of the response categories needs to be taken into account. This is done using threshold parameters that are defined as the point on the latent trait continuum where the response probability for two adjacent response categories is equal. Thus, for a 5-point scale, we have four threshold parameters. To illustrate, Figure 1A shows category probability curves for an item with a 5-point scale. These curves represent the probability of endorsing each of the five categories conditional on the latent trait level depicted on the x-axis. The four thresholds are included as perpendicular lines. Threshold 1, which is the threshold between the categories strongly disagree and disagree, is located at about −2.9 logits. Thus, respondents with trait levels of exactly −2.9 have equal probabilities of endorsing strongly disagree and disagree. Respondents with trait levels below −2.9 have the highest probability of endorsing strongly disagree, whereas respondents with trait levels above −2.9 to −0.8 (where threshold 2 is located) have the highest probability of endorsing disagree. This definition and interpretation of threshold parameters also holds for extensions of the PCM to two-parameter logistic models such as the generalized PCM (GPCM; Muraki, 1992). In the Rasch model and the PCM, it is assumed that all items have the same item discrimination. Two-parameter logistic models for dichotomous or polytomous items (e.g., GPCM) relax this assumption and estimate a discrimination parameter for each item in addition to the difficulty (threshold) parameters. While most of the following discussion will focus on the one-parameter PCM, some of the analyses will also be reported for the GPCM to show that the results generalize to models with more than one parameter.

Category probability curves for Item 1 on the extraversion facet warmth.
In applications of the PCM to questionnaire data, the order of the thresholds may not correspond to the ordering of the categories in the sense that threshold parameters may not have monotonically increasing values. 1 When reversed (or disordered) thresholds occur, a common practice is to collapse the categories that correspond to the reversed thresholds. In many cases, this pertains to the middle category and the category below it. The reasoning underlying this practice appears to be that some researchers assume that when thresholds are not monotonically increasing, the interpretation that the endorsement of a higher response category indicates a higher trait level is no longer valid. For example, Rost, Carstensen, and von Davier (1999) as well as Austin, Deary, and Egan (2006) combined the categories neutral and disagree in their mixed Rasch analyses of the NEO-FFI (Costa & McCrae, 1992). Rost et al. (1999) argued that since the thresholds between disagree and neutral and between neutral and agree were reversed, the middle category neutral was chosen less often than would be expected from the trait distribution. They assumed that this indicated that neutral did not measure an intermediate trait level but instead captured a different dimension. Similarly, Nijsten, Sampogna, Chren, and Abeni (2006) reduced a five-category scale to a three-category scale by collapsing categories. Their rationale was to avoid disordered thresholds, which they argued would result in illogical response ordering. For examples of studies that retained all response categories despite the occurrence of reversed thresholds, see Eid and Rauber (2000) and Zickar, Gibby, and Robie (2004). Thus, categories are often collapsed to avoid reversed thresholds. This raises the question of whether reversed thresholds are problematic for the ordering of the response categories, justifying this practice, or whether reversed thresholds do not pose a problem and categories therefore should not be collapsed on the basis of reversed thresholds.
In the first part of this article, the PCM will be described briefly. We will outline under which circumstances reversed thresholds occur and discuss whether they affect the order of the response categories. With reference to the current debate (Adams, Wu, & Wilson, 2012; Andrich, 2005), the one-parameter PCM was chosen for this discussion, though the reasoning extends directly to the two-parameter GPCM. An extensive theoretical treatment of the reversed threshold controversy can be found in Adams et al. (2012). In the second part, empirical examples applying the PCM and its mixture extension as well as the GPCM to the NEO-PI-R will be reported. Here the trait differences between participants who chose different response categories will be analyzed. Collapsing categories requires the assumption that this is appropriate for the whole sample. We address this topic by exemplarily illustrating that reversed thresholds might occur in subgroups of participants only. In the third part, a simulation study will be presented in which the ability of a 5-point scale to discriminate between persons of different trait levels will be compared between several conditions, namely, regular response data and response data where two categories were switched. In sum, the aim of this article is to explore whether the practice of collapsing categories due to reversed thresholds is justified, both from a theoretical viewpoint regarding the measurement model and from an empirical viewpoint regarding the measurement of trait differences between participants.
Part I: The Partial Credit Model
The Measurement Model
The PCM (Masters, 1982) is a polytomous item response model that assumes ordered response categories as they exist in partial credit items (incorrect, partially correct, fully correct) or in questionnaires using unidimensional rating scales (e.g., strongly disagree to strongly agree). Masters’ approach was to develop a model in which the dichotomous Rasch model (Rasch, 1960) is applied to each pair of adjacent categories. It follows that the PCM contains m (m + 1 being the number of response categories) threshold parameters (δ ij ), instead of just one location parameter (the item difficulty) as in the Rasch model. Each threshold parameter marks a category intersection (the point on the latent trait continuum where a response in category x becomes more likely than a response in category x − 1).
The mathematical model of the PCM (see Equation 1) gives the probability that person n with latent trait level θ n will respond in category x (x = 0, 1, . . ., m) of item i. The original notation of β for the latent trait (Masters, 1988) was replaced with the customary θ.
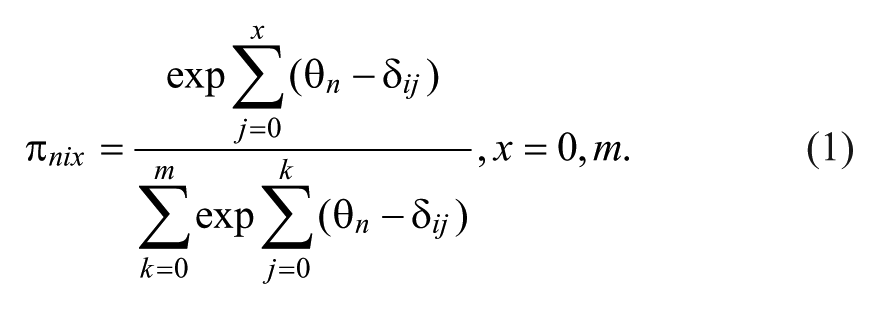
In Equation 1, δ
ij
is the parameter associated with the transition between two response categories x − 1 and x. The first term in the denominator constitutes an additional constraint that ensures that all
The Partial Credit Model and Threshold Ordering
While the PCM requires ordered response categories, it does not require that the threshold parameters be ordered as well. Masters (1988) states,
In the partial credit model . . . the item parameters δi1, δi2, . . ., δ
im
govern the transitions between adjacent response categories. Order is not incorporated through the values of these locally defined parameters, which are in fact free to take any values at all. (p. 23)
When reversed threshold parameters occur in the analysis of questionnaire data, it is often concluded that the order of the response categories is violated (Rost, 2004). In contrast, when the thresholds are ordered, the response categories are assumed to be ordered as well. Thus, sometimes it is argued that categories need to be collapsed in order to avoid reversed thresholds. Reversed thresholds are assumed to indicate that the data cannot be interpreted according to the order of the rating scale but that another dimension may have influenced responses (Rost et al., 1999). However, as demonstrated by Adams et al. (2012), the derivation of the PCM does not posit a connection between the ordering of the threshold parameters and the ordering of the response categories. Furthermore, this line of argument disregards that threshold parameters merely indicate where the likelihoods of neighboring response categories are equal. The ordering or reversal of threshold parameters does not allow any statement about the ordering of the response categories since the ordering of thresholds is dependent on category probabilities (Adams et al., 2012).
Relationship Between Category Probabilities and Threshold Ordering
To understand how reversed thresholds occur, it is important to consider the relationship between category probabilities and threshold ordering. The category probability curves in Figure 1A and B show the probability of each response category along the trait continuum for two items. These category probabilities are determined by the number of observations in each category (i.e., if more respondents endorsed a certain category, its category probability will be higher). In these figures, the threshold is the intersection point between two category probability curves (indicated by the perpendicular lines). It marks the transition from one category having a higher response probability than one adjacent response category to the next category having a higher response probability. For the first item in Figure 1A, each category has a section on the latent trait where it has the highest likelihood of being chosen among all categories. In this case, thresholds are ordered. Note that for the second item in Figure 1B, the middle category (neutral) is never, at no point along the latent trait, the most likely category. This is a consequence of the middle category having a low response frequency. The low category probability for neutral leads to the second and third thresholds being reversed. Nevertheless, people with trait levels from about −3 to +3 still have a certain probability of choosing this response option. Furthermore, the middle category’s curve is still located in between the curves for disagree and agree. Thus, despite reversed thresholds, the order of the category probability distributions along the trait continuum is preserved. In sum, whether threshold parameters will be ordered or not solely depends on the category probabilities which are estimated from the response frequencies for each category. The ordering of the PCM’s categories is independent of the ordering of the thresholds and has to be assumed prior to data analysis (Masters, 1988). For a more detailed formal treatment of the distinction between the ordering of the response categories and the ordering of the thresholds, see Adams et al. (2012).
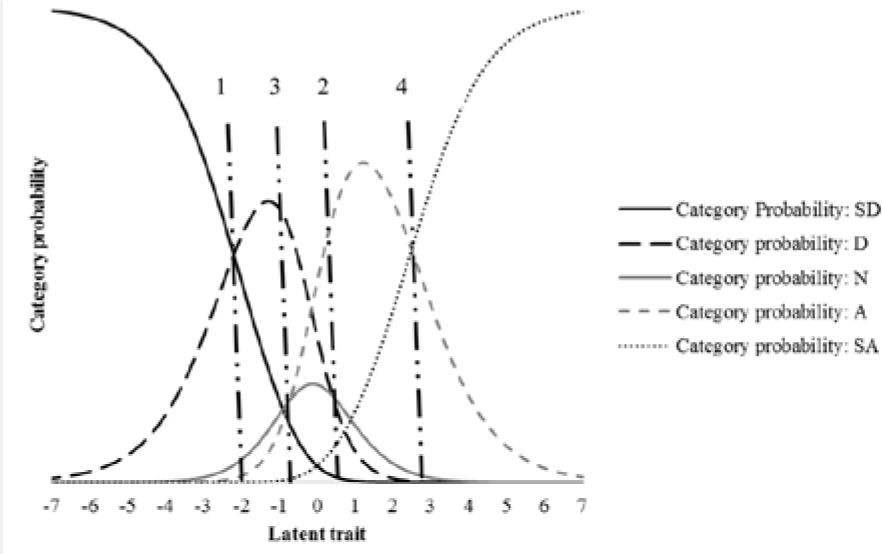
Category probability curves for Item 6 on the openness to experience facet openness to actions.
Part II: Empirical Examples From the NEO-PI-R
Using data from the NEO-PI-R, we investigated whether trait estimates derived from the PCM and the GPCM reflect the ordering of the rating scale, that is, whether persons who endorsed higher response categories received higher trait estimates, and whether trait estimates were ordered despite reversed thresholds. Furthermore, differences in trait estimates between categories were analyzed. Collapsing categories requires the assumption that this is appropriate for the complete sample. Using a mixed Rasch analysis, we examined whether reversed thresholds might occur in subgroups of participants only.
Method
Sample
The data analyzed here consisted of the German NEO-PI-R’s (nonclinical) standardization sample. In total, the data set contained 11,724 participants (64% women) with a mean age of 29.92 years (SD = 12.08). Mean sum scores on the Big Five domains were 91.11 (SD = 23.57) for neuroticism, 110.50 (SD = 19.87) for extraversion, 123.81 (SD = 19.36) for openness to experience, 112.63 (SD = 16.97) for agreeableness, and 113.90 (SD = 20.11) for conscientiousness.
Instrument
The German version of the NEO-PI-R (Ostendorf & Angleitner, 2004) was applied. The NEO-PI-R assesses the Big Five personality domains, namely, neuroticism, extraversion, openness to experience, agreeableness, and conscientiousness. In total, the NEO-PI-R contains 240 items. Each domain consists of 6 subscales (facets) that are assessed by eight items each. The NEO-PI-R’s response scale is a 5-point Likert-type scale ranging from strongly disagree to strongly agree. Cronbach’s α reliabilities for sum scores on the Big Five domains were .93 for neuroticism, .89 for extraversion, .89 for openness to experience, .87 for agreeableness, and .90 for conscientiousness.
Analyses
First, trait differences between participants who chose the different response categories were analyzed. Second, a mixed Rasch analysis was conducted to elucidate how thresholds differed between subgroups of participants.
Trait Differences
We analyzed the data using a PCM in ConQuest (Wu, Adams, Wilson, & Haldane, 2007) and a GPCM in the R (R Core Team, 2010) package mirt (Chalmers, 2012). 2 ConQuest and mirt provide weighted likelihood estimates (WLE) as one method of estimating the respondents’ standing on the latent trait. WLEs are derived by maximizing the product of the likelihood function with a weighting function to reduce the bias of unweighted maximum likelihood estimates (Warm, 1989). The WLE trait estimates can be used to compare the average trait levels of respondents who endorsed different categories. To this purpose, the WLEs of all participants who endorsed a certain category are averaged. These trait (WLE) averages are computed for each response category of every item. The difference in trait averages between categories indicates whether participants who, for example, chose neutral, on average differ in their trait level from participants who chose, for example, disagree. Furthermore, the ordering of the trait averages can be inspected. If the assumption underlying ordered response categories, that persons with higher trait levels choose higher categories, is correct, then this should be reflected in monotonically increasing trait averages from the category strongly disagree to the category strongly agree.
Mixed Rasch Analysis
Mixed Rasch models (Rost, 1991) based on the PCM were estimated using the software WINMIRA (von Davier, 2001). Mixed Rasch models assume that the Rasch model (or a generalization of it such as the PCM) holds within latent subpopulations (latent classes) of a sample, but that the model parameters differ across these latent subpopulations (Rost & von Davier, 1995). For questionnaire data, the latent subpopulations can often be interpreted as subgroups of respondents who differ systematically in their response behavior (e.g., Rost et al., 1999; Wetzel, Carstensen, & Böhnke, 2013). The mixture generalization of the PCM (mixed PCM) differs from Master’s PCM in that all parameters are estimated separately within each of the latent classes. Thus, item (threshold) parameters and trait estimates are class-specific. Otherwise, it has exactly the same properties as the original PCM described above. To investigate whether reversed thresholds only pertain to a subsample of the participants, the mixed PCM was estimated with one to six classes. The appropriate number of classes was determined using the Consistent Akaike’s Information Criterion (CAIC; Bozdogan, 1987). For this final number of classes, it will be examined in which classes reversed thresholds occurred.
Results
Trait Differences
In Table 1, category frequencies, trait averages for each category resulting from the PCM and the GPCM, as well as the difference between trait averages for adjacent categories are depicted for the eight items on the facet openness to actions. Category frequencies show that neutral was chosen by many participants to indicate their standing on the item. In fact, at least for this facet, it was never the least frequent option. The differences in trait averages between categories ranged from .23 (p < .001; Item 3) to .68 logits (p < .001; Items 5 and 8) for the PCM (.40 to 1.44 for the GPCM). In the present context, the difference between disagree and neutral is the most interesting since responses in these categories might be collapsed by researchers when the second and third thresholds are reversed (which was the case for all items on the facet except item 2). For openness to actions the difference ranged from .30 (p < .001; Item 6) to .46 logits (p < .001; Item 5) with a mean of .36 (SD = 0.05) for the PCM and from .43 (Item 6) to .89 (Item 5) with a mean of .63 (SD = 0.15) for the GPCM. Thus, the difference in trait averages for these two categories is comparable to the difference between other categories and not of a negligible size. In fact, the mean difference in trait averages between disagree and neutral computed over all of the NEO-PI-R’s 240 items for the PCM was .42 logits with the 5th percentile at .23 logits and the 95th percentile at .61 logits.
Response Category Frequencies, Trait Averages, and Differences in Trait Averages Between Categories, Facet Openness to Actions.

Note. SD = strongly disagree; D = disagree; N = neutral; A = agree; SA = strongly agree. Trait averages were estimated using weighted likelihood estimates.
All trait average differences are significant at the .001 level. For the GPCM, significance tests could not be computed due to software restrictions.
Furthermore, trait averages increased monotonically from one category to the next for all items in Table 1. Considering the whole NEO-PI-R, 164 items (68%) had reversed second and third thresholds. However, there were only eight items where trait averages derived from the PCM were not ordered concerning the categories strongly disagree and disagree and in two cases additionally concerning neutral. This implies that people who chose higher response categories on average received higher trait estimates than people who chose lower response categories, irrespective of threshold ordering. Trait averages for the middle category lay between the trait averages for disagree and agree. Thus, the middle category neutral appeared to measure an intermediate trait level.
Mixed Rasch Analysis
The mixture generalization of the PCM was estimated for openness to actions for one to six latent classes. Openness to actions yielded a four-class solution according to the CAIC. Class sizes ranged from 32% to 20%. Figure 2 shows the threshold parameters for the first and second latent class of the facet openness to actions. Note that the second and third thresholds were only reversed in Class 2, whereas they were ordered in Class 1. This indicates that reversed thresholds are not a phenomenon that bears on the complete sample but instead they often only occur in subsamples. In this case, the reason for this difference in threshold parameters between the classes appears to be systematic differences in response scale use. Class 1 (Figure 2A) consisted of participants who preferred the options disagree and agree since the first and fourth thresholds were very far apart. Thus, respondents in this class would need a very low or very high trait level for strongly disagree or strongly agree to be the response option with the highest probability for them (e.g., for Item 3 below −2.75 or above 4.40, respectively). Class 2 also contained respondents who preferred moderate categories, but, in contrast to Class 1, the participants allocated to this class appeared to use the middle category neutral very rarely since the second and third thresholds were reversed and widely spaced (Figure 2B). This is confirmed by the low category probabilities for neutral in Class 2 (M = 0.15, SD = 0.06) compared with Class 1 (M = 0.36, SD = 0.06) across the eight items on openness to actions. Thus, in this case subsamples with and without reversed thresholds are characterized by a differential use of the middle category.
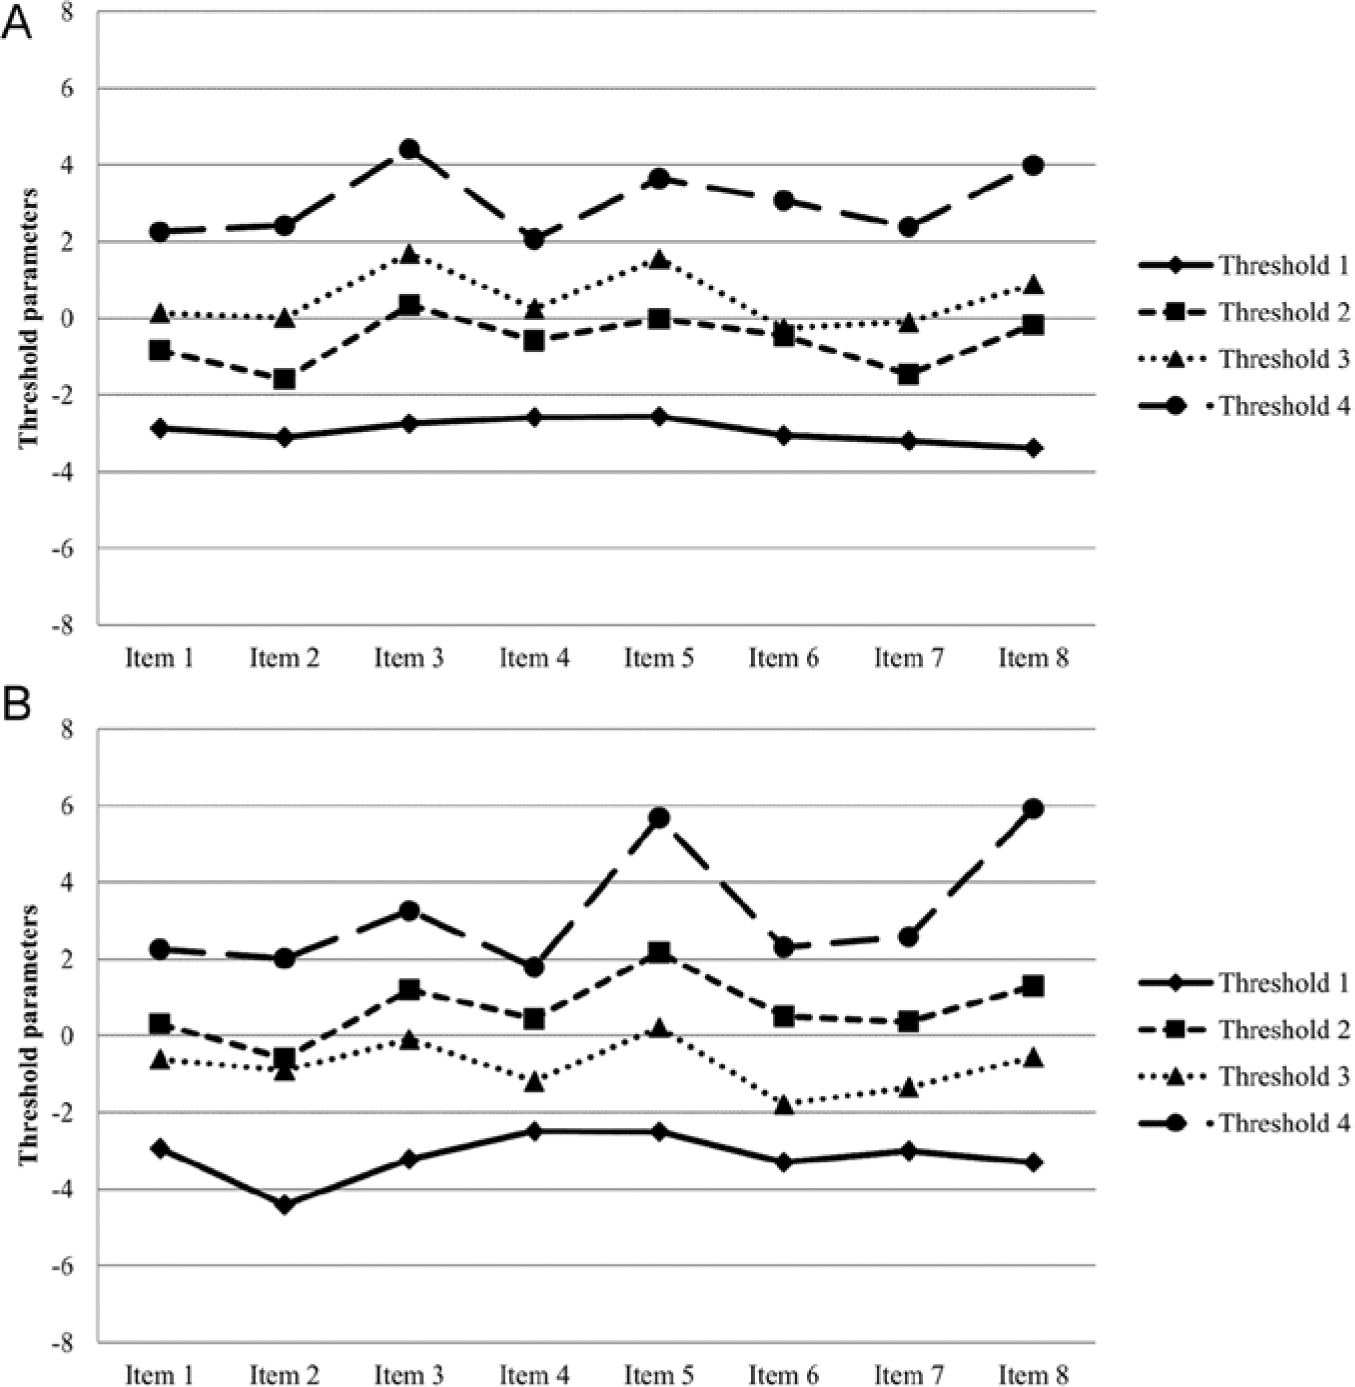
(A) Threshold parameters for Class 1 (32%) on the facet openness to actions. (B) Threshold parameters for Class 2 (24%) on the facet openness to actions.
Importantly, as shown exemplarily for openness to actions, for most NEO-PI-R facets one or more classes emerged in which thresholds were ordered. For the openness facets the size of these classes ranged from 11% to 46%. For a complete treatment of the results of an analysis of the NEO-PI-R using mixed PCMs, see Wetzel, Böhnke, Carstensen, Ziegler, and Ostendorf (2013).
Part III: Simulation Study
The aim of the simulation study presented here was to investigate how disordered response data affect parameter estimates in the PCM. The PCM assumes that the response data are ordered, and hence, it cannot be tested empirically whether the data are ordered using the PCM. Nevertheless, disordered categories can be detected in the PCM results. We examined how disordered categories influence the distribution of trait estimates and the ability of the response categories to differentiate between participants of different trait levels. We varied the disordering of the categories in two degrees: (a) disordered response categories for one item and (b) disordered response categories for all items in a scale.
Method
Response data based on the PCM were simulated using R. The data were generated according to the specifications of the NEO-PI-R instrument (eight items per facet with a 5-point rating scale). The threshold parameters for the facet altruism derived from the analyses of the NEO-PI-R standardization sample were used as generating values. The reason for choosing altruism was that the second and third thresholds were reversed for exactly half of the items (four out of eight), making it an ideal facet for illustrating issues related to reversed thresholds and category disordering. In a first step, normally distributed random values for the latent traits were generated for a sample of 5,000. Second, probabilities for a response in each of the five response categories were computed according to the PCM using the generated latent traits and the pre-specified threshold parameters. Then, cumulated probabilities for the response categories were calculated. Next, uniformly distributed random numbers were generated and compared with the cumulated probabilities to determine the responses for the 5,000 people. In total, 100 data sets were generated in this manner.
Last, for each replication, two additional data sets with category disordering were created by switching the responses from the second and third category (disagree and neutral). In one data set, responses were switched for the last item of the scale, and in the second data set, they were switched for all items. Parameters of the PCM were estimated using ConQuest for all three conditions (regular, last item recoded, and all items recoded) and replications. For each condition, the averages of the trait estimates (again using WLEs) in each category were inspected regarding their ordering and differences between response categories. Moreover, item discriminations as well as the estimated trait variance from the three conditions were analyzed.
Results
Trait averages were ordered from strongly disagree to strongly agree for all items in the regular data (no disordering) across all 100 replications. For differing degrees of disorder in the data, trait averages for disagree and neutral were reversed correspondingly, either only for the last item or for all items. The mean differences in trait averages between disagree and neutral across the 100 replications are shown in Table 2. On average, they were larger for the regular data sets compared with the recoded ones, though most notably compared with the data set where all items had recoded categories. Across 100 replications, the regular data sets yielded differences in trait averages between .63 and .77 logits, whereas the completely recoded data sets yielded trait average differences between −.12 and −.20 logits. Thus, with switched responses from the second and third categories, trait levels were estimated to be reversed as well as to differ less between categories compared with the original responses. Note that this is the case independently of the ordering of the thresholds since thresholds were ordered for four items while the other four items had reversed thresholds.
Mean Differences in Trait Averages Between the Neutral and Disagree Categories and Item Discriminations Across 100 Replications, Data Generated According to the Three Conditions.
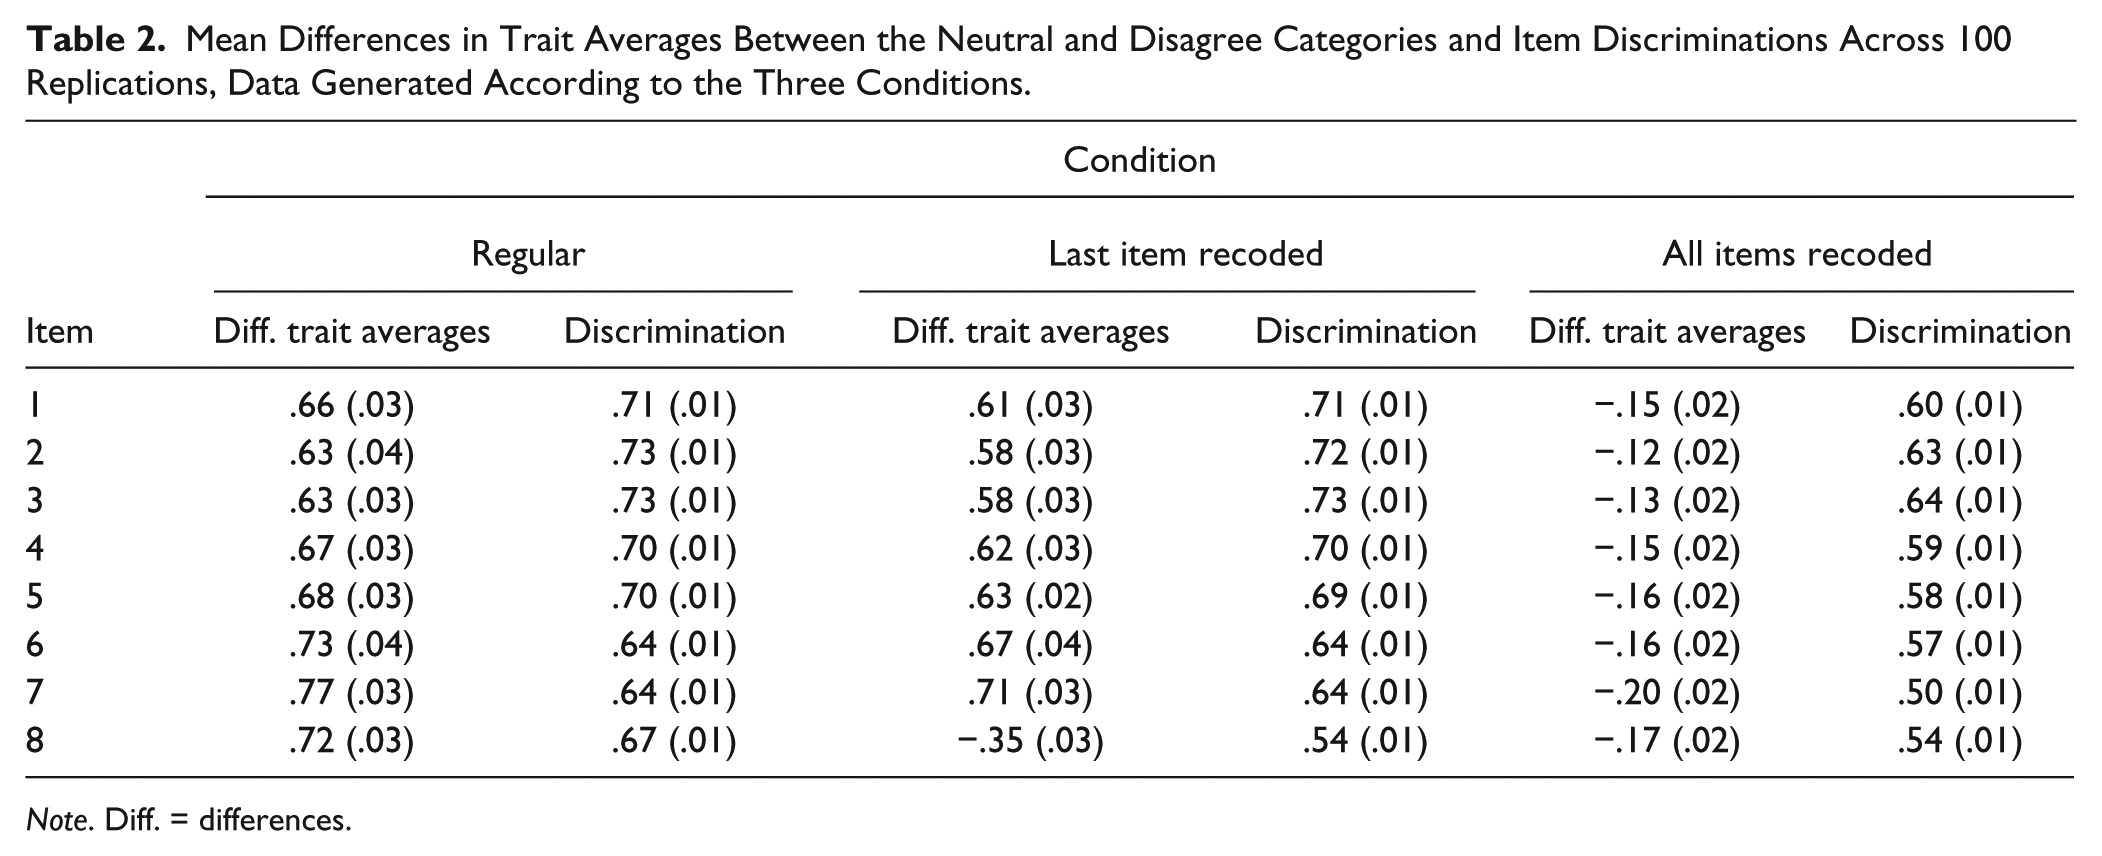
Note. Diff. = differences.
As depicted in Table 2, discriminations decreased for items where categories were disordered. However, the more items had reversed categories the smaller item discriminations got for the other items in the scale as well. The effect was small if one item had reversed categories and it was large if all items had reversed categories. Consistently, the variances of the scales decreased as well, from 1.02 for the regular data sets, to 0.88 when the last item was recoded and to 0.40 when all items were recoded. Thus, the ability of the items to differentiate between different trait levels was diminished when responses to the second and third categories were switched.
General Discussion
This article investigated whether reversed thresholds in the PCM pose a problem in data analysis and whether the practice of collapsing categories might be an appropriate treatment of items with reversed thresholds. Our arguments included a theoretical perspective related to the measurement model and an empirical perspective related to the measurement of trait differences. Theoretically, in the framework of the PCM (Masters, 1982) as well as its mixture extensions (Rost, 1991) or two-parameter extensions (GPCM; Muraki, 1992), there is no reason to assume why thresholds would have to be ordered. Adams et al. (2012) showed this within several different fundamental derivations of the PCM. Reversed thresholds were shown to be a consequence of (at least) one category not being the most likely category along the trait continuum. Thus, whether threshold parameters are ordered or disordered depends solely on the number of respondents endorsing each response category. The occurrence of reversed thresholds does not imply that the order of the response categories is violated. This is supported empirically by the monotonically increasing trait averages which indicate that the mean trait estimates for each response category are still ordered along the trait continuum. Thus, the interpretation that the endorsement of a higher response category indicates a higher level of the latent trait is still valid in spite of reversed thresholds. Also, considering model fit, items can still function well when reversed thresholds occur (Adams et al., 2012).
Participants who choose different response categories differ strongly in their trait levels as seen in the trait averages (using WLEs) for the five response categories. This was the case for the categories neutral and disagree in the standardization sample of the NEO-PI-R as well as in the simulation study. Furthermore, as described in the mixed Rasch analysis, thresholds are often only reversed for a subgroup of participants and not for the whole sample. When categories are combined, in essence, respondents are treated as if they expressed the same trait level and researchers analyze data as if participants responded to a rating scale with a reduced number of categories. This assumption can hardly be supported by empirical evidence. Considering the large estimated trait level differences between these categories, collapsing categories is not justified.
Since reversed thresholds and the collapsing of categories often pertain to the middle category, this raises the question how our results tie into the debate surrounding the utility of a middle response category (e.g., Dubois & Burns, 1975). 3 One concern often voiced with respect to the middle category is that respondents who endorse the middle category might do so for other reasons than a moderate standing on the trait such as not wanting to disclose information. Our analyses of trait averages indicated that the middle category measures an intermediate trait level. However, this does not mean that concerns regarding the middle category are unfounded. Our mixed Rasch analyses resulted in two classes that clearly differed systematically in their use of the middle category. One of these classes had ordered thresholds and the other had reversed thresholds (see also Hernández, Drasgow, & González-Romá, 2004). In this case, collapsing the middle category with another category as advocated, for example, by Rost et al. (1999) does not solve the problem but only mixes respondents who chose the middle category for other reasons with “regular” responders who endorsed the middle category because it accurately reflects their standing on the latent trait, thereby deteriorating trait estimation for these respondents.
Furthermore, the estimation of trait levels in the PCM cannot differentiate between respondents who endorsed the middle category because they really have an intermediate trait level and respondents who did so for other reasons. That is, participants who chose the middle category because they did not understand the items, did not want to respond, or other reasons will also receive intermediate trait estimates, independently of whether this reflects their trait level accurately. As shown by Dantlgraber (2011), using a scale without a middle category leads to a much smaller percentage of items with reversed thresholds compared with a scale with a middle category (7% vs. 62%). Thus, we would argue that if it is a researcher’s goal to avoid reversed thresholds which may result from systematic differences in using the middle category, it would be preferable to use a response scale without a middle category from the start (perhaps combined with providing a no response option that is presented separately from the rating scale) as opposed to collapsing categories afterwards.
As shown in the simulation study, in the PCM, the averages of the trait estimates (WLEs) for an ordered rating scale are not always ordered. Instead, the PCM estimates the trait averages corresponding to the disordered responses to be reversed. Hence, whether the trait averages per category are ordered along the latent trait can be understood as a property of the data. It follows that if the response categories are disordered this can be detected using the participants’ trait estimates. As was also evident in the simulation study, when responses to the second and third categories were switched for all items, trait averages were closer together and items discriminated less compared with ordered response data. In addition, the trait variance was strongly reduced when the categories of many items were reversed. In sum, reduced item discriminations may hint to reversed categories and a reduced scale discrimination may be due to reversed categories in a number of items on the scale.
The rationale behind using ordered rating scales in questionnaires is usually that more response categories are assumed to provide more information about the participants’ standing on the construct being measured than, for example, a dichotomous True–False scale could (Masters, 1988). Considering the large differences between trait averages for the five response categories, this is indeed the case. Collapsing categories counteracts the goal of measuring the latent trait as accurately as possible because it leads to a loss of trait information.
Limitations of this study include that only one type of disorder in the data (namely reversed categories) was simulated. Further research could investigate the impact of different types of disordered data. Moreover, our analyses were empirical examples for questionnaire data similar to the NEO-PI-R. Nevertheless, it was clear in these examples that reversed thresholds do not impair measurement. This study focused on one class of widely used IRT models for analyzing questionnaire data, namely, the PCM and the GPCM. Of course, there are also numerous other models that could be applied, such as the rating scale model (Andrich, 1978), which assumes uniformly distributed thresholds across items. 4
The present study assumed the use of an existing and validated measure such as the NEO-PI-R. In the development of a new questionnaire, IRT modeling might be used to analyze item properties. If reversed thresholds show that one or more response categories are not being endorsed as frequently as expected and the rating scale is therefore not being used as intended, this could indicate that it might be necessary to revise items or consider using a different rating scale if this is the case for many items. For example, with a 7-point rating scale, reversed thresholds may indicate that it is difficult for respondents to differentiate between all response options, leading to an uneven distribution of responses across the options. In this case, a rating scale with fewer categories might be more adequate. Furthermore, reversed thresholds may also indicate that the assumption of equal item discriminations made by the PCM does not hold and that a two-parameter model might provide a better fit to the data. Therefore, reversed thresholds may allude to misfitting items or problems with the response scale. However, categories should not be collapsed solely based on the occurrence of reversed thresholds.
In sum, the PCM does not assume ordered threshold parameters, and the order of the response categories is preserved even when reversed thresholds occur. Researchers should think more carefully about collapsing categories since valuable trait information is lost.
Footnotes
Authors’ Note
Eunike Wetzel is now at the University of Konstanz, Germany. A previous draft of the manuscript is part of the first author’s dissertation.
Declaration of Conflicting Interests
The authors declared no potential conflicts of interest with respect to the research, authorship, and/or publication of this article.
Funding
The authors received no financial support for the research, authorship, and/or publication of this article.