
Abstract
This study examines how drug market activities place children at risk of maltreatment over space and time. Data were collected for 95 Census tracts in Sacramento, California, over 7 years and were analyzed using Bayesian space–time models. Referrals for child maltreatment investigations were less likely to occur in places where current drug market activity was present. However, past-year local and spatially lagged drugs sales were positively related to referrals. After the investigative phase, Census tracts with more drug sales had higher numbers of substantiations, and those with more possessions also had more entries into foster care. The temporal delay between drug sales and child maltreatment referrals may indicate that the surveillance systems designed to protect children may not be responsive to changing neighborhood conditions or be indicative of the time it takes for the detrimental effects of the drug use to appear.
Certain aspects of drug market activity appear to be positively related to rates of child maltreatment (Albert & Barth, 1996; Freisthler, Needell, & Gruenewald, 2005; Freisthler & Weiss, 2008). Freisthler and colleagues found that drug possession incidents in Census block groups were related to higher rates of substantiated reports of child maltreatment controlling for other Census-based indicators of social disorganization (Freisthler, Needell, & Gruenewald, 2005). Increases in drug arrests at the county level were related to increases of referrals to Child Protective Services (CPS) from 1998 to 2001 (Freisthler & Weiss, 2008). Likewise, drug arrests for women were positively related to rates of maltreatment in urban and rural counties in California over time (Albert & Barth, 1996).
Why Study Drug Market Activities and Child Maltreatment?
Drug market activities may exhibit a distinct effect on rates of child maltreatment through various mechanisms including neighborhood disadvantage or increased availability. Increased drug activity may exacerbate child maltreatment in areas with high levels of concentrated disadvantage (i.e., poverty) or social disorganization (Sampson, Raudenbush, & Earls, 1997) by disrupting social ties, networks, and support in these areas. In this case, these drug sellers may choose these areas as they provide attractive conditions to conducting business where residents are less likely to intervene (LaScala, Freisthler, & Gruenewald, 2005). This may accelerate the risk of maltreatment through a breakdown of neighborhood infrastructure that brings into the neighborhood nonresident individuals prone to participating in criminal activities (Alaniz, Cartmill, & Parker, 1998). Thus the presence of visible drug markets may bring increased traffic from outsiders and concentration of illicit and violent activities. As a result, visible drug markets are likely to leave a distinct ecological mark in local areas upon family functioning through increased rates of maltreatment. In this case, rates of drug sales within neighborhoods would be related to increased rates of child maltreatment.
However, another mechanism by which drug activity may affect maltreatment is through drug use. According to availability theory, increased access to substances (through more drug market activities) may make it easier to obtain and use illicit substances (Freisthler, Gruenewald, Remer, Lery, & Needell, 2007). One would expect to see a distinct, but different spatial relationship between drug sales and maltreatment. Here drug sales may not be related to child maltreatment in the same area but in adjacent areas as the drugs are spread from their source (the sellers) to the customers (Freisthler, Needell, & Gruenewald, 2005; Freisthler, Gruenewald, Johnson, Treno, & LaScala, 2005). Furthermore, other aspects of the drug market (i.e., drug possessions) may be a better indicator of where drug using populations are located. In this case, drug possessions may be related to rates of maltreatment in the local (as opposed to spatially adjacent) area. Previous work has found that as the number of arrests for drug crimes to women increases, the rates of entries into foster care also increases (Albert & Barth, 1996) and increases in total drug arrests is related to higher rates of referrals to CPS (Freisthler & Weiss, 2008). These drug crimes may be more likely to occur among individuals who are using and/or dependent on drugs. However, as these populations are arrested and jailed, drug markets may move to new areas to find new locations with “uninfected” populations to whom they can sell drugs. Given that it takes time between the appearance of these drug markets and drug abuse or dependence to develop, there may be a temporal lag between drug possessions and entry into the child welfare system.
Finally, developing a greater understanding of the spatial patterning of drug markets and rates of maltreatment might serve as an early detection system for child welfare practitioners, similar to those systems developed for infectious disease control. To the extent that drug distribution systems are related to or a precursor of child maltreatment, knowing the locations of these activities may provide an opportunity to implement prevention activities in populations prone to drug abuse or dependence in an attempt to reduce future maltreatment. In order to understand how indicators of drug market activities may be related to maltreatment, the characteristics of these drug markets need to be explicated.
Characteristics of Drug Markets
Drug market activities are a function of both supply and demand. Each of these two aspects of the drug market is likely to be differentially related to rates of maltreatment (Gruenewald, 2011). For example, drug sales (a measure of drug market supply) occur in locations that are characterized by specific environmental contexts including concentrated disadvantage and large populations of minority residents (Freisthler, LaScala, et al., 2005; Saxe et al., 2001). These locations are often not the same as where drug possessions (a proxy for demand of illicit drugs) or drug use and dependency occur (Saxe et al., 2001).
In general, visible drug market activities have been demonstrated to be geographically clustered with distinct rise and fall patterns over time (Gruenewald, Johnson, Ponicki, Remer, & LaScala, 2010; Petronis & Anthony, 2003; Weisburd & Mazerolle, 2000). These spatial aspects (i.e., local vs. spatially adjacent effects) of visible drug sales have been studied with respect to drug use and social problems other than child maltreatment but may bear upon the relationships described above. For example, in one study, visible drug sales were not related to drug use within the same area, but drug sales that occurred in adjacent areas were related to local drug use (Freisthler, Gruenewald, et al., 2005) suggesting that some drug users must travel outside their own neighborhood areas to procure drugs for use. Thus, individuals may purchase drugs near their home but not necessarily within the same neighborhood in which they live (i.e., one or two “neighborhoods” away; Ford & Beveridge, 2004). Areas with higher number of drug sales or drug crimes have higher numbers of assaults (Banerjee et al., 2008; Gorman, Zhu, & Horel, 2005) and other crime (Ford & Beveridge, 2006). Thus, distributions of drug use (more indicative of police drug possession incidents) and drug sales have distinct and separate spatial patterns which may differentially be related to child maltreatment.
Knowing specifically how drug markets are related to social problems (e.g., child maltreatment, violence, drug abuse, and dependence) remains elusive, as these problems are often not seen until after the markets themselves have been disbanded (LaScala et al., 2005). Thus studying the timing of when drug markets appear and subsequent development of problems, such as child maltreatment, can provide important information in the prevention of these problems.
Study Aims
The current study is not able to ascertain the exact mechanism that may affect the drug market–child maltreatment link; however, it does take a first step toward determining whether temporal or spatial relationships exist between drug market activity and child maltreatment at the Census tract level. That is, are changes in drug market activity (drug sales and drug possessions) over a 7-year time period associated with changes in rates of child maltreatment? This question will be answered through assessing the relationship between official reports of child maltreatment and (1) drug market activities in the same local area, (2) drug market activities in spatially adjacent areas, and (3) drug market activities from the previous year in both local and spatially adjacent areas. Given the known characteristics of drug markets and the previous findings, we hypothesize that current drug possessions will be positively related to current maltreatment, particularly for foster care entries as they are likely to be markers for problematic drug use. To the extent that drug sales are related to weakened neighborhood structure, we hypothesize that local current and past-year drug sales will be related to more maltreatment. If the primary mechanism through which drug markets affect maltreatment is through drug use, we expect to find that sales in spatially adjacent areas and in current and previous years will be related to maltreatment.
Method
Study Design
Data were collected for 95 Census tracts in Sacramento, California, over 7 years (2002–2008). These represent all Census tracts that have their centroid located within the city of Sacramento. An ecological panel design was used to analyze the data with a final sample size of 665 spatial units (95 Census tracts × 7 years). Panel designs are used when there are relatively few time points and more variables than in a traditional longitudinal design. Ecological refers to the fact that the unit of analysis are areal units (Census tracts), not individuals. Census tracts were chosen as the geographic unit of analysis as they approximately represent neighborhood areas. On average, Census tracts have approximately 4,000 residents and 1,500 households (US Census Bureau, 1994).
Measures
The dependent variable, child maltreatment, was measured using official data on referrals for investigations by CPS, substantiated reports, and entries into foster care. These three measures can be loosely considered as a continuum of harm due to child maltreatment. A referral for a child maltreatment investigation is usually initiated by a professional (i.e. medical doctor, teacher), family member, neighbor, or friend if abuse or neglect is suspected. If the CPS worker who investigates the case believes there is enough evidence to show the maltreatment occurred, the referral is substantiated (Simpson, Imrey, Geling, & Butkus, 2000). If the allegation of maltreatment was deemed severe enough or if the child was considered at continued risk of immediate harm, the investigating worker can remove the child from the home and place him or her into foster care. As such, these three outcomes are nested within each other. The number of substantiations is a function of the number and type of referrals of allegations needing investigation and the number of children who enter foster care is a function of the number and severity of substantiated cases.
These data were obtained from the Center for Social Services at the University of California, Berkeley (http://cssr.berkeley.edu/ucb_childwelfare/), which is contracted by the California Department of Social Services to maintain and archive all the data on child maltreatment allegations for the state of California. Data were obtained from two different databases: the referral database (referral and substantiation data) and the foster care database (entry into foster care data). Data were provided in aggregate form as counts of referrals, substantiations, and foster care entries at the Census tract level. Geocoding refers to the process of taking the location of the event and giving it an x, y coordinate on a map. This process allows us to then aggregate data to the Census tract for analysis. Geocoding rates, then, refer to the percentage of events that are accurately given an x, y coordinate. In this study, geocoding rates were 91.5% for referrals, 94.0% for substantiations, and 88.9% for foster care entries.
For this study, only entries into foster care that lasted for 5 or more days were used. The 5-day limit was chosen because a child who is removed from the home must have a formal petition filed within 48 hr and a Detention Court Hearing by the end of the next judicial day per California law. At this time, the judge will make a preliminary decision about whether or not the child should remain in out of home care or returned home (Judicial Council of California, Administrative Office of the Courts, 2000). In addition, the data are unduplicated counts of children in the system with referrals, substantiations, and foster care entries. For children who received more than one referral or had more than one allegation type (e.g., physical abuse and neglect), the allegation for the most severe type of maltreatment is used. This ensures that the rate of maltreatment refers to population rates. In the analyses, referrals are indexed by the total child population for each Census tract, substantiations are indexed by the total number of referrals, and foster care entries are indexed by the number of substantiated reports to model this continuum. At the population level in Sacramento, on average, there are 93 referrals for investigations of child maltreatment, 26 of those are substantiated, and about 11 children enter foster care per 1,000 children Census tract. About 24% of referrals were substantiated and about 40% of substantiations resulted in children being placed into foster care. Figure 1 shows how the dependent variables vary across the city. Interestingly, the places with high rates of referrals are not necessarily the same places that have the majority of the referrals substantiated. Similarly, the places where children are removed from their homes at higher rates are not always the same places with high rates of referrals.
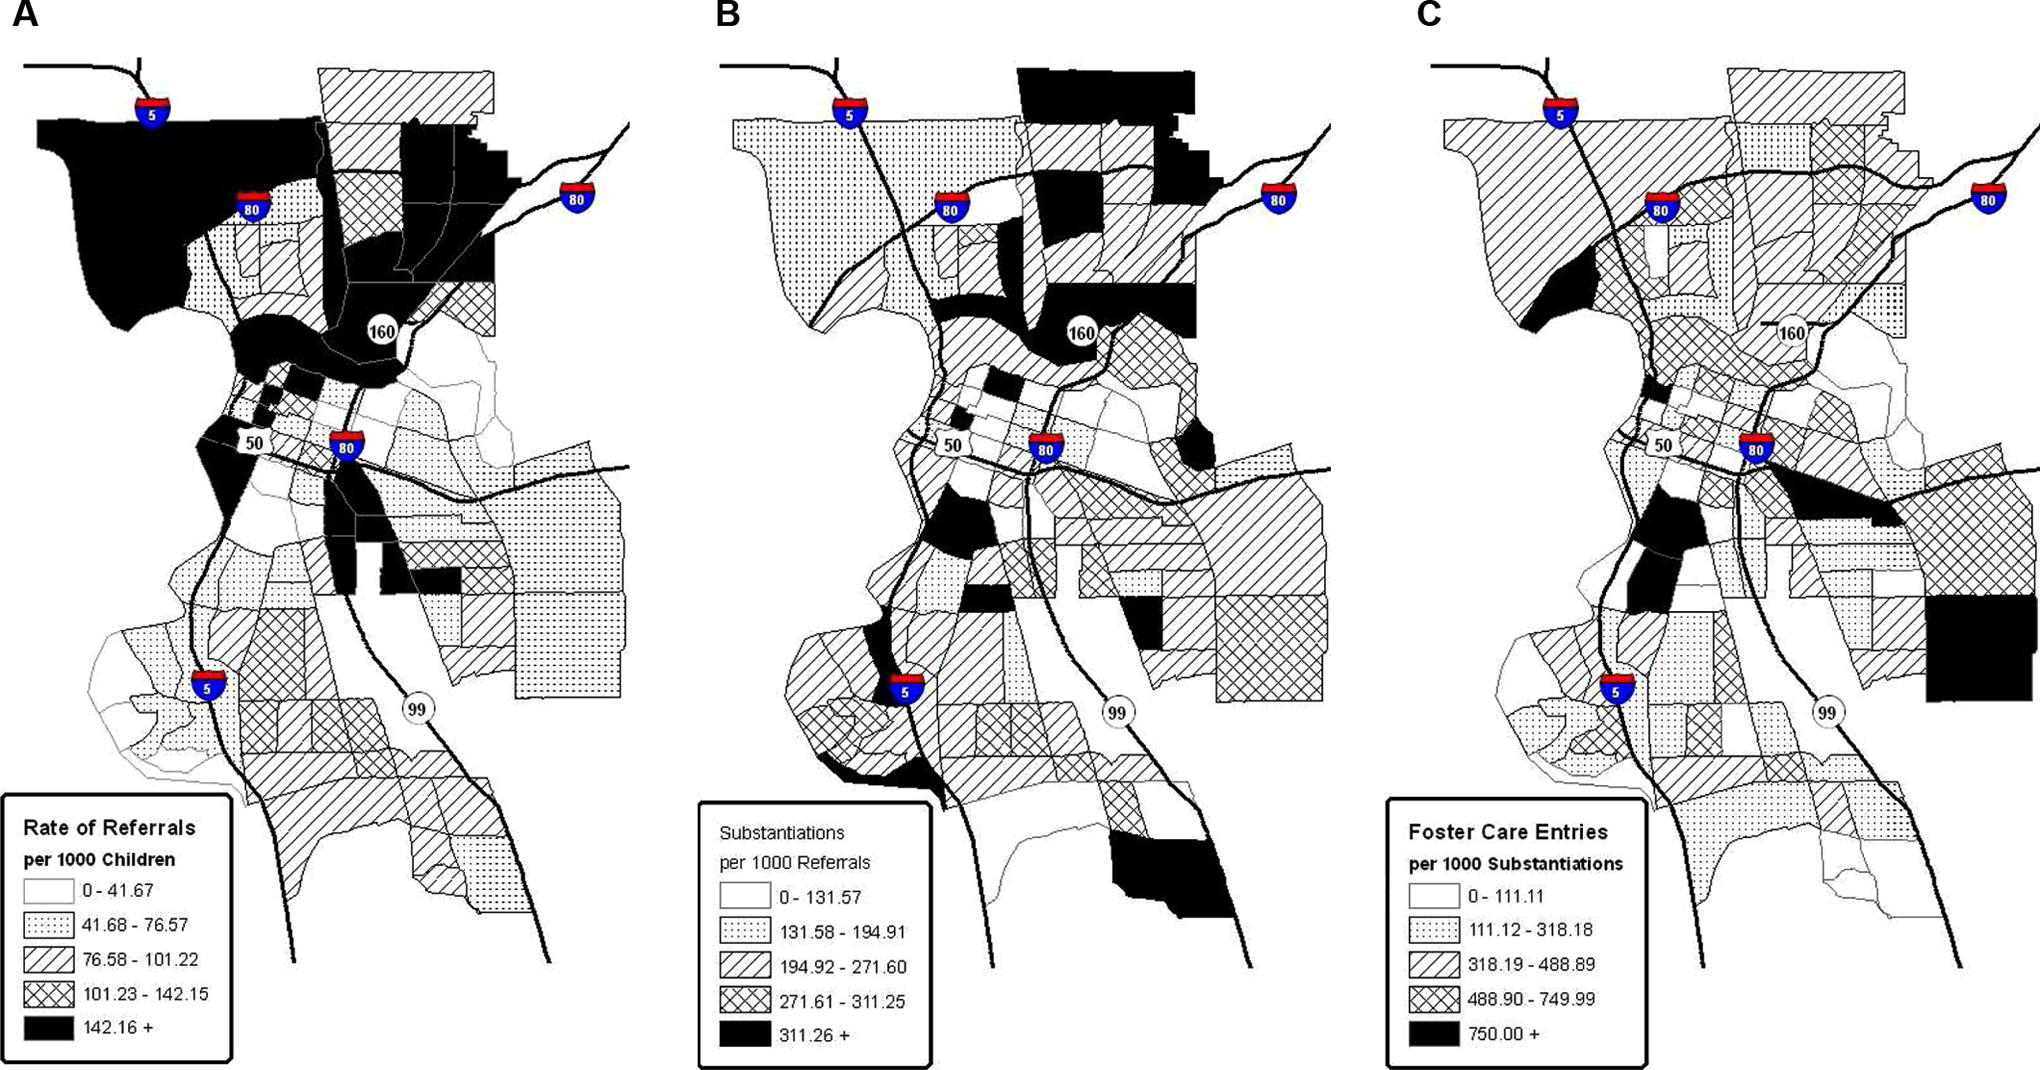
Rates of referrals, substantiations and foster care entries by Census tract in Sacramento, California.
Data for the independent variables came from the Sacramento Police Department and were used to model the amount drug market activity in Census tracts for the years 2001–2008. Data from 2001 were used to provide the temporally lagged variables in both local and spatially adjacent areas. In particular, this study utilized drug-defined crimes (i.e., violations of laws prohibiting the possession or sales of illegal drugs) from police incident data on drug possessions and drug sales which provided information on the location of the event as well as the code designating the type of crime. Sacramento Police Department crime codes distinguish between sales and possessions of illicit drugs for all types of drugs, including marijuana, heroin, methamphetamine, and crack/cocaine. Geocoding rates for the drug incident data exceeded 99% for each year. Each Census tract has on average 33 drug possession incidents and 5 drug sale incidents per square mile.
This study seeks to examine how current and temporally lagged effects of drug market activity in local and spatially adjacent areas are related to rates of child maltreatment. Figure 2 depicts these various relationships. In Figure 2A, the current year relationships are shown and include the number of drug possessions or sales for the current year for each Census tract (L) and the average number of drug possessions or drug sales in spatially adjacent Census tracts (i.e., spatial lags
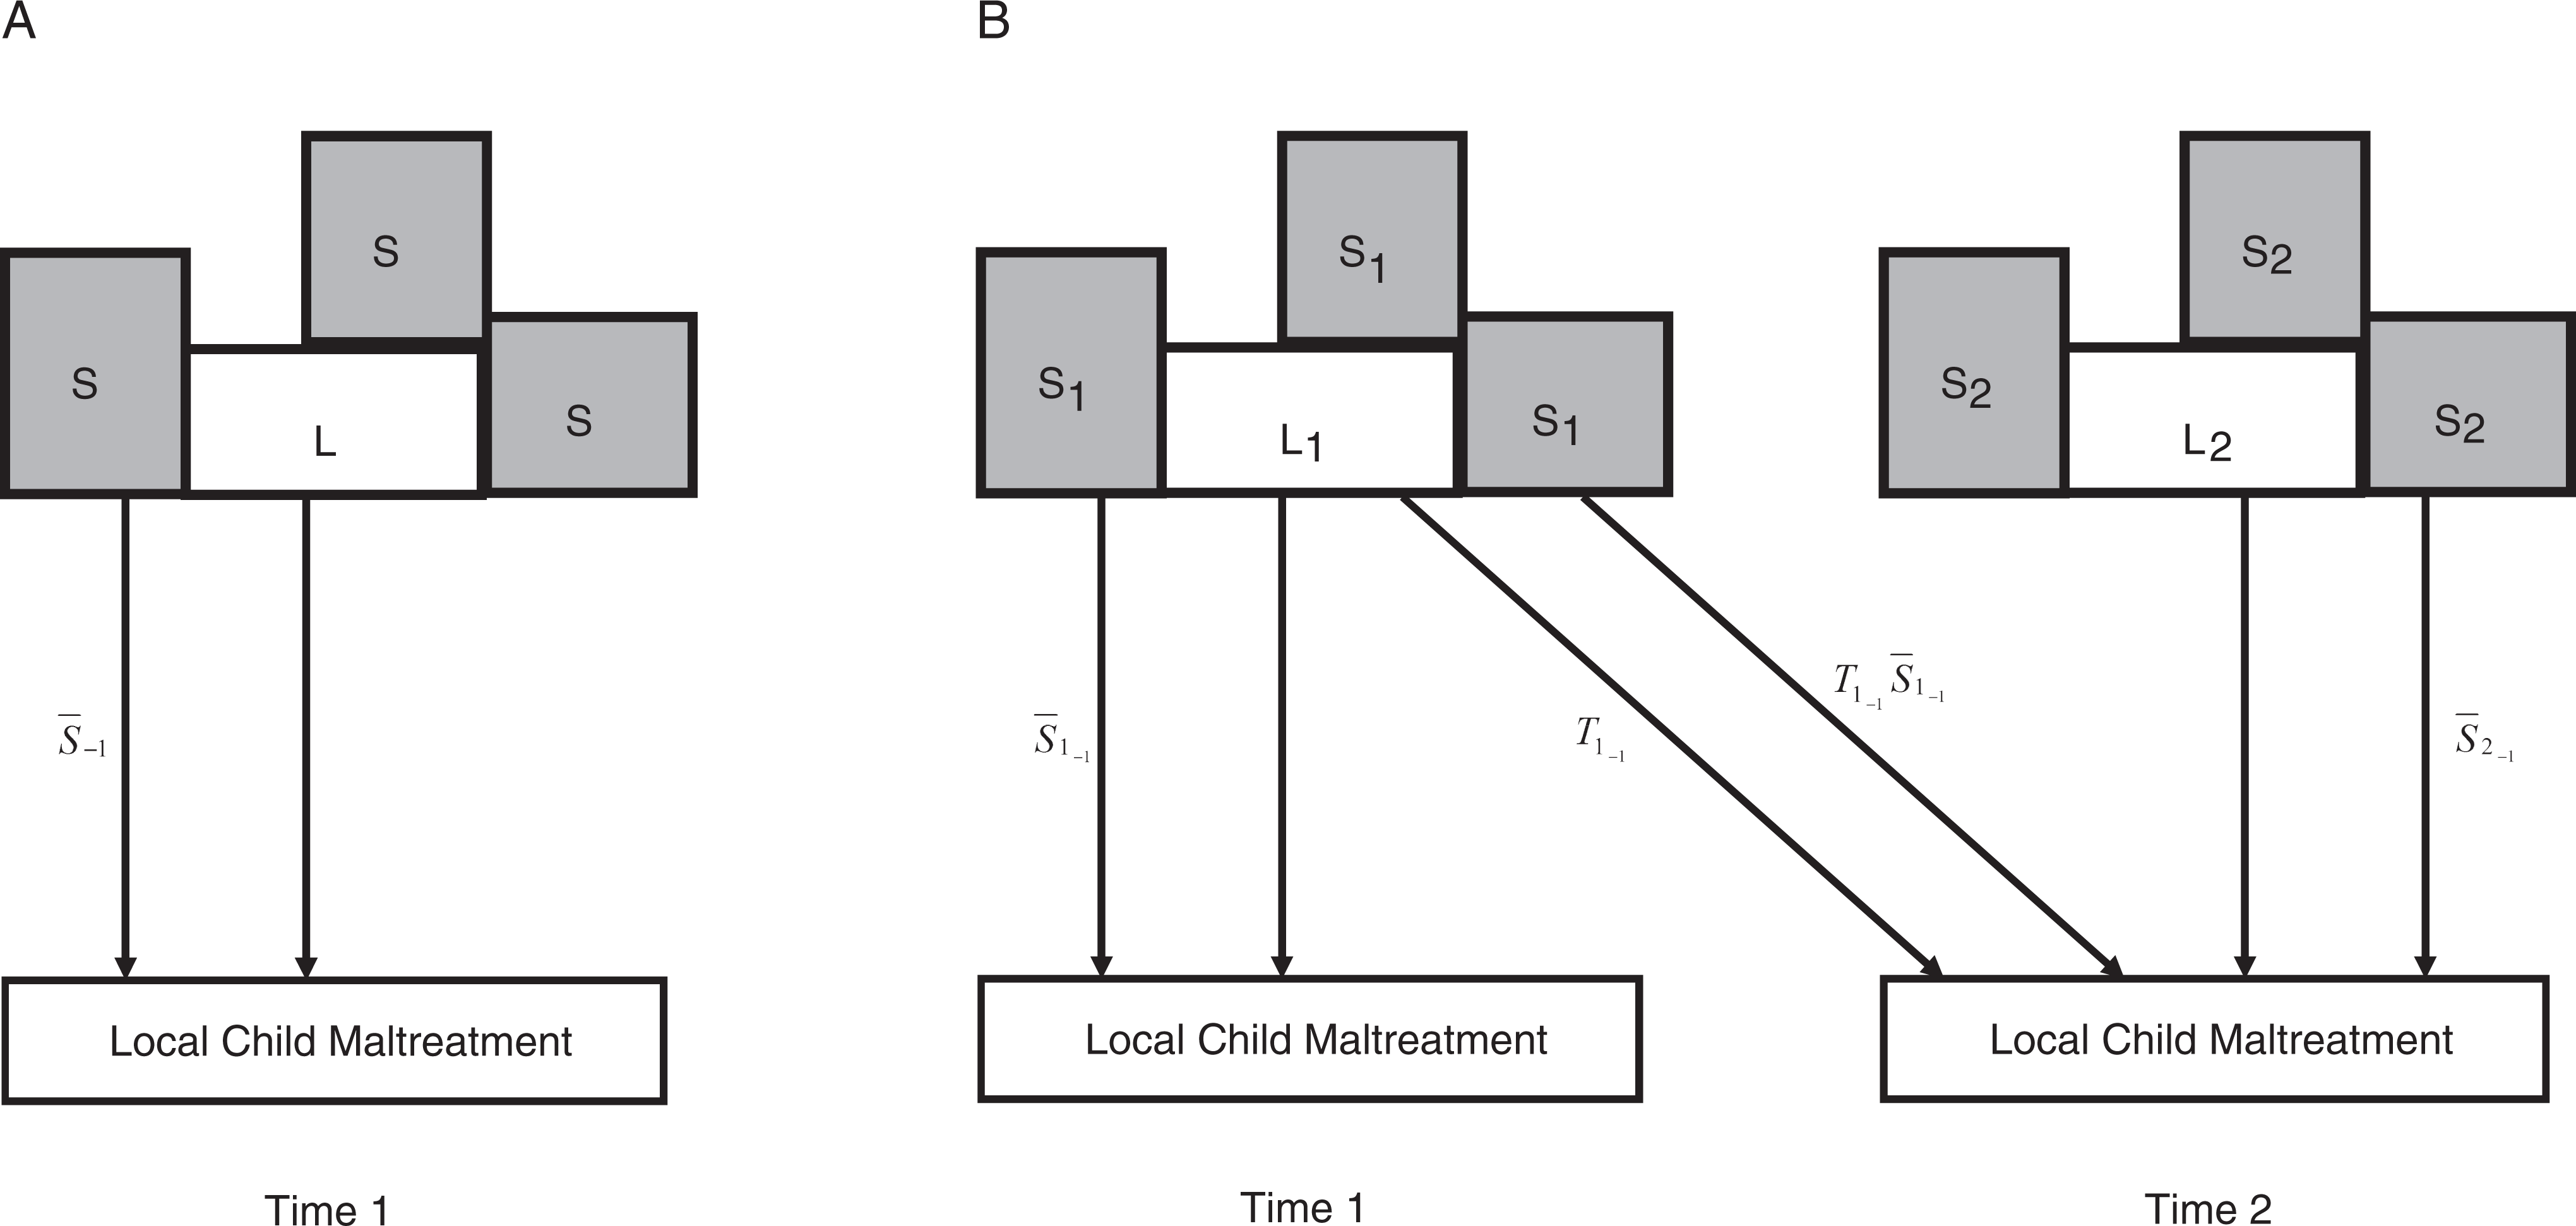
Visual depiction of the temporal and spatial relationships between drug market activities and child maltreatment at the census tract level.
Several control variables used in the analysis, including child density, neighborhood poverty, and the racial/ethnic concentration of the neighborhood area, were shown to be related to drug market activity (Freisthler, Gruenewald, et al., 2005; Saxe et al., 2001). Child population density was measured by the number of children less than 18 per square mile. Neighborhood poverty was measured as the percentage of residents with incomes below $20,000 and provides a credible measure of concentrated disadvantage in local areas (Jones, Pebley, & Sastry, 2011). Racial/ethnic composition of the Census tracts was measured by the percentage of African American residents, percentage of Asian residents, and percentage of Hispanic residents. Data for these variables were obtained from Geolytics that provides commercially available annual estimates of population and housing characteristics between Census years. These characteristics are derived from and estimated on the basis of continuing county, zip code, and metropolitan statistical area estimates made by the Census Bureau and based upon local economic and demographic data from the states (Geolytics Inc. 2006).
Statistical Analysis
Data are analyzed using Bayesian conditionally autoregressive (CAR) space–time models. These methods enable us to analyze the spatial and temporal effects of drug market activity on child maltreatment. These statistical analytic procedures control for two potential sources of bias. First, spatial structure is assessed by determining Census tracts that are adjacent to each other (as denoted by a shared boundary). This spatial structure assesses whether or not adjacent areas share characteristics and whether or not this spatial structure is related to rates of maltreatment at the Census tract level. Second, studies of social problems over time may also be vulnerable to temporal autocorrelation. The difference between CAR models and traditional frequentist statistical models is that Bayesian analysis treats unknown information as random variables with probability distributions, not point estimates. In this case, the three outcome variables are treated as having Poisson distributions. A second difference is that Bayesian analyses can condition the data based on prior information. Prior distributions are specified to describe the uncertainty surrounding unknowns before the data are observed. In other words, previous estimates of the relationship between drug activity and child maltreatment can be used as starting points for the analysis. However, in this study noninformative priors are provided, meaning the final estimations of the distributions will be similar to those found using traditional frequentist panel models. CAR models were chosen because they are able to control for both the temporal and the spatial structure of the data (see equation below). Computation is implemented using Monte Carlo Markov chain (MCMC) methods.
The full model is as follows: θ
ik = underlying risk of having a referral for investigation of a report of child maltreatment at Census tract i at time k (years 1–7). In subsequent models, this is the underlying risk of substantiations or foster care entries.
eik
= the population at risk. For referrals, this is the total child population in Census tract i at time k. For substantiations, this is the number of children referred for child maltreatment investigations and for foster care entries this is the number of children with substantiated reports. α = intercept β1 xik
through β
n
xik
= covariates 1 through n which includes the four drug availability measures and five sociodemographic control variables.
ui
= is the spatial random effects (i.e., spatially correlated heterogeneity) for area i
β × k = linear time trend for k time periods δ
i
× k = random spatiotemporal interaction modeling a linear time trend correlated spatially over neighboring Census tracts.


Spatial random effects smooth estimates across neighboring areas through use of the CAR model. This assumes that adjacent Census tracts share similar characteristics (Cliff & Ord, 1973) and the spatial term gives information about the magnitude of the spatial structure in the data. Adjacencies were determined by those Census tracts that shared a boundary. A Census tract that just shared a vertex (i.e., a point) with another tract was not considered a neighbor.
As mentioned earlier, the precision parameters controlling the degrees of spatial smoothing and the space–time interaction were modeled a priori with vague gamma prior distributions. A proper but vague normal prior was given to the time trend variable. By convention, the intercept is given a flat prior (Thomas, Best, Arnold, & Spielgelhalter, 2002). Vague (or noninformative) priors are used because there is very little prior information about the nature of the relationship between drug market activity and child maltreatment. Models were run separately for drug sales and drug possessions with each of the three dependent variables (for a total of six models). For each model, there were 50,000 iterations of MCMC burn-in and the posterior estimates are based on an additional 50,000 iterations.
Results
Table 1 presents the descriptive statistics for the study variables and the average percent change from 2002 to 2008. Referrals for investigations by CPS decreased by about three percentage points during the time period, while the rate of substantiations (per referrals) and rate of foster care entries (per substantiations) both increased during the study period. In general, drug possession and drug sales incidents saw double-digit increases. The exceptions were past-year drug sales that had a much smaller increase and past-year adjacent drug sales where there was a decrease in the number of incidents. As shown in Table 1, the percentages of Asian, Hispanic, African American, and poverty all increased during the study period.
Descriptive Statistics for Child Maltreatment Outcomes, Drug Possessions, and Drug Sales in Sacramento, California (n = 665)
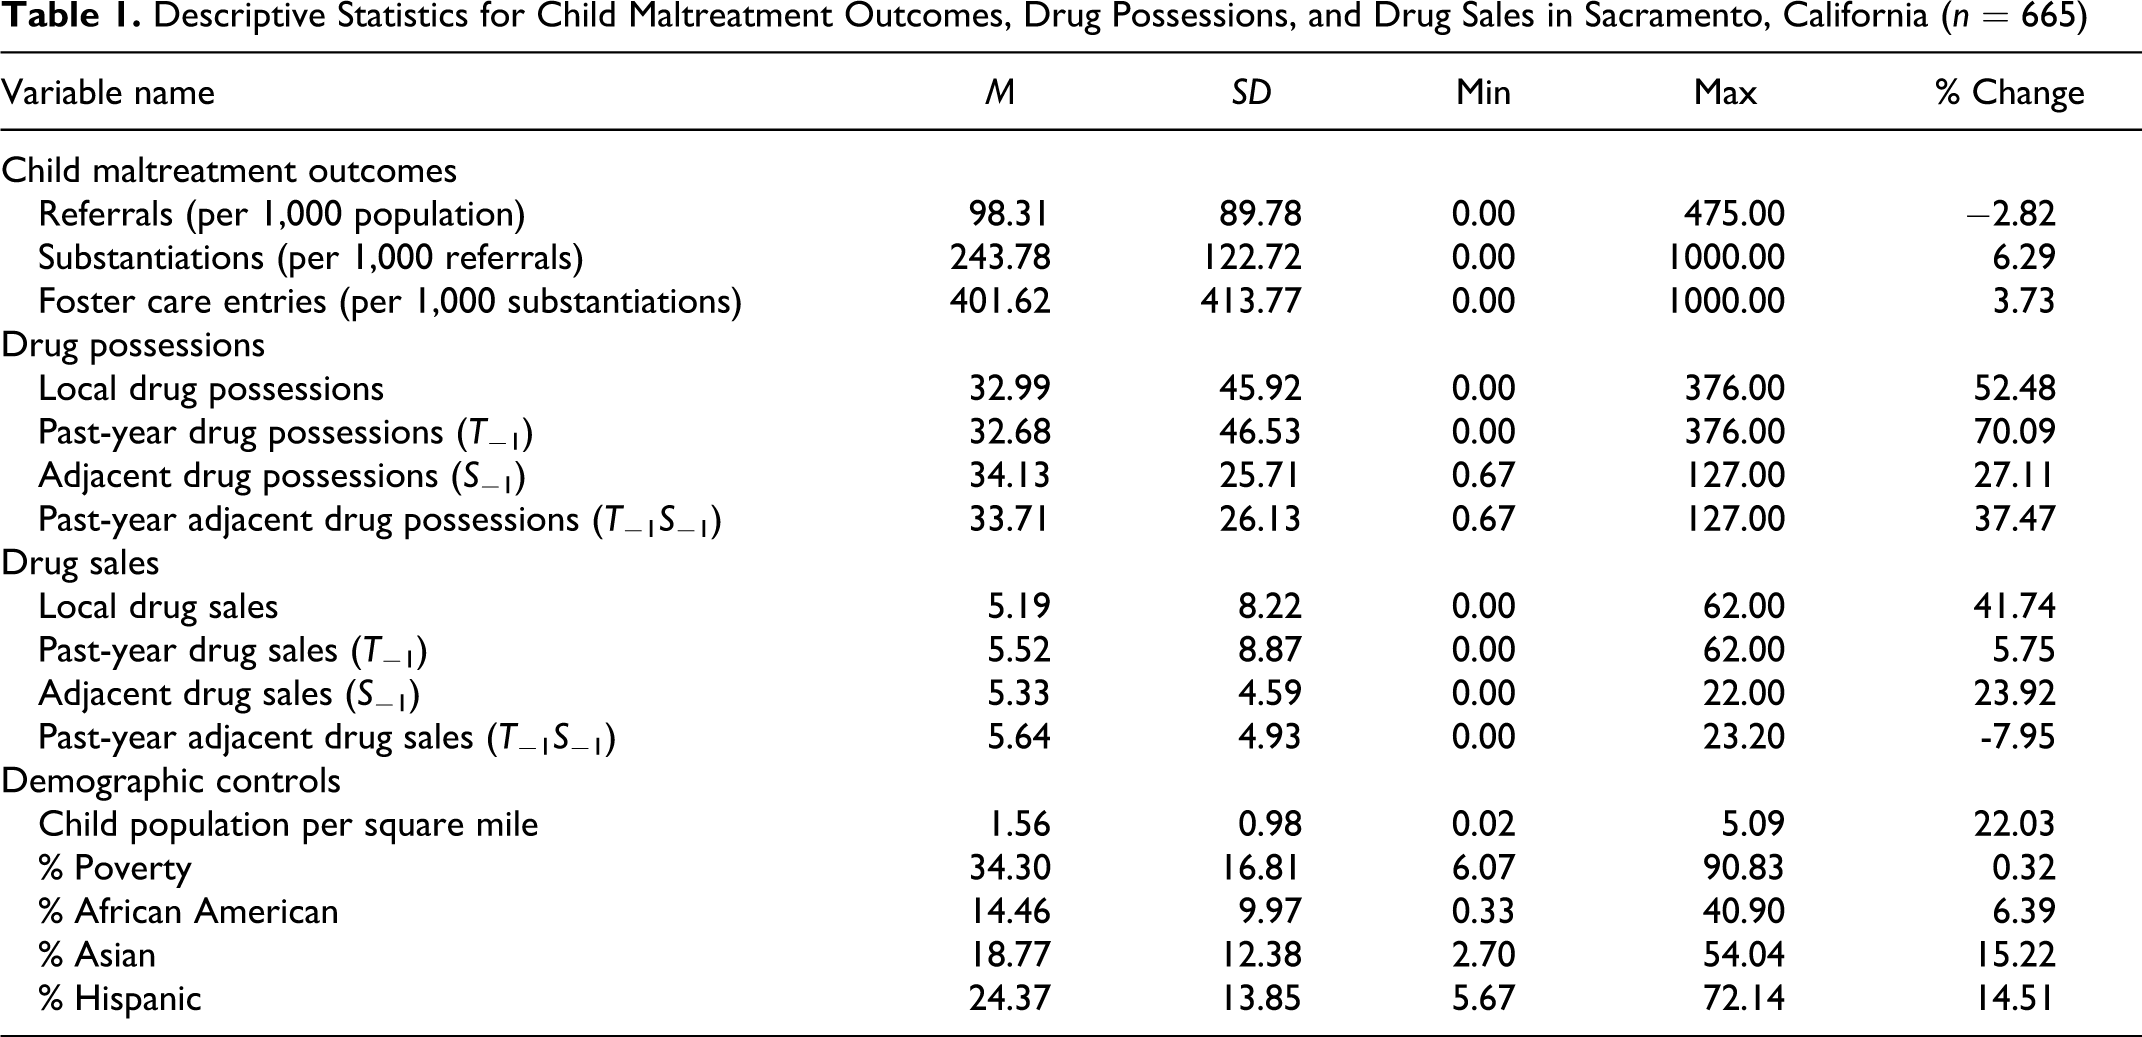
Table 2 presents the results related to the CAR models. As described, each set of drug activity variables (drug sales or drug possessions) was run with three different outcome measures (referrals, substantiations, and foster care entries). The results are presented as relative risks where values lower than one are those variables that related to lower levels of maltreatment rates and values greater than one are related to higher rates of maltreatment.
Relative Risk for Bayesian Space–Time Models of Child Maltreatment Referrals, Substantiations, and Foster Care Entries to Drug Market Activity (Possessions and Sales) Over 7 Years in 95 Census Tracts (n = 665)
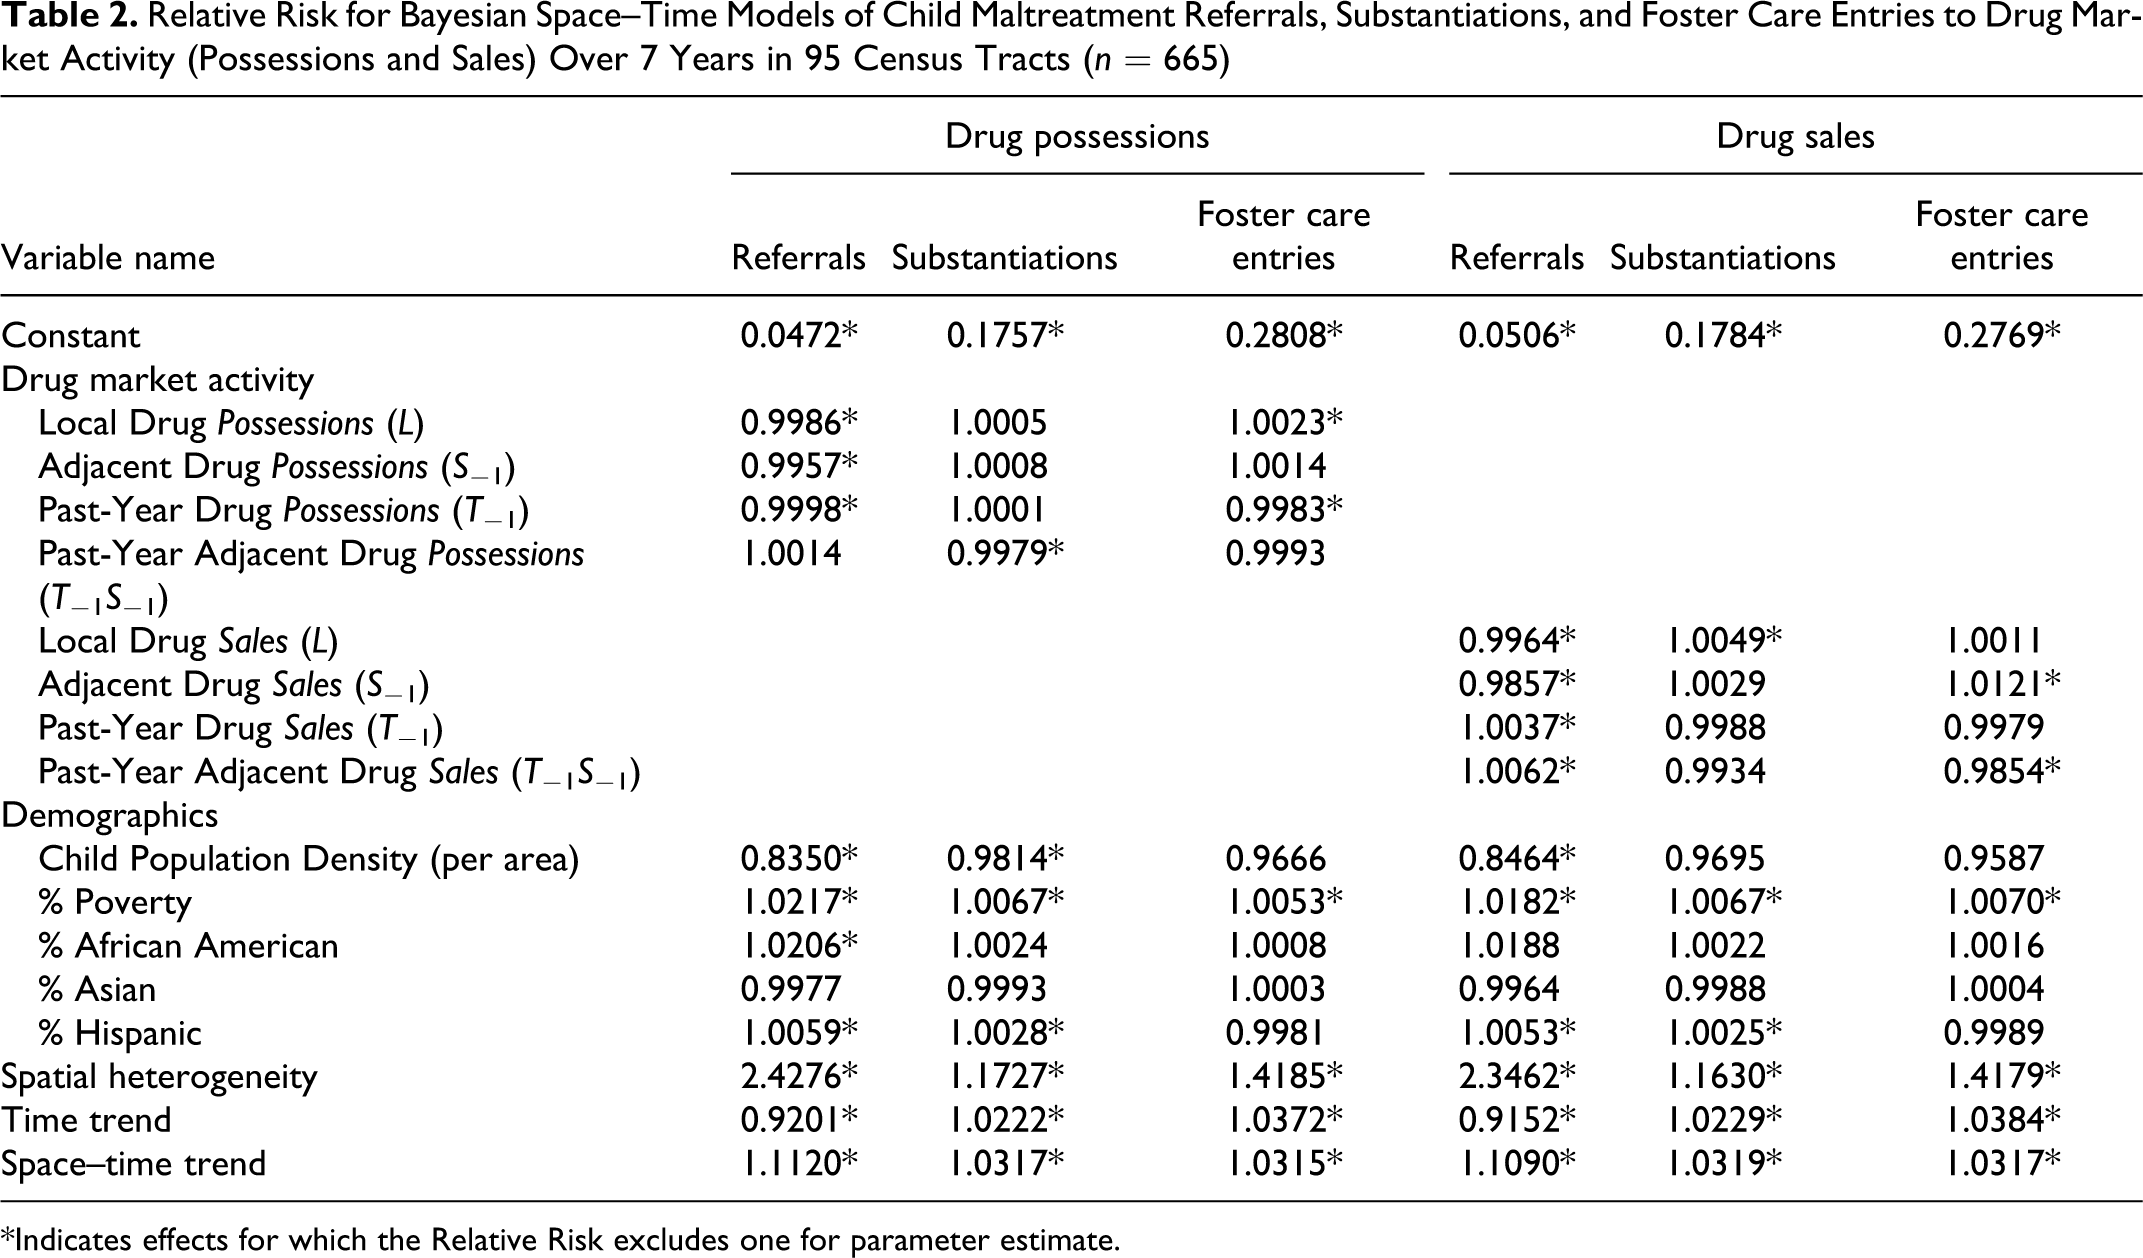
*Indicates effects for which the Relative Risk excludes one for parameter estimate.
Referrals
Current year local (L) and spatially lagged (
Substantiations
Only local drug sales (L) were positively related to substantiated rates of maltreatment, given that there was a referral for an investigation. For drug possessions, only past-year spatially adjacent possessions (T
−1
Foster Care Entries
Local drug possessions (L) were related to higher rates of entries into foster care (per number of substantiations), while past-year local possessions (T
−1) were related to lower rates of entry into foster care. The model of drug sales shows that sales in adjacent Census tracts were positively related to child maltreatment in local areas. These findings in spatially lagged areas (
Heterogeneity
All six models included terms of spatial heterogeneity, time trends, and space–time trends. The time trend variables are similar to what is found via the percent change information: referrals decreased over the study period, while substantiations (per referrals) and foster care entries (per substantiations) increased. Significant spatial structure was found across all three outcome variables. Similar to the maps shown in Figure 1, the spatial heterogeneity values are higher for the referral models, but lower for substantiations and foster care entries which appear to be a more patchwork in nature in Figure 1B and C. This indicates that, in general, places closer to each other share similar rates of maltreatment, but that this is more apparent in referrals than substantiations and foster care entries that are indexed on referrals and substantiations (respectively) than on child population. The space–time trend variables show that over time the spatial structure between adjacent places is increasing.
Discussion
Our findings partially support our hypotheses. For example, we hypothesized that local current and past-year drug possession activities would be related to higher rates of child maltreatment, as these measures may provide information on areas with higher levels of drug use problems. However, this is only true in the case of foster care entry rates. Higher numbers of drug possessions in current year local and adjacent areas are related to lower rates of referrals for investigations of child maltreatment. Past-year drug possessions in spatially lagged areas were negatively related to substantiations. The positive relationship between drug possession incidents and foster care entries is similar to findings from Freisthler, Needell, and Gruenewald (2005). Similarly, if one assumes that drug arrests are an indicator of underlying population-level drug use, the findings from the current study confirm those by previous panel studies of child maltreatment (Albert & Barth, 1996; Freisthler & Weiss, 2008).
Our findings show more support for the relationship between drug sales and child maltreatment at the Census tract level. We hypothesized that the spatially lagged drug sales would exhibit a significant relationship with our measures of child maltreatment if the primary mechanism relating drug markets to maltreatment was through drug use as neighborhoods with high levels of visible drug sales are spatially adjacent to where drug use occurs (Freisthler, Gruenewald, et al., 2005, Saxe et al., 2001). In support of this hypothesis, we found that past-year spatially lagged drug sales were related to higher levels of current year referrals for maltreatment and current year spatially lagged drug sales were related to higher rates of foster care entries. We also hypothesized that if the effect of drug market activity on maltreatment was through neighborhood structure, we would see a positive relationship between local drug sales and rates of child maltreatment variables. In support of this, we found past-year local drug sales positively related to referrals for child maltreatment investigations and current year local drug sales related to higher rates of substantiated cases of maltreatment. Contrary to what we expected, current year local and spatially lagged drug sales were related to lower rates of referrals for child maltreatment investigations.
Although the findings suggest that both deteriorating neighborhood structure and population levels of drug problems (through increased drug availability) may affect maltreatment and involvement with the child welfare system, the finding that both drug possessions and drug sales in current year local and lagged areas is related to lower levels of referrals for child welfare investigations is paradoxical. If one assumes that drug markets respond efficiently to enforcement patterns (LaScala et al., 2005), this finding may be an indicator of newly emerging drug markets. As such, these newly formed markets may not have had time to exacerbate problematic negative conditions or change the population levels of drug use. Further, neighbors, teachers, family, and friends may be more aware of drug markets that have been disbanded if reports of the “drug busts” from law enforcement are widely circulated. Thus, mandated reporters may be more watchful for adverse effects of drug market activities on children. Similarly, potential reporters, including community members, might feel a sense of safety about reporting individuals from already distressed or “known” drug areas as opposed to those where they just suspect drug activities might be occurring.
If drug possessions are actually a surrogate for drug use, the relationship seen here may actually be due to the underlying drug use behaviors of parents that are placing children at risk of maltreatment. The time lag found between drug sales and referrals for maltreatment investigations in Census tracts may be indicative of the time it takes for drug sales to reach their users and for the detrimental effects of the drug use to appear. Thus, the prevailing mechanism relating drug activity to child maltreatment may be through parental drug abuse.
Either interpretation of these findings (e.g., lag time of surveillance systems or the detrimental effects of drug use) suggests that closely following information on emerging visible drug markets could be an important avenue for prevention. These areas may indicate locations where prevention activities can operate on the community level to reduce the effects related to other types of criminal activity that may appear concurrently with drug markets (e.g., violence; Banerjee et al., 2008; Gorman et al., 2005) and other crime (Ford & Beveridge, 2006). As an early detection warning system, knowing the locations of previous year drug sales can provide important information on neighborhood areas where prevention programs may reduce drug-related maltreatment. At the community level, efforts could focus on detecting and eliminating visible drug sales through enforcement efforts.
Similar to previous ecological studies, neighborhood poverty is a significant contributor to maltreatment rates (Freisthler, Merritt, & LaScala, 2006). The positive relationship between percentage of Hispanic and African American residents is also similar to previous work (Freisthler, 2004; Freisthler et al., 2007). Drug market activities occur primarily in neighborhoods with high percentages of minority residents and concentrated disadvantage (Freisthler, LaScala, et al., 2005; Saxe et al., 2001). When controlling for these variables, they continue to remain significant as do the drug market activities for maltreatment rates. Neighborhood areas with higher densities of children have lower rates of referrals and substantiations which also mirror previous research (Freisthler et al., 2007).
Implications for Prevention
Understanding this relationship between the timing and location of drug market and its subsequent effects on child maltreatment may point to avenues for prevention efforts. Reducing the time delay between drug market development and referrals for child maltreatment investigations may prevent some child maltreatment from occurring. These findings suggest some natural partnerships including increased collaboration between law enforcement and child welfare caseworkers. Police could provide child welfare caseworkers with locations of emerging drug markets, as they investigate new drug cases in these areas. Further, information on emerging drug market locations would allow caseworkers or other child welfare professionals to target these areas for prevention programming so that subsequent maltreatment does not occur. The difficulty is that child welfare systems are often not able to respond efficiently to rapidly changing environments. Thus, part of this process may be to develop systems for child welfare agencies that monitor and assess changing environmental conditions that might include spikes in foster care entries or changes in drug market activities to determine where best to employ resources for prevention activities. This approach could be modeled on infectious disease control systems that are able to respond efficiently to outbreaks of diseases in order to contain the spread of the disease. Finally, publicizing drug activity in local areas or implementing public awareness campaigns encouraging individuals to report suspected child abuse and neglect in neighborhoods where drug market activities are occurring might further prevent maltreatment.
Limitations
Although this study provides insight about the role of drug market activities on child abuse and neglect, it does have limitations. As an ecological population-level study, inferences cannot be made about individual behaviors. Though one mechanism by which findings are explained is through parental drug use behaviors, without information specific to individuals these hypotheses are conjecture. Future work that examines ecological-level drug activity with individual-level drug use would allow testing of these theories. The findings seen here might be due to overall neighborhood structure that contributes to both child abuse and drug activity. Controlling for variables that measure these distressed aspects of neighborhoods would better illuminate the unique role of drug market activities on child maltreatment. Finally, the use of police incident data limits the understanding of the relationship of drug activity and maltreatment to primarily visible drug markets, as they are in locations that can be more easily monitored by police. Examining these relationships for invisible drug markets where drug sales occur primarily through social networks may provide additional insight that can better inform the development of prevention programs.
Conclusion
This study advances this understanding of drug market activities and child maltreatment in several important ways. First, the spatial aspects of drug market activity are explicitly modeled as effects both on local and adjacent areas for current and past years. Second, these relationships are studied over time and the timing of drug activity events and child maltreatment are considered through the use of temporal lags. Finally, this study considers the continuum of decisions points for children involved in the child welfare system to understand how and where the effects of drug market activity may be detected through professionals tasked with reporting suspected child maltreatment. The findings presented here are a beginning step in understanding how drug market activity is related to child maltreatment and provides some insight about how these consequences might be mitigated through prevention programs, collaborations between law enforcement and the child welfare system, and the development of better surveillance efforts.
Footnotes
Acknowledgment
Research for and preparation of this article was supported by an NIAAA Center grant P60-AA006282. The authors would like to thank the California Department of Social Services for access to the data.
The author(s) declared no potential conflicts of interest with respect to the research, authorship, and/or publication of this article.
The author(s) disclosed receipt of the following financial support for the research, authorship, and/or publication of this article: Research for and preparation of this article was supported by an NIAAA Center grant P60-AA006282.
References
Supplementary Material
Please find the following supplemental material available below.
For Open Access articles published under a Creative Commons License, all supplemental material carries the same license as the article it is associated with.
For non-Open Access articles published, all supplemental material carries a non-exclusive license, and permission requests for re-use of supplemental material or any part of supplemental material shall be sent directly to the copyright owner as specified in the copyright notice associated with the article.