



Abstract
Introduction
Cognitive dysfunction has long been viewed as a primary functional deficiency in ADHD (Barkley, Murphy, & Kwasnik, 1996; Noreika, Falter, & Rubia, 2012; Wilbertz et al., 2012), with particular problems in attention, impulsivity, and control (Barkley et al., 1996; Biederman & Faraone, 2005; Ebejer et al., 2012; Ibañez et al., 2012; Michielsen et al., 2012; Wilbertz et al., 2012; Willcutt, Doyle, Nigg, Faraone, & Pennington, 2005). These domains are well studied in pediatric and adolescent populations (Castellanos, Sonuga-Barke, Milham, & Tannock, 2006; Huang-Pollock, Karalunas, Tam, & Moore, 2012), with results generally indicating functional deficits in ADHD patients.
Based on theoretical development and empirical results, deficient reward processing has gained prominence as an important aspect of ADHD, both as a causal factor for the development of cognitive deficits (Sagvolden, Johansen, Aase, & Russell, 2005; Tripp & Wickens, 2008) and/or as a result of deficient executive processes (Barkley, 1997; Barkley et al., 1996; Noreika et al., 2012; Sonuga-Barke, 2003; Wilbertz et al., 2012). For instance, Sagvolden and colleagues (2005) proposed that a steeper delay of reinforcement gradient in ADHD, caused by sub-optimal dopamine levels in the basal ganglia, make it difficult to learn behaviors relying on executive functions. This therefore results in abnormal development of related behaviors. By comparison, Sonuga-Barke (2003) and Barkley (1997) propose that poor executive processing capacities lead to bad performance and thus to avoidance of situations where executive functions are needed to obtain delayed rewards. Consistent with the view that ADHD is associated with cognitive and reward processing deficits, a number of studies with pediatric and adolescent samples have shown deficient decision-making (DM) in ADHD in temporal discounting (TD; Sagvolden et al., 2005; Scheres, Tontsch, Thoeny, & Kaczkurkin, 2010; Tripp & Wickens, 2008), risky DM (Barkley et al., 1996; Groen, Gaastra, Lewis-Evans, & Tucha, 2013; Sonuga-Barke, 2003), and reinforcement learning (RL) tasks (Johansen et al., 2009; Sagvolden, Aase, Zeiner, & Berger, 1998).
ADHD is no longer understood as a childhood disease; it persists into adulthood for many patients, with prevalence around 4.4% in the adult population (Ebejer et al., 2012; Michielsen et al., 2012). Symptoms do not necessarily manifest identically in childhood and adulthood. Hyperactivity is typically more prominent in young patients, whereas symptomatic adult patients have inattention as the key pathological symptom (Kooij et al., 2010). Hence, it is unclear if the same DM deficits observed in children also manifest in adults. In the light of motivational and cognitive differences between adults and younger patients, the understanding of DM in adults with ADHD cannot mainly rely on results obtained with younger patients. DM deficits, and their underlying mechanisms, should instead be investigated in adults with ADHD. Consequently, a number of researchers have begun to investigate DM in adults with ADHD. A recent meta-analysis of risky DM in ADHD explored differences between controls and ADHD patients in pediatric and adult studies (Groen et al., 2013). The authors found that whereas children with ADHD take more risks than their peers without ADHD, there is no clear difference in risk taking between adults with and without ADHD (Groen et al., 2013).
The aim of the current article is to provide a quantitative summary of the broader emerging field of DM in adults with ADHD. Here, DM includes risky DM, RL, and choices between immediate and delayed rewards. A second intention is to compare the extent of DM deficits with performance in a key test of attention: the continuous performance task (CPT). Such a review can improve the understanding of ADHD in adults and contribute to theory development by delineating more or less robustly established functional deficits. From a practical perspective, the aim of this article is to explore the usefulness of DM tasks as diagnostic aides, and to shine light on DM domains in which adult ADHD patients are vulnerable and could thus require support.
DM Domains
DM can be viewed as any process leading to an action where one of several decision alternatives is selected. Using this broad definition, DM encompasses simple perceptual decisions, reinforcement leaning, risky DM, multi-attribute choice, among others. Some DM domains have been theoretically and empirically associated with ADHD, such as RL, risky DM, and TD (often referred to as delayed reward DM).
RL, in the form of association or instrumental learning, plays an important role in a number of ADHD theories (Sagvolden et al., 2005; Sonuga-Barke, 2003; Tripp & Wickens, 2008). This is because RL depends on the neurotransmitter dopamine, which is assumed to function sub-optimally in ADHD, and because it directly and indirectly can explain a number of ADHD symptoms. Instrumental learning has been given a lot of focus in investigations of DM in ADHD, particularly as assessed with the Iowa gambling task (IGT). The IGT (Bechara, Damasio, Damasio, & Anderson, 1994) is likely the best known RL task, where players need to learn through experience which of four deck of cards gives the largest cumulative payoff. Studies indicate that although participants with ADHD have similar responses as their peers in seeking actions leading to rewards (Johansen et al., 2009), they struggle in learning how to avoid punishment in comparison with their healthy peers (Luman, Tripp, & Scheres, 2010). The IGT can sometimes be referred to as a risky DM task. It is, however, strictly speaking a RL task, where risk taking only plays a role after participants have learned the decks’ payoff distributions (i.e., in the last two blocks of the task). Other RL tasks that have been shown to depend on dopaminergic functioning include reversal learning and probability learning tasks (Frank, Santamaria, O’Reilly, & Willcutt, 2006; Krugel, Biele, Mohr, Li, & Heekeren, 2009).
Risky DM encompasses situations in which choice alternatives have uncertain outcomes, including situations like choosing retirement investments, buying insurance, gambling, driving, or health-related behavior. Multiple studies indicate that adults with ADHD have impairments in such decision processes, with risky behavior documented in driving (Barkley, Murphy, DuPaul, & Bush, 2002), higher prevalence of unprotected sex (Flory, Molina, Pelham, Gnagy, & Smith, 2006), more use of narcotic substances (Charach, Yeung, Climans, & Lillie, 2011), and development of gambling addiction (Grall-Bronnec et al., 2011). In addition to gambling tasks, the Balloon Analog Risk Task (BART) is commonly used to assess risk taking (Lejuez et al., 2002). The purpose of the task is to maximize the amount of air pumped into a balloon, and money is only gained if you stop before the balloon bursts. Degree of risk taking is measured by the total amount of pumps made. The last two blocks of the previously explained IGT can conceivably also be understood as a risk-taking task. Given that the participants have learned the risks associated with each deck of cards, the amount of times a participant selects the “bad” decks in the last blocks can be considered risk-seeking behavior.
TD is one of the most studied DM processes in pediatric ADHD (Scheres, Tontsch, et al., 2010). Indeed, some theories of ADHD are centered around the finding that children with ADHD prefer small and immediate rewards over larger delayed rewards (Sagvolden et al., 2005; Sonuga-Barke, 2003), where stronger disregard for future rewards result in high discounting rates. Various tasks are used to study this phenomenon, among others the Delay Discounting Task (DDT; Hurst, Kepley, McCalla, & Livermore, 2011) and the Choice Delay Task (CDT; Scheres, Sumiya, & Thoeny, 2010). The key feature of such tasks is probing to which extent the participant prefers a smaller immediate reward to a larger delayed reward. The tasks use varying amounts of imagined or real monetary gain, where large amounts are allocated to future earnings while the smaller amounts are rewarded immediately.
Centering on the important role of dopamine and norepinephrine for DM (Frank & Claus, 2006; Schultz, 2007), there are strong reasons to assume deficient DM processing in ADHD. If DM is aberrant in ADHD, it might serve as a diagnostic aid or help develop more targeted treatments if elucidated properly. To explore the potential efficacy of DM tests in revealing aberrant processing in adult ADHD, and to assess the relative importance of DM deficits, one should compare DM tasks with an established test that has shown robust differences between patients and controls.
CPT
The CPT is a computerized test of attention and vigilance, used clinically and in research (Riccio, Reynolds, Lowe, & Moore, 2002). The CPT is administered to both children (Huang-Pollock et al., 2012) and adults (Hervey, Epstein, & Curry, 2004), and differences between controls and ADHD patients have been documented in behavioral measures for amount of errors (omission and commission), reaction times, and sensitivity (d′ or detectability). Although differences in errors and reaction times are frequently reported, reaction time data in the form of mean reaction times (RT) and RT variability are also discussed (Barkley, Edwards, Laneri, Fletcher, & Metevia, 2001; Carmona et al., 2011; Epstein, Conners, Sitarenios, & Erhardt, 1998; Huang-Pollock et al., 2012; Willcutt et al., 2005). Patients with ADHD are found to have more varying reaction times than healthy controls, often interpreted as more frequent lapses of attention in the ADHD population (Cohen & Shapiro, 2007).
One of the primary difficulties in comparing results across studies using a CPT paradigm is the plethora of versions, differing in varying aspects of the task. The tests present a sequence of stimuli with a target appearing every so often. The most prominent difference between developed tests is the ratio between target and non-targets. The test elicits prepotent responses to the stimuli that appear with highest frequency. By prompting a prepotent response, the test will produce measures of inattention and impulsiveness. To simplify explanation of the tasks, we here refer to “targets” as the stimuli that require response. The most commonly used CPT, the Conners’ CPT (Conners & Staff, 2000) has 90% target trials (any letter except “X”) with responses only to targets, whereas the AX-CPT has 30% target trials (the letter “X” preceded by the letter “A”), and requires responses to both targets and non-targets.
Huang-Pollock et al. (2012) note in their meta-analysis of CPT data from pediatric ADHD research that the target ratio perhaps is the most crucial element of a CPT. Tasks with higher ratio of targets will have more commission errors, whereas those with higher non-target ratio will elicit more omission errors. However, the relatively few studies on the adult ADHD population make drawing distinctions between paradigms difficult. To look at the differences between these tasks, one would either have to separate them into different analyses or use the target ratio as a modulator in the analysis. Dividing the tasks into different categories would exclude too many studies, and modulator analyses typically require more than 100 data points (Hunter & Schmidt, n.d.). We therefore included all studies with the necessary information, acknowledging that there is a difference between the information gained from CPTs (response < 50% of trials) and Go-NoGo paradigms (response > 50% of trials).
Drift Diffusion Modeling
Reaction time and accuracy measures are often dealt with separately when investigating performance of ADHD participants in DM tasks (Metin et al., 2013). A problem with this approach is that it does not fully capture the underlying cognitive and decision processes. The drift diffusion model of DM (DDM; Ratcliff & McKoon, 2008) is a mathematical modeling approach that combines measures of reaction time and accuracy to allow estimation of underlying cognitive mechanisms. According to the DDM, decision evidence is continuously gathered in favor of decision alternatives until a decision threshold for one is reached, and a response is initiated. The main parameters in the model include the speed at which evidence is accumulated (drift rate), and distance between the decision boundaries (boundary separation). Because perceptual information is noisy and the process of integration is thought to depend on neural signaling that introduces additional noise, this process occasionally results in errors. Estimation of DDM parameters, and their differences between conditions or groups, can be used to investigate how patients with ADHD differ from their peers. For example, an increase in accuracy could either be indicative of improved rate of evidence accumulation or increased cautiousness (higher boundary). Traditional analyses cannot differentiate between these two possible explanations, whereas the DDM has the possibility to do so (Ratcliff & McKoon, 2008). The DDM has also proven to be highly consistent with neural correlates of decision processes (Smith & Ratcliff, 2004), providing a bridge between behavioral and neural insights into DM. The DDM is therefore potentially a helpful tool in better understanding what causes changes in response time and accuracy in attention and DM for ADHD patients.
Method
Literature searches were conducted in ISI: Web of Science (WoS) and PubMed using the terms adult and ADHD paired with either vigilance, attention, TOVA, continuous performance*, decision-making, decision, Iowa gambling task, reinforcement learning, delayed reward, temporal discounting, delay aversion, and so on (see the supplementary materials for a complete list). Studies needed an adult sample (between 17 and 50 years) to have matched experimental and control groups, and provide test statistics from which effect sizes (ES), and confidence intervals (CIs) around these, could be calculated. For the ADHD samples, the participants needed to have a current diagnosis of ADHD (either self-reported or evaluated by the study personnel). All sub-types of ADHD were included. In addition, patients undergoing medication were included, and the ADHD groups were a mixture of medicated, non-medicated, and patients who had ceased medication before participation. The control groups needed to be matched on age and gender to the ADHD samples for each specific study (see Supplementary Table 1 for group characteristics for each study).
Studies were grouped into two categories: CPT and DM tasks, each with several sub-groups. Studies using the CPT each focus on partially different outcome measures (some report multiple measures), and consequently the CPT is further divided into the sub-groups reaction time, reaction time variability, omission and commission errors, and sensitivity. The DM category consists of RL, TD, and risky DM. Results from the last two blocks of the IGT are analyzed within the risky DM domain, based on the assumption that the participants have learned the risks of the decks.
The last literature search was conducted on 20th of August 2014. The consort diagram in Figure 1 displays the various steps in the selection process. The original searches yielded 14,011 studies, of which 7,360 were unique (i.e., after removing duplicates within and across PubMed and WoS search results). On further examination, many of these studies were on topics not related to this meta-analysis. After removing the irrelevant studies, such as qualitative studies and studies without original experimental data, only 416 studies remained. Next, the “Method” section of the remaining studies was examined and any study with groups that did not fit our inclusion criteria was removed, leaving 225 studies. One hundred thirty-one of these studies did not use any tasks of interest, and of the remaining 94, 55 reported the sufficient data to estimate ES. Last, after searching the references of other meta-analyses and reviews, an additional 4 studies were included. Barkley et al. (1996), Klee, Garfinkel, and Beauchesne (1986), and Gansler et al.’s (1998) studies were found in Schoechlin and Engel (2005), and Gualtieri, Ondrusek, and Finley’s (1985) study was found in Gualtieri and Johnson (2005).
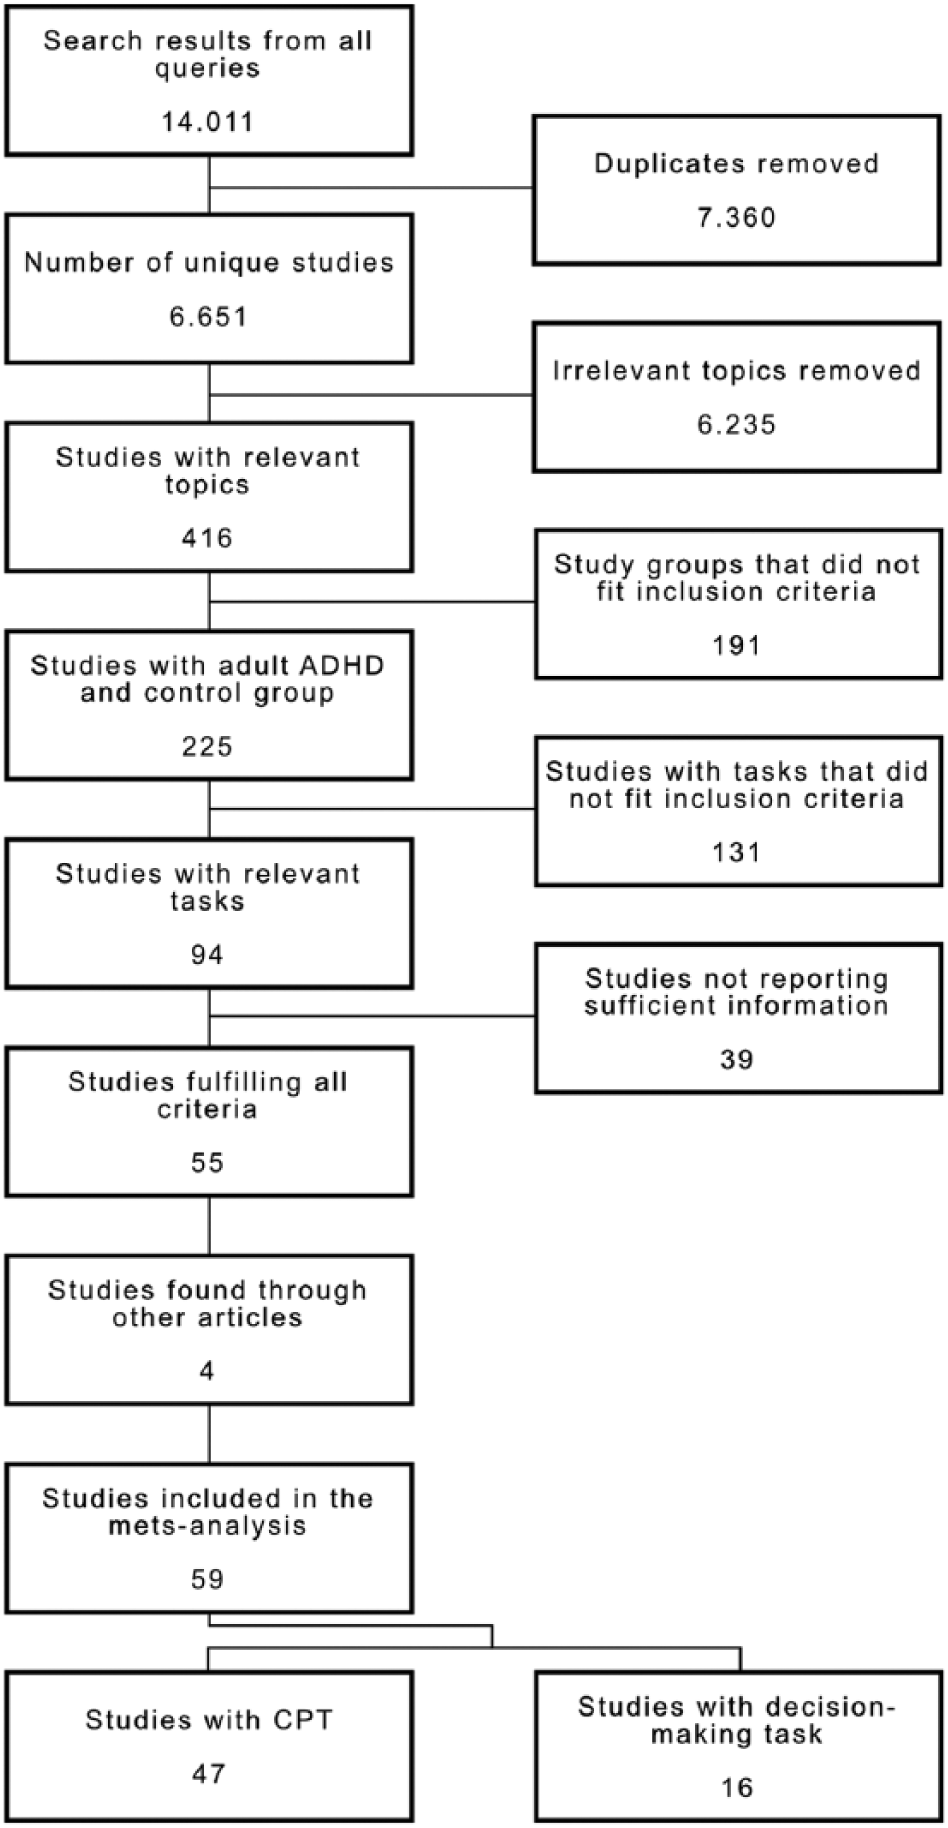
Consort diagram for study selection.
A total of 59 studies fit the inclusion criteria, several reporting multiple domains and/or reporting several measures. For the CPT domain, 47 studies were included. Of these studies, 38 report omission errors, 44 commission errors, 34 reaction times, 20 RT variability, and 10 sensitivity (d′). Sixteen studies were included in the DM domain, 6 of which investigated TD, 7 RL, and 9 studied risky DM. Some articles report several experiments and therefore contribute to multiple data points, even within sub-domains. Unfortunately, no article reported correlations between different DM tasks. For the DM domains, an overall ES was nevertheless calculated as only few studies contributed multiple ES. There are relatively few studies in each sub-domain, and the aim was to obtain a robust estimate of the average DM deficits in adults with ADHD. An overall ES for CPT was not estimated, because a majority of articles included two or more outcome measures obtained from the same participants, and the covariance of CPT measures needed to account for this dependency was typically not reported.
Of the 47 studies using a CPT paradigm, 17 include measures from which we could derive accuracy and reaction time. Only 9 of these 17 studies also include measures of RT variability. The corresponding authors for the 8 remaining studies were contacted with requests for the additional information, but none were able to supply it. The EZ DDM parameters were therefore estimated for the 9 studies with all the necessary data.
ESs were calculated as Hedges’s g (Hedges, 1981), a more conservative measure of ES than the commonly used Cohen’s d. While Cohen’s d uses a maximum likelihood estimation to calculate variance (which yields a biased estimation for n), Hedges’s g uses the Bessel’s correction. The Bessel’s correction reduces overestimation of ES for small studies, while larger studies remain the same, by calculating the pooled standard deviation using degrees of freedom. For the studies not reporting statistics or reporting statistics between more than two groups, Hedges’s g was calculated by subtracting the mean of the control group from the mean of the experimental group, and dividing this difference by the pooled unbiased standard deviation (Hedges, 1981). For the studies reporting inferential statistics (F, t, or p values), g was calculated using the test statistics and degrees-of-freedom through the compute.es package (Del Re, 2013) in the R (3.1.0) statistical software. ES are calculated so that positive values indicate better performance of controls in comparison with adults with ADHD. For the CPT domain, this means that positive ES indicate more errors, slower reaction times, more varying reaction times, and less ability to distinguish target from non-target (sensitivity) for patients compared with controls. Positive ES in the DM domain mean that ADHD patients have more risky DM (choosing bad decks more often), higher discounting rate (choosing small immediate rewards more often), and fewer choices of the best option in the RL tasks when compared with their healthy peers.
The meta-analysis was conducted through the R (3.1.0) statistical software, using the metafor library package (v.1.9-4; Viechtbauer, 2010). A random-effects (RE) model was used and studies were weighted by their inverse variance to assure that larger studies have a greater contribution. Q-statistics for study homogeneity were computed along with I2 scores. Q-statistics are computed by summing the squared deviations of each study’s effect estimate from the overall effect estimate, weighted by the study’s inverse variance. Q follows a χ2-distribution with k − 1 degrees of freedom (Huedo-Medina, Sánchez-Meca, Marín-Martínez, & Botella, 2006), and significant Q-tests indicate that substantial differences in the effect estimates between studies cannot be explained by sampling error. This suggests systematic differences between studies (Huedo-Medina et al., 2006), revealing the possibility that the studies are measuring different processes and justifying moderator analyses. I2 is calculated by dividing the difference between the Q-statistic and degrees of freedom by the Q-statistic itself, resulting in an estimated percentage of study variance explained by heterogeneity (Huedo-Medina et al., 2006). RE models were estimated, irrespective of heterogeneity significance. Q and I2 rely on degrees of freedom, and are therefore not optimally estimated with small samples (n < 8).
Forest plots give an overview of each study’s ES and the confidence around the ES. The RE model estimates are included for all the sub-domains, as well as for the whole DM domain at the bottom. Funnel plots are used as visual indicators for publication bias, where ES are plotted along standard errors, and studies high on the y axis (low SE) are more trusted than studies low on the axis (high SE). Studies with high heterogeneity have CIs calculated with τ2 (heterogeneity residuals; estimate of between-studies variance) for better fit (Huedo-Medina et al., 2006). Possible publication bias is indicated by a slanted linear placement of studies from one side of the “funnel” to the other. Regression analyses were conducted with ES as predictor and standard error (as an indicator of study size) as dependent variable, testing for the existence a linear slope within each sub-domain (Huedo-Medina et al., 2006).
To use the EZ DDM (Wagenmakers, Van Der Maas, & Grasman, 2007), three descriptive statistics of behavior are needed: mean reaction time in seconds, reaction time variance (i.e., mean of the individuals RT variances) in seconds squared, and accuracy. Studies using CPT or Go-NoGo paradigm reporting these measures are included in the EZ DDM analysis, and corresponding authors were contacted if an article reported reaction times and not reaction time variability.
Results from the CPT are commonly reported by providing information about omission and commission errors, and mean reaction time. A standard way of reporting RT variance is either with the mean standard deviation of RT or the mean standard error of RT. The latter was converted to mean standard deviation by multiplying the standard error of RT with the square root of the number of trials in the experiment. Accuracy was calculated by subtracting the sum of percent omission errors and percent commission errors from 100, and dividing this difference by 100. These values were submitted to the EZ DDM webpage (accessed September 2, 2014; Wagenmakers et al., 2007) and estimations of drift rate (v), boundary separation (a), and non-decision time (Ter) were calculated for each study. These estimates need to be interpreted with caution, as proper DDM analysis requires responses to all trials in an experiment. However, tests such as the Connors’ CPT key feature lies in withholding responses in non-target trials, such that RTs for missed targets and correct non-responses do not enter the analysis. This analysis used a paired-samples t test because the significance of the effect across studies was tested; the studies are the individual units of the analysis, whereby each unit provides two data points (ADHD and controls). To facilitate comparisons between the magnitude of effects between the EZ DDM parameters and results from the meta-analysis, ES were calculated for drift rate and boundary separation based on the t statistics (Del Re, 2013).
Results
The overall ES from DM indicates that adults with ADHD perform differently from controls (g = 0.282, df = 26, p < .0001). In addition, the Q-statistic from the CPT (Q = 459.89, p < .0001, I2 = 71.08%, df = 151) and DM (Q = 45.21, p = .0112, I2 = 42.63%, df = 26) indicate that there is substantial variation due to heterogeneity, and that moderator analyses for both should be run. The strongest ES in the CPT domain was found for commission errors (g = 0. 410, SE = 0.077) and in the DM domain for RL (g = 0.5510, SE = 0.1062).
Figure 2 displays funnel plots for all reviewed tasks. No publication bias was uncovered in any sub-domain. Forest plots are in the supplementary materials (Supplementary Figures 1 and 2) and display each study’s ES and the CI around this estimate. Results for RE models are shown for each sub-domain, and overall for the entire DM category at the bottom. Figure 3 shows a composite of all the sub-domain ES from the RE models.
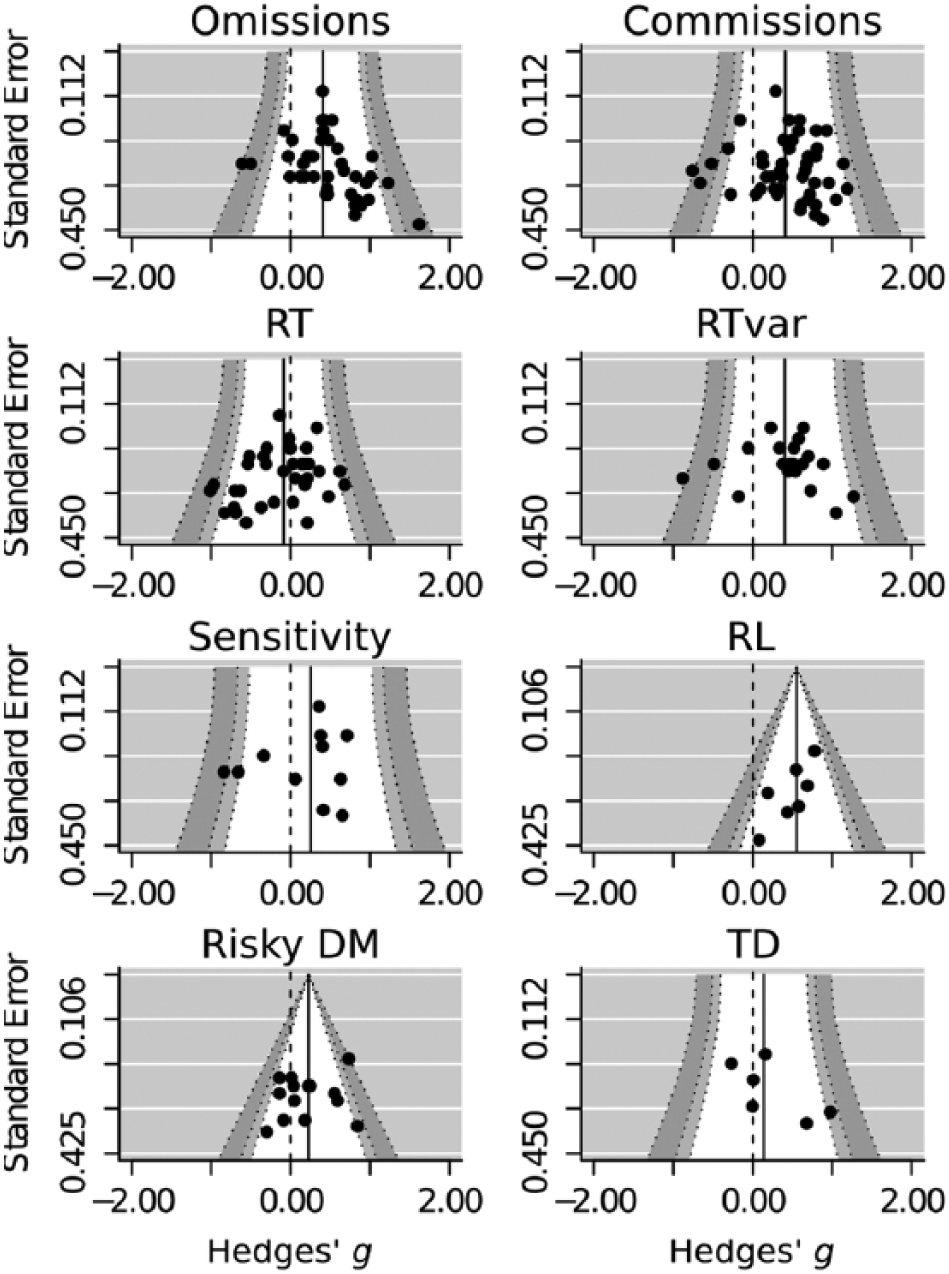
Funnel plots for publication bias.
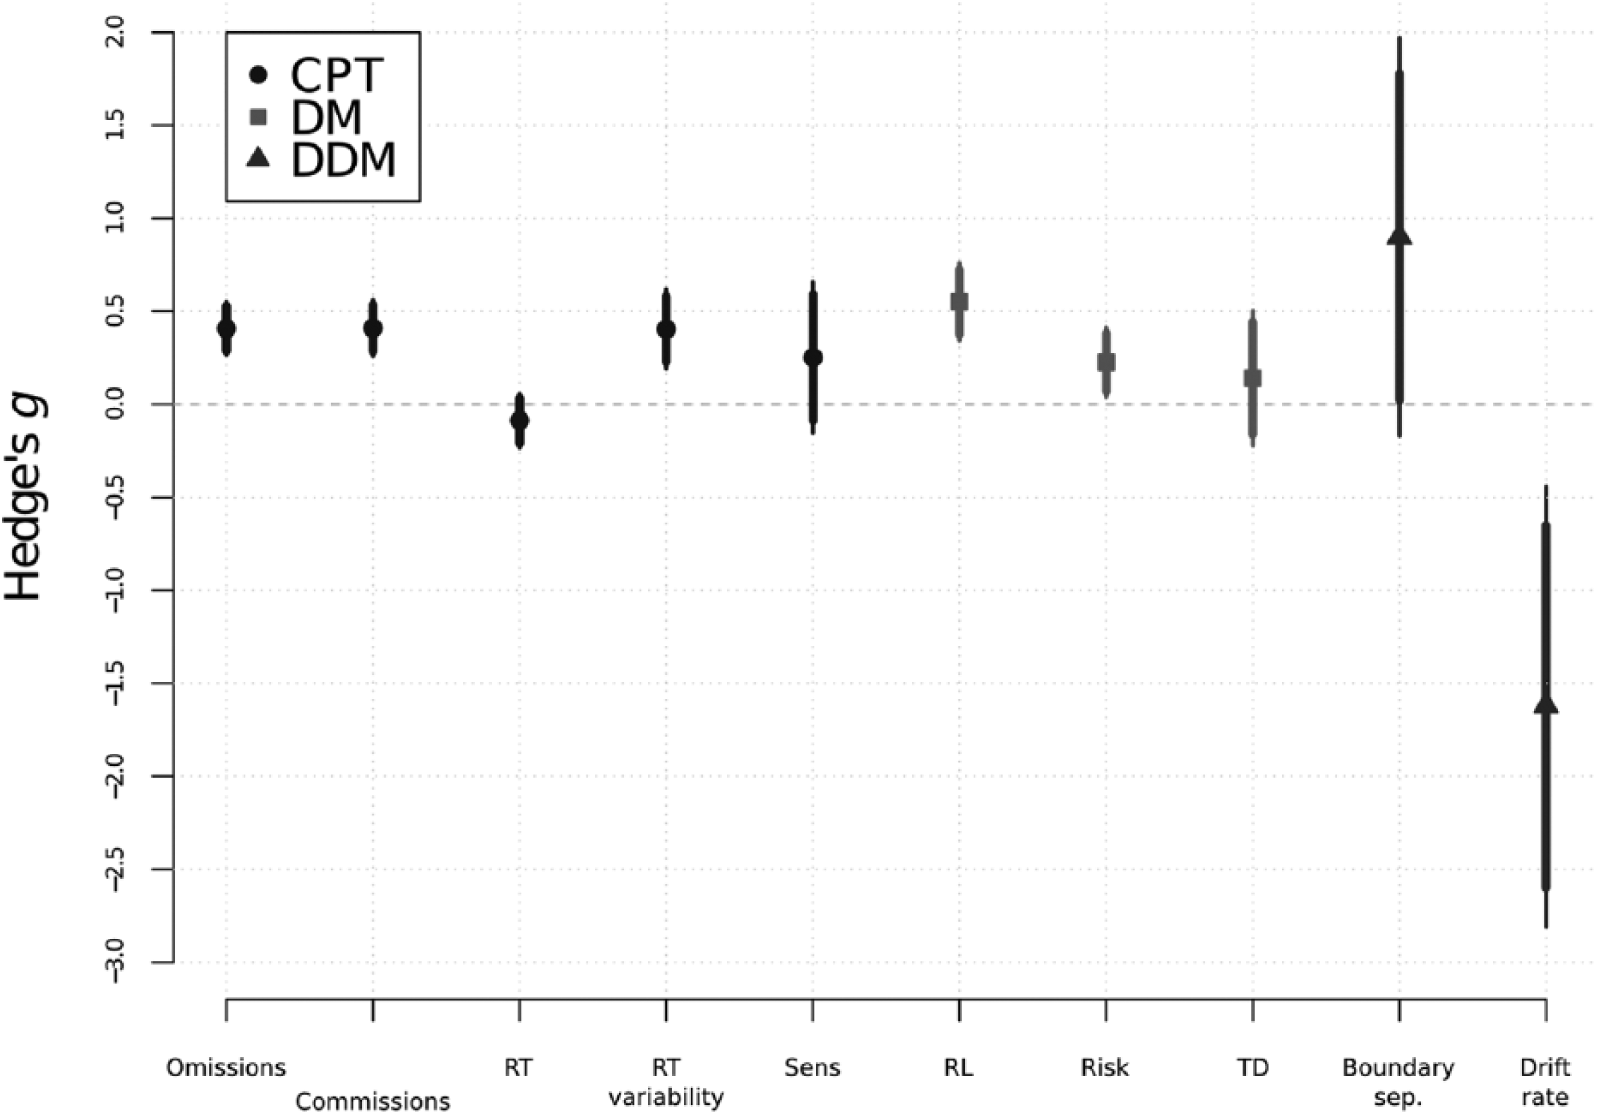
Overview of effect sizes estimated with meta regressions for each sub-domain, and for the EZ DDM.
A summary of meta-analytic statistics is displayed in Table 1. A large proportion of variance between studies is explained by heterogeneity in several sub-domains, and CIs in the funnel plots for these domains are calculated with τ2. CPT sensitivity and all the DM sub-domains do not have enough data (n < 8) to properly estimate heterogeneity, so these estimates need to be interpreted with caution.
Summaries of Statistics From Meta-Analysis.

Note. g = Hedges’s g; CPT = continuous performance task; DM = decision making; RL = reinforcement learning; TD = temporal discounting.
The meta-regression run on all DM studies and CPT commission errors resulted in high heterogeneity (Q = 159.21, p < .0001, I2 = 55.56%, df = 72), which justifies an alternative meta-regression with task (DM vs. CPT) as moderator. The moderator analysis indicated that the CPT ES was not reliably larger than the ES for the DM tasks (z = −1.449, p = .148, df = 1), with negative tests for heterogeneity (Q = 155.68, p < .0001, I2 = 54.15%, df = 71). Risky DM and RL in the DM domain had ES significantly different from zero, and so did all the CPT sub-domains except RT and sensitivity.
Paired-samples t tests of the EZ DDM data between ADHD and controls show that processing speed is slower in the ADHD group, t(8) = −3.4317, p = .0089, and has a large ES of −1.62. The tests also indicate that the ADHD participants somewhat compensate for their lower processing speed by having a higher boundary separation than the controls, t(8) = 1.908, p = .0928, g = 0.9. The magnitude of the parameter estimates for DDMs are only meaningful when comparing between task conditions or participant groups (Ratcliff & McKoon, 2008; Wagenmakers et al., 2007), and Figure 4 therefore displays each study’s parameter estimate of the controls subtracted from estimates of the ADHD group.

Differences in drift rate and boundary separation between controls and ADHD patients.
General Discussion
The aim of this article was to review results on DM in ADHD and to contextualize them by comparing ES of DM deficits with ES in the CPT as a well-established task measuring functional deficits in ADHD. Given that the field of DM in ADHD is currently only emerging, only a limited number of articles (16) were found. Interestingly, even the consideration of a broad range of CPT tasks only allowed the inclusion of 47 CPT studies. The present analysis can therefore provide a number of more general results, whereas a reliable estimation of moderator effects will have to wait for the accumulation of a larger body of research.
The meta-analysis found clear evidence for DM deficits in adults with ADHD, which are of a similar magnitude as attention deficits measured with the CPT. The present results do not show deficits in TD for adults with ADHD, which is surprising given that DM deficits have been found in pediatric ADHD samples (Wilson, Mitchell, Musser, Schmitt, & Nigg, 2010). However, generally the presented results identified deficits in DM and performance in the CPT in the adult ADHD population. Both domains show effects of small to medium strength (g = 0.551 and g = 0.410, respectively). The two domains show a similar ability in uncovering functional deficits in adults with ADHD, indicated by the large overlap of CIs for CPT and DM ES. While confirming that the CPT robustly uncovers aberrant attention processes in adults with ADHD, the results also point to DM as an important deficit.
Of the three DM sub-domains studied, two display robust differences in performance between adults with ADHD and healthy controls. The overall effect of RL is of medium strength (g = 0.551); adults with ADHD make less advantageous choices. Similar results are found in children with ADHD (Luman et al., 2010; Sagvolden et al., 2005), and might indicate that aberrant processing in these domains extends from childhood into adult life. As RL depends on the dopamine system (Biederman & Faraone, 2005; Schultz, 1998), poor performance in RL supports assumptions of sub-optimal dopamine function in adults with ADHD.
While adults with ADHD reportedly take more risks (Barkley et al., 2002), this meta-analysis found a small ES for risky DM (g = 0.226). The weak effect of risky DM is not surprising given a recent meta-analysis (Groen et al., 2013), which indicates risky DM as more prominent in pediatric ADHD than adult. Even if risky DM is a relevant aspect of ADHD, is well established in the pediatric population, and is documented in real-life scenarios (Barkley et al., 2002; Grall-Bronnec et al., 2011), experiments utilized to study it in adults with ADHD have thus far proved ineffective in showing clear differences to healthy controls. The results presented here buttress that risky DM is evident in adults with ADHD, but that this effect is weak.
A more surprising result is the lack of effect for TD (g = 0.140). Given the strong effects in pediatric samples (Scheres, Tontsch, & Thoeny, 2013), and its prominent role in several theories of ADHD (Sagvolden et al., 2005; Sonuga-Barke, 2003), greater TD in adults with ADHD in comparison with controls was expected. One plausible explanation for the absence of effect is that there are too few studies to reliably estimate TD in adults (n = 6). Indeed, the examination of CIs for TD, RL, and Risk show that TD has relatively large CIs that overlap largely especially with those for Risk. A second possible explanation might be that adults with ADHD have learned through experience strategies to cope with their propensity to strongly discount future rewards. Although this seems unlikely given that adults with ADHD have difficulties in learning through experiences, as seen here with deficits in the RL sub-domain. Last, the tests used to study TD might not be sufficiently adapted to an adult population, and therefore not be able to reliably estimate the amount of TD in adults. Although this meta-analysis supports the hypothesis that DM is impaired in adults with ADHD, it is difficult to say to which extent and in which sub-domain the largest impairment lies with currently relatively few studies in each sub-domain.
When it comes to attention deficits, measured with the CPT, commission errors, omission errors, and RT variance have the largest ES at g = 0.410, 0.408, and 0.405, respectively. This indicates that ADHD patients have difficulties both with maintaining constant attention over longer time spans and with inhibiting prepotent responses, which fits well with current theories on ADHD (Tripp & Wickens, 2008). This result supports the conclusions of Willcutt et al. (2005) that response inhibition (measured by CPT omissions) shows some of the strongest and most consistent results in ADHD, where patients with ADHD show difficulties with inhibition. The results do not indicate robust differences in mean RT’s (g = −0.088) between adults with ADHD and their peers, which might explain the growing interest in RT variability instead. The CPT sensitivity measure also lacks an effect (g = 0.25) that distinguishes ADHD from controls. However, it is difficult to conclude a definite lack of effect, as only few studies have reported sensitivity measures.
The parameters extracted from the EZ DDM analysis indicate that adults with ADHD tend to solve the speed-accuracy trade-off in a different way than controls. Our result is consistent with the report of Huang-Pollock et al. (2012), who found that children with ADHD have slower processing speed than their peers. Hence, slower processing speed, as indicated by a lower drift rate, is likely a characteristic of both adults and children with ADHD. Contrary to Huang-Pollock et al. (2012), the current study found that adults with ADHD have a somewhat higher boundary separation than healthy controls. This does not imply that adults with ADHD are less impulsive than healthy controls, because the boundary separation has to be evaluated in context of the drift rate. The finding that adults with ADHD still make more errors than controls, despite their higher boundary separation, suggests that they solve the trade-off between speed and accuracy of response in favor of speed, like children with ADHD (Huang-Pollock et al., 2012). Still, the marked difference between adult and children with ADHD appears to be that only adults with ADHD attempt to counteract their lower processing speed by setting a higher response criterion, even if this adaptation is not sufficient to reduce error rates to the level of healthy controls.
Interestingly, the effects of slower processing speed and higher cautiousness (g = −1.62 and g = 0.9, respectively) are stronger than the effects of traditional outcome measures for the CPT. It is possible that the strength of these effects is due the integration of response time and accuracy data, which allows estimations of specific neurocognitive or psychological mechanisms underlying task performance. Whereas simple effects of response errors are relatively small because participants can compensate for lower processing speed by accepting slower response times, estimates of purer underlying cognitive measures can reveal greater effects. As these results are promising, yet are found based on only nine studies, future research in DM and attention should further investigate the use of mathematical models, such as the DDM (Ratcliff & McKoon, 2008). These models can help elucidate the underlying mechanisms that are aberrant in ADHD and are potentially of high value to confirm diagnosis and measure treatment effects.
Conclusion
When compared with healthy peers, adults with ADHD have attentional and DM deficits of similar magnitude. The empirical findings of DM deficits fit well with reports of life outcomes for patients with ADHD, where ADHD patients report negative life events associated with poor decisions (Fredriksen et al., 2014; Halmøy, Fasmer, Gillberg, & Haavik, 2009). Moreover, the clear deficits in reward-based DM support Willcutt et al.’s (2005) conclusion that deficits in executive functioning are neither necessary nor sufficient to cause all cases of ADHD. Still, for now, these conclusions are based on a relatively small number of studies. More research involving cognitive and DM tasks is needed to solidify the understanding of DM and cognition in adults with ADHD. In the area of DM, one important goal should be the development of tasks that reliably assess risky DM and TD for adult ADHD. Although computational modeling of cognitive and DM tasks is still in its infancy, it promises to be a useful approach to further the understanding of ADHD symptoms. By uncovering their underlying neurocognitive mechanisms, computational modeling can in turn be the basis for development of new diagnostic and treatment approaches.
Footnotes
Declaration of Conflicting Interests
The author(s) declared no potential conflicts of interest with respect to the research, authorship, and/or publication of this article.
Funding
The author(s) disclosed receipt of the following financial support for the research, authorship, and/or publication of this article: Norwegian Research Council, #143660; University of Oslo, Department of Psychology.

Author Biographies
References
Supplementary Material
Please find the following supplemental material available below.
For Open Access articles published under a Creative Commons License, all supplemental material carries the same license as the article it is associated with.
For non-Open Access articles published, all supplemental material carries a non-exclusive license, and permission requests for re-use of supplemental material or any part of supplemental material shall be sent directly to the copyright owner as specified in the copyright notice associated with the article.
