



Abstract
Introduction
Attention-deficit/hyperactivity disorder (ADHD) is a common childhood-onset neurodevelopmental disorder characterized by developmentally inappropriate levels of inattention and hyperactivity or impulsivity. The worldwide prevalence of ADHD in children is 2.6%–4.5% (Polanczyk et al., 2015), and the overall prevalence among children and adolescents in China is 5.4%–7.2% (Wang et al., 2017). Without prompt treatment in the early stages, 50%–80% of cases may persist into adulthood (Asherson et al., 2016; Volkow & Swanson, 2013) or beyond (Michielsen et al., 2012).
ADHD is highly heritable and multifactorial and is generally considered to be the result of environmental and genetic interactions (Thapar & Cooper, 2016). Familial, twin, and adoption studies have demonstrated a strong genetic component in the pathogenesis of ADHD, with a heritability ranging from 60% to 90% (Gallo & Posner, 2016). Specific single dopaminergic, noradrenergic, and serotonergic candidate genes have been significantly associated with ADHD status (Faraone et al., 2005; Gizer et al., 2009). However, genome-wide association studies (GWASs) have not yielded many genome-wide significant findings. Recently, a GWAS meta-analysis of ADHD identified the first genome-wide significant risk loci; several of the loci are located in or near genes implicated in neurodevelopmental mental processes that are likely to be associated with ADHD, including SORCS3, DUSP6, and FOXP2 (Demontis et al., 2019).
Although most ADHD molecular genetic studies have focused on catecholamine dysregulation, the involvement of the glutamatergic system in the pathophysiology and treatment of ADHD has also been emphasized (Huang et al., 2019). The concentration of glutamate in the anterior cingulate cortex is positively correlated with the score of impulsive symptoms (Ende et al., 2016). Glutamate is the major excitatory neurotransmitter in the central nervous system and mediates the effects of adjacent neurons by binding to metabolic glutamate receptors (mGluRs) or ionotropic glutamate receptors (iGluRs). iGluRs are subdivided into N-methyl-D-aspartate (NMDA), α-amino-3-hydroxy-5-methyl-4-isoxazolepropionic acid (AMPA), kainate (KA), and orphan receptors, which are involved in important neurophysiological processes, such as synaptic transmission, neuromodulation, and synaptic plasticity. Moreover, iGluRs are essential for maintaining a balance between tonic and phasic dopaminergic neurotransmission, which may have important implications for disorders of dopamine dysregulation such as ADHD (Tye et al., 2013).
Candidate gene studies have indicated that genetic variants of GRIN2B and GRIN2A conferred an increased susceptibility to attentional impairment in ADHD patients (Kim et al., 2016). GWASs conducted in the European population have implied that GRIK1, GRIK4, and GRID2 might be involved in the susceptibility and related clinical symptoms of ADHD (Hinney et al., 2011; Lasky-Su et al., 2008; Stergiakouli et al., 2012). The glutamate gene set, including those that code for the iGluRs, has been implicated with the severity of hyperactivity/impulsivity (Naaijen et al., 2017). In addition, clinical pharmacology studies have shown that GRIN2B played an important role in the treatment of ADHD with methylphenidate (MPH; Kim et al., 2017), which was the most commonly prescribed first-line agent of ADHD. N-methyl-D-aspartate receptor (NMDAR) antagonist, memantine, might improve the symptoms of inattention and hyperactivity (Surman et al., 2013).
ADHD rat models have demonstrated dysfunction of iGluRs in the prefrontal cortex (Lehohla et al., 2004), which implies changes in the expression of iGluR genes, such as GRIN1, GRIA1, GRIN2C, GRIA2, and GRIN3A (DasBanerjee et al., 2008; Dela Peña et al., 2015; Diana et al., 2015). In addition, AMPA receptors (AMPARs) interact with dopamine receptor D4 (DRD4) to maintain regular glutamatergic transmission (Yuen et al., 2010, 2013), and the genetic variation of DRD4 has been widely recognized as an important mechanism in the risk of ADHD (Naumova et al., 2019).
Although an increasing number of researchers are shifting attention to the role of the glutamatergic system in the pathophysiological processes of ADHD, no relevant studies have explored the association between iGluRs and ADHD susceptibility in the Chinese population. Therefore, the aim of this study is to comprehensively explore the association of iGluR genetic polymorphisms with ADHD risk and clinical symptoms in a two-stage case–control study.
Materials and Methods
Study Participants
A total of 869 children with ADHD and 967 healthy control children were enrolled in the study using a two-stage case–control design. Based on the Diagnostic and Statistical Manual of Mental Disorders (4th ed.; DSM-IV; American Psychiatric Association, 1994) diagnostic criteria, clinical interviews with at least one guardian were conducted by a trained child psychiatrist. In the discovery stage, 411 children newly diagnosed with ADHD were recruited from Hunan Children’s Hospital between July 2012 and June 2016, and 450 controls were enrolled among ADHD-free children from the same hospital by a screening program during the same period. In the validation stage, 458 cases and 517 controls were recruited from Wuhan Medical and Health Center for Women and Children between July 2016 and September 2018 according to the same inclusion method as the first stage. Participants who met the following criteria were included: (a) age between 6 and 16 years; (b) ethnic Han Chinese origin; (c) no history of neuropsychiatric diseases (such as intellectual disabilities, autism spectrum disorder [ASD], major depressive disorders, bipolar disorder, substance dependence, or any psychotic spectrum disorder); and (d) no history of psychostimulant or other psychiatric drug use.
The Ethics Committees of Tongji Medical College of Huazhong University of Science and Technology, Hunan Children’s Hospital, and Wuhan Medical and Health Center for Women and Children approved this study protocol. All procedures performed in studies involving human participants were in accordance with the ethical standards of the institutional and/or national research committee and with the 1964 Helsinki declaration and its later amendments. We informed the parents of each participant of the purpose of the study, and written informed consent was obtained from them.
Clinical Symptom Assessment
The Swanson, Nolan, and Pelham version IV (SNAP-IV) scale (Costa et al., 2019) is a 26-item questionnaire that is widely used for the assessment and classification of ADHD symptom severity. Of the 26 items, 18 are associated with ADHD symptoms (nine for inattention and nine for hyperactivity/impulsivity), and parents rated their children’s inattentive and hyperactive/impulsive symptoms using a 4-point Likert-type scale ranging from 0 (not at all) to 3 (very much). We used the average score for each dimension to evaluate the severity of the symptoms.
The Integrated Visual and Auditory Continuous Performance Test (IVA-CPT) is a common instrument for assessing continuous attention. It is used not only as an important auxiliary diagnostic method for ADHD but also to evaluate treatment efficacy (Moreno-Garcia et al., 2015). This study used the Full-Scale Attention Quotient (FAQ) and Full-Scale Response Control Quotient (FRCQ) to evaluate the attentional deficits and response control, respectively, of the participants.
Candidate Genes and Single Nucleotide Polymorphism Selection
First, GeneCards are used to screen ADHD genes with a cut-off score of ≥10, and we used GeneCards (https://www.genecards.org/) to query the genes associated with ADHD and found GRIN2B and GRIN2A. Second, we screened top 25 iGluRs genes ordered by significant in GWASs, with p-value less than 10-5. GRIK4 (p = 4.0 × 10⁻⁵), GRIK1 (p = 3.9 × 10⁻⁶), and GRID2 (p = 2.1 × 10⁻⁵) were included in the study, based on the results of the GWASs (Hinney et al., 2011; Lasky-Su et al., 2008; Stergiakouli et al., 2012). Finally, we screened five genes: GRIN2A, GRIN2B, GRIK1, GRIK4, and GRID2.
We obtained single nucleotide polymorphisms (SNPs) of the target genes located in the promoter region (5′ near gene), non-coding region (5′UTR, 3′UTR), and exon region (missense, nonsynonymous) from the NCBI-dbSNP database (http://www.ncbi.nlm.nih.gov/snp/) and excluded SNPs with a minor allele frequency (MAF) < 0.1 in Han Chinese in Beijing China (CHB) based on the 1000 Genomes database (https://www.ncbi.nlm.nih.gov/variation/tools/1000genomes/). Second, combined with the SNPs filtered from dbSNP database, SNPs with disease susceptibility were labeled by consulting relevant literature, and functional SNPs were screened by accessing the SNPinfo web server (https://snpinfo.niehs.nih.gov/). The SNPs selected should meet at least any two of the criteria described above. Furthermore, SNPs that were reported to be positively associated with ADHD were also included in the study (Supplemental Table S1). Based on the above screening steps (Supplemental Figure S1), we finally selected 12 SNPs (Supplemental Table S2). Linkage disequilibrium (LD) analysis for the selected SNPs was performed using PLINK. The maximum r2 value was 0.23, and the rest were less than 0.1.
DNA Extraction and Genotyping
According to the manufacturer’s instructions, genomic DNA was extracted from peripheral blood samples (2 mL) using the Relax Gene Blood DNA System DP319-02 (Tiangen, Beijing, China). The concentration and purity of the DNA were determined with a spectrophotometer before genotyping was performed with the MassARRAY and iPlex systems of the Sequenom genotyping platform (Sequenom, San Diego, CA, USA). Genotyping was performed by experimenters blinded to the status of the participants. The process of genotyping is described in detail in a previous study (Gu et al., 2018).
In the discovery stage, we genotyped the 12 SNPs included in the study. In the validation stage, we genotyped the positive SNPs found in the discovery stage.
In Silico Analysis and Expression Quantitative Trait Locus Analysis
To evaluate whether the promising SNPs harbored regulatory elements, in silico analysis was performed with various website resources. First, the significant SNP functions were evaluated roughly though the SNPinfo database. Then, a particular database was used to perform specific functional predictions again. Specifically, for SNPs with a splicing function, we used the Human Splicing Finder V3.1 web server (http://www.umd.be/HSF3/index.html) and the ESEfinder database (http://krainer01.cshl.edu/cgi-bin/tools/ESE3/esefinder.cgi) to predict their specific splicing effects on pre-RNA.
Expression quantitative trait locus (e-QTL) is a locus that explains a fraction of the genetic variance of a gene expression phenotype, and e-QTL analysis is a feasible and effective strategy to explore the biological mechanism of SNPs in non-coding regions. BRAINEAC is a web-resource to access the U.K. Brain Expression Consortium dataset, which consists of genotypes and gene expression data of 10 brain areas (cerebella cortex, putamen, thalamus, occipital cortex, medulla, frontal cortex, temporal cortex, hippocampus, substantia nigra, intralobular white matter) of 134 neuropathologically normal donors. To evaluate the potential association between the positive SNPs and the expression of their nearby genes in the human brain, we used the data provided by the BRAINEAC database (https://caprica.genetics.kcl.ac.uk/BRAINEAC/) to conduct e-QTL analysis.
Statistical Analysis
Group differences in demographic characteristics (sex, age, IQ, BMI) were computed using Pearson’s χ2 test or t-test. The Hardy–Weinberg equilibrium (HWE) for genotypes in the control participants was assessed by a goodness-of-fit χ2 test. Binary logistic regression analysis adjusting for age and sex was employed to examine the impact of iGluR gene polymorphisms on ADHD with codominant, dominant, recessive, and additive models. The associations of ADHD clinical feature scores with SNPs were explored using analysis of variance (ANOVA) with post hoc comparisons using Dunnett’s t method. All statistical analyses were conducted using the IBM SPSS software (version 21.0; SPSS Inc., Chicago, IL, USA). Multiple comparison results were corrected by Bonferroni adjustment based on the number of comparisons. The statistical power was calculated using PASS version 15.0 (NCSS, LLC, Kaysville, UT, USA) after the study was performed.
Results
Participants’ Characteristics
The geographic characteristics for the discovery stage (450 controls and 411 ADHD) and the validation stage (517 controls and 458 ADHD) are summarized in Table 1. Briefly, no significant differences were detected for sex, age, IQ, and BMI (all p >.05) in the discovery stage or the validation stage. The proportions of inattention types, hyperactivity/impulsive types, and combined types of ADHD was 38.9%, 20.0%, and 41.1%, respectively, in the discovery stage and 45.9%, 23.1%, and 31.0%, respectively, in the validation stage. In addition, compared with the control group, the case group had lower FAQ scores and FRCQ scores and higher in-attention scores and hyperactivity/impulsive scores (p < .001).
General Characteristics of the Participants in Two-Stage Case–Control Study.

Note. The significant results are in boldface. BMI = body mass index; IQ = intelligence quotient; FAQ = Full-Scale Attention Quotient; FRCQ = Full-Scale Response Control Quotient.
Association Analysis of Candidate SNPs With ADHD Risk
The genotyping call rates for the 12 selected SNPs were all above 95%. The observed genotypes for these SNPs were in agreement with HWE in the controls (p > .05). The genotype frequency distribution of GRID2 rs1385405 was significantly different between the case and the control groups after Bonferroni adjustment in the discovery stage and the validation stage (p = .003 and p = .007, respectively). The genotype distributions of the 12 candidate SNPs in the case and control groups are shown in Supplemental Table S3.
Associations of the candidate SNPs with ADHD under different models (codominant, dominant, recessive, and additive models) are shown in Table 2. In the discovery stage, we found that GRID2 rs1385405 T/T was associated with the increased risk of ADHD in the codominant model (OR = 2.208, 95% CI = [1.387, 3.515], p = .0008) after Bonferroni adjustment. GRIN2A rs1014531 was nominally associated with increased ADHD risk under the codominant and dominant models (GA:GG, OR = 1.403, 95% CI = [1.041, 1.890], p = .026; dominant model, OR = 1.358, 95% CI = [1.021, 1.804], p = .035), but the associations were not found after Bonferroni adjustment.
Association Between Candidate SNPs and ADHD Risk.
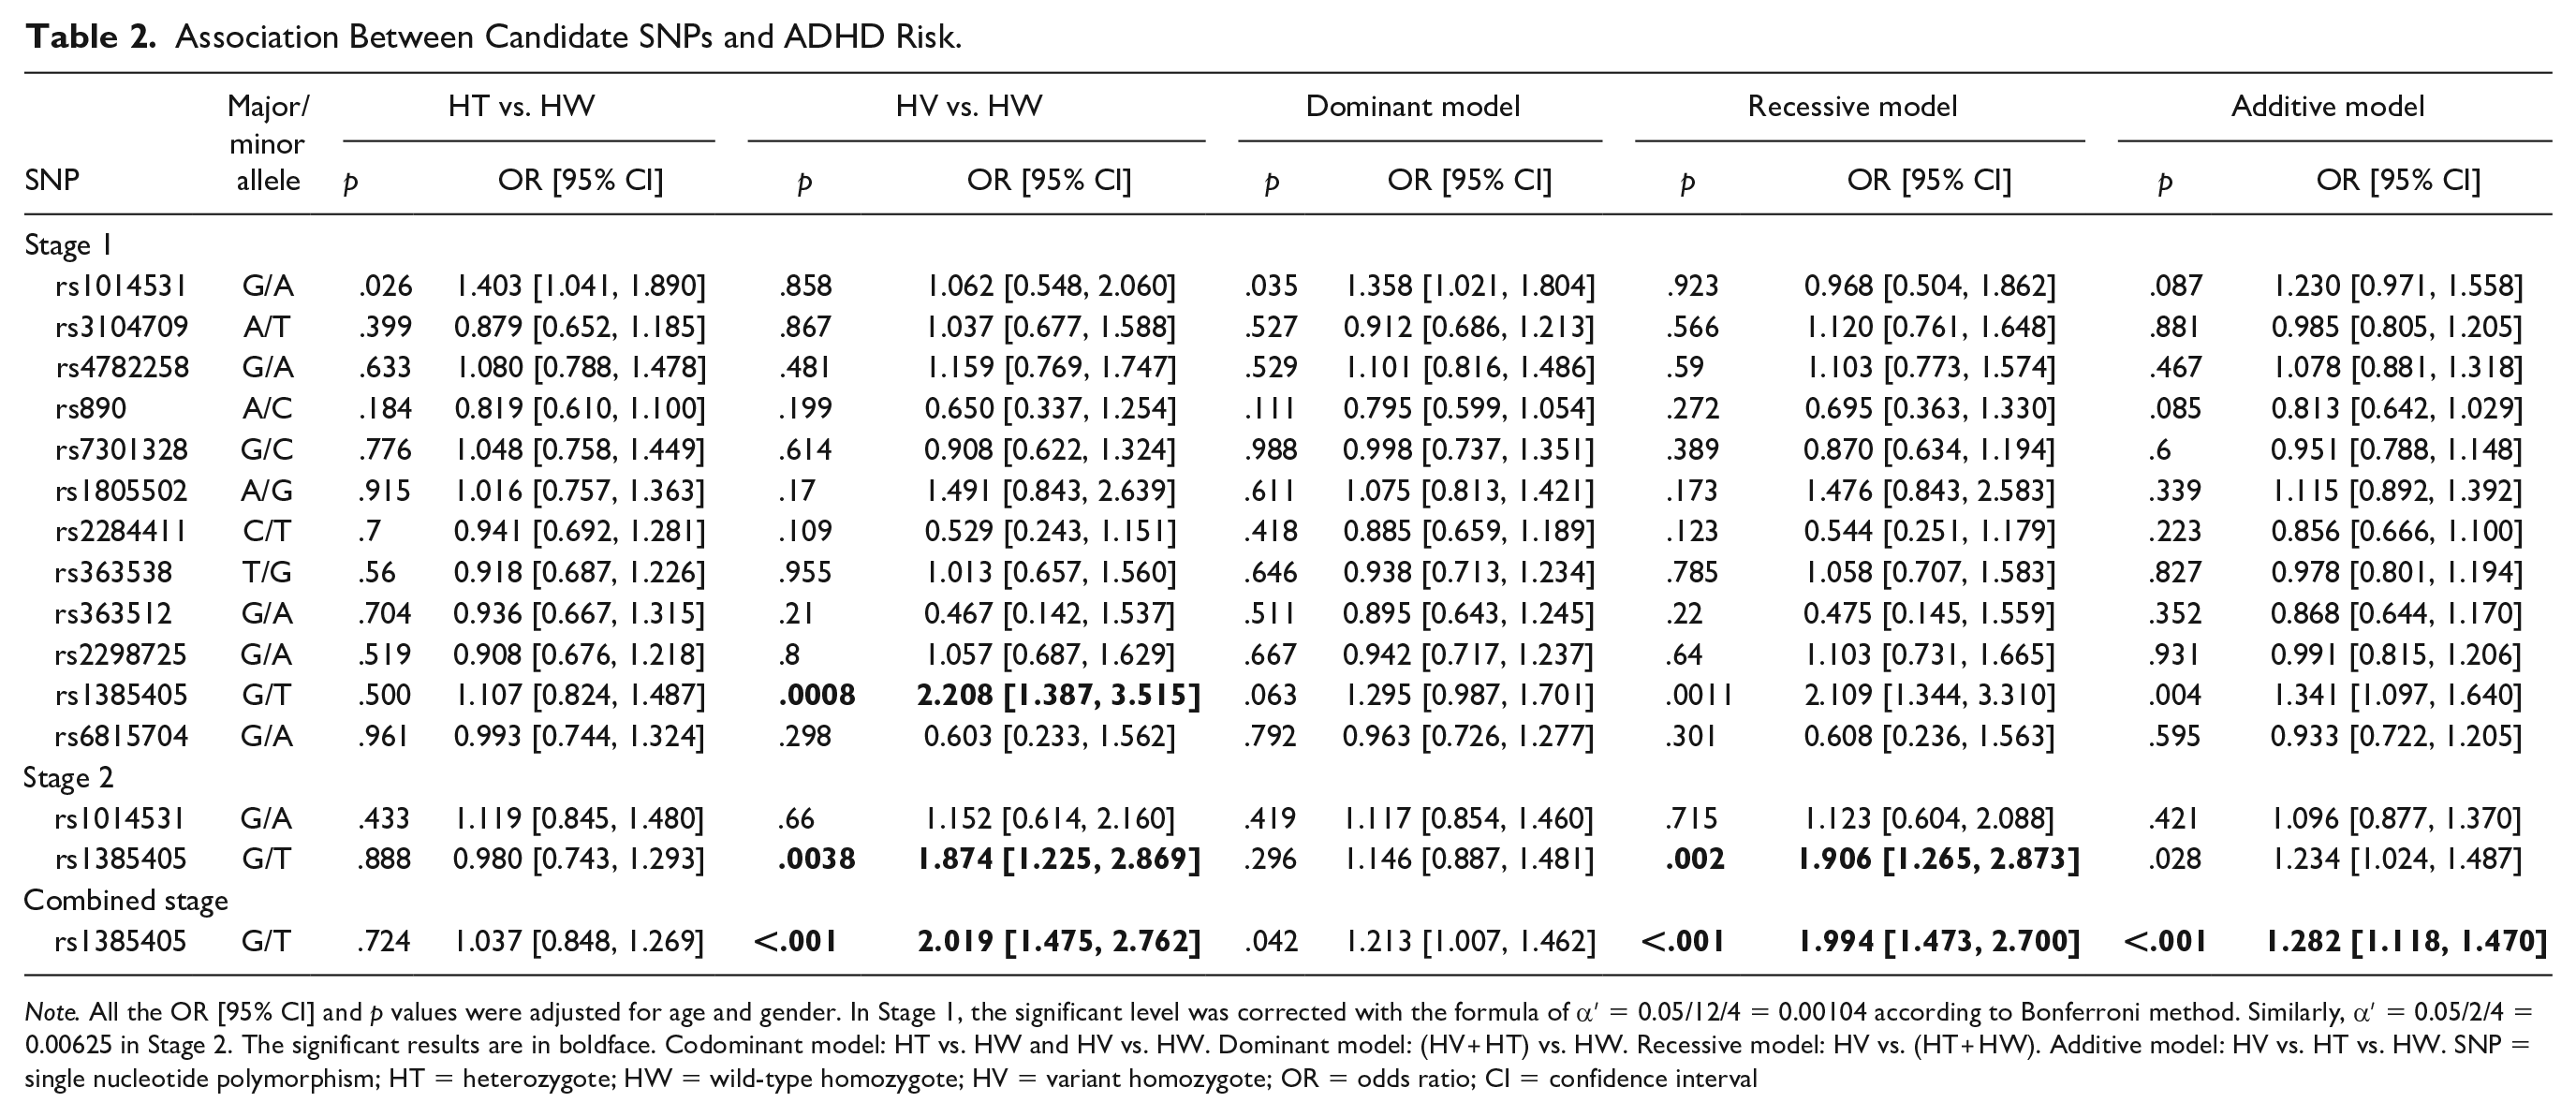
Note. All the OR [95% CI] and p values were adjusted for age and gender. In Stage 1, the significant level was corrected with the formula of α′ = 0.05/12/4 = 0.00104 according to Bonferroni method. Similarly, α′ = 0.05/2/4 = 0.00625 in Stage 2. The significant results are in boldface. Codominant model: HT vs. HW and HV vs. HW. Dominant model: (HV + HT) vs. HW. Recessive model: HV vs. (HT + HW). Additive model: HV vs. HT vs. HW. SNP = single nucleotide polymorphism; HT = heterozygote; HW = wild-type homozygote; HV = variant homozygote; OR = odds ratio; CI = confidence interval
In view of this, rs1014531 and rs1385405 were further genotyped in the validation stage, and the relationship between rs1385405 and ADHD susceptibility was verified (TT:GG, OR = 1.874, 95% CI = [1.225, 2.869], p = .0038; recessive model, OR = 1.906, 95% CI = [1.265, 2.873], p = .002). We combined the two stages together for analysis and found that rs1385405 T/T was consistently associated with an increased risk for ADHD (TT:GG, OR = 2.019, 95% CI = [1.475, 2.762], p < .001; recessive model, OR = 1.994, 95% CI = [1.473, 2.700], p < .001; additive model, OR = 1.282, 95% CI = [1.118, 1.470], p < .001).
We calculated the power based on the positive correlation SNPs in this study. For significant SNP rs1385405 (MAF = 0.316 in CHB), the powers that detect an OR of 1.8 in the first stage and second stage were 0.98 and 0.99, respectively.
Association Analysis of the Significant SNP With Clinical Symptom Assessment
To explore the relationship between GRID2 rs1385405 and clinical symptoms of ADHD, the association of rs1385405 with two comprehensive quotients (FAQ and FRCQ) in the IVA-CPT and SNAP-IV scores was assessed.
In the discovery stage, rs1385405 was associated with hyperactivity/impulsive scores (p = .012) and FAQ (p = .016); TT variant homozygote showed a higher hyperactivity/impulsive scores (p = .006) and a lower FAQ (p = .009) than the GG wild-type homozygote. In the validation stage, the association of rs1385405 with hyperactivity/impulsive symptoms was confirmed; TT variant homozygote was more susceptible to hyperactivity/impulsivity than GG wild-type homozygote (p = .010). Besides, we found that rs1385405 was associated with attention-deficit and hyperactivity/impulsive symptoms (p < .0125) in combined stage, and detailed results are presented in Table 3.
Association Between rs1385405 and ADHD Clinical Characteristic Scores.
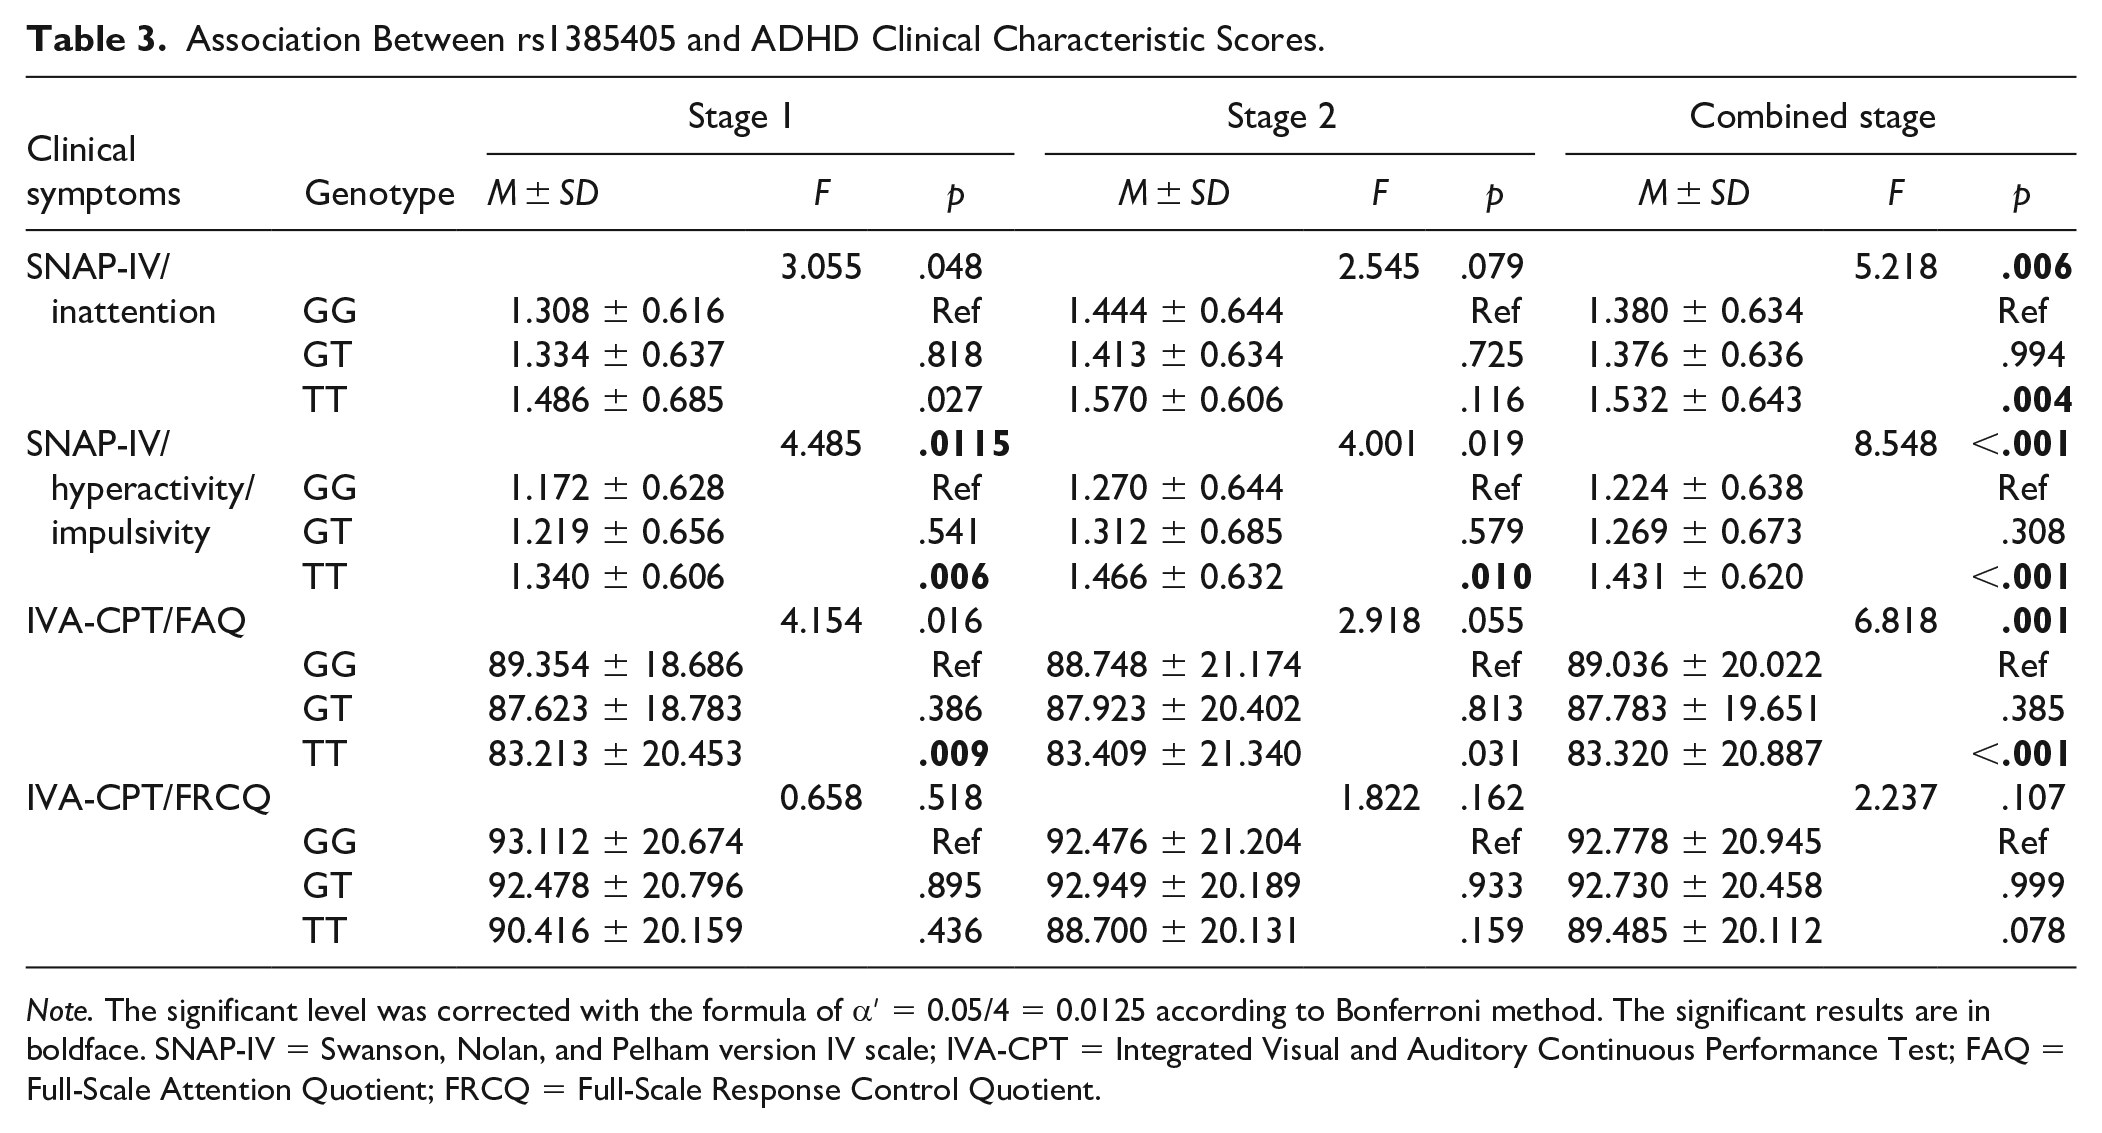
Note. The significant level was corrected with the formula of α′ = 0.05/4 = 0.0125 according to Bonferroni method. The significant results are in boldface. SNAP-IV = Swanson, Nolan, and Pelham version IV scale; IVA-CPT = Integrated Visual and Auditory Continuous Performance Test; FAQ = Full-Scale Attention Quotient; FRCQ = Full-Scale Response Control Quotient.
In Silico Splicing Analysis for the Significant SNP
We predicted that rs1385405 had the function of splicing through the SNPinfo database (Supplemental Table S2). Then, using the Human Splicing Finder web server to query, it was found that the sequence containing the rs1385405 T allele could improve the splicing efficiency as an enhancer motif binding to SC35 or SRp40 (values 89.61 and 81.02, thresholds 75.05 and 78.08, respectively). In addition, the sequence containing the rs1385405 T allele also had the potential to reduce splicing efficiency as a silence motif, but with a value of 60.16, which is close to the threshold (60). Taken together, we speculated that the sequence containing the rs1385405 T allele was more prone to improve splicing efficiency as an exonic splicing enhancer (ESE).
We used the ESEfinder database to explore the effect of rs1385405 on pre-mRNA, and the results of the scores of the rs1385405 G allele and T allele sequences interacting with the SR proteins are shown in Tables 4 and 5, respectively. The sequence containing the G allele could bind to SC35, and the sequence containing the T allele could bind to SR35 or SRp40. We concluded that rs1385405 might change the binding of the SR protein to pre-mRNA, which might affect ESE activity.
Scores in the Sequence Containing the G Allele From ESEfinder Database.
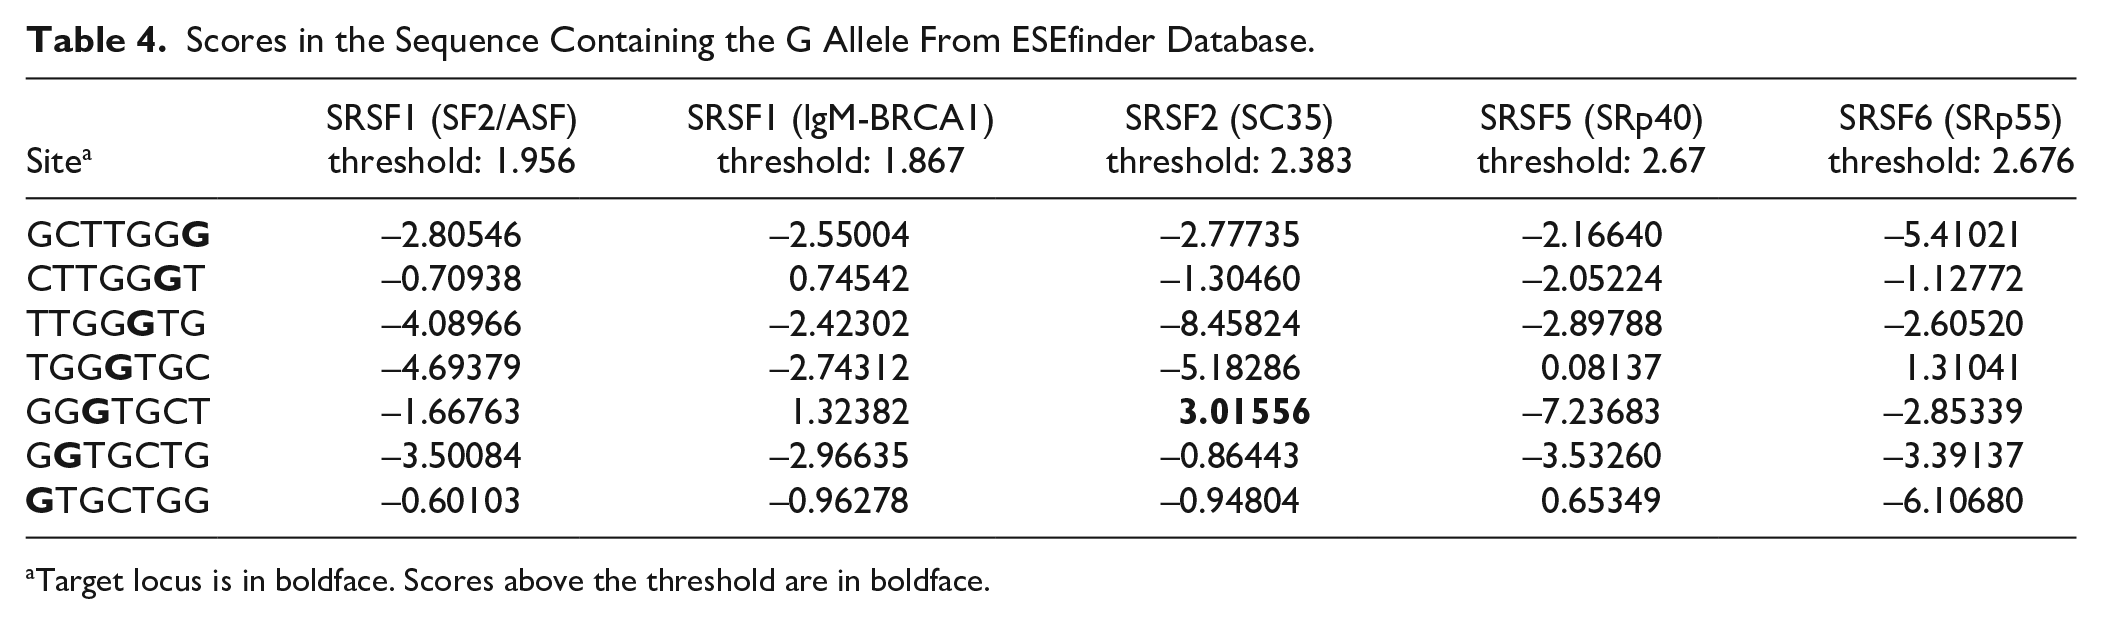
Target locus is in boldface. Scores above the threshold are in boldface.
Scores in the Sequence Containing the T Allele From ESEfinder Database.
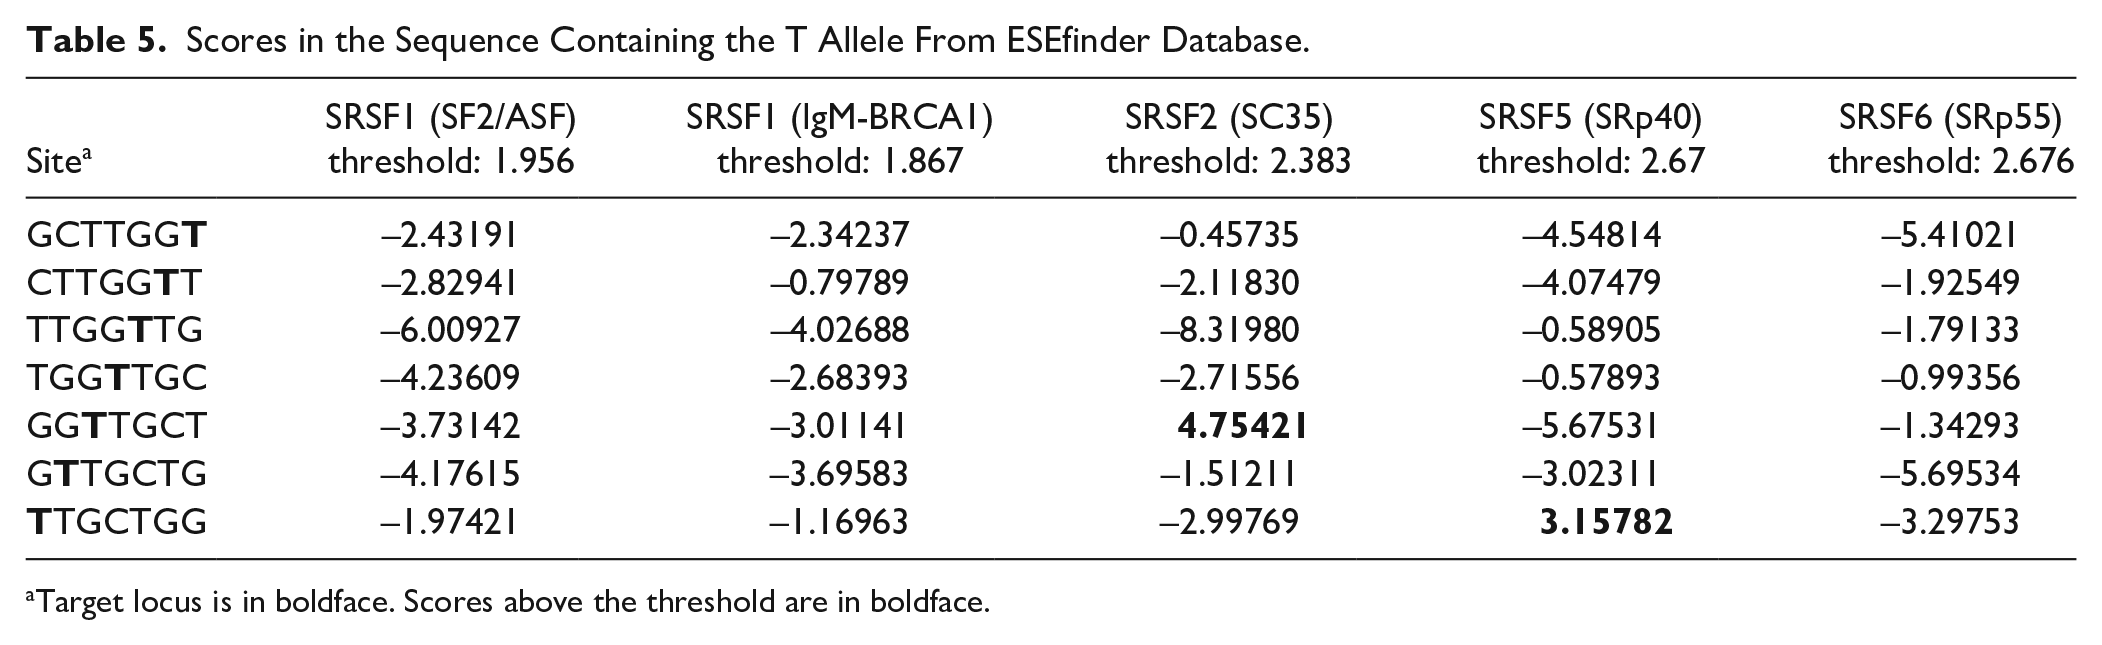
Target locus is in boldface. Scores above the threshold are in boldface.
e-QTL Analysis for rs1385405
We retrieved the available data through the BRAINEAC database for e-QTL analysis. The results showed that individuals carrying rs1385405-G had higher GRID2 mRNA expression than rs1385405-T carriers in the frontal cortex with 14 different probes (p < .05); among them, six p-values were less than .01 (p = .0033, .083, .0098, .0028, .0015, and .0011, respectively), as shown in Figure 1.

Association of rs1385405 with GRID2 expression in the frontal cortex in the BRAINEAC database.
Discussion
In our study, we comprehensively investigated the association between ionotropic glutamate receptor gene polymorphisms and ADHD susceptibility in a two-stage case–control study in the Chinese population for the first time. We found that GRID2 rs1385405 T/T was associated with the increased risk of ADHD and was associated with hyperactivity/impulse and inattention symptoms. Bioinformatics analysis showed that rs1385405 interfered with ESE activity, and e-QTL analysis demonstrated that rs1385405 affected GRID2 gene expression in the frontal cortex.
There was no association between GRIN2A, GRIN2B, GRIK1, and GRIK4 polymorphisms and ADHD in our study. Similarly, Kim et al. (2017) did not find a relationship between GRIN2A and ADHD. However, Turic et al. (2004) and Kim et al. (2016) reported that GIRN2A might confer an increased risk for ADHD and be associated with attention problems in ADHD patients. In addition, some studies have suggested that GRIN2B is implicated in the risk of ADHD (Dorval et al., 2007; Kim et al., 2016, 2017). For GRIK1 and GRIK4, GWASs suggested that they might be associated with the risk of ADHD (Hinney et al., 2011; Lasky-Su et al., 2008). A potential explanation for the inconsistent correlation results may be partly due to differences in the allele frequencies among people of different races.
Some studies have investigated the relationship between GRID2 gene and ADHD in other populations. Stergiakouli et al. (2012) conducted a GWAS with 727 Caucasian children with ADHD and 5,081 comparison participants in 2012, which provided preliminary evidence that GRID2 rs6815704 might be associated with the risk of ADHD albeit below GWAS significance (p = 2.09 × 10⁻⁵); we failed to replicate the reported association. This might be due to the differences in the allele frequencies and LD patterns among populations. Moreover, the GRID2 rs1385405 was absent in significant GWAS results. Rs1385405 and rs6815704 are located on the exon 9/16 and intron 1/16 of the GRID2, respectively, non-LD. Using the Psychiatric Genomics Consortium (PGC) database (https://www.med.unc.edu/pgc/results-and-downloads/adhd/), we found that the smallest p-values of GRID2 were 1.29 × 10⁻⁵ that did not reach the GWAS significance as many other significant candidate genes did (Demontis et al., 2019). However, the GWAS was conducted in the European people while our research was based on Chinese Han population, so we will verify our results in different genetic ancestry in future research. Although no SNP of GRID2 passed the rigorous significant level in GWASs, a GWAS meta-analysis of ADHD indicated that neurodevelopmental processes were likely to be associated with ADHD (Demontis et al., 2019), which suggested that GRID2 gene important for synapse formation and long-term depression (Kakegawa et al., 2008) might be relevant to ADHD.
GRID2 maps to chromosome 4q22.1-22.2 and codes for the glutamate receptor δ2 (GluRD2) protein, which is a multi-pass membrane protein and consists of two extracellular domains, an amino-terminal (ATL) and a ligand binding domain (LBD). GRID2 is expressed exclusively at postsynaptic site and is involved in a retrograde signaling pathway that modifies the presynaptic release probability (Kakegawa et al., 2008). It is mostly expressed in the brain regions throughout the lifespan of an individual, with detectable concentrations in the cerebellum, anterior cingulate cortex, caudate, frontal cortex, hippocampus, and putamen, all of which have been implicated in ADHD (Bauer et al., 2018; Dang et al., 2016; Hoogman et al., 2017; Stevens & Haney-Caron, 2012).
Using HaploReg as a tool for systematically mining these chromatin state data, along with conservation data and regulatory motif alterations (Ward & Kellis, 2012), we identified that rs1385405 was located in the region containing the enhancer histone marks of H9 Derived Neuronal Progenitor Cultured Cells and would change regulatory motifs for pax-6, and the role of Pax genes in the process of neurodevelopment (Thompson & Ziman, 2011) supported a functional role for rs1385405 in neuropsychiatric disorders. In addition, the e-QTL analysis showed that the expression level of GRID2 of carriers of the rs1385405 T allele was lower than that of carriers of the G allele in the frontal cortex, and studies have confirmed that the frontal cortex is involved in the pathogenesis of ADHD (Hoogman et al., 2019). The frontal cortex is a glutamate-rich brain region, and deficits in this area cause poor impulse control, distractibility, hyperactivity, and poor organization and planning (Stuss & Levine, 2002), which is consistent with our result that rs1385405 was associated with hyperactivity and distractibility symptoms. Hence, we speculated that decreased expression of GRID2 in the frontal cortex might be one of the reasons for the increased risk of ADHD, possibly through regulation of alternative splicing or instead containing another functional variant responsible for alterations in GRID2 expression or function.
In addition, we suspected that GRID2 might be involved in the pathogenesis of ADHD through its biological function in the cerebellum. GRID2 is selectively and highly expressed in cerebellar Purkinje cell (Jeromin et al., 1996). Indeed, the cerebellum was involved in the pathogenesis of ADHD, which was confirmed by numerous studies (Bruchhage et al., 2018; Goetz et al., 2017; Stoodley, 2016). The homozygous deletion of the GRID2 gene was associated with cerebellar atrophy, development delay (Ali et al., 2017; Taghdiri et al., 2019; Utine et al., 2013); patients with bilateral cerebellar atrophy showed similar clinical features as ADHD patients, such as hyperactivity and distraction, and ADHD symptoms significantly improved with methylphenidate treatment, which is a common drug for ADHD patients (C. Chang & Siao, 2016). In addition, a nonprogressive loss of volume was observed in the superior cerebellar vermis in ADHD patients (Mackie et al., 2007). Moreover, GRID2 plays essential roles in facilitating cerebellar synapse organization and transmission, motor coordination, and long-term depression of parallel fiber-Purkinje cell synaptic transmission (Kakegawa et al., 2008; Kashiwabuchi et al., 1995). In addition, Vloet et al. (2010) observed disrupted functional connectivity between the frontal cortex and the cerebellum during time discrimination in the ADHD group.
As members of the iGluRs family, NMDAR and AMPAR dysfunction might be one of the potential causes of ADHD pathogenesis (J. P. Chang et al., 2014; Cheng et al., 2017; Fan et al., 2018; Medin et al., 2019), and GRID2 is critical for correcting NMDAR function and maintaining proper transmission of AMPAR signals (Kumagai et al., 2014; Yamasaki et al., 2011). In addition, dysfunction in GluRD2 is associated with a host of psychiatric phenotypes, including ASD, which shares 50%–70% of its contributing genetic factors with ADHD (Kalkan et al., 2016; Pinto et al., 2014; Rommelse et al., 2010), obsessive–compulsive disorder (OCD) (Khramtsova et al., 2019), and schizophrenia endophenotypes (Greenwood et al., 2016). Furthermore, risperidone was combined with methylphenidate to treat ADHD with comorbidities, such as conduct disorder and oppositional defiant disorder (Gadow et al., 2014; Masi et al., 2017), and the GRID2 gene was significantly associated with the response of risperidone monotherapy to psychosis in a genome-wide association analysis (Stevenson et al., 2016).
Several limitations in the study should be noted. First, the sample size should be expanded to verify the results in Chinese population. Second, functional experiments have not been carried out to verify the possible biological mechanism of rs1385405 in the pathogenesis of ADHD.
In short, our research adds new evidence for GRID2 involved in the pathogenesis of ADHD. However, the exact molecular mechanisms through which GRID2 genetic polymorphisms underlie ADHD remain to be investigated.
Conclusion
The two-stage case–control study emphasized the role of GRID2 rs1385405 in ADHD susceptibility in the Chinese Han population, and further functional experiments are needed to verify the effect of rs1385405 on pre-RNA splicing. Future studies with larger sample sizes and different ethnicities are warranted to confirm these results.
Supplemental Material
supplementary_material – Supplemental material for Association of Gene Variations in Ionotropic Glutamate Receptor and Attention-Deficit/Hyperactivity Disorder in the Chinese Population: A Two-Stage Case–Control Study
Supplemental material, supplementary_material for Association of Gene Variations in Ionotropic Glutamate Receptor and Attention-Deficit/Hyperactivity Disorder in the Chinese Population: A Two-Stage Case–Control Study by Qi Zhang, Xin Huang, Xin-Zhen Chen, Shan-Ya-Wen Li, Ting Yao and Jing Wu in Journal of Attention Disorders
Footnotes
Declaration of Conflicting Interests
The author(s) declared no potential conflicts of interest with respect to the research, authorship, and/or publication of this article.
Funding
The author(s) disclosed receipt of the following financial support for the research, authorship, and/or publication of this article: This work received funding from the National Natural Science Foundation of China (Grant No. 81773456) and the Fundamental Research Funds for the Central Universities, HUST (Grant No. 2016 YXMS218) to Dr. Jing Wu.

Supplemental material
Supplemental material for this article is available online.
Author Biographies
References
Supplementary Material
Please find the following supplemental material available below.
For Open Access articles published under a Creative Commons License, all supplemental material carries the same license as the article it is associated with.
For non-Open Access articles published, all supplemental material carries a non-exclusive license, and permission requests for re-use of supplemental material or any part of supplemental material shall be sent directly to the copyright owner as specified in the copyright notice associated with the article.
