




Abstract
Objective:
Cognitive disengagement syndrome (CDS) is characterized by inattention, under-arousal, and fatigue and frequently co-occurs with attention-deficit/hyperactivity disorder (ADHD). Although CDS is associated with cognitive complaints, its association with objective cognitive performance is less well understood.
Method:
This study investigated neuropsychological correlates of CDS symptoms among 169 adults (Mage = 29.4) referred for outpatient neuropsychological evaluation following inattention complaints. We evaluated cognitive and self-report differences across four high/low CDS and positive/negative ADHD groups, and cognitive and self-report correlates of CDS symptomology.
Results:
There were no differences in cognitive performance, significant differences in self-reported psychiatric symptoms (greater CDS symptomatology, impulsivity among the high CDS groups; greater inattention among the positive ADHD/high CDS groups; greater hyperactivity among the positive ADHD groups), significant intercorrelations within cognitive and self-report measures, nonsignificant correlations between cognitive measures and self-report measures.
Conclusion:
Findings support prior work demonstrating weak to null associations between ADHD and CDS symptoms and cognitive performance among adults.
Introduction
Cognitive disengagement syndrome (CDS; previously referred to as sluggish cognitive tempo [SCT]) is associated with symptoms of inattention and characterized by under-arousal, hypoactivity, and reduced motivation (e.g., Barkley, 2014). Proposals to change the name from SCT have existed for nearly a decade (i.e., Barkley, 2014), largely due to the stigmatizing nature of the previous name and a recent working group has proposed the current title of CDS to address this (Becker et al., 2022). CDS was initially thought to be a “pure” form of the attention-deficit/hyperactivity disorder-predominately inattentive presentation (ADHD-I) absent the hyperactive-impulsive symptoms found in other ADHD presentations (Barkley, 2001; Milich et al., 2001). However, research has since consistently demonstrated that CDS is a highly comorbid, albeit dissociable, construct from ADHD (Barkley, 2012, 2014; Becker, 2021; Becker et al., 2016). In fact, factor analytic studies of CDS and ADHD symptoms have revealed a 3-factor structure with CDS loading on a separate factor than the inattentive and hyperactive-impulsive symptoms characteristic of ADHD (Lee et al., 2014; Penny et al., 2009). Factor analytic studies of the CDS construct itself have revealed 2 to 3 subfactors typically associated with inattention, including 2-factor models of daydreaming/sleepiness and slow/sluggish/lethargy factors (e.g., Barkley, 2013; Penny et al., 2009) and 3-factor models including daydreaming/boredom, lethargy, and cognitive complaints (Smith & Suhr, 2021). However, emergence of subfactors is inconsistent across studies and most studies examining correlates of CDS do so as a unitary construct (Becker, 2021; Becker et al., 2022). Unlike ADHD-I symptoms, CDS symptoms have shown null or inverse associations with hyperactivity-impulsivity symptoms observed in the predominately hyperactive (ADHD-H) or combined (ADHD-C) presentations of ADHD (Barkley, 2014; Becker, 2021; Becker et al., 2018; Lee et al., 2014; Wåhlstedt & Bohlin, 2010), further underscoring that CDS and ADHD are dissociable constructs. However, this association is not universal, and CDS has demonstrated positive associations with hyperactivity-impulsivity symptoms among children, adolescents, and college students, though of a smaller magnitude than inattentive symptoms (e.g., Creque & Willcutt, 2021; Jarrett et al., 2017; Smith & Suhr, 2021; Willcutt et al., 2014). Although the two are distinct, ADHD and CDS co-occur at rates between 39% and 59% (Barkley, 2014). Due to their high rate of co-occurrence and the historical link between the constructs, the majority of extant CDS research has been conducted among samples with formal ADHD diagnoses and have included measurements of ADHD symptoms. A likely contributing factor is that one of the most commonly used self-report adult CDS scales is included as part of a widely used measure of adult ADHD symptoms, namely the Barkley Adult ADHD Rating Scale-4th Edition (BAARS-IV; Barkley, 2011).
CDS is also positively associated with internalizing dysfunction (e.g., anxiety and depression) as well as self-reported functional impairment and executive dysfunction above and beyond ADHD symptoms (Barkley, 2012; Becker et al., 2014; Combs et al., 2014; Jarrett et al., 2017; Kamradt et al., 2018; Leikauf & Solanto, 2017). However, unlike in children, few studies have explored CDS’s association with objective cognitive test performance in adults. This is notable because measure of CDS symptoms in adults relies primarily on subjective report, which has typically been associated with greater ratings of impairment than objective cognitive performance (e.g., Guo et al., 2021).
Significant associations have been observed between CDS symptom severity and performance on select cognitive assessments in adults, particularly within the domains of attention and processing speed (Becker et al., 2016; Jarrett et al., 2017; Kamradt et al., 2018; Smith & Suhr, 2021; Wåhlstedt & Bohlin, 2010; Willcutt et al., 2014). However, the magnitude and significance of associations have been equivocal across studies. Among adults, individuals with clinically significant CDS and ADHD demonstrated moderately poorer performance on a task of sustained attention than healthy controls (Jarrett et al., 2017). However, group differences were isolated to sustained attention, and CDS symptoms were not independently associated with task performance in any cognitive domain (Jarrett et al., 2017). Another study showed modest, non-linear differences on tasks of working memory and processing speed across individuals with ADHD grouped by minimal, moderate, or severe CDS symptoms (Kamradt et al., 2018). Among a university sample, one subfactor of CDS (daydreaming/boredom) significantly, albeit modestly, predicted working memory performance after taking into account nonverbal fluid intelligence and other CDS subfactors (Smith & Suhr, 2021). Further investigations with college students have demonstrated no association between CDS and cognitive performance (Wood et al., 2017). In contrast, there have been more significant and expansive associations between CDS and cognitive performance in the pediatric ADHD literature. For instance, CDS has demonstrated significant correlations with cognitive performance across multiple domains among children with ADHD, and it selectively predicted sustained attention after accounting for ADHD symptoms (Wåhlstedt & Bohlin, 2010). Large community samples of children with and without ADHD and clinically significant CDS symptoms yielded significant univariate associations between CDS symptoms and multiple cognitive domains, as well as unique associations with sustained attention, processing speed, and working memory (Creque & Willcutt, 2021; Willcutt et al., 2014). That said, a study examining Puerto Rican children found no association between CDS and cognitive performance (Bauermeister et al., 2012). Collectively, findings have been mixed regarding the association between CDS and objective cognitive performance in adults, with stronger associations typically found among pediatric samples. No cognitive profile or central cognitive deficit has been found to be associated with CDS (Becker et al., 2022).
Taken together, the extant literature in adults with CDS complaints suggests that CDS is reliably associated with self-reported functional deficits, although its association with cognitive performance is inconsistent, ranging from null to moderate across studies and samples. This study aimed to evaluate potential cognitive performance differences in adults across CDS and ADHD diagnostic groups and to examine neuropsychological correlates of CDS among a mixed sample of adult outpatients referred for neuropsychological assessment of reported inattention. We hypothesized that CDS symptoms would have a minimal association with objective cognitive performance and a modest to strong association with psychiatric self-reports among this sample.
Method
Participants
This cross-sectional study used archival data from 444 outpatients referred for neuropsychological evaluation services for the purposes of diagnostic clarification and treatment planning at a Midwestern academic medical center from 2014 to 2021. All patients consented to including their test scores as part of an ongoing, IRB-approved database study. The primary inclusion criterion was administration of the BAARS-IV. No formal exclusion criteria were employed, although patients were excluded if they were not administered all study variables of interest, administered fewer than two performance validity tests (PVTs), or failed one or more PVTs (see below). Patients were administered the BAARS-IV, Clinical Assessment of Attention Deficit-Adult (CAT-A; Bracken & Boatwright, 2005), California Verbal Learning Test-2nd (CVLT-II; Delis et al., 2000) or -3rd Editions (CVLT-3; Delis et al., 2017), Working Memory Index (WMI) and Processing Speed Index (PSI) of the Wechsler Adult Intelligence Scale-4th Edition (WAIS-IV; Wechsler, 2008), Trail Making Test (TMT) Parts A and B (Heaton et al., 2004; Reitan & Wolfson, 1993), and Beck Depression Inventory-2nd Edition (BDI-II; Beck et al., 1996). Validity status was established by evaluating patient performance on two or more of five PVTs: Victoria Symptom Validity Test (VSVT; Resch et al., 2021), Test of Memory Malingering Trial 1 (TOMM-T1; Tombaugh, 1996; Denning, 2012), CVLT-II Forced Choice (CVLT-II FC; Schwartz et al., 2016), Brief Visuospatial Memory Test-Revised Recognition Discrimination (BVMT-R RD; Pliskin et al., 2021; Resch et al., 2022), and Stroop Color and Word Test Word T-Score (White et al., 2020). Among the overall sample, 234 patients were missing one or more study measures and were thereby excluded from subsequent analyses. An additional 71 participants were excluded due to invalid CAT-A profiles, not being administered two or more PVTs, or failing one or more criterion PVTs. See Table 1 for demographic details for the full sample. Final determination of ADHD diagnosis was available for 163 individuals (Table 2). Validity status was determined by PVT performance and final clinician determination based on a comprehensive neuropsychological assessment. Individuals with CDS symptoms above the 92nd percentile were determined to have clinically significant CDS symptoms and included in the high CDS groups, whereas those at or below the 92nd percentile were included in the low CDS groups (n = 81; Barkley, 2011).
Descriptive Statistics for the Entire Sample.

Note. n = 169. CDS = Cognitive Disengagement Syndrome; ADHD = Attention-Deficit/Hyperactivity Disorder; CVLT = California Verbal Learning Test Trials; LDFR = California Verbal Learning Test Long Delay Free Recall z-Score; WAIS-IV PSI = Wechsler Adult Intelligence Scale-4th Ed. Processing Speed Index Score; WAIS-IV WMI = Wechsler Adult Intelligence Scale-4th Ed. Working Memory Index Score; BDI-II = Beck Depression Inventory 2nd Ed.; CAT-A = Clinical Assessment of Attention Deficit.
T-Scores have a mean of 50 and SD of 10; Standard Scores have a mean of 100 and SD of 15; z-scores have a mean of 0.0 and SD of 1.0.
Demographic Breakdown by CDS/ADHD Group.
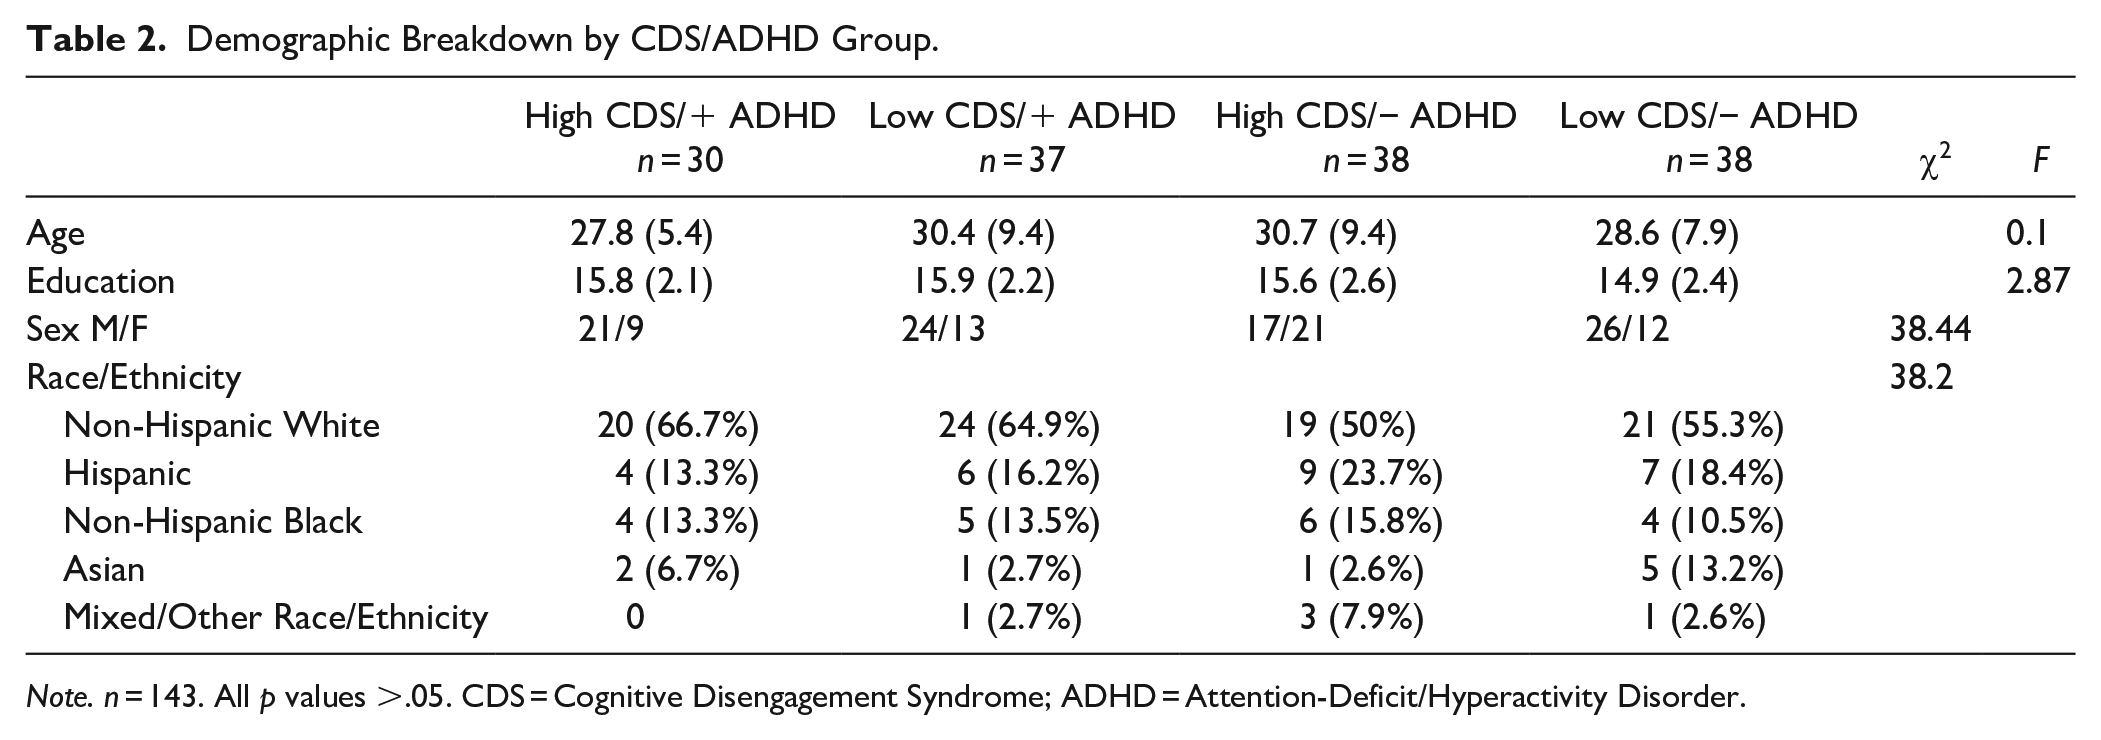
Note. n = 143. All p values >.05. CDS = Cognitive Disengagement Syndrome; ADHD = Attention-Deficit/Hyperactivity Disorder.
Measures
Barkley Adult ADHD Rating Scale-4th Ed. (BAARS-IV; Barkley, 2011)
The BAARS-IV is a 27-item self-report measure of both childhood and current ADHD symptoms and current cognitive disengagement syndrome (titled “sluggish cognitive tempo” [SCT] on the measure) symptoms based on DSM-IV criteria. Participants indicate the extent to which CDS symptoms apply to them over the past 6 months, indicating 1 for “Never or rarely,” 2 for “Sometimes,” 3 for “Often,” and 4 for “Very often.” Scores are converted to age-corrected percentile ranks. The nine-item BAARS-IV CDS scale was used in this analysis.
Clinical Assessment of Attention Deficit-Adult (CAT-A; Bracken & Boatwright, 2005)
The CAT-A is a self-report inventory of childhood and adulthood ADHD symptoms with embedded symptom validity scales (Leib et al., 2022; White et al., 2022). Participants indicate the extent to which symptoms of ADHD applied to them both during childhood and currently. Scores are converted to age-corrected T-scores. The CAT-A Current Attention, Impulsivity, and Hyperactivity scales were used in the present analyses.
The California Verbal Learning Test-2nd Editions (CVLT-II and CVLT-3; Delis et al., 2000, 2017)
The CVLT is a measure of auditory learning and memory. Participants are presented five trials of a list of words that can be grouped into semantic categories. Following a distractor list and delay, participants are asked to freely recall as many words as they can remember. Scores are converted to age-corrected T-scores (trials 1–5) or z-scores (delayed free recall). Trials 1 to 5 and delayed free recall performances were included in the present analyses.
Wechsler Adult Intelligence Scale-4th Edition (WAIS-IV; Wechsler, 2008)
The WAIS-IV is a clinical assessment of intellectual ability for adolescents and adults. It yields four index scales that are combined to form a full-scale IQ (FSIQ). Two indices are the Working Memory Index (WMI) and the Processing Speed Index (PSI). The WMI is comprised of two subtests evaluating basic and complex auditory attention. The PSI is comprised of two paper-and-pencil subtests examining visual-motor coordination and psychomotor speed. Scores on individual WAIS-IV subtests are converted to age-corrected scaled scores, which are combined to create index-level standard scores. The standard scores for WMI and PSI were included in the present analyses.
Trail Making Test (TMT; Heaton et al., 2004; Reitan & Wolfson, 1993)
The TMT is a widely used paper-and-pencil measure. TMT Part A (TMT-A) is a test of visual scanning and psychomotor speeded sequencing. TMT Part B (TMT-B) is a similar measure with an additional component of cognitive flexibility/set-shifting. Completion times are converted to scaled scores, which are then converted to race- (Black/White), sex- (Male/Female), education-corrected T-scores. T-scores for TMT A and TMT B were used in the present analyses.
Beck Depression Inventory-2nd Ed. (BDI-II; Beck et al., 1996)
The BDI-II is a widely used and validated measure of depression symptoms for individuals over the age of 13. Participants select statements that best describe their mood and well-being over the past 2 weeks. The BDI-II total score was used the present analysis.
Conners Continuous Performance Task-2nd Ed. (CPT-II; Conners, 2004)
The CPT-II is a widely used continuous performance measure. Participants are required to attend to the screen which presents varying target or non-target stimuli for an extended span of several minutes. Respondents are required to press a key in response to target stimuli and not respond to non-target stimuli. The CPT-II yields several indices related to response speed, accuracy, and variability. Data were available for Omissions (missed targets), Commissions (non-target responses), Hit Rate (response speed for correct targets), and Variability (response speed consistency) and these indices were included in the supplementary analyses (Tables 5 and 6).
Statistical Analyses
Analyses were conducted in R Studio version 2022.02.3 “Prarie Trillium” (RStudio Team, 2020). Two multivariate analyses of variance (MANOVAs) were conducted to determine whether individuals with high or low CDS and with and without a diagnosis of ADHD differed in performance across the cognitive and psychiatric variables. Groups included: high CDS/positive ADHD (Group 1), low CDS/positive ADHD (Group 2), high CDS/negative ADHD (Group 3), and low CDS/negative ADHD (Group 4). Follow-up one-way analyses of variance (ANOVAs) with Tukey’s post hoc pairwise comparisons were then conducted to determine differences in study variables across groups. 20 individuals were excluded from multivariate analyses due to missing or indeterminate ADHD diagnostic status. Familywise error rate for multiple comparisons was controlled using false discovery rate (FDR) procedure, with a 0.05 maximum FDR (Benjamini & Hochberg, 1995). Among the entire sample, bivariate Pearson correlations were used to evaluate directionality and magnitude of associations between study variables.
A supplemental MANOVA was conducted including performance on the Conners’ Continuous Performance Test-2nd (CPT-II; Conners, 2004), along with the remaining cognitive performance variables. Specifically, age-corrected T-scores for CPT Omissions, Commissions, Hit Rate, and Variability were available and included in the supplementary analysis. CPT data was not included in the primary analysis in order to preserve a larger sample size as not all participants included in the primary analysis were administered the CPT. CPT data were available for 132 total individuals and 110 individuals who had complete CDS and ADHD diagnostic data. Supplementary Pearson correlations were similarly repeated with the inclusion of the CPT variables.
Results
Descriptive statistics for the full sample and for the four diagnostic groups are available in Tables 1 and 2, respectively. Participants across the four diagnostic groups did not significantly differ in age, education, sex, or racial/ethnic background. All cognitive performance and psychiatric self-report variables were normally distributed (skewness and kurtosis absolute values <0.45 and <0.50, respectively).
The first MANOVA revealed no differences in cognitive variables across the four high/low CDS and positive/negative ADHD diagnostic groups, V = 0.02, F(1, 141) = 0.65, p = .69. Conversely, the second MANOVA revealed significant differences in psychiatric variables across the four groups, V = 0.36, F(1, 141) = 15.26, p < .001. Follow-up ANOVAs revealed significant differences in CDS, inattention, impulsivity, and hyperactivity across the four groups. See Table 2 for details on MANOVAs and follow-up pairwise comparisons.
Among the full sample, bivariate Pearson correlations (Table 4) revealed that the cognitive performance variables (rs = .20–.79) and the self-report variables (rs = .26–.52) were significantly positively intercorrelated, with two exceptions: CDS and depressive symptoms were independently uncorrelated with hyperactivity (ps > .05; Table 3). CDS and WAIS-IV PSI were the only psychiatric and cognitive performance variables that were significantly correlated, albeit modestly (r = −.17, p < .05). Correlations were repeated among individuals with confirmed ADHD, producing highly similar results.
Multivariate Analyses of Variance of Cognitive and Psychiatric Variables.

Note. n = 143. * p < .001. V = Pillai’s Trace; ηp2 = partial eta squared; CDS = Cognitive Disengagement Syndrome; ADHD = Attention-Deficit/ Hyperactivity Disorder; CVLT = California Verbal Learning Test Trials; LDFR = California Verbal Learning Test Long Delay Free Recall z-Score; WAIS-IV PSI = Wechsler Adult Intelligence Scale-4th Ed. Processing Speed Index Score; WAIS-IV WMI = Wechsler Adult Intelligence Scale-4th Ed. Working Memory Index Score; TMT A = Trail Making Test Part A T-Score; TMT B = Trail Making Test Part B T-Score; BDI-II = Beck Depression Inventory 2nd Ed. Raw Score; CAT-A = Clinical Assessment of Attention Deficit. T-Scores have a mean of 50 and standard deviation of 10; Standard Scores have a mean of 100 and standard deviation of 15; z-scores have a mean of 0.0 and standard deviation of 1.0.
Pearson Correlations Between Study Variables Among the Entire Sample.
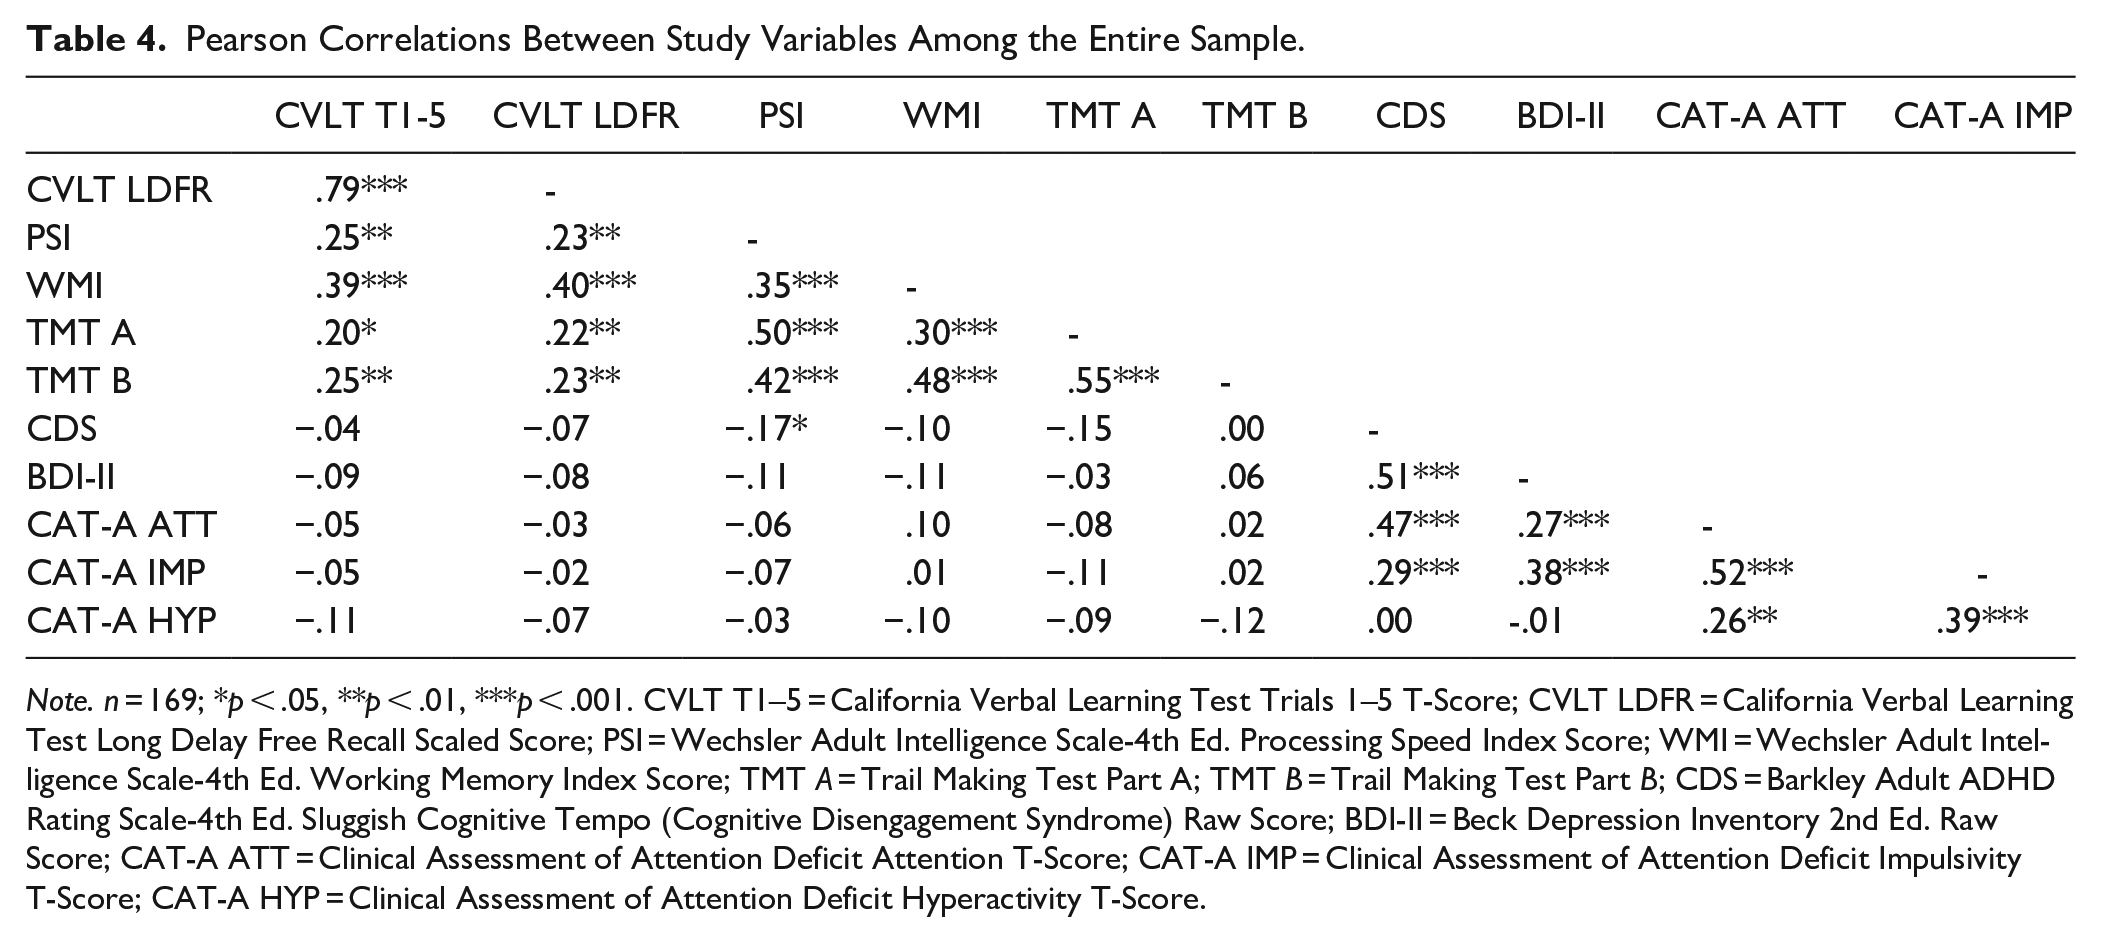
Note. n = 169; *p < .05, **p < .01, ***p < .001. CVLT T1–5 = California Verbal Learning Test Trials 1–5 T-Score; CVLT LDFR = California Verbal Learning Test Long Delay Free Recall Scaled Score; PSI = Wechsler Adult Intelligence Scale-4th Ed. Processing Speed Index Score; WMI = Wechsler Adult Intelligence Scale-4th Ed. Working Memory Index Score; TMT A = Trail Making Test Part A; TMT B = Trail Making Test Part B; CDS = Barkley Adult ADHD Rating Scale-4th Ed. Sluggish Cognitive Tempo (Cognitive Disengagement Syndrome) Raw Score; BDI-II = Beck Depression Inventory 2nd Ed. Raw Score; CAT-A ATT = Clinical Assessment of Attention Deficit Attention T-Score; CAT-A IMP = Clinical Assessment of Attention Deficit Impulsivity T-Score; CAT-A HYP = Clinical Assessment of Attention Deficit Hyperactivity T-Score.
The supplementary MANOVA conducted on the cognitive variables across diagnostic groups was similar to the results of the primary analysis (Table 5). Inclusion of the four CPT variables did not reveal any significant differences across groups, V = 0.11, F(1, 108) = 1.19, p = .30. For the supplementary correlation analysis, all cognitive variables remained intercorrelated, with select exceptions among the four CPT variables (see Table 6). The psychiatric self-report variable intercorrelations were highly similar as well. CDS was no longer correlated with WAIS-IV PSI but had a modest significant correlation with TMT-A (r = −.18, p < .05).
Supplementary Multivariate Analyses of Variance of Cognitive Variables.

Note. n = 110. All p values >.05. V = Pillai’s Trace; ηp2 = partial eta squared; CDS = Cognitive Disengagement Syndrome; ADHD = Attention-Deficit/ Hyperactivity Disorder; CVLT = California Verbal Learning Test Trials; LDFR = California Verbal Learning Test Long Delay Free Recall z-Score; WAIS-IV PSI = Wechsler Adult Intelligence Scale-4th Ed. Processing Speed Index Score; WAIS-IV WMI = Wechsler Adult Intelligence Scale-4th Ed. Working Memory Index Score; TMT A = Trail Making Test Part A T-Score; TMT B = Trail Making Test Part B T-Score; Omissions = CPT Omissions T-Score; Commissions = CPT Commissions T-Score; Hit Rate = = CPT Hit Rate T-Score; Variability = CPT Variability T-Score. T-Scores have a mean of 50 and standard deviation of 10; Standard Scores have a mean of 100 and standard deviation of 15; z-scores have a mean of 0.0 and standard deviation of 1.0.
Supplementary Pearson Correlations Between Study Variables Among the Entire Sample with Available Data.
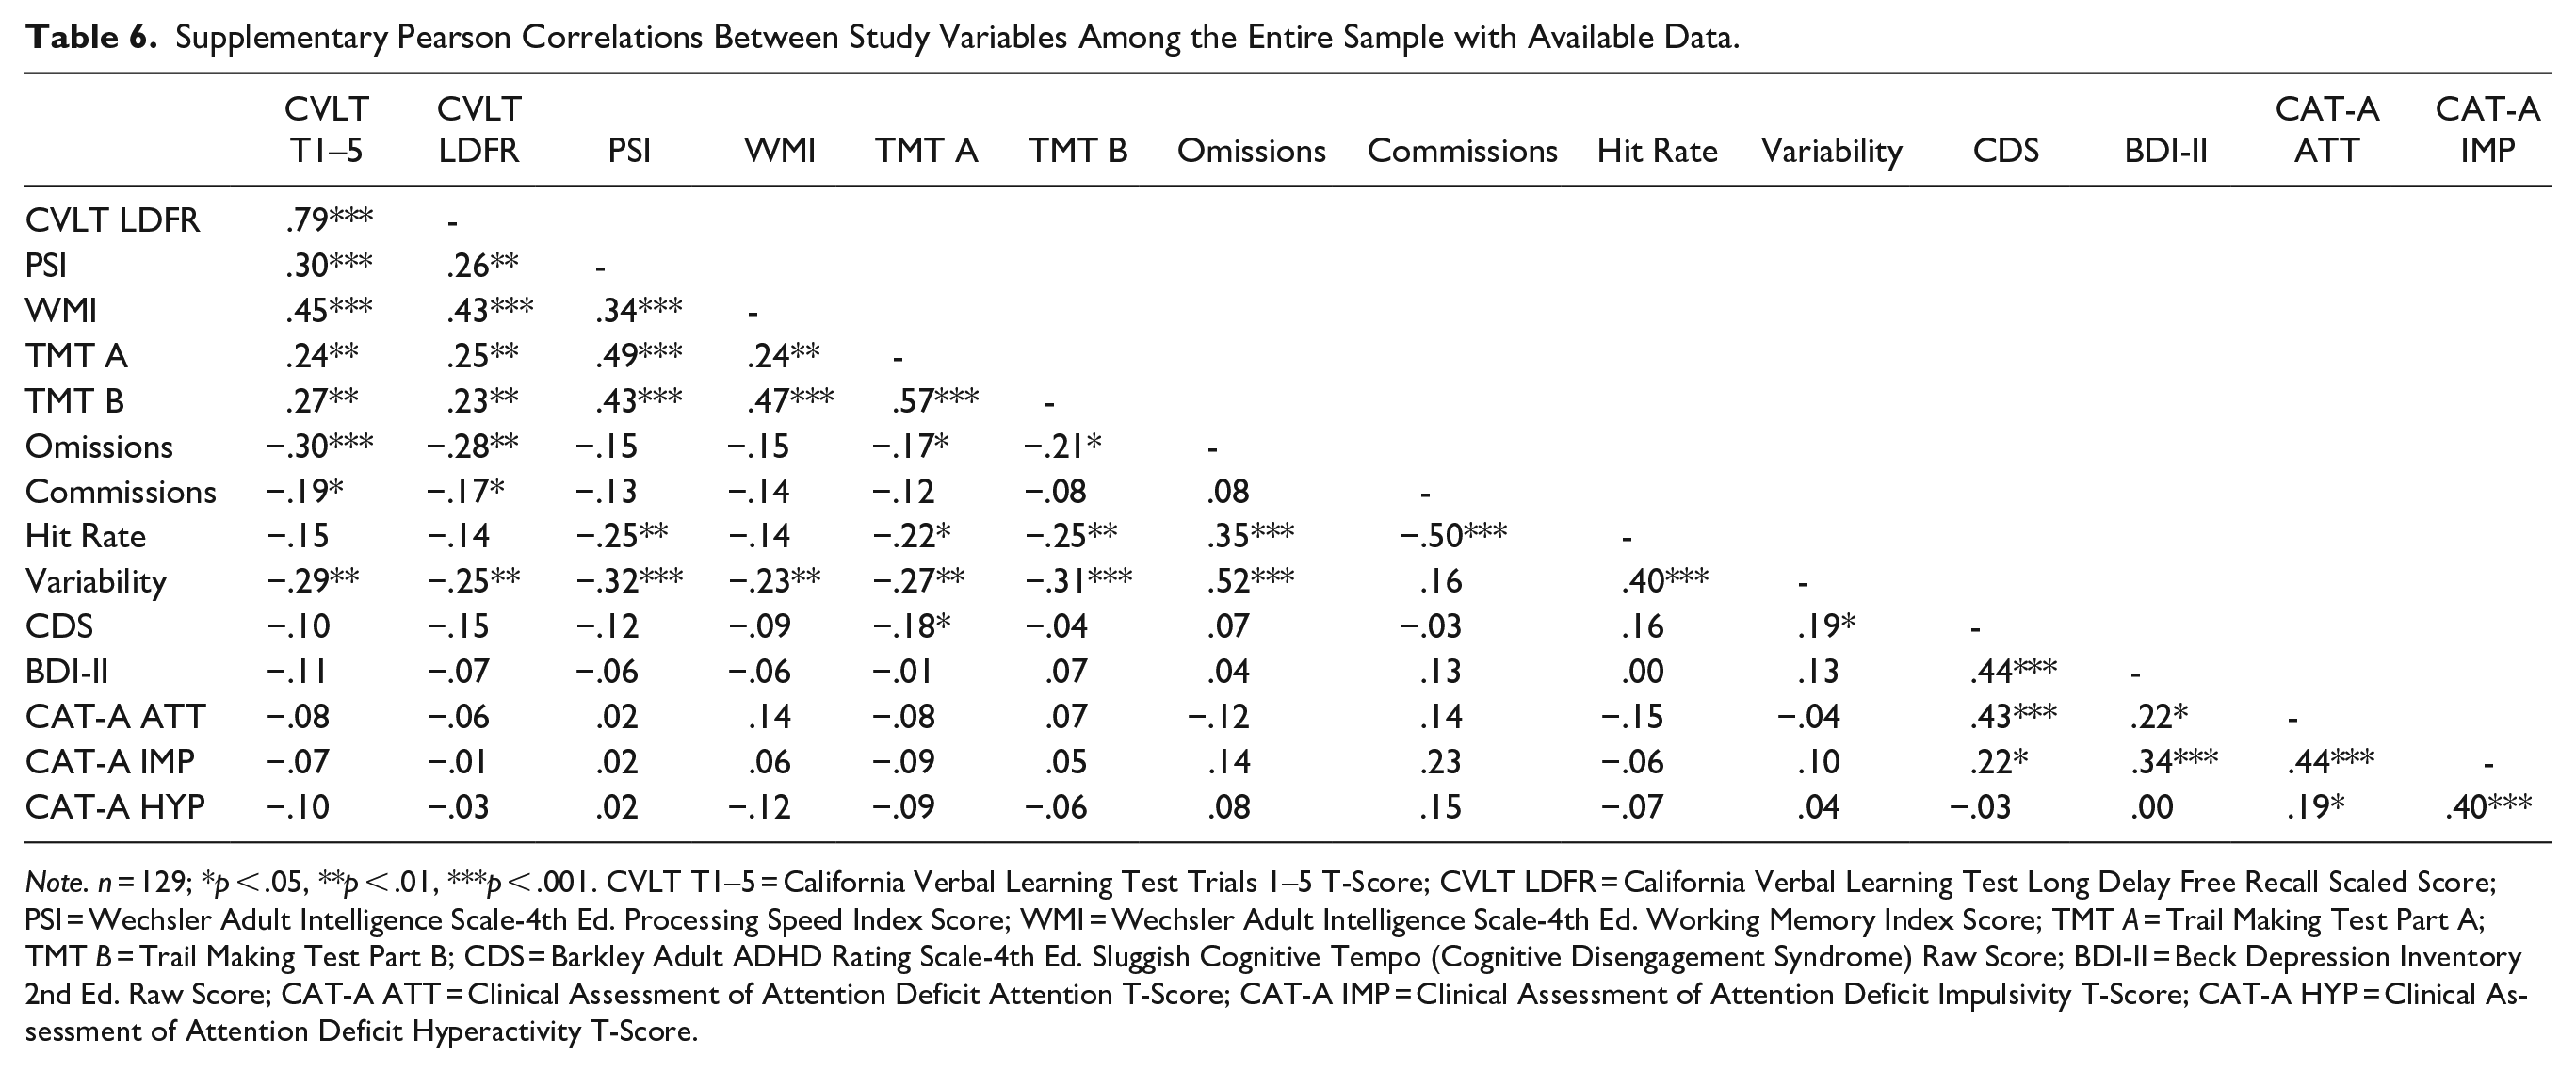
Note. n = 129; *p < .05, **p < .01, ***p < .001. CVLT T1–5 = California Verbal Learning Test Trials 1–5 T-Score; CVLT LDFR = California Verbal Learning Test Long Delay Free Recall Scaled Score; PSI = Wechsler Adult Intelligence Scale-4th Ed. Processing Speed Index Score; WMI = Wechsler Adult Intelligence Scale-4th Ed. Working Memory Index Score; TMT A = Trail Making Test Part A; TMT B = Trail Making Test Part B; CDS = Barkley Adult ADHD Rating Scale-4th Ed. Sluggish Cognitive Tempo (Cognitive Disengagement Syndrome) Raw Score; BDI-II = Beck Depression Inventory 2nd Ed. Raw Score; CAT-A ATT = Clinical Assessment of Attention Deficit Attention T-Score; CAT-A IMP = Clinical Assessment of Attention Deficit Impulsivity T-Score; CAT-A HYP = Clinical Assessment of Attention Deficit Hyperactivity T-Score.
Discussion
This cross-sectional study evaluated the associations between subjective retrospective complaints of CDS, objective cognitive performance, and self-report psychiatric measures in neuropsychiatric outpatients with and without ADHD. Results revealed no statistically significant differences in cognitive performance across 4 ADHD and CDS diagnostic groups. There were significant group differences in self-reported psychiatric symptoms, although this was unsurprising considering that self-reports were used to establish the high/low CDS groups and additionally helped inform diagnosis of ADHD. Among the full sample, all performance-based cognitive measures were intercorrelated. Most self-report measures were similarly intercorrelated, with the exception of hyperactivity symptoms with CDS and with depressive symptoms. Moreover, neuropsychological performance had weak to null correlations with psychiatric symptoms.
Results of the present study support prior work demonstrating the weak to null associations between CDS symptoms and objective cognitive performance among adults (Jarrett et al., 2017; Kamradt et al., 2018; Smith & Suhr, 2021). Some prior studies have demonstrated selective deficits in sustained attention (Jarrett et al., 2017), which were not observed in the present study. Studies in adult samples have been sparse, although they reliably demonstrate that CDS symptoms are more strongly associated with self-report data than objective cognitive performance (e.g., Jarrett et al., 2017). Existing research on CDS and cognitive performance in children and adolescents with ADHD is more consistent, with most studies demonstrating widespread moderate associations across cognitive domains (e.g., Creque & Willcutt, 2021; Wåhlstedt & Bohlin, 2010; Willcutt et al., 2014) with few exceptions revealing no to minimal associations after controlling for ADHD symptoms (e.g., Bauermeister et al., 2012). Taken together, these results may suggest that CDS is more strongly associated with cognitive performance in children than adults. However, this difference may also be explained by CDS symptom measurement. The majority of studies demonstrating similar results to the present study utilized the 9-item SCT/CDS scale from the BAARS-IV (Barkley, 2011; Jarrett et al., 2017; Kamradt et al., 2018; Smith & Suhr, 2021; Wood et al., 2017), which is validated for use among adults. Conversely, pediatric studies drew items from the Child Behavior Checklist (CBCL-C; Achenbach & Rescorla, 2001) to create a CDS composite with 4 to 12 items (Bauermeister et al., 2012; Creque & Willcutt, 2021; Wåhlstedt & Bohlin, 2010; Willcutt et al., 2014). As such, the BAARS-IV SCT scale may capture a slightly different construct than the CBCL-C composites, with the former potentially being less strongly associated with objective cognitive performance. Without more consistency in objective measurement of CDS among children, it is not possible at this time to determine whether differences in CDS correlates observed in children versus adults are due to measurement-related or construct-related factors (see Becker et al., 2022).
Conversely, the presence of relative cognitive deficits in ADHD versus healthy controls has been well-established and often include heterogenous impairments in attention, working memory, executive functioning, and processing speed (e.g., Alderson et al., 2013; Hervey et al., 2004; Leib et al., 2021; Mostert et al., 2015; Pievsky & McGrath, 2018; Willcutt et al., 2005). The current study, however, did not reveal significant between-group differences on cognitive performance for patients with and without ADHD, regardless of CDS status. ADHD is associated with inter-individual variability (e.g., Leib et al., 2021; Mostert et al., 2015) and, although relative deficits are common, they are not universal.
Consistent with extant literature, this study’s self-reported psychiatric outcomes support links between symptom complaints of CDS, ADHD, and depression. Consistent with previous literature, CDS was associated with ADHD symptomatology, with a stronger association observed with inattention than impulsivity or hyperactivity (e.g., Becker et al., 2016; Bernad et al., 2014; Kamradt et al., 2018). Additionally, higher impulsivity observed in Group 1 (high CDS/positive ADHD) than Group 2 (low CDS/positive ADHD) and in Groups 1 (high CDS/positive ADHD) and 3 (high CDS/negative ADHD) than Group 4 (low CDS/negative ADHD) suggest a potential additive effect of comorbid CDS and ADHD on self-reported symptomatology. Previous literature has demonstrated similar additive effects, though not exclusively in impulsivity or other forms of externalizing behavior (e.g., Barkley, 2012; Kamradt et al., 2018; Wåhlstedt & Bohlin, 2010). Previous studies that have found positive associations between CDS symptoms and externalizing behavior saw a reversal of these associations after controlling for ADHD symptoms (see Becker et al., 2022). However, a post hoc analysis of covariance (ANCOVA) controlling for inattention and hyperactivity did not attenuate group differences in impulsivity among this sample. The majority of extant literature combines hyperactive and impulsive symptoms into a single hyperactive/impulsive symptom cluster (e.g., Becker et al., 2016, 2018; Capdevila-Brophy et al., 2014; Kamradt et al., 2018; Smith & Suhr, 2021; Wåhlstedt & Bohlin, 2010), with some exceptions (e.g., Jarrett et al., 2017). Moreover, few, if any, previous investigations of CDS have used the CAT-A as a measure of ADHD symptoms, which separates hyperactivity and impulsivity into distinct indices. It is possible that this separation produced group differences in impulsive symptoms that would not be observed had we used a measure with a unitary hyperactive-impulsive index. Moreover, the CAT-A includes items on its Impulsivity index that are more related to cognitive/attentional impulsivity than overt behavioral impulsivity (i.e., difficulty with self-monitoring or planning; Bracken & Boatwright, 2005). Additional CDS research using the validity-controlled CAT-A to assess ADHD symptoms is required to better understand the differential associations with hyperactivity and impulsivity. Finally, although between-group differences were not observed, results demonstrated depressive symptoms were significantly correlated with CDS and ADHD symptoms, consistent with prior studies indicating that CDS is related to internalizing symptoms (Becker, 2021; Becker et al., 2014; Becker & Langberg, 2013; Becker et al., 2016; Capdevila-Brophy et al., 2014; Kamradt et al., 2018).
This study had several methodological strengths, including a large sample that was demographically diverse with objective controls for performance and symptom validity. However, there were several limitations. First, all participants were referred for ADHD evaluation in the context of inattention complaints, thereby making this a convenience sample. Participants who did not yield clinically significant symptoms of CDS or ADHD still experienced subjective problems with inattention, which can introduce bias and limits the conceptual and clinical dissociation of CDS and ADHD (Barkley, 2014). Second, the study may have been underpowered to detect differences across groups. A post hoc power analysis revealed that the MANOVA was underpowered. However, a second post hoc power analysis on the supplementary MANOVA revealed adequate power, suggesting that the observed primary analysis results were not due to lack of power. Third, item-level data for the BAARS-IV SCT scale was not available for analysis. Although a unitary factor structure is most commonly seen in extant research, select previous studies support a 2- or 3-factor structure for the BAARS-IV SCT scale, and subfactors have demonstrated differential associations with neuropsychological functioning (Barkley, 2013; Becker et al., 2022; Smith & Suhr, 2021). As such, future research would benefit from analyzing convergence between cognitive performance and CDS subfactors. Fourth, information on FSIQ and medication status were not available for most individuals in this sample, precluding direct examination. This is notable as factors such as FSIQ and medication status have previously been linked to attenuated cognitive performance among persons with ADHD (e.g., Fuermaier et al., 2017; Keezer et al., 2021). Future research would benefit from including such relevant demographic and treatment-related information when assessing cognitive differences between CDS and ADHD diagnostic groups. Fifth, final diagnostic status was not available for all participants, limiting our sample size. This includes the 20 individuals for whom ADHD diagnostic status was not available. Moreover, diagnostic information regarding presence of other neurocognitive disorders was not available for any participants in the sample, which precludes control or examination of other disorders which may be associated with cognitive impairment (e.g., specific learning disorders, history of moderate to severe brain injury). Moreover, additional diagnostic information such as co-occurring psychiatric or learning disorders was not available for all patients. Co-occurring disorders could affect cognitive performance, so conclusions about cognitive performance without this information are incomplete. However, the sample performed largely in the intact/average range, suggesting that co-occurring disorders likely had a minimal influence on cognitive performance. Lastly, future research would benefit from assessing CDS symptom correlates in a more diagnostically diverse clinical population referred for cognitive complaints other than inattention.
Footnotes
Declaration of Conflicting Interests
The author(s) declared no potential conflicts of interest with respect to the research, authorship, and/or publication of this article.
Funding
The author(s) received no financial support for the research, authorship, and/or publication of this article.
