
Abstract
The increasing availability of fine-grained student behavior data on smart campuses offers significant opportunities for personalized education. However, traditional clustering methods applied to such structured data often fail to capture the semantic complexity of behavioral features and the relational dependencies among individuals. To address these dual challenges, we propose a deep unsupervised clustering framework that integrates Bidirectional Encoder Representations from Transformers (BERT) and Graph Attention Networks (GAT). Recognizing that raw numerical features lack contextual depth, our approach first transforms structured data into natural language profiles, leveraging a pretrained BERT model to extract semantically rich embeddings. These individual representations are situated within a student behavior graph, where a GAT module refines node features by capturing relational structures and inter-student similarities. The combined embeddings enhance the performance of multiple clustering algorithms in identifying distinct behavioral patterns across students. In addition, we introduce a hierarchical anomaly detection module that identifies both unstable behavior clusters and outlier individuals based on intra-cluster variance and local density, providing a solution for detecting anomalous patterns in student populations. Experimental results on real-world campus datasets demonstrate the framework’s effectiveness, while further analysis highlights its practical utility in uncovering early indicators of academic risk through interpretable behavioral modeling.
Keywords
Introduction
With the development of smart campus infrastructure, universities are now equipped with the ability to continuously collect fine-grained student behavior data across locations and time periods. Digital systems such as campus card platforms, camera recording, and learning management tools enable the logging of student consumption, mobility, and academic engagement. The student campus behavior data comprehensively reflect students’ on-campus routines, effort levels, and spatial-temporal behavior, forming a multi-dimensional representation of their campus life and learning status. They provide a crucial foundation for understanding student dynamics and open up new possibilities for precision management, risk early warning, and personalized education.1–3
In the current field of education, student campus behavior data can support a wide range of analytical tasks, including correlation analysis, classification, and clustering. Correlation analysis approaches have quantified associations between behavioral indicators and academic performance, revealing significant behavioral dimensions predictive of student outcomes.4,5 Classification models have been developed to identify engagement levels and behavior categories based on structured activity logs.6–8 Clustering techniques have been widely employed to explore latent behavioral structures in student activity data, enabling the discovery of common engagement patterns and lifestyle archetypes.9,10 These studies collectively highlight the analytical potential of behavior data for data-driven education management. Among these tasks, clustering as a representative unsupervised learning technique, provides a flexible and scalable alternative that enables the discovery of latent behavioral structures and anomalies without requiring predefined labels. This makes it especially valuable for early-stage behavioral analytics and continuous monitoring in real-world campus environments, where labeled data is often scarce or incomplete.
Despite this progress, two major challenges remain underexplored in the current achievements. First, student behavior data collected from campus systems are inherently structured as tabular data, where each feature column carries semantic meaning that is closely tied to the column header and contextual value. However, existing studies typically treat these features as independent numeric inputs, overlooking the implicit semantic relationships between column names and data values. Second, there exist strong inter-student behavioral correlations that stem from shared routines, peer influence, or institutional schedules. These latent structural dependencies are rarely captured, as most models operate under the assumption of sample independence and fail to incorporate the topological behavior similarity among students.
The rapid advances in large language models (LLMs) offer a new paradigm for understanding tabular behavior data. By converting each row of behavior records into natural language descriptions, LLMs can be employed to generate contextual embeddings that encode both the semantic content and feature-label relationships, thereby addressing the semantic gap between tabular headers and their values. In parallel, the development of graph neural networks (GNNs) has provided effective tools for modeling relational data. Specifically, constructing a student similarity graph based on behavioral embeddings enables the learning of interdependent patterns across students, allowing the model to leverage group structures and peer similarities that are otherwise lost in traditional approaches. Moreover, while many prior works rely on supervised learning frameworks with labeled academic outcomes, such labels (e.g., GPA, dropout status) are often unavailable, delayed, or insufficient to reflect the nuanced and evolving nature of student behavior.
We propose
BehavGLM jointly models semantic and structural behavior information for unsupervised clustering and anomaly detection.
Our main contributions are as follows: We introduce a semantic transformation module that maps structured tabular behavior data into natural language form, and encodes it using a pretrained BERT model to capture fine-grained behavioral semantics. We construct a student similarity graph based on semantic proximity and apply GAT to model inter-student behavioral dependencies, thereby enhancing representation learning with relational context. BehavGLM enhances clustering performance across multiple mainstream algorithms. In addition, the framework enables the detection of behavioral anomalies closely linked to academic risk, demonstrating its practical value in educational applications.
Analysis of student behavior
Campus-sensing data, such as smart card records, have been widely used to infer latent behavioral traits such as diligence, orderness, and sleep regularity, which are strongly associated with academic performance. 13 Beyond statistical associations, short-term sequences of campus activity offer fine-grained temporal features for capturing fluctuations in students’ cognitive and behavioral states, aiding in performance change prediction. 14 And the digital engagement exerts measurable effects on learning outcomes. For example, social media overload has been shown to impair academic performance by inducing cognitive fatigue through stimulus–organism–behavior–consequence mechanisms. 15 On the predictive side, behavioral features extracted from learning management systems (LMS), along with demographic and historical academic data, have been effectively used to build machine learning models for early detection of at-risk students. 16 Recent hybrid deep learning advances have further improved behavioral profiling and anomaly detection in educational contexts. Among these, the TSA-GRU model integrates temporal sparse attention with GRU to mine sequential learning behaviors and identify anomalous student interactions, 17 and the Learning Style Decoder framework combines psychological learning style metrics with deep neural networks to construct personalized, fine-grained learner profiles. 18 In parallel, other studies emphasized behavior similarity among peers and proposed multi-task learning frameworks to jointly model inter-semester and inter-major relations using smart card data, achieving robust performance in large-scale academic prediction tasks. 13
Although these studies have provided useful empirical insights, many rely on manually engineered features and conventional statistical or shallow machine-learning pipelines. Such approaches can identify coarse correlations but are limited in their ability to exploit the full complexity of campus-sensing data.
Semantic representation learning for tabular data
Recent advances in modeling structured tabular data have shifted from static feature engineering toward semantic-aware representation learning. Transformer-based architectures, such as TabTransformer, have been introduced to model high-order dependencies between categorical and numerical features via self-attention, yielding more contextualized embeddings and improved classification performance. 19 Complementing this, TabNet adopts a sequential attention mechanism combined with sparse feature selection to dynamically prioritize informative feature subsets, offering both strong predictive accuracy and interpretability in heterogeneous tabular domains. 20 Moreover, encoder-only transformer architectures have proven effective for user behavior profiling and complex sequential pattern mining across diverse application scenarios, 21 with the inherent self-attention mechanism enabling robust extraction of hidden behavioral features even from structured tabular inputs. In addition to discriminative and attention-based schemes, generative and multimodal approaches have also emerged to further capture latent semantics and structural regularities. TabDiff leverages diffusion processes to model joint distributions over mixed-type features, effectively learning both continuous and discrete dimensions of tabular data in a unified generative framework. 22 Meanwhile, LLM-based models like TableGPT2 integrate structured rows and columns with unstructured textual context, enabling generalized reasoning and semantic understanding through multimodal embeddings. 23 Extending this line of research, TableLLM enables direct manipulation of spreadsheet-like data using LLMs, highlighting the potential of semantic modeling in practical human-computer interaction scenarios. 24
These advances represent a shift toward semantically enriched and context-aware modeling, opening new opportunities to capture complex patterns in structured student behavior data. By leveraging these methods, it becomes possible to learn behavior-sensitive representations that effectively reflect both the semantic meaning and structural dependencies within student activity data.
Graph neural networks for relational behavior modeling
Graph Neural Networks (GNNs) have been increasingly employed to model complex relational structures inherent in behavioral data. To capture dynamic multi-relational interactions, recurrent GNN architectures utilize relation-specific message passing combined with recurrent updates, enabling temporal pattern modeling in heterogeneous graphs. 25 Building on the concept of heterogeneous edge types, multi-behavior GNN models represent diverse user actions as distinct relations within a unified graph structure, facilitating richer interaction modeling across behavior categories. 26 Complementing these approaches, methods for transforming structured tabular data into weighted graphs enable the preservation of both semantic features and relational proximity, thus providing a principled foundation for applying GNNs to traditionally structured datasets. 27 In line with this trend, hybrid temporal-graph models have also been developed for longitudinal student behavior profiling and anomaly detection, further bridging temporal behavioral dynamics and graph-based relational learning. 28 Together, these advances illustrate a cohesive methodological progression from temporal and spatial relational modeling toward integrated graph construction from structured behavioral records, underscoring the suitability of GNNs for capturing multifaceted student behavior patterns.
Graph-based methods have advanced the modeling of complex behaviors by effectively capturing spatial, temporal, and multi-relational dependencies. These methods are well-suited for modeling social groups like students.
Data preprocessing
The data used in our work was obtained from the campus card system logs provided by a university in Beijing, covering the campus behavior data of 12,834 undergraduate students during a specific semester. The original data was anonymized during the export process, including the removal of sensitive information such as student names and student ID numbers, to protect student privacy. The data types covered multidimensional daily behavior records, providing a foundation for subsequent modeling and analysis.
Dataset
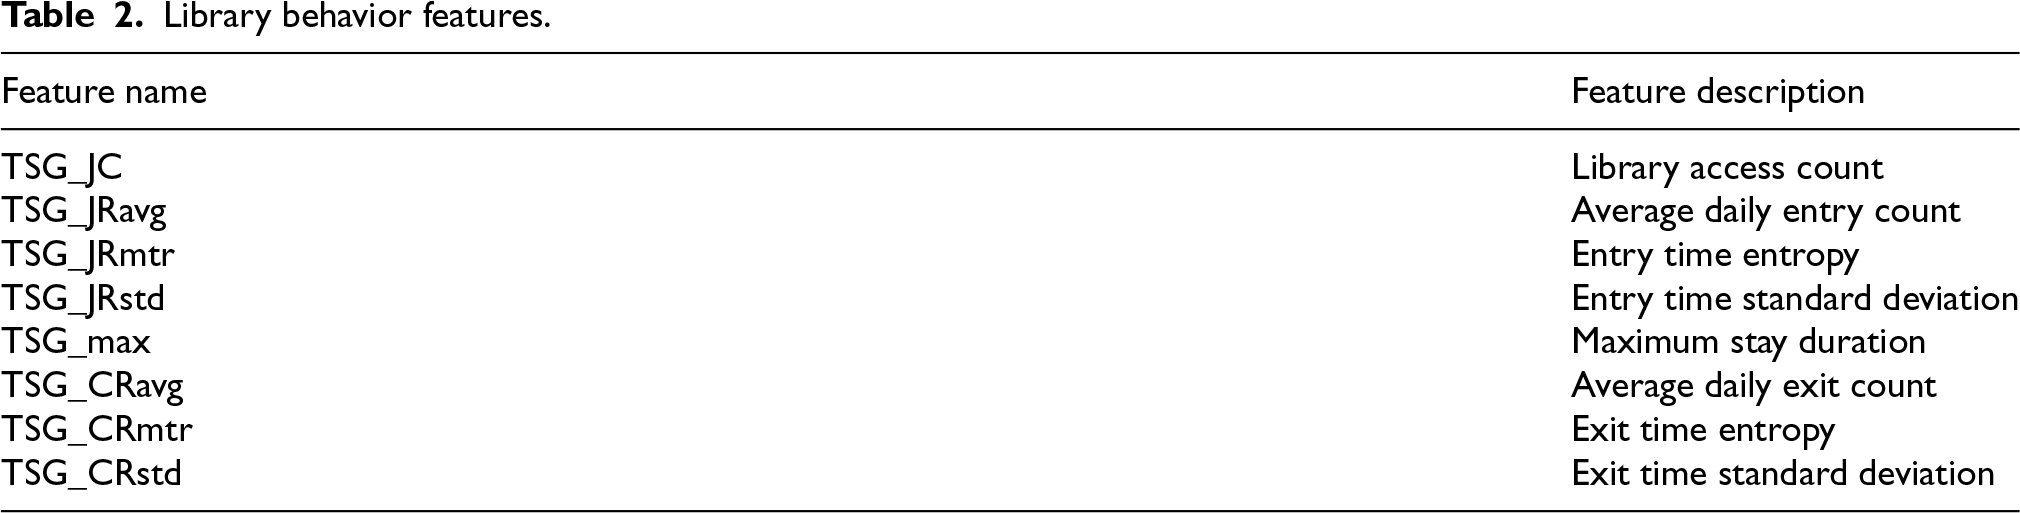
The dataset used in this study primarily includes the following three aspects: Campus Gate Access Data: records information about students entering and exiting the campus through campus gate turnstiles, including turnstile name, entry and exit direction, and timestamps for entering and exiting the campus gate. This type of data reflects students’ frequency of leaving campus, distribution of travel times, and patterns of time spent on campus. Library Behavior Data: includes students’ swipe records when using the campus library, including entry and exit direction, channel type, and timestamps for entering and exiting the library. By analyzing these records, it is possible to characterize students’ learning behavior patterns. Dining Behavior Data: covers students’ swipe records when dining at campus canteens, including dining locations, consumption amounts, consumption types, and consumption times. Such data can be used to uncover students’ dietary habits, meal regularity, and daily rhythms.
In summary, the dataset is relatively comprehensive in terms of dimensions, covering key aspects of students’ daily life and learning behaviors during their time on campus. This facilitates in-depth analysis of individual behavioral patterns and potential anomalies, laying a solid foundation for subsequent clustering modeling and anomaly detection.
Feature engineering
Feature extraction
After basic data cleaning, which included the removal of duplicate records, imputation of meaningful missing values, and correction of formatting inconsistencies, feature engineering was conducted to convert raw, low-level behavioral traces into structured and interpretable high-level representations suitable for downstream analysis. As campus behavior data are inherently sparse and unstructured, statistical aggregation and behavior-specific modeling techniques were applied. These methods enabled the extraction of meaningful features from core behavioral domains, as detailed in Tables 1–3.
Campus gate access features.
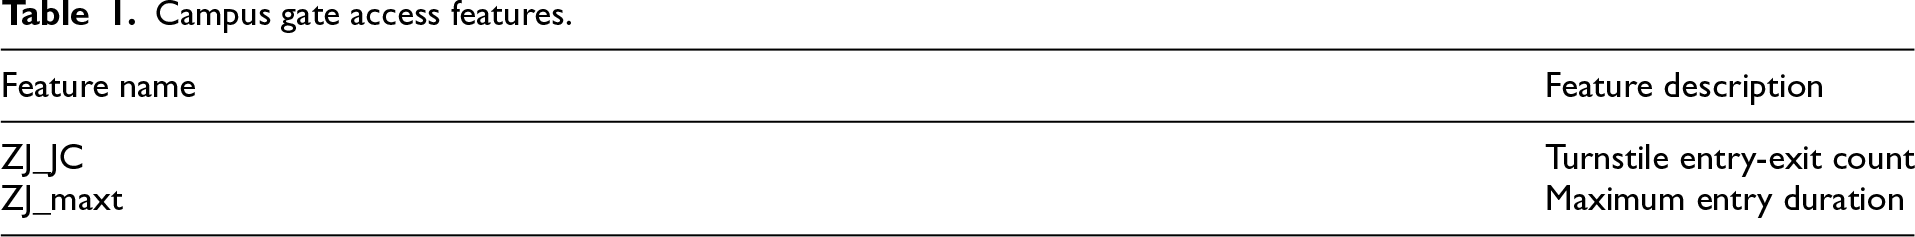
Campus gate access features.
Library behavior features.
Dining behavior features across breakfast, lunch, and dinner.
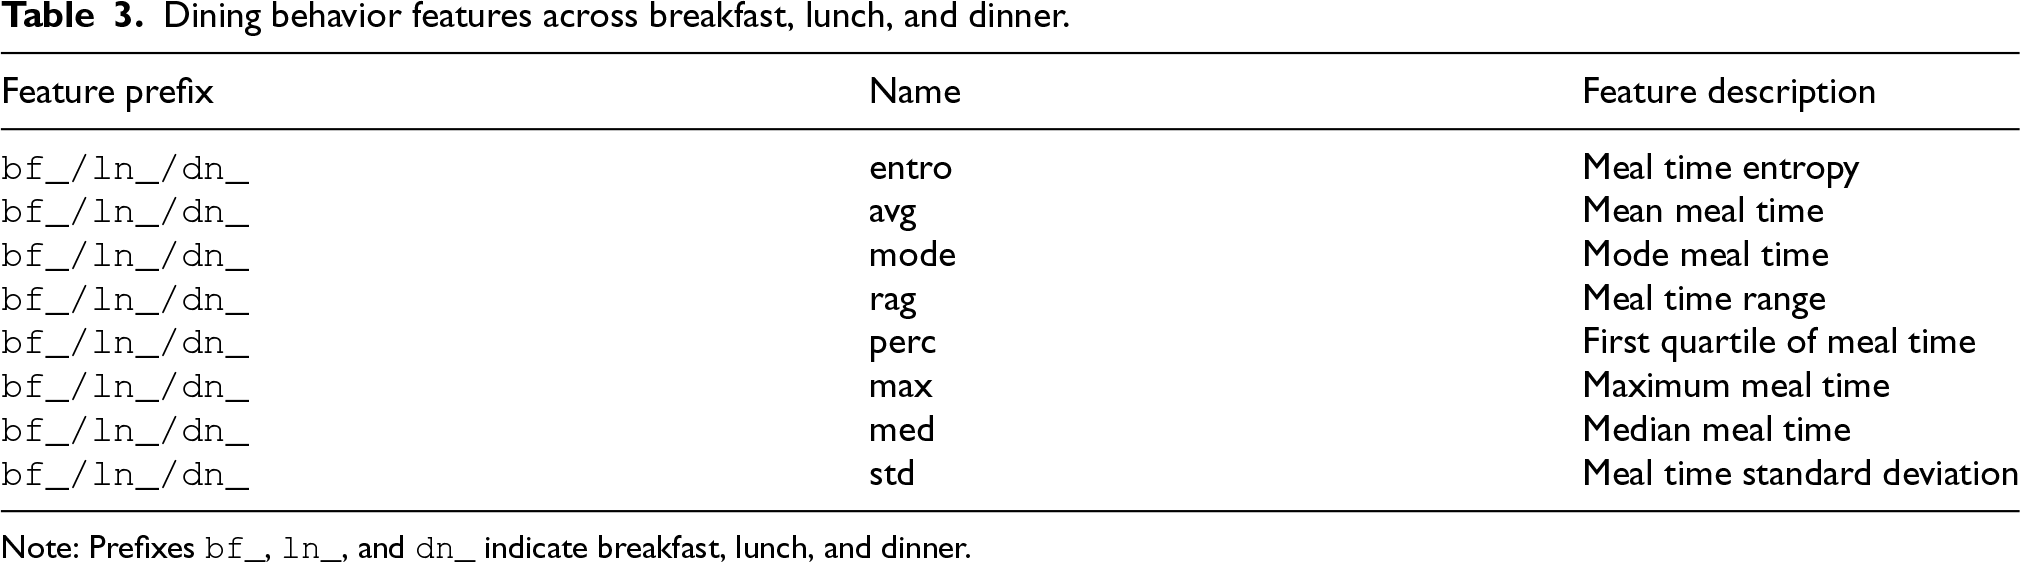
Note: Prefixes
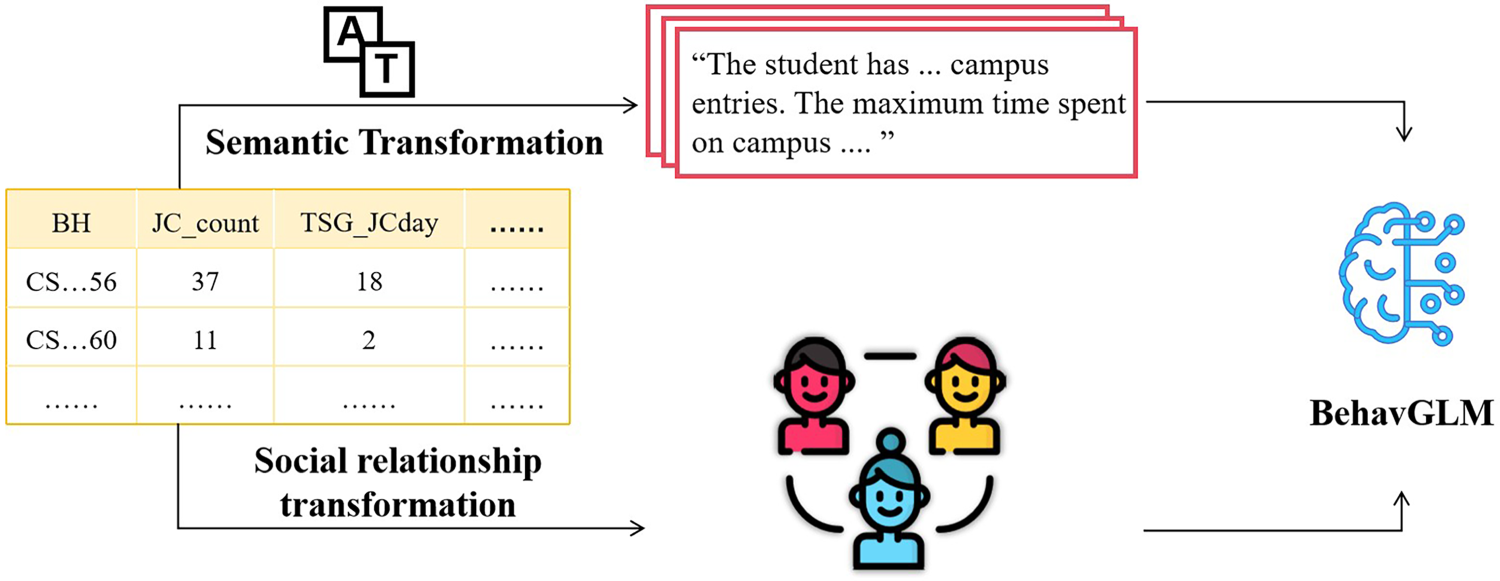
Although the extracted behavioral features are numerical and structured, many of them implicitly reflect contextual information that is better expressed in natural language. To leverage the powerful semantic understanding of large language models, we designed a transformation process that converts structured numerical records into standardized textual profiles for each student. This textual transformation serves as a bridge between conventional feature engineering and deep semantic modeling, enabling the integration of statistical patterns and contextual knowledge. Each student is associated with a narrative-style behavior profile that summarizes key traits across three dimensions: campus consumption, library usage, and campus gate activity. These profiles are constructed using rule-based sentence templates that map each numerical feature into a semantically informative and grammatically consistent statement.
The design of text templates follows a selection process informed by exploratory experiments. Given the vast design space for natural language prompting, we evaluated several template styles, including simplified numerical listings (feature-value pairs), narrative behavioral descriptions, and temporally-focused patterns. Our preliminary evaluations indicated that the narrative-style template achieved superior performance in capturing semantic relationships between behavioral features. This can be attributed to the fact that narrative descriptions align better with the distribution of text data that BERT was pre-trained on, thereby better leveraging the model’s contextual understanding capabilities. An example template is shown :“The student has …campus entries. The maximum time spent on campus is …minutes. The student entered the library on …days. The mean time of entering the library is around …”.
Method
Modeling complex student behavior from structured campus data poses significant challenges. Raw behavioral attributes, such as meal times, library visits, and gate access frequencies, encode intricate temporal and contextual patterns that are not easily captured by traditional statistical or distance-based clustering methods. Moreover, students often display latent group structures or behavioral correlations, where similar routines may arise from shared social or environmental influences. Conventional approaches typically overlook both the internal semantics of individual behavior and the relational dependencies among students, limiting their capacity for expressive representation and robust generalization.
In this work, BehavGLM as a modular framework is designed to address these limitations through the combination of semantic modeling and graph-based relational learning. The approach begins by transforming each student’s structured behavioral record into a natural language profile, which is then encoded using a pretrained BERT model to extract deep semantic representations. To capture structural relationships among students, a similarity graph is constructed in the embedding space, where nodes represent students and edges denote behavioral proximity. These graph-structured embeddings are further refined via a GAT, which dynamically aggregates contextual information from neighbors to enhance behavior-aware representations. This process enables BehavGLM to capture both individual-level semantic detail and population-level interaction patterns, providing a more comprehensive foundation for clustering and anomaly detection.
Model structure
BehavGLM consists of three main components: (1) a semantic embedding module leveraging pretrained BERT 11 to transform structured behavior data into textual and then vectorized form; (2) a graph-based relational modeling component, where a student similarity graph is first constructed in the semantic space using nearest-neighbor relations, and a GAT-based encoder 12 is then applied to learn context-aware embeddings that capture inter-student behavioral dependencies. The pipeline is illustrated in Figure 2. This framework aims to address the challenges of representing heterogeneous and high-dimensional behavioral features and capturing implicit similarities or interactions between students based on their daily patterns.
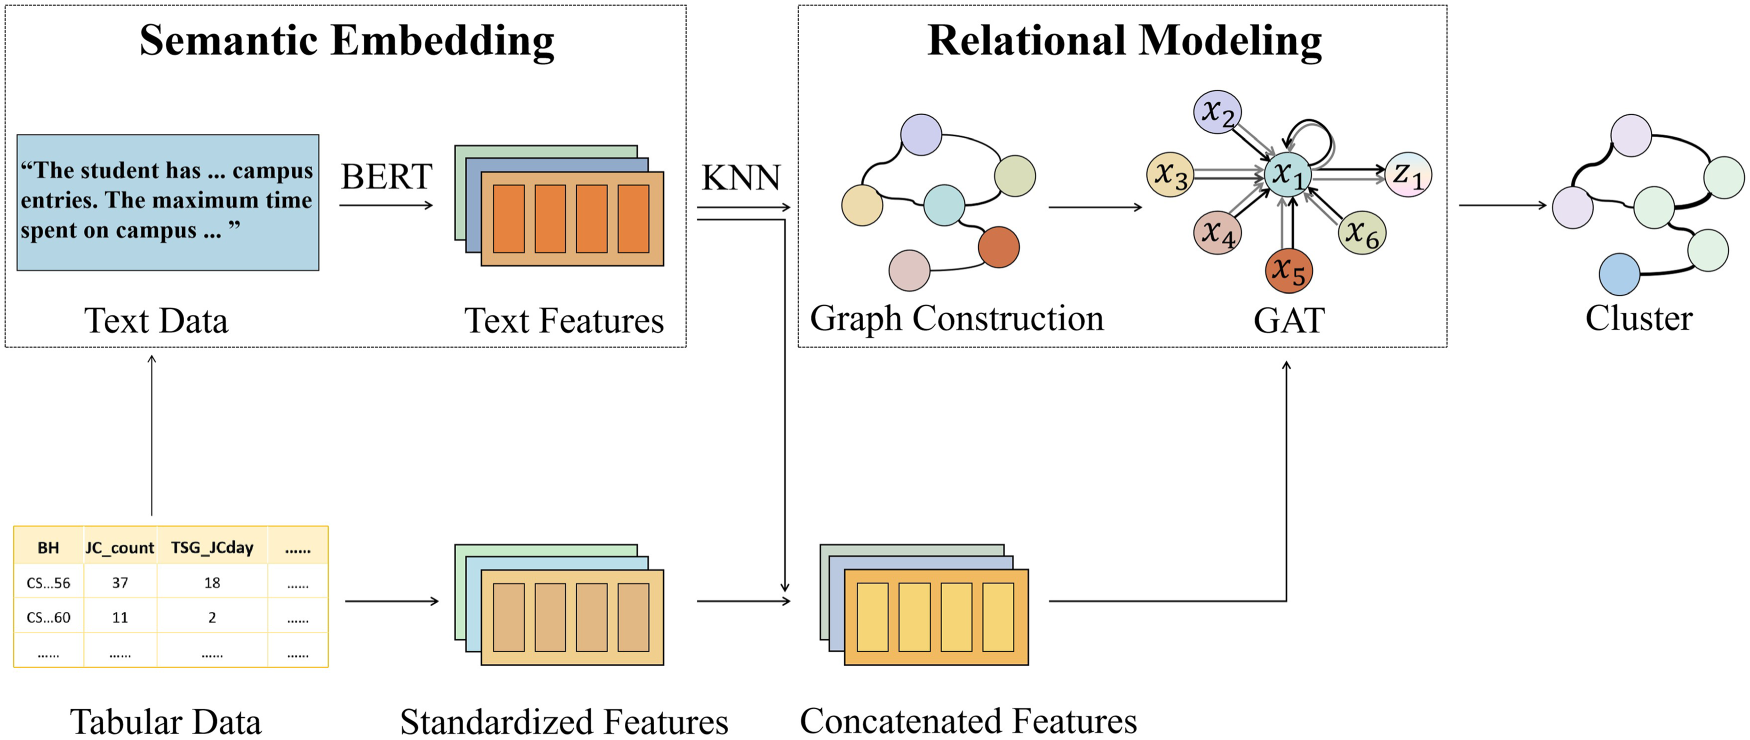
Overview of our BehavGLM framework.
Let
To obtain high-dimensional semantic representations of student behavior, we employ a pretrained BERT model to encode the textual profiles generated in Section 3.2. The goal is to extract contextualized embeddings that capture both intra-student behavior consistency and inter-feature semantic dependencies. We choose BERT as our text encoder due to its strong contextual representation capability and mature open-source implementation. Compared with classical text encoding methods (e.g., TF-IDF, Doc2Vec), BERT can better capture the semantic information of campus behavior data, as validated by our comparative experiments (Section 5.1).
Each textual profile is first tokenized using the standard BERT tokenizer, preserving word boundaries and subword semantics. The tokenized sequence is then passed through the pretrained BERT-base model. We extract the hidden states from the final transformer layer and compute the average across all token embeddings to obtain a fixed-length sentence-level representation for each student.
The semantic embedding for each student is computed as:

These embeddings capture rich behavioral semantics from the textualized student profiles. On a local level, the representations encode the meaning of individual behavioral attributes, such as breakfast regularity and library visit times, using token-wise attention mechanisms. On a global level, they encode how different behaviors interact contextually within the profile, e.g., the alignment of evening library visits with late dining patterns. This level of semantic abstraction would be difficult to capture using raw numerical features alone.
Importantly, the textual profiles fed into BERT are derived from structured statistical data using a controlled natural language template. The textualized behavioral descriptions follow relatively regular syntactic and lexical patterns, which align well with the inductive biases learned during BERT’s pretraining. This structural consistency potentially facilitates better semantic encoding across diverse behavioral profiles.
To complement the textual representation, the original normalized numerical features are retained and later fused with the semantic embeddings during downstream modeling, resulting in a hybrid representation:

Compared to conventional tabular modeling approaches, which typically rely on decision trees or shallow neural networks,29,30 the hybrid embedding leverages both global statistical patterns and token-level semantic cues. This duality makes it particularly effective in capturing nuanced behavior such as long-term regularity, cross-feature consistency, and outlier patterns that may not be evident from numerical values alone.
The fused embeddings are subsequently used as node features in the graph neural network architecture described in Section 4.3, where relational patterns between students can be further explored. By grounding each node in both deep semantic and quantitative behavioral space, the model gains a more holistic understanding of student behavior, facilitating more accurate clustering and anomaly detection in later stages.
While the hybrid feature vectors
Graph construction
We first construct a directed graph
We rely on BERT embeddings, rather than fused vectors that include numerical statistics, ensuring that connections reflect semantic homophily. Since BERT is trained to model linguistic regularities, it effectively captures common patterns such as routine activities or shared preferences expressed in text. By contrast, incorporating numerical features at this stage might introduce noise or misleading closeness based on surface-level statistical proximity, which does not necessarily imply meaningful behavioral similarity.
Concretely, for each student
This graph structure models a semantic neighborhood topology, where local connectivity reflects fine-grained behavioral alignment. The parameter
Graph training using GAT
Once the graph is constructed, we apply a Graph Attention Network to perform neural message passing and learn refined representations that incorporate peer influence. GAT is well-suited to this setting because it adaptively learns the importance of different neighbors, which is particularly useful in behavior modeling where not all similar students contribute equally.
We choose to use the fused vectors rather than just BERT or numerical features for the following reasons. Semantic embeddings provide rich contextual understanding but may lack precision in capturing statistical extremes or variations, which are vital for identifying outliers or habitual deviations. Conversely, statistical features alone lack the expressive capacity to model inter-feature dependencies and behavioral semantics. The fused input allows GAT to learn attention weights that consider both what students do and how their behavior is described, resulting in more informed and nuanced aggregation from neighboring nodes. The GAT then performs message passing over the semantically-consistent graph to fuse these heterogeneous features.
Moreover, because the graph structure is built purely from BERT embeddings, injecting statistical features into the training stage does not affect the structural alignment but complements it by enriching the learning signal. This separation, semantic-based graph construction and hybrid-based message passing, ensures that the learned embeddings benefit from meaningful neighborhood contexts while remaining sensitive to diverse aspects of student behavior.
Formally, given node features 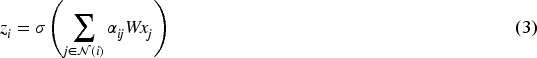

To improve the model’s expressive power, we stack two GAT layers, each with an intermediate hidden dimension of 32. The second layer allows information from second-order neighbors (i.e., neighbors of neighbors) to influence node representations, capturing broader structural patterns. We apply ReLU activation between layers to introduce non-linearity and stabilize training.
As labels for student types or anomalies are not available during embedding learning, we adopt a self-supervised learning strategy. The core idea is to make the final embedding 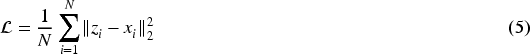
This objective encourages the GAT to act as a self-supervised structure-aware representation learning module.
Ultimately, the output embeddings
This section presents a comprehensive evaluation of the proposed BehavGLM framework on real-world student campus behavior data. The experiments are designed to assess the model’s ability to identify meaningful behavior clusters and support downstream analyses such as anomaly detection and subgroup interpretation.
To guide the evaluation, we focus on the following research questions:
Does the integration of semantic embeddings and graph-based relational modeling enhance the clustering of student behavior profiles? Are the resulting clusters behaviorally meaningful, and do they support downstream tasks such as anomaly detection?
In this section, we provide a detailed description of the experimental setup, including the selection of clustering algorithms, internal evaluation metrics, and comparative results among different models.
Clustering algorithms
To explore the latent structures in student behavior data, we apply five clustering algorithms to the final embeddings produced by the BERT-GAT framework. These methods span multiple paradigms, offering diverse perspectives on cluster formation in high-dimensional semantic space.
K-Means, a classic partitioning algorithm, minimizes within-cluster variance by iteratively updating centroids based on Euclidean distance. 32 Its simplicity and efficiency make it suitable for well-separated spherical clusters, but it is sensitive to initialization and often struggles with non-convex structures. To address the limitations of hard assignment and geometric rigidity, we evaluate Gaussian Mixture Models (GMM), which adopt a probabilistic framework to model data as a mixture of Gaussians. 33 GMMs provide soft assignments and are better suited for elliptical or overlapping clusters, although they are more sensitive to outliers and parameter estimation. We include BIRCH, which incrementally builds a clustering feature tree to summarize data and supports fast, hierarchical aggregation. 34 While BIRCH is robust to noise, its performance can degrade when clusters are poorly separated or global optimization is needed. Agglomerative hierarchical clustering is also considered for its interpretability and ability to capture nested structures via bottom-up merges based on Ward linkage. 35 Although deterministic, it is less scalable and sensitive to local merge decisions. Lastly, spectral clustering leverages the eigenstructure of a similarity matrix to perform dimensionality reduction before clustering in the spectral space. 36 It effectively detects non-convex and global patterns but requires careful graph construction and is computationally expensive for large datasets. Furthermore, we include Deep Embedded Clustering (DEC) as a deep learning baseline. 37 DEC simultaneously learns feature representations and cluster assignments by optimizing a Kullback–Leibler (KL) divergence-based objective, allowing for iterative refinement of cluster centers.
To ensure fair comparison, we avoid enforcing a unified number of clusters across all methods. For algorithms like K-Means and GMM, we examine multiple values of
Evaluation metrics
To quantitatively assess the clustering quality, we employ four widely used internal evaluation metrics: Silhouette Score, Calinski-Harabasz Index (CH Index), Davies-Bouldin Index (DB Index) and Scattering and Density-Based Clustering Validity (S_Dbw).
The Silhouette Score measures how similar a sample is to its own cluster compared to other clusters. For a data point 
The CH Index evaluates cluster validity by the ratio of between-cluster dispersion to within-cluster dispersion. Given a dataset with 
The DB Index measures the average similarity between each cluster and its most similar counterpart. It’s defined as shown in equation (8). And 
The S_Dbw Index is a density-aware internal metric free of convex cluster assumptions. It consists of two core components: intra-cluster scattering 
Table 4 presents the clustering outcomes under three different configurations: the baseline model without BERT or GAT, a semantically enhanced variant using BERT, and the full framework enhanced by both BERT and GAT. Across all six clustering algorithms, we observe consistent and substantial performance improvements as semantic and relational components are successively integrated, demonstrating the robustness and generalizability of the proposed representation pipeline. To examine the contribution of each module in greater depth, we take Agglomerative Clustering as a representative example and compare its performance across the three configurations. With the introduction of BERT embeddings, the Silhouette Coefficient improves marginally from 0.3474 to 0.3505, indicating enhanced intra-cluster cohesion. More notably, the CH Index increases from 6074.78 to 6642.27, reflecting a more distinct separation between cluster centroids. Meanwhile, the DB Index drops from 1.2700 to 1.2532, and the S_Dbw Index decreases from 0.6024 to 0.5919, both suggesting reduced dispersion within clusters and improved inter-cluster density separation. These trends confirm that even semantic transformation alone by enriching feature context can sharpen cluster boundaries and improve structural coherence.
Comparison of clustering methods with different model architectures.
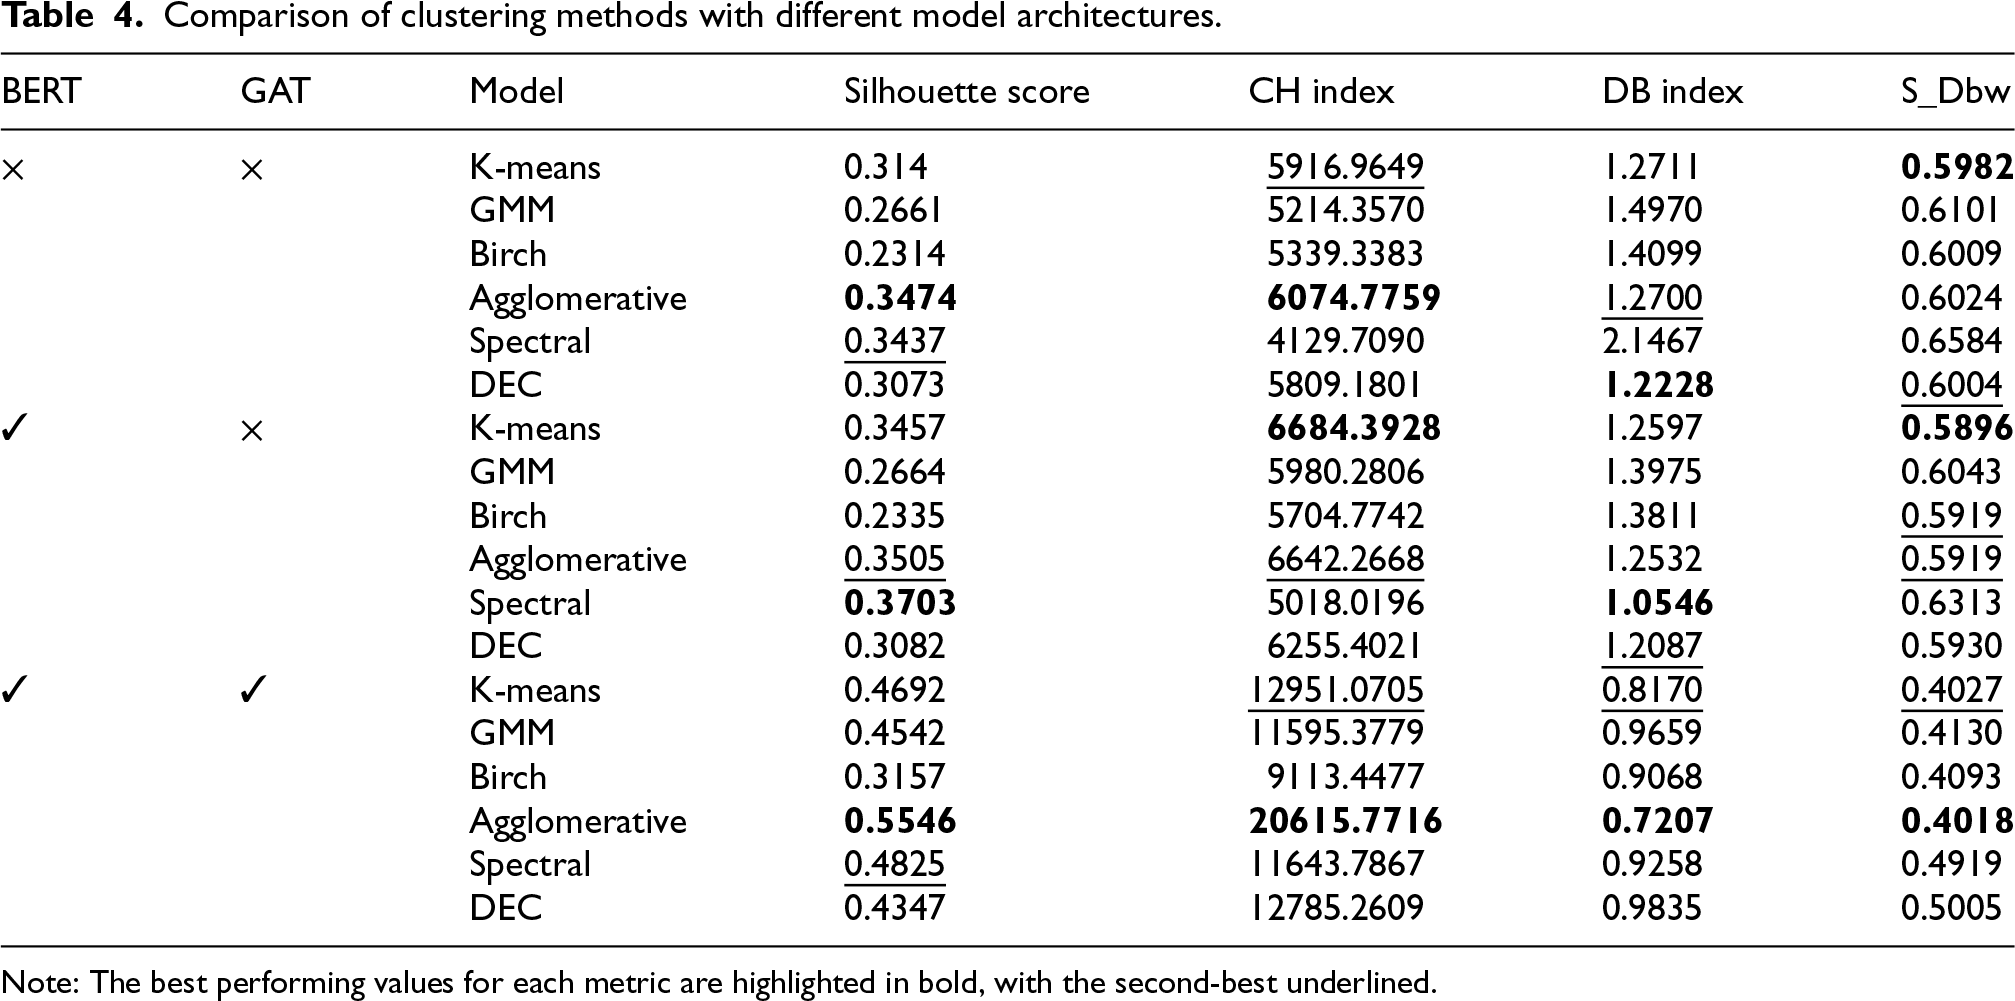
Comparison of clustering methods with different model architectures.
Note: The best performing values for each metric are highlighted in bold, with the second-best underlined.
Upon further incorporating GAT-based relational modeling, the performance gains become significantly more pronounced. In the Agglomerative setting, the Silhouette Coefficient rises dramatically to 0.5546, a relative gain of 18.43% over the BERT-only variant. The CH Index surges to 16343.98, the DB Index drops to 0.7207, marking a 53.25% reduction, and the S_Dbw Index further decreases to 0.4018, a relative reduction of 19.01% compared to the BERT-only variant. These improvements reflect not only greater intra-cluster compactness, but also enhanced inter-cluster separation. Similar trends are consistently observed across other clustering algorithms, reinforcing the broad effectiveness of the combined approach.
Among the three evaluation metrics, the CH Index shows the most substantial absolute increase a pattern that deserves specific attention. This index, which simultaneously rewards between-cluster separation and penalizes within-cluster dispersion, is particularly sensitive to structural refinement in high-dimensional spaces. The sharp rise observed after integrating both BERT and GAT suggests that our framework not only reduces redundancy and noise within clusters but also structurally magnifies latent differences across behavior groups. Importantly, this improvement is not isolated to one method or setting, but rather generalizes across diverse clustering paradigms, highlighting the versatility of the proposed architecture.
Taken together, these results demonstrate a clear two-stage enhancement mechanism: the BERT module captures contextual semantics from structured behavioral features, translating them into more discriminative embeddings; the GAT module then injects structure-aware refinement by modeling inter-student similarity patterns within a graph context. This combination enables the discovery of more coherent, well-separated, and semantically meaningful clusters, as quantitatively supported by all three evaluation metrics.
To visually evaluate the quality of the learned latent space representation, we employed t-SNE to project the results of hierarchical clustering onto a two-dimensional plane. As shown in Figure 3, the model identifies clear cluster cores with high intra-cluster cohesion. While some visual overlap and boundary transitions are observed among the clusters, we attribute this phenomenon to two interrelated factors: First, the extreme dimensionality reduction from an high dimensional feature space to two dimensions inevitably introduces information loss and visual distortion, which is an inherent limitation of t-SNE projection. Second, certain boundary samples genuinely represent students with transitional behavioral patterns, exhibiting mixed characteristics that span multiple groups, which reflects the inherent continuity and complexity of human behavior in a real campus environment. These two factors jointly contribute to the observed boundary phenomena in the visualization.
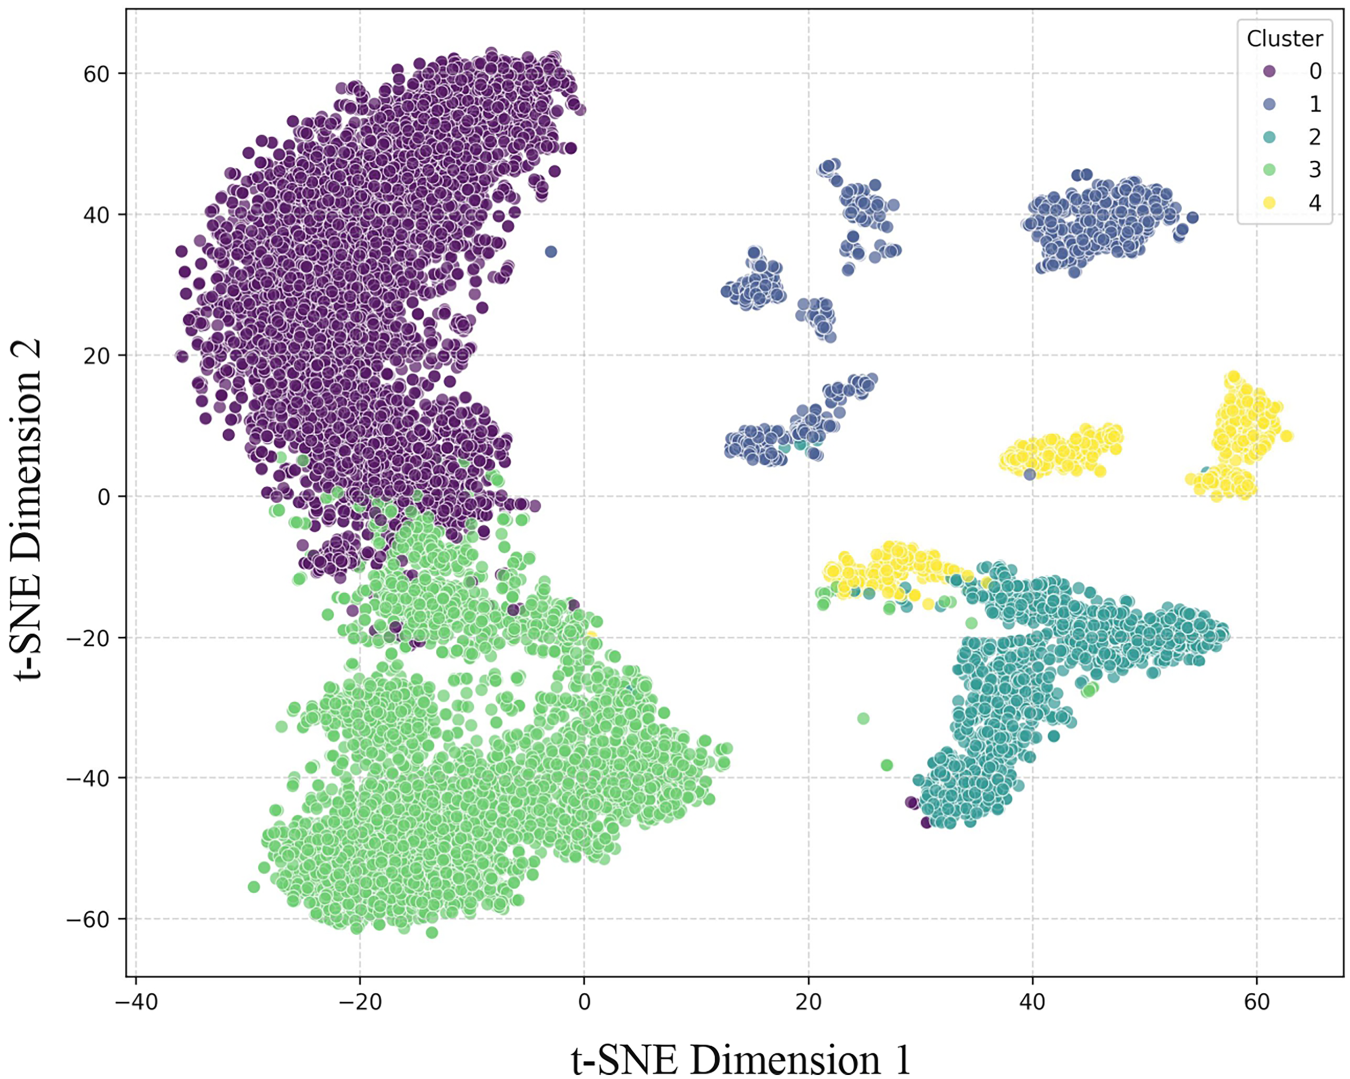
t-SNE visualization of BehavGLM embeddings with hierarchical clustering.
To evaluate the impact of the graph construction parameter
Clustering performance with different
values in graph construction.
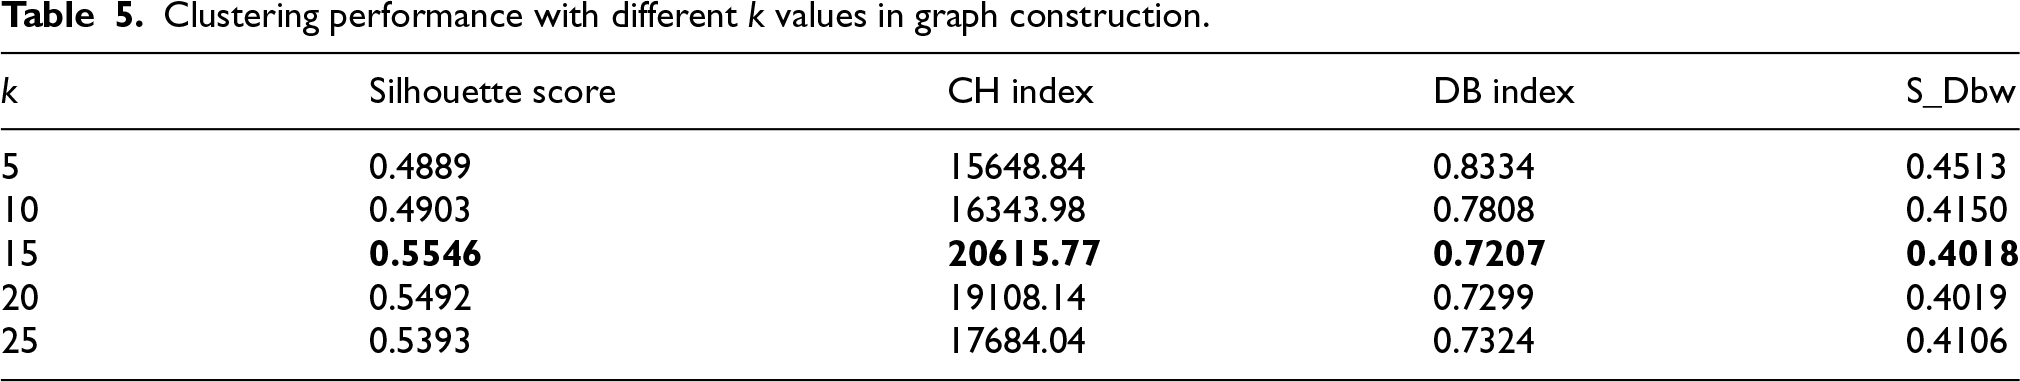
Clustering performance with different
As illustrated in Table 5, the model achieves its peak performance at
Experiments run on workstations equipped with NVIDIA A6000 GPUs. In tests, the model completes within a reasonable engineering timeframe for whole-school datasets. In practice, the total runtime for the complete analysis remains under 20 min per execution, confirming that the integration of deep learning modules does not impede the model’s scalability for routine educational administrative tasks.
Comparison of semantic encoding baselines
To validate the effectiveness of BERT for encoding campus behavior data, we compare it with two classical text encoding methods: TF-IDF 38 and Doc2Vec. 39 For fair comparison, we replace the BERT encoder in our framework with these methods while keeping all other components unchanged.
Table 6 presents the clustering results using Agglomerative Clustering. BERT consistently outperforms both TF-IDF and Doc2Vec across all four metrics. These results demonstrate that BERT’s contextualized embeddings can better capture the semantic relationships in the textual behavior profiles, validating our choice of BERT as the encoding component in our model.
Clustering performance of different embedding methods.
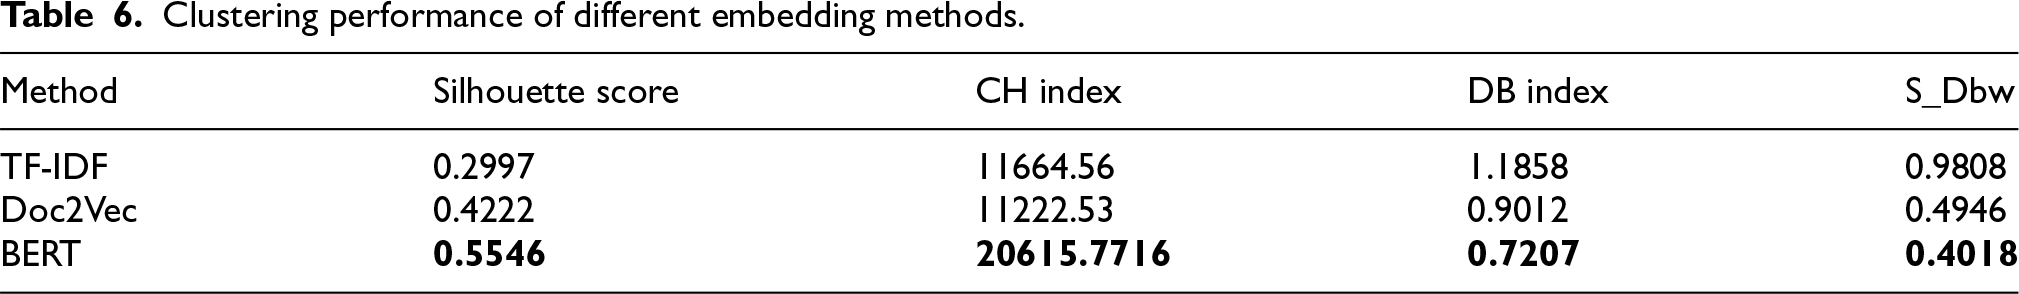
Clustering performance of different embedding methods.
To further interpret the clustering results, this section conducts an in-depth analysis of student behavioral patterns within the identified groups. Since the agglomerative clustering method achieved the best overall performance under the proposed BehavGLM, it is selected as the basis for subsequent interpretation.
Considering the high dimensionality of the original behavioral dataset, we first reduce the complexity of the data by selecting a set of representative features. This step helps avoid visual clutter and ensures the clarity of downstream pattern exploration. Based on the selected features, we then examine the behavioral differences among clusters through visualization, aiming to uncover distinct behavioral profiles and provide intuitive evidence for the model’s discriminative capacity.
Feature selection
To reduce dimensional complexity while preserving the essential behavioral variance in the data, we apply Principal Component Analysis (PCA) to the original numerical features. 40 As shown in Figure 4, the cumulative explained variance ratio demonstrates that the first nine principal components capture over 90% of the total variance, thus offering a compact yet informative representation of the data.
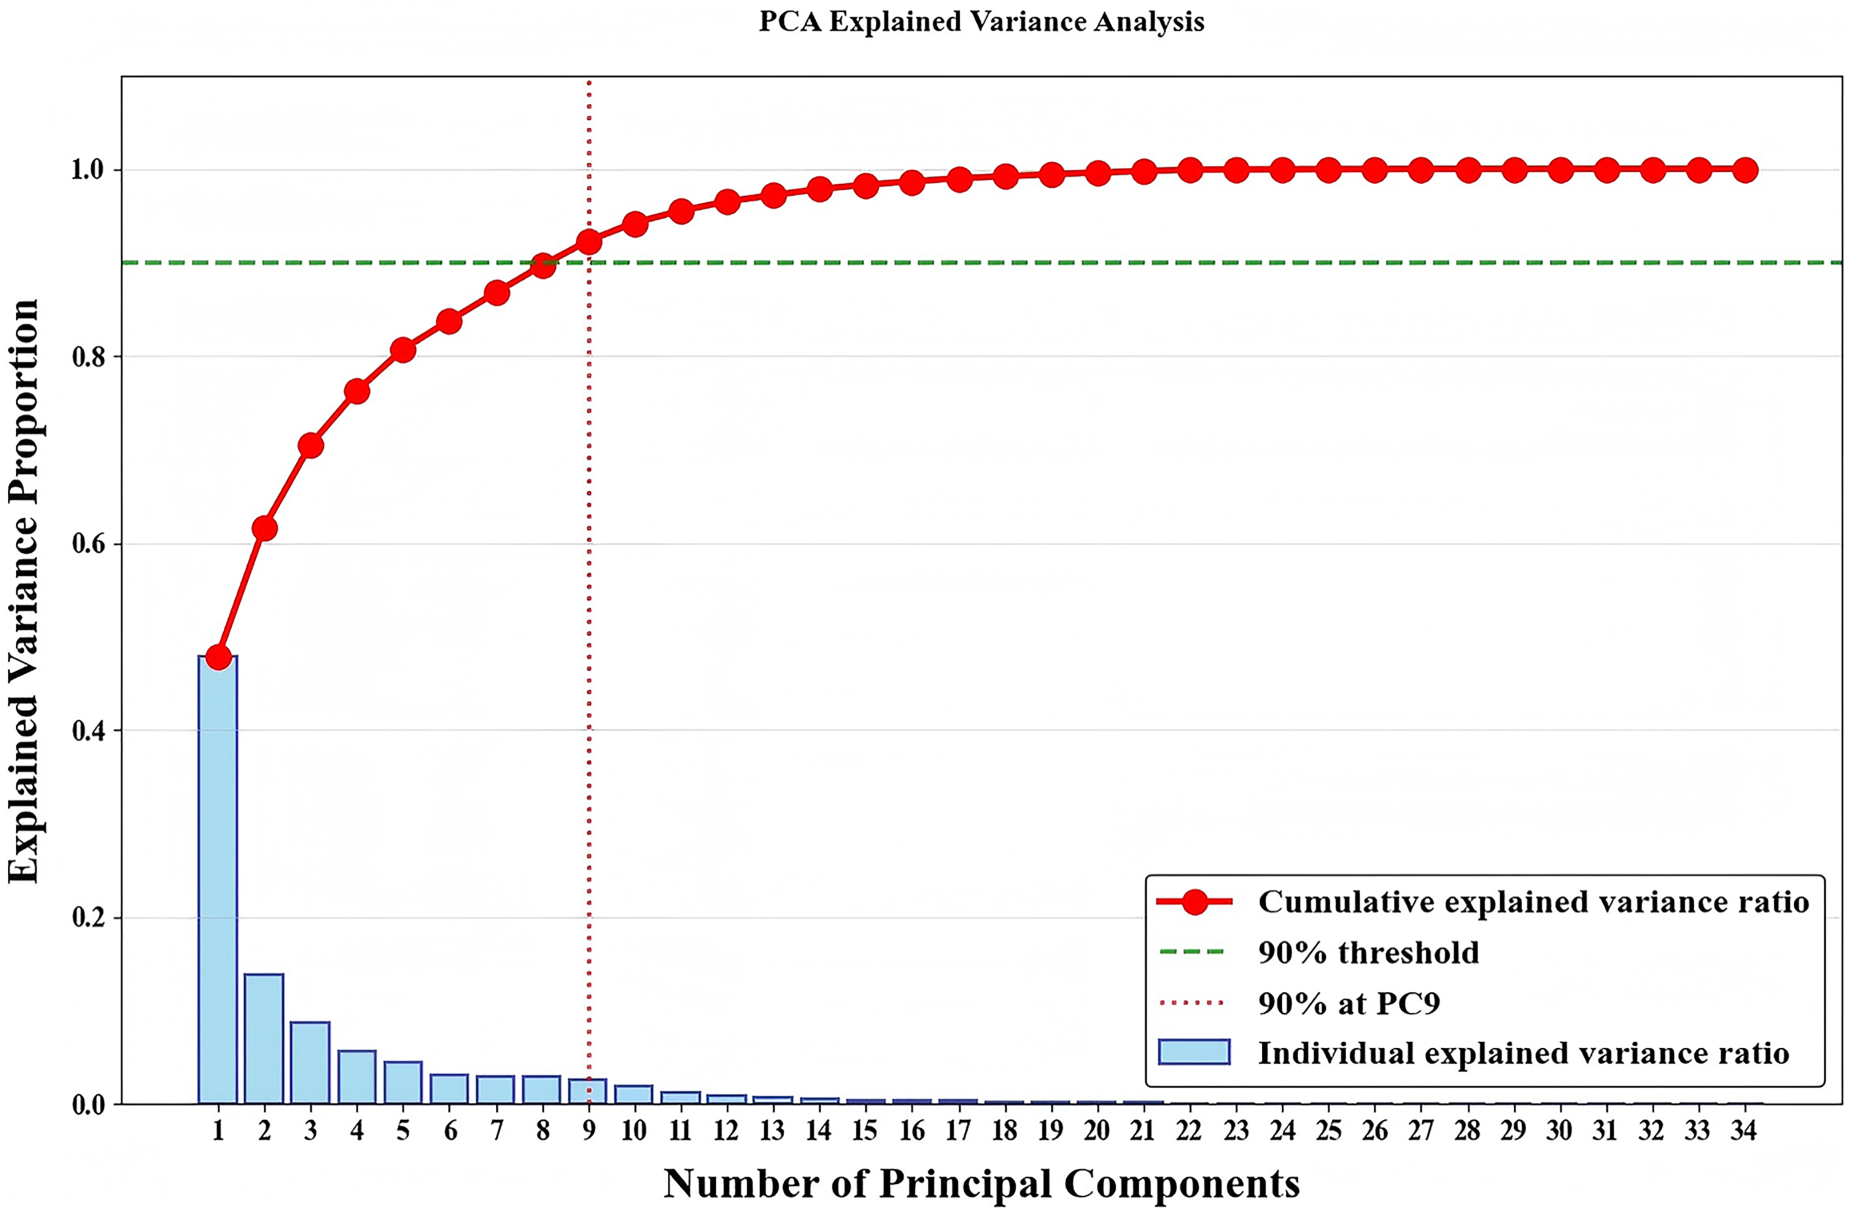
PCA cumulative variance ratio curve.
To identify the most representative original variables contributing to these components, we adopt a weighted loading analysis. Specifically, for each feature 
Using a threshold of 15.00% for the normalized scores, eight high-impact features are selected: dn_perc, dn_med, ln_perc, TSG_JC, dn_max, bf_perc, ln_mode, TSG_CRmtr. These variables will serve as the foundation for the subsequent visual analysis of behavioral clustering.
To further interpret the behavioral characteristics of different groups of students, we used a multidimensional visualization approach based on the eight key behavioral characteristics. As shown in Figure 5, we utilized an improved parallel coordinates plot, where multiple standardized behavioral dimensions are represented as parallel vertical axes. The average values of each group across these dimensions are connected via polylines, forming a visual trajectory that reflects the overall behavioral tendencies of each group.
Visualization of clusters based on core features.
To capture variability within the cluster, the visualization incorporates semitransparent bands around each polyline to represent one standard deviation above and below the mean. This augmentation enables not only the identification of intercluster behavioral differences but also provides insight into intracluster consistency or heterogeneity across dimensions.
The figure illustrates the distributional patterns of five clusters (from cluster one to cluster five) across key features: Cluster one: shows consistently low values across most dimensions, particularly for lunch-related features (ln_perc, ln_mode), suggesting an extremely low frequency or absence of lunch activities. Similarly, values for library usage (TSG_JC, TSG_CRmtr) are minimal, indicating infrequent and narrowly distributed access. The wide standard deviation bands across features imply high within-group variability and behavioral inconsistency. Cluster two and Cluster four: exhibit similar profiles in dining behavior, with higher average values across all meal-related dimensions, reflecting consistent and frequent on-campus dining activities. However, their distinction lies in library behavior: Cluster four demonstrates much higher values in both TSG_JC and TSG_CRmtr, implying frequent and diverse library usage, while Cluster two shows near-zero values, indicating a near-complete absence of library engagement. Moreover, Cluster four displays broader deviation bands in most dimensions, suggesting greater behavioral diversity within the group compared to Cluster two. Cluster three: is characterized by the lowest breakfast participation (bf_perc) and relatively high values for lunch and dinner features. It also demonstrates frequent and temporally diverse library usage, suggesting an active and flexible academic routine. However, in terms of the standard deviation range, Category 3 exhibits a larger fluctuation interval in some feature dimensions. Cluster five: presents extreme values near zero in all dinner and library related characteristics, suggesting almost no involvement in on-campus evening meals or academic facility use. This group reflects a group with minimal participation in structured campus activities and notably low variability between characteristics, indicating high behavioral consistency, although in an anomalous or disconnected pattern.
In general, this visualization offers an interpretable, information-rich representation of both the central tendencies and the variabilities within each cluster, facilitating a comprehensive understanding of the student’s behavior patterns across the selected key dimensions.
To further uncover students whose behavioral patterns diverge from peer norms, we perform unsupervised anomaly detection based on the cluster structure. Specifically, we first detect clusters that exhibit abnormal internal variability using a robust cluster-level detection method, and subsequently identify individual-level anomalies within those clusters through a local density-based approach. This two-stage process enables the discovery of both structurally unstable behavioral groups and behaviorally disconnected individuals.
ROCF-based detection of anomalous clusters
To identify structurally unstable groups, we adopt a modified ROCF approach that emphasizes intra-cluster behavioral variance rather than cluster size. High internal variance suggests behavioral heterogeneity and potential anomalies. The ROCF value combines the variance of each cluster 
A higher ROCF indicates a sharp increase in behavioral dispersion, flagging the corresponding cluster as behaviorally anomalous.
The ROCF-based detection results are shown in Table 7. Cluster 5 emerges as a statistically anomalous group, exhibiting the highest total intra-cluster variance and the largest ROCF score, which suggests internal behavioral volatility and potential structural deviation. Cluster 3 is not assigned a TL or ROCF score due to the lack of a subsequent cluster in the sorted sequence. Importantly, prior analysis of Cluster 3 in Section 5.3 has shown relatively regular and positive behavioral tendencies, indicating that this group is behaviorally distinct but not structurally anomalous.
ROCF-based anomaly indicators for behavioral clusters.
To further identify local anomalies within Cluster 5, we employ the Local Outlier Factor (LOF) algorithm,
41
which detects deviations based on local density. For each student 
We apply LOF to Cluster 5 with
To visually interpret the detected outliers’ behavioral deviations, original features are grouped into four categories: (a) Turnstile and Library Access, (b) Breakfast, (c) Lunch, and (d) Dinner. Standardized values of each feature are plotted in the form of heatmaps, as shown in Figure 6. Red tones indicate significantly above-average behavior, while blue tones indicate suppression or absence of activity.
Differential heatmaps of student behaviors across (a) campus gate and library, (b) breakfast, (c) lunch, and (d) dinner.
The heatmaps reveal distinct patterns of deviation among the five detected students, indicating that the identified outliers do not follow a single anomalous trajectory but instead fall into distinct subtypes of behavioral disconnection. Based on these differentiated patterns, the behavioral profiles of the outliers are further summarized as follows: Outlier 1: displays consistently high values across nearly all dimensions. This student exhibits exceptionally frequent gate crossings, long campus stay durations, and intensive library use. Their meal-related behaviors are also highly active, suggesting a highly regular yet over-engaged behavioral pattern. Outlier 2: also demonstrates above-average library-related activity, but exhibits almost no lunch or dinner records, indicating fragmented engagement or an unusual schedule. Outliers 3–5: display a highly consistent pattern of abnormal behavior. Across all dimensions except dinner-related features, these students exhibit either zero values or complete data absence. In contrast, they show abnormally high values in specific dinner indicators. This consistent trend suggests that these individuals may follow a hidden behavioral mode, engaging in observable campus activities exclusively during evening hours. Their lack of presence across daytime dimensions points to either a disconnection from typical daily routines or potential gaps in behavioral data collection.
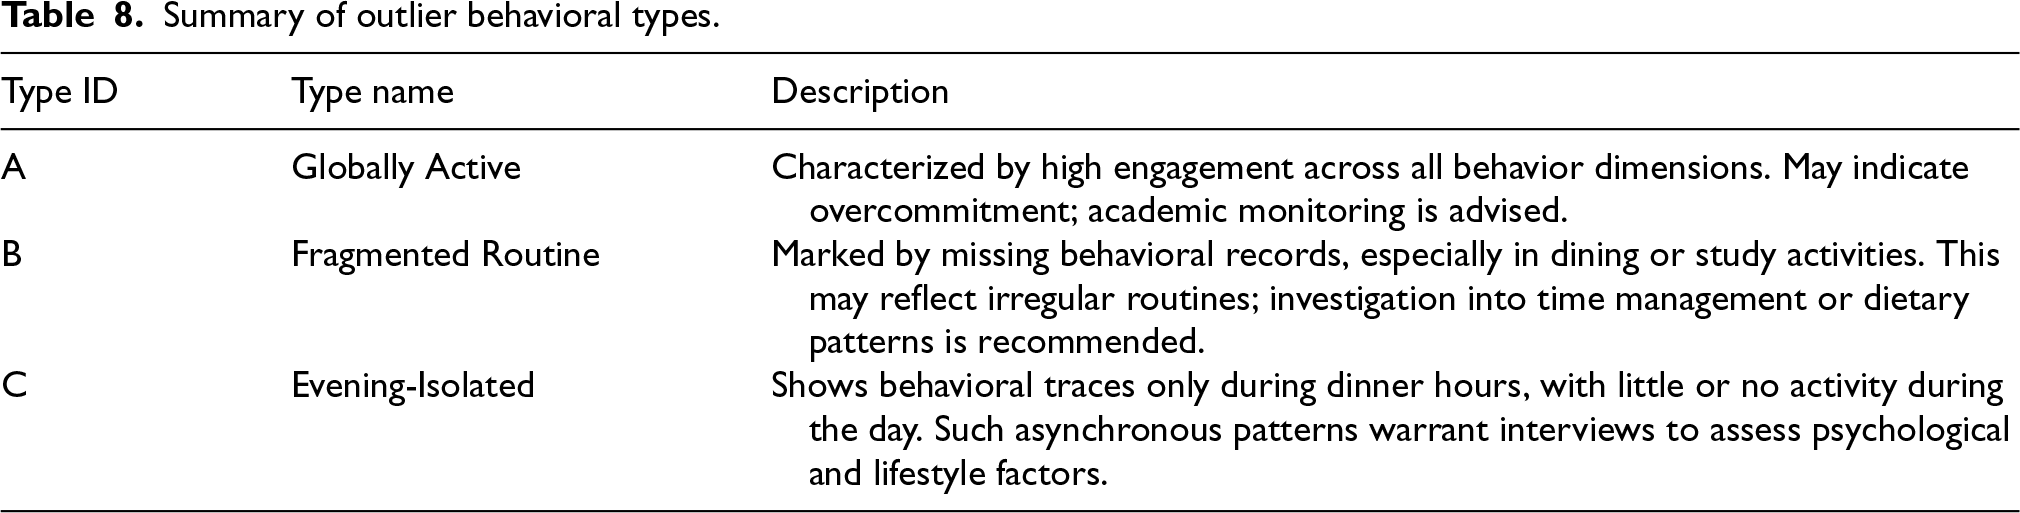
These outliers can be broadly categorized into three behavioral types, as summarized in Table 8.
Summary of outlier behavioral types.
To investigate the potential connection between behavioral anomalies and academic performance, we assessed the similarity between the behavioral profiles of students on academic probation and the three previously identified anomalous behavior types. While behavioral abnormality and academic risk are conceptually distinct, overlaps may exist. This analysis aims to explore whether behavioral anomaly profiling could offer supplementary insight for identifying at-risk students.
We computed the Euclidean distance between each of the 12 academically flagged students and the centroid profiles of the three anomaly types, resulting in a similarity matrix shown in Figure 7. For interpretation, higher similarity values indicate closer alignment in behavioral patterns. Rather than applying rigid thresholds, we focused on relative differences in similarity to identify the dominant pattern for each student.
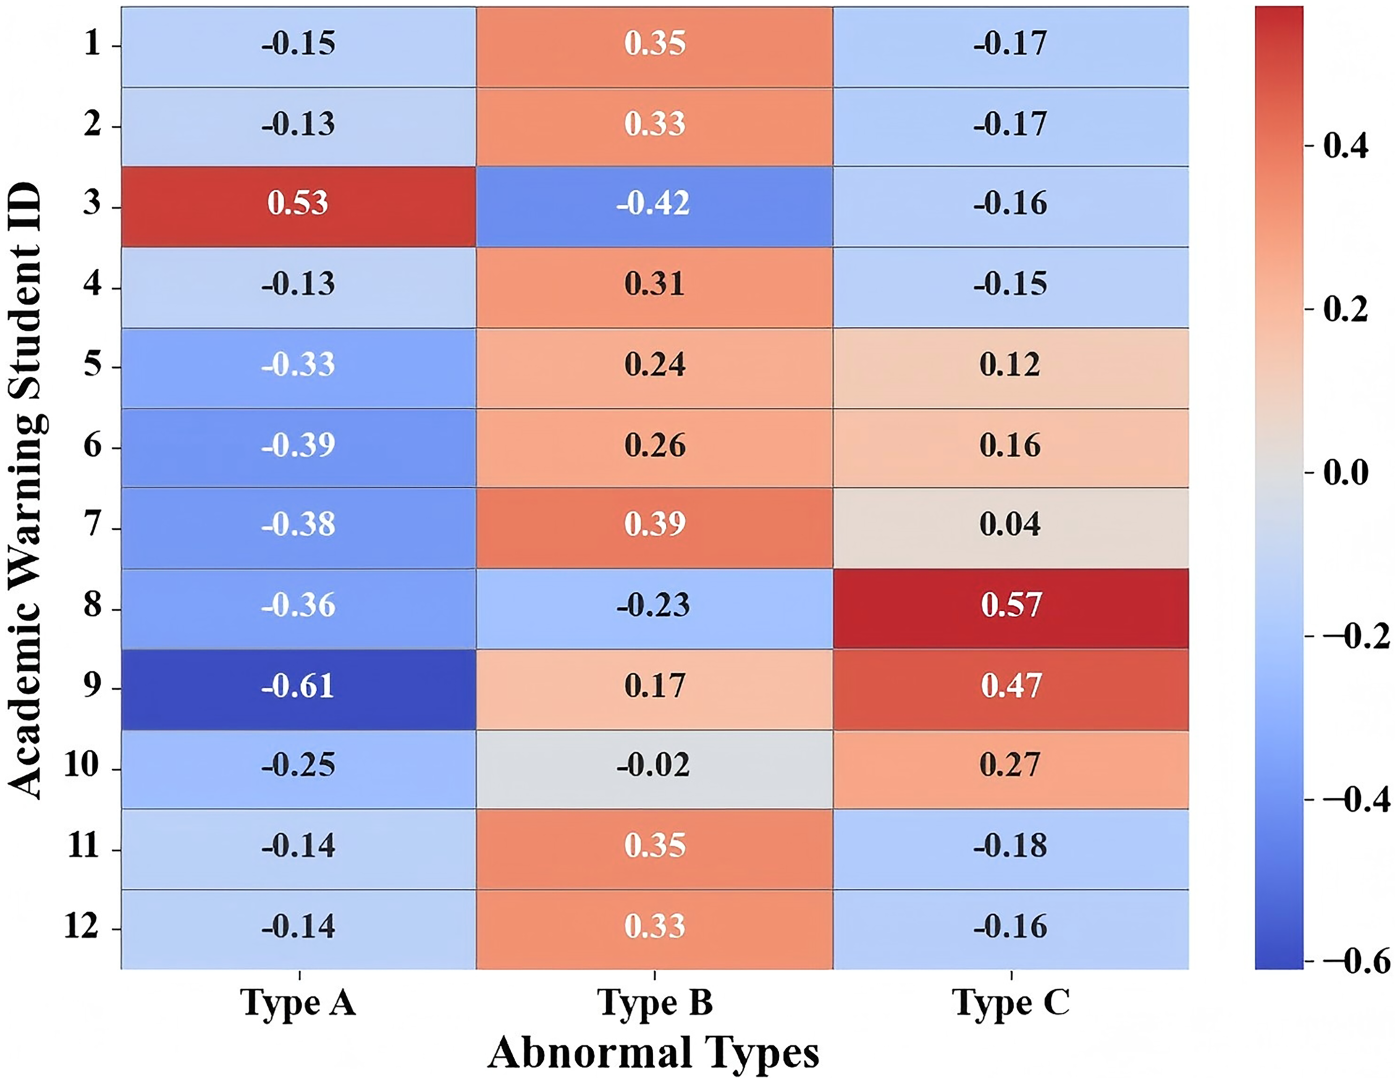
Similarity matrix between academic warning students and abnormal types.
The analysis revealed that 9 out of the 12 students demonstrated a clear proximity to one behavioral anomaly type: six students (ID 1, 2, 4, 7, 11, 12) were most closely aligned with Type B, one student (ID 3) showed highest similarity to Type A, two students (ID 8, 9) closely matched Type C.The remaining three students (ID 5, 6, 10) did not exhibit strong alignment with any of the defined types.
These results offer a preliminary validation for the behavioral anomaly typology, indicating that it captures meaningful patterns present in a portion of the academic risk population. While not all students fit within the current classification, the alignment observed in the majority suggests that behavioral data can provide valuable complementary signals for academic risk identification. Future research could further enrich the anomaly taxonomy by incorporating a broader set of at-risk cases and refining behavioral descriptors.
In conclusion, BehavGLM demonstrates a powerful and interpretable framework for modeling complex student behaviors from structured campus data. By effectively capturing both latent semantic patterns and inter-student relationships, it achieves notable improvements in clustering performance and enables the detection of meaningful behavioral anomalies. And the framework facilitates deeper insights into student routines, supports early identification of outliers, and provides a foundation for behavior-aware educational decision-making. These results highlight BehavGLM’s potential in large-scale learning analytics systems, with promising applications in dynamic monitoring and personalized student support.
Future work will focus on extending the framework to incorporate real-time behavioral data streams and longitudinal student records. Furthermore, we also plan to explore more diversified graph building strategies in future research, to address the limitations of relying solely on behavioral similarity assumptions for student graph building.
Ethical approval and informed consent statements
Not applicable
Funding
The author(s) disclosed receipt of the following financial support for the research, authorship, and/or publication of this article: This work was supported by the National Science and Technology Major Project [grant number 2022ZD0117102]; the National Natural Science Foundation of China [grant numbers 62472014, U21B2038]; the Beijing Natural Science Foundation [grant number 4222021]; and the R&D Program of Beijing Municipal Education Commission [grant number KZ202210005008].
Footnotes
Declaration of conflicting interest
The authors declared no potential conflicts of interest with respect to the research, authorship, and/or publication of this article.
Data availability
Due to the nature of this research, participants of this study did not agree for their data to be shared publicly, so supporting data is not available.