
Abstract
Using a survey of more than 18,000 taxpayers in North Rhine-Westphalia (Germany), we estimate the income tax compliance costs of German households and study the determinants of these costs. We find that taxpayers need between 9.13 and 10.23 hours and spend €106 to meet their income tax obligations. The average total burden is between €228 (lower bound estimate) and €321 (upper bound estimate). The aggregate cost burden ranges between 2.03 percent and 2.92 percent of the German income tax revenues of tax year 2015. Although these costs have decreased significantly over recent years (mainly for self-preparers without self-employment income), international comparisons illustrate that the German burden is still located in the upper middle. The five most important cost drivers that increase individual costs are the use of tax advice, the appeal procedure, income, return complexity, and education. We cannot confirm that e-filing reduces taxpayers’ compliance costs.
Introduction
Taxes reduce the resources of taxpayers both directly and indirectly. The direct cost is the tax payment itself, while the indirect costs include distortions in the behavior and resources used to comply with the tax law (Vaillancourt and Clemens 2008, 55). The objective of tax policy should be to raise sufficient revenue in a manner that minimizes these indirect costs (Alm 1996); in the words of Smith (1776, 889), “Every tax ought to be so contrived as both to take out and to keep out of the pockets of the people as little as possible, over and above what it brings into the public treasury of the state.” Against this backdrop, this article examines the amount and determinants of the income tax compliance costs of German households.
Although a number of studies have investigated the tax compliance burden of individual taxpayers in Australia, Canada, the United Kingdom, and the United States (for a review, see Eichfelder and Vaillancourt 2014), research regarding the German income tax system is scarce. Earlier studies conducted by Tiebel (1986) and the Rheinisch-Westfälisches Institut für Wirtschaftsforschung (RWI, 2003) are either poorly documented or not publicly available. The only English-language study, published by Blaufus, Eichfelder, and Hundsdoerfer (2014), is related to tax year 2007. However, since 2007, the German government has been implementing various measures to simplify the German income tax system (German Government 2018a, 2018b). In particular, many taxpayers no longer have to declare their capital income on their tax returns because a final withholding tax on private capital income was introduced in 2009. Moreover, the Tax Simplification Act of 2011 increased the standard deduction for employees, and the usage of electronic filing (e-filing) tax returns has significantly expanded, increasing from 5.5 million in tax year 2007 to 20 million in tax year 2015 (Janson 2017). To the best of our knowledge, there exists no other research providing current compliance cost estimates for Germany that can indicate whether the tax simplification measures have achieved their objective. In this context, the results from Germany are particularly interesting, as the government has explicitly formulated the goal of reducing bureaucratic costs and is thus obliged to adhere to this goal. 1 Nevertheless, whether the attempts to simplify the tax law and tax procedure were successful is an open question. International evidence gives some cause for skepticism. For example, Tran-Nam, Evans, and Lignier (2014) demonstrate that despite simplification initiatives, the Australian personal taxpayer compliance costs have grown by approximately 73 percent since 1995. On the other side, Klun (2009) finds that the tax compliance costs decreased significantly since 2000 in Slovenia. Since Germany is one of the largest economies in the world and thus might serve as a role model, determining the effect of tax simplification attempts is particularly valuable.
We use tax compliance cost data on more than 18,000 German taxpayers collected by a survey conducted by the Ministry of Finance of North Rhine-Westphalia, the most populous federal state in Germany. The online survey, conducted from April to December 2016, contains detailed questions regarding (1) the amount of time that taxpayers needed to fill out their tax return; (2) the amount of time needed to collect receipts; (3) the amount of time needed to clarify tax issues (own research or with a tax advisor/tax assistance association); (4) the amount of time spent on tax appeals, actions, and so on; and (5) the amount of money that taxpayers spent on preparing their 2015 income tax return (e.g., for professional tax advice, tax guide books, PC tax software, or similar). To the best of our knowledge, these data represent the largest data set on the income tax compliance costs for Germany that has been examined to date.
In line with previous research, we define compliance costs as the sum of monetary expenses and the monetized time effort. To make our results comparable to those of Blaufus, Eichfelder, and Hundsdoerfer (2014), we provide lower and upper bound estimates that differ in terms of how the time categories are considered; in our study, the time effort is valued either with after-tax wage rates (lower bound) or with pretax wage rates (upper bound). We find that taxpayers need, on average, between nine and ten hours to prepare their income tax returns. More than 75 percent of the total time is spent collecting and sorting receipts and completing the tax return forms. The average monetized tax compliance expenses amount to €106, and the average total burden is between €228 (lower bound) and €321 (upper bound). To identify the determinants of these tax compliance costs, we conduct several multivariate analyses. We find that the five most important cost drivers that increase individual costs are (1) the use of tax advice, (2) the appeal procedure, (3) income, (4) return complexity (measured by the number of income sources of the taxpayer), and (5) education (measured by having a university degree). Interestingly, we cannot confirm that e-filing reduces taxpayers’ compliance costs compared to taxpayers who use the traditional paper forms. This result is in line with Eichfelder and Schorn (2012) and Eichfelder and Hechtner (2018), who do not find significant effects of an electronic data interchange on the compliance burden of businesses. However, this finding contradicts studies on the effect of prefilled electronic tax returns (which were introduced in Germany in 2014). Goolsbee (2006) and Klun (2009) report a significant decrease in compliance costs due to prefilled tax returns in the United States and Slovenia, respectively. Notably, however, prefilled electronic tax returns were not introduced in Germany until 2014, and according to information from the Ministry of Finance in North Rhine-Westphalia, the use of prefilled returns in 2016 was still very low (<5 percent of all tax returns). Thus, regarding the effect of e-filing, we conclude that further research is needed.
Using the inflation-adjusted data from Blaufus, Eichfelder, and Hundsdoerfer (2014), we are able to demonstrate that total income tax compliance costs decreased significantly from 2008 (tax year 2007) to 2016 (tax year 2015). However, this decrease is primarily based on a reduction in time effort for taxpayers who neither have self-employment income nor use professional tax advice. This finding suggests that the abovementioned tax simplification measures mostly benefited employees who self-prepare their tax returns.
Following the microsimulation approach of Blaufus, Eichfelder, and Hundsdoerfer (2014), we obtain a total income tax compliance burden for Germany of €5.47 billion (lower bound estimate) to €7.87 billion (upper bound estimate), which amounts to 2.03 percent to 2.92 percent of the German income tax revenues of tax year 2015 (including the solidarity surcharge). In contrast, the corresponding estimates for tax year 2007 amount to 3.1 percent to 4.7 percent. 2 Consequently, this analysis provides evidence that the compliance costs in Germany decreased over the last decade, even though the number of tax returns increased. The increase in tax returns can be partially explained by the increased number of pensioners who have to file a tax return after 2005 due to the transition from an immediate pension tax system that taxes retirement savings upfront to a deferred pension tax system that taxes savings in retirement. We estimate that this pension reform increased the aggregate compliance burden of the German income tax system in 2015 by approximately €449 million (lower bound) to €560 million (upper bound) compared to the prereform costs in 2004.
Although the compliance costs of German households seem to have fallen between 2008 and 2016, international comparisons illustrate that the German burden is still located in the upper middle (for a tabular review, see Blaufus, Eichfelder, and Hundsdoerfer 2014). By far, the largest compliance burden is imposed by the US income tax system (8.3 percent of the tax revenues in 2000; Guyton et al. 2003), followed by the Australian tax system (7.31 percent in 2011/2012; Tran-Nam, Evans, and Lignier 2014). In contrast, the relative compliance burden of other countries seems to be lower than that of the German income tax system (e.g., Croatia [0.9 percent in 2001; Blažić 2004], the Netherlands [1.4 percent in 1990; Allers 1994], Spain [1.3 percent in 1999, Delgado Lobo, Salinas-Jiménez, and Sanz Sanz 2001], and Slovenia [0.9 percent in 2006; Klun 2009]). The relative cost burden of the Canadian tax system (2.2 percent to 3.2 percent in 2007; Vaillancourt, Roy-César, and Barros 2013) seems to be comparable to our estimates. However, international comparisons should be conducted with caution due to the different research designs used in these countries as well as differences in tax rates and tax burdens (Eichfelder and Hechtner 2018). 3
The remainder of this article is organized as follows: in the second section, we present the survey instrument, variable measurement, and sample selection; in the third section, we examine the determinants of income tax compliance costs via multivariate analyzes; and in the fourth section, we estimate the aggregate compliance cost burden. The last section discusses the results and implications for tax policy and research.
The Survey Instrument, Variable Measurement, and Sample Selection
The Survey Instrument
We use data collected by an online survey conducted by the Ministry of Finance of North Rhine-Westphalia. North Rhine-Westphalia is the most populous federal state in Germany, having 8.48 million taxpayers with unlimited income tax liability (more than 20 percent of the German taxpayer population). The online survey was conducted from April 4, 2016, to December 31, 2016. It was the first time that compliance cost data had been collected by the Ministry of Finance. All taxpayers who received a tax assessment notice in 2016 also received from the Minister of Finance an individual letter inviting them to participate in the online survey. The survey is designed to collect information regarding taxpayers’ evaluation of the quality of the services of the tax administration. It also contains detailed questions regarding (1) the amount of time that taxpayers needed to fill out their tax return; (2) the amount of time spent collecting receipts; (3) the amount of time needed to clarify tax issues (own research or with a tax advisor/tax assistance association); (4) the amount of time spent on tax appeals, actions, and so on; and (5) the amount of money that taxpayers spent on preparing their 2015 income tax return (e.g., for professional tax advice, tax guide books, PC tax software, or similar). Moreover, the questionnaire entails information about the preparation method (tax advisor, tax assistance association, or without external help); the e-filing mode (ELSTER, 4 tax software, and others), the type of filing (joint or single), tax appeals, and socioeconomic data such as the participant’s age, gender, income source, annual gross income (classes, adjusted for the type of filing), educational level, and tax knowledge. The translated questions are reported in Appendix A.
Variable Measurement
To quantify the tax compliance costs of German private households, we define the burden as the monetary expenses (e.g., for tax advisors or tax associations, postage, traveling expenses, or specialized literature) plus the monetized time effort. The applied measurement follows previous research (see Eichfelder and Vaillancourt 2014; Vaillancourt and Clemens 2008; Evans 2003, 2008). Psychological costs are not covered by this study since they are difficult to assess. 5 Moreover, we neglect cash flow benefits and costs, tax deductibility, and managerial benefits. In line with Blaufus, Eichfelder, and Hundsdoerfer (2014), we focus solely on the societal perspective of compliance costs. 6
For any compliance cost study, the monetization of the compliance time effort poses a challenge. Different approaches have been proposed in the previous literature (Pope 1995; Blažić 2004). For example, Sandford, Godwin, and Hardwick (1989) choose taxpayers’ own valuation of time; 7 Sandford (1973), Slemrod and Sorum (1984), and Malmer (1995) consider the amount of money that taxpayers would pay to be released from all compliance costs; Allers (1994) uses the gross domestic product per labor year; and Díaz and Delgado (1995) choose the average income declared by taxpayers corresponding to their principal source of income. Vaillancourt (1989) and Vaillancourt, Roy-César, and Barros (2013) use the usual hourly wage rate before deductions; beyond that, a widely used measure is the after-tax wage rate (Slemrod and Sorum 1984; Blumenthal and Slemrod 1992; Tran-Nam et al. 2000; Malmer 1995; Blaufus, Eichfelder, and Hundsdoerfer 2014; Tran-Nam, Evans, and Lignier 2014).
Unfortunately, none of these calculation methods have gained universal acceptance; thus, studies with different approaches are challenging to compare. To address this concern and to maximize the comparability of our study, we apply two different approaches to monetize the time burden. Therefore, the main objective is to facilitate comparisons with the study of Blaufus, Eichfelder, and Hundsdoerfer (2014) to make statements about the development of compliance costs in Germany. Thus, we apply the same time valuation methods as in Blaufus, Eichfelder, and Hundsdoerfer (2014). To calculate the lower bound, we follow Blumenthal and Slemrod (1992). We assume that compliance activities predominately supplant taxpayers’ leisure.
8
Under this assumption, the after-tax wage rate is the best measure of the social costs (Blumenthal and Slemrod 1992). This assumption is also consistent with neoclassical labor market theory, according to which a rational taxpayer will value a marginal working hour by its marginal value of consumption (Blaufus, Eichfelder, and Hundsdoerfer 2014). Nevertheless, we also consider the possibility that compliance work can be displaced by market work. Because, under these circumstances, the pretax wage is the appropriate measure for the social costs, we rely on the average pretax income per working hour to calculate the upper bound monetized time burden (Blaufus, Eichfelder, and Hundsdoerfer 2014; Vaillancourt, Roy-César, and Barros 2013; Blumenthal and Slemrod 1992). Using the German Socio-Economic Panel,
9
for 2015, we quantify pretax and posttax income per working hour and multiply the hourly rates by the time burden in order to obtain a monetized value. We separate the rates for self-employed and employed taxpayers, income classes, and marital status to obtain more precise estimates.
10
In line with Blaufus, Eichfelder, and Hundsdoerfer (2014), we rely on the actual working hours instead of the contractual working hours. We use the following four time categories: the amount of time that taxpayers need to fill out their tax return, the amount of time spent collecting receipts, the amount of time needed to clarify tax issues (own research or with a tax advisor/tax assistance association), and the amount of time spent on tax appeals, actions, and so on.
In contrast, Blaufus, Eichfelder, and Hundsdoerfer (2014) focus only on two time categories: the time burden for the preparation of the income tax return and the collection of receipts for compliance purposes. To avoid a potential underestimation, the authors expand the time burden using the allocation of the time effort by DeLuca et al. (2005). As a result, their upper bound estimates exceed the lower bound values by 25.2 percent (74.2 percent) for employed (self-employed) taxpayers. Our time estimates cover all time categories of DeLuca et al. (2005); however, similar to Blaufus, Eichfelder, and Hundsdoerfer (2014), our definition of collecting receipts for self-employed taxpayers could be narrower. Thus, we adjust our definition of recordkeeping for self-employed taxpayers and calculate a time upper bound. To be consistent with the proportion of time spent on bookkeeping to the time spent on preparation of the tax return reported by DeLuca et al. (2005), we expand our definition of recordkeeping by the factor 2.28 for self-employed taxpayers (see table B1 in Appendix B). 11 In addition to the monetized time burden, we obtain information regarding the amount of money that taxpayers spent on preparing their income tax return (e.g., for professional tax advice, tax guide books, PC tax software, or similar).
The main dependent variable (Compliance costs) is the natural logarithm of the sum of monetary expenses and the monetized time effort. Alternatively, we use the natural logarithm of the total time burden (Time Burden), the monetized time burden (Monetized time burden), monetary expenses (Monetized expenses), and the time burden for the different time categories (Time to fill out tax returns, Time to collect receipts, Time to clarify tax issues, and Time for tax appeals) as dependent variables.
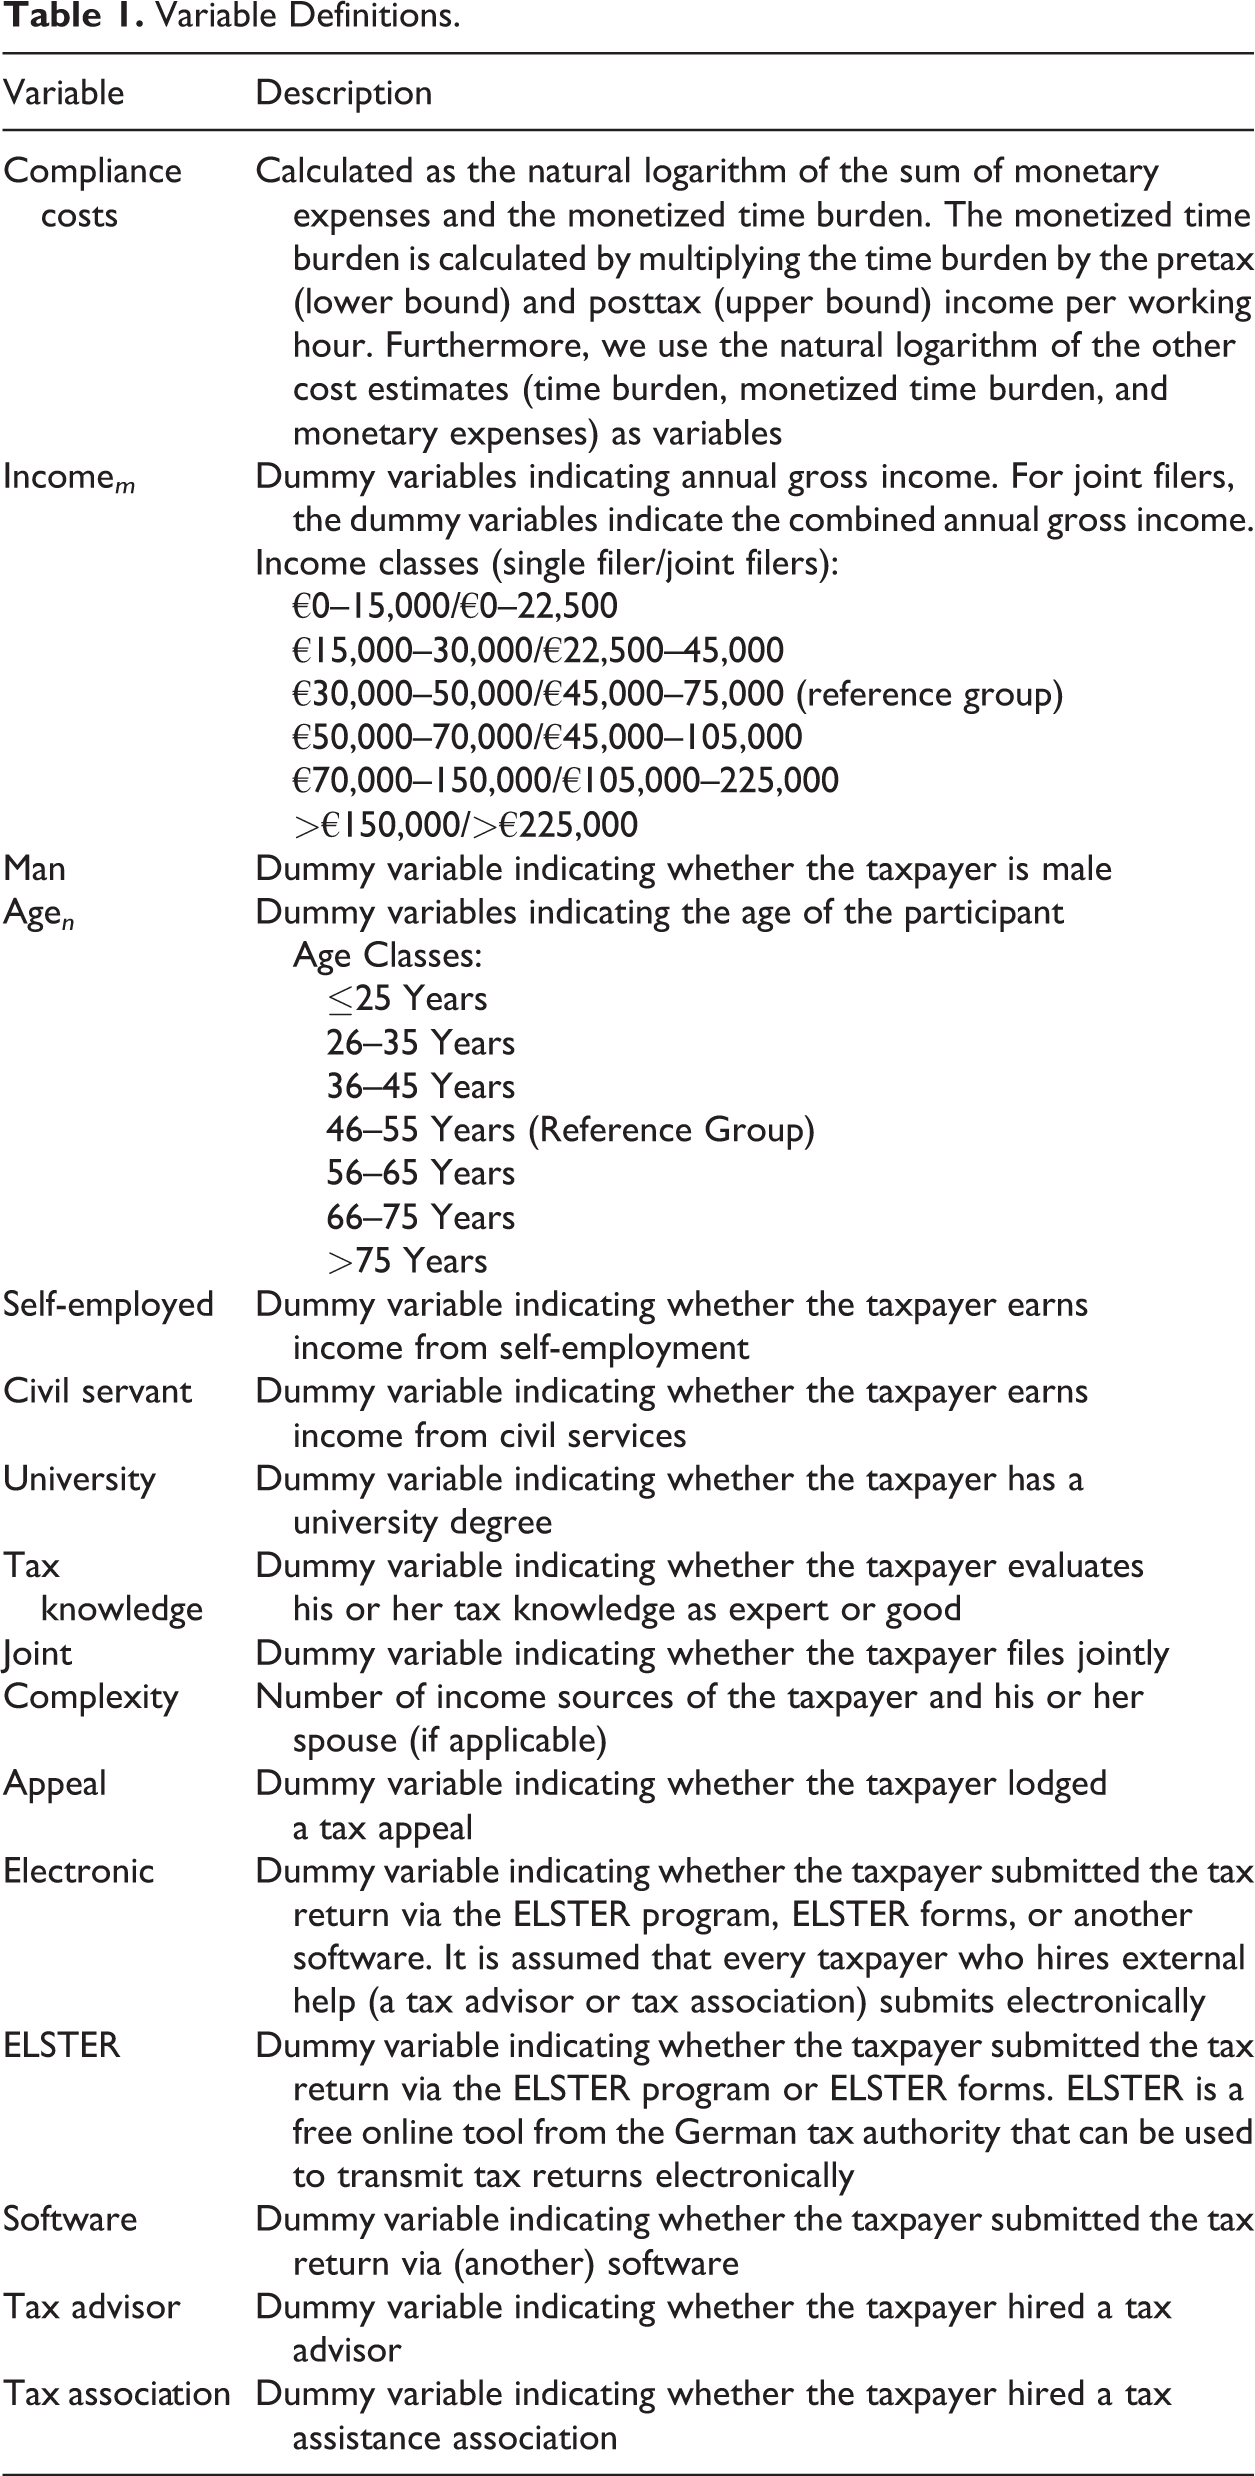
As independent variables, we use the preparation method (tax advisor, tax assistance association, or without external help); the e-filing mode (free online tool of the tax authority: ELSTER, software, or others) the type of filing (joint or single); a dummy variable (Appeal) that indicates whether the taxpayer lodged a tax appeal; Complexity, which measures the number of income sources of the taxpayer and his spouse (if applicable); and socioeconomic data such as the participant’s age, gender, income source, annual gross income (classes), educational level, and tax knowledge. All variables used are listed in table 1.
Variable Definitions.
Sample Selection
In total, 29,851 taxpayers completed the survey, corresponding to a response rate of approximately 0.54 percent (in reference to 5.55 million tax assessment notes). The response rate is low. However, it is within the usual range for German citizen surveys of the Ministry of Finance. Since the response rate in Germany is usually low, the survey was sent with every tax assessment note issued by the tax authorities in North Rhine-Westphalia to ensure a sufficiently large sample size. To prevent a nonresponse-bias, we use weighted data (see below for details). Taxpayers either need time to prepare their tax return or request external assistance. Thus, we delete all taxpayers who submitted neither a cost estimate nor a time estimate for the preparation (2,703 observations). Similarly, we eliminate all taxpayers who stated no time effort at all (1,400 observations) because even taxpayers who hire external help need time to transmit all the necessary information. To further ensure the validity of the data, we conduct some plausibility checks. Taxpayers who hire external assistance but who did not state any cost estimates (413 observations) as well as taxpayers who filed an objection against the last tax return but who did not state any time estimate for tax appeals, actions, and so on (1,113 observations) were removed. Due to the German pay-as-you-earn (PAYE) tax system, not every working individual has to file a tax return. We exclude taxpayers who did not file a tax return in 2016 (2,365 observations). 12 Additionally, we delete taxpayers who did not complete the survey conscientiously (measured by the low amount of time that these taxpayers needed to fill out the questionnaire: 446 observations). 13 Moreover, to exclude unrealistically large cost and time estimates that entail the risk of biasing our results, we use a 99.9 percent truncation. Thus, all taxpayers with a total time effort of 400 hours or more (23 observations) or monetary expenses of €18,382 or more (22 observations) were removed. 14 Finally, we eliminate taxpayers with missing information about gender, age, education, type of filing income, and occupation (3,170 observations), as this information is required in the following analysis. Thus, the empirical analysis is based on a sample of 18,196 observations. To the best of our knowledge, these data represent the largest data set on the income tax compliance costs for Germany that has been examined to date.
To check the representativeness of our sample, we compare several socioeconomic characteristics of the sample with those of the Germany population from the age of fifteen years on. 15 In particular, women, people with low education and people under the age of twenty-five are underrepresented in the sample. As expected, highly educated taxpayers seem to feel inclined to participate in the survey. To avoid a potential bias, we weight the sample with regard to these three socioeconomic characteristics: age, education, and gender. Information about the population is obtained from the 2017 Statistical Yearbook (German Federal Statistical Office 2017). Table 2 presents the weighted and unweighted sample characteristics.
Descriptive Statistics on Compliance Costs Separated by Socioeconomic Information.
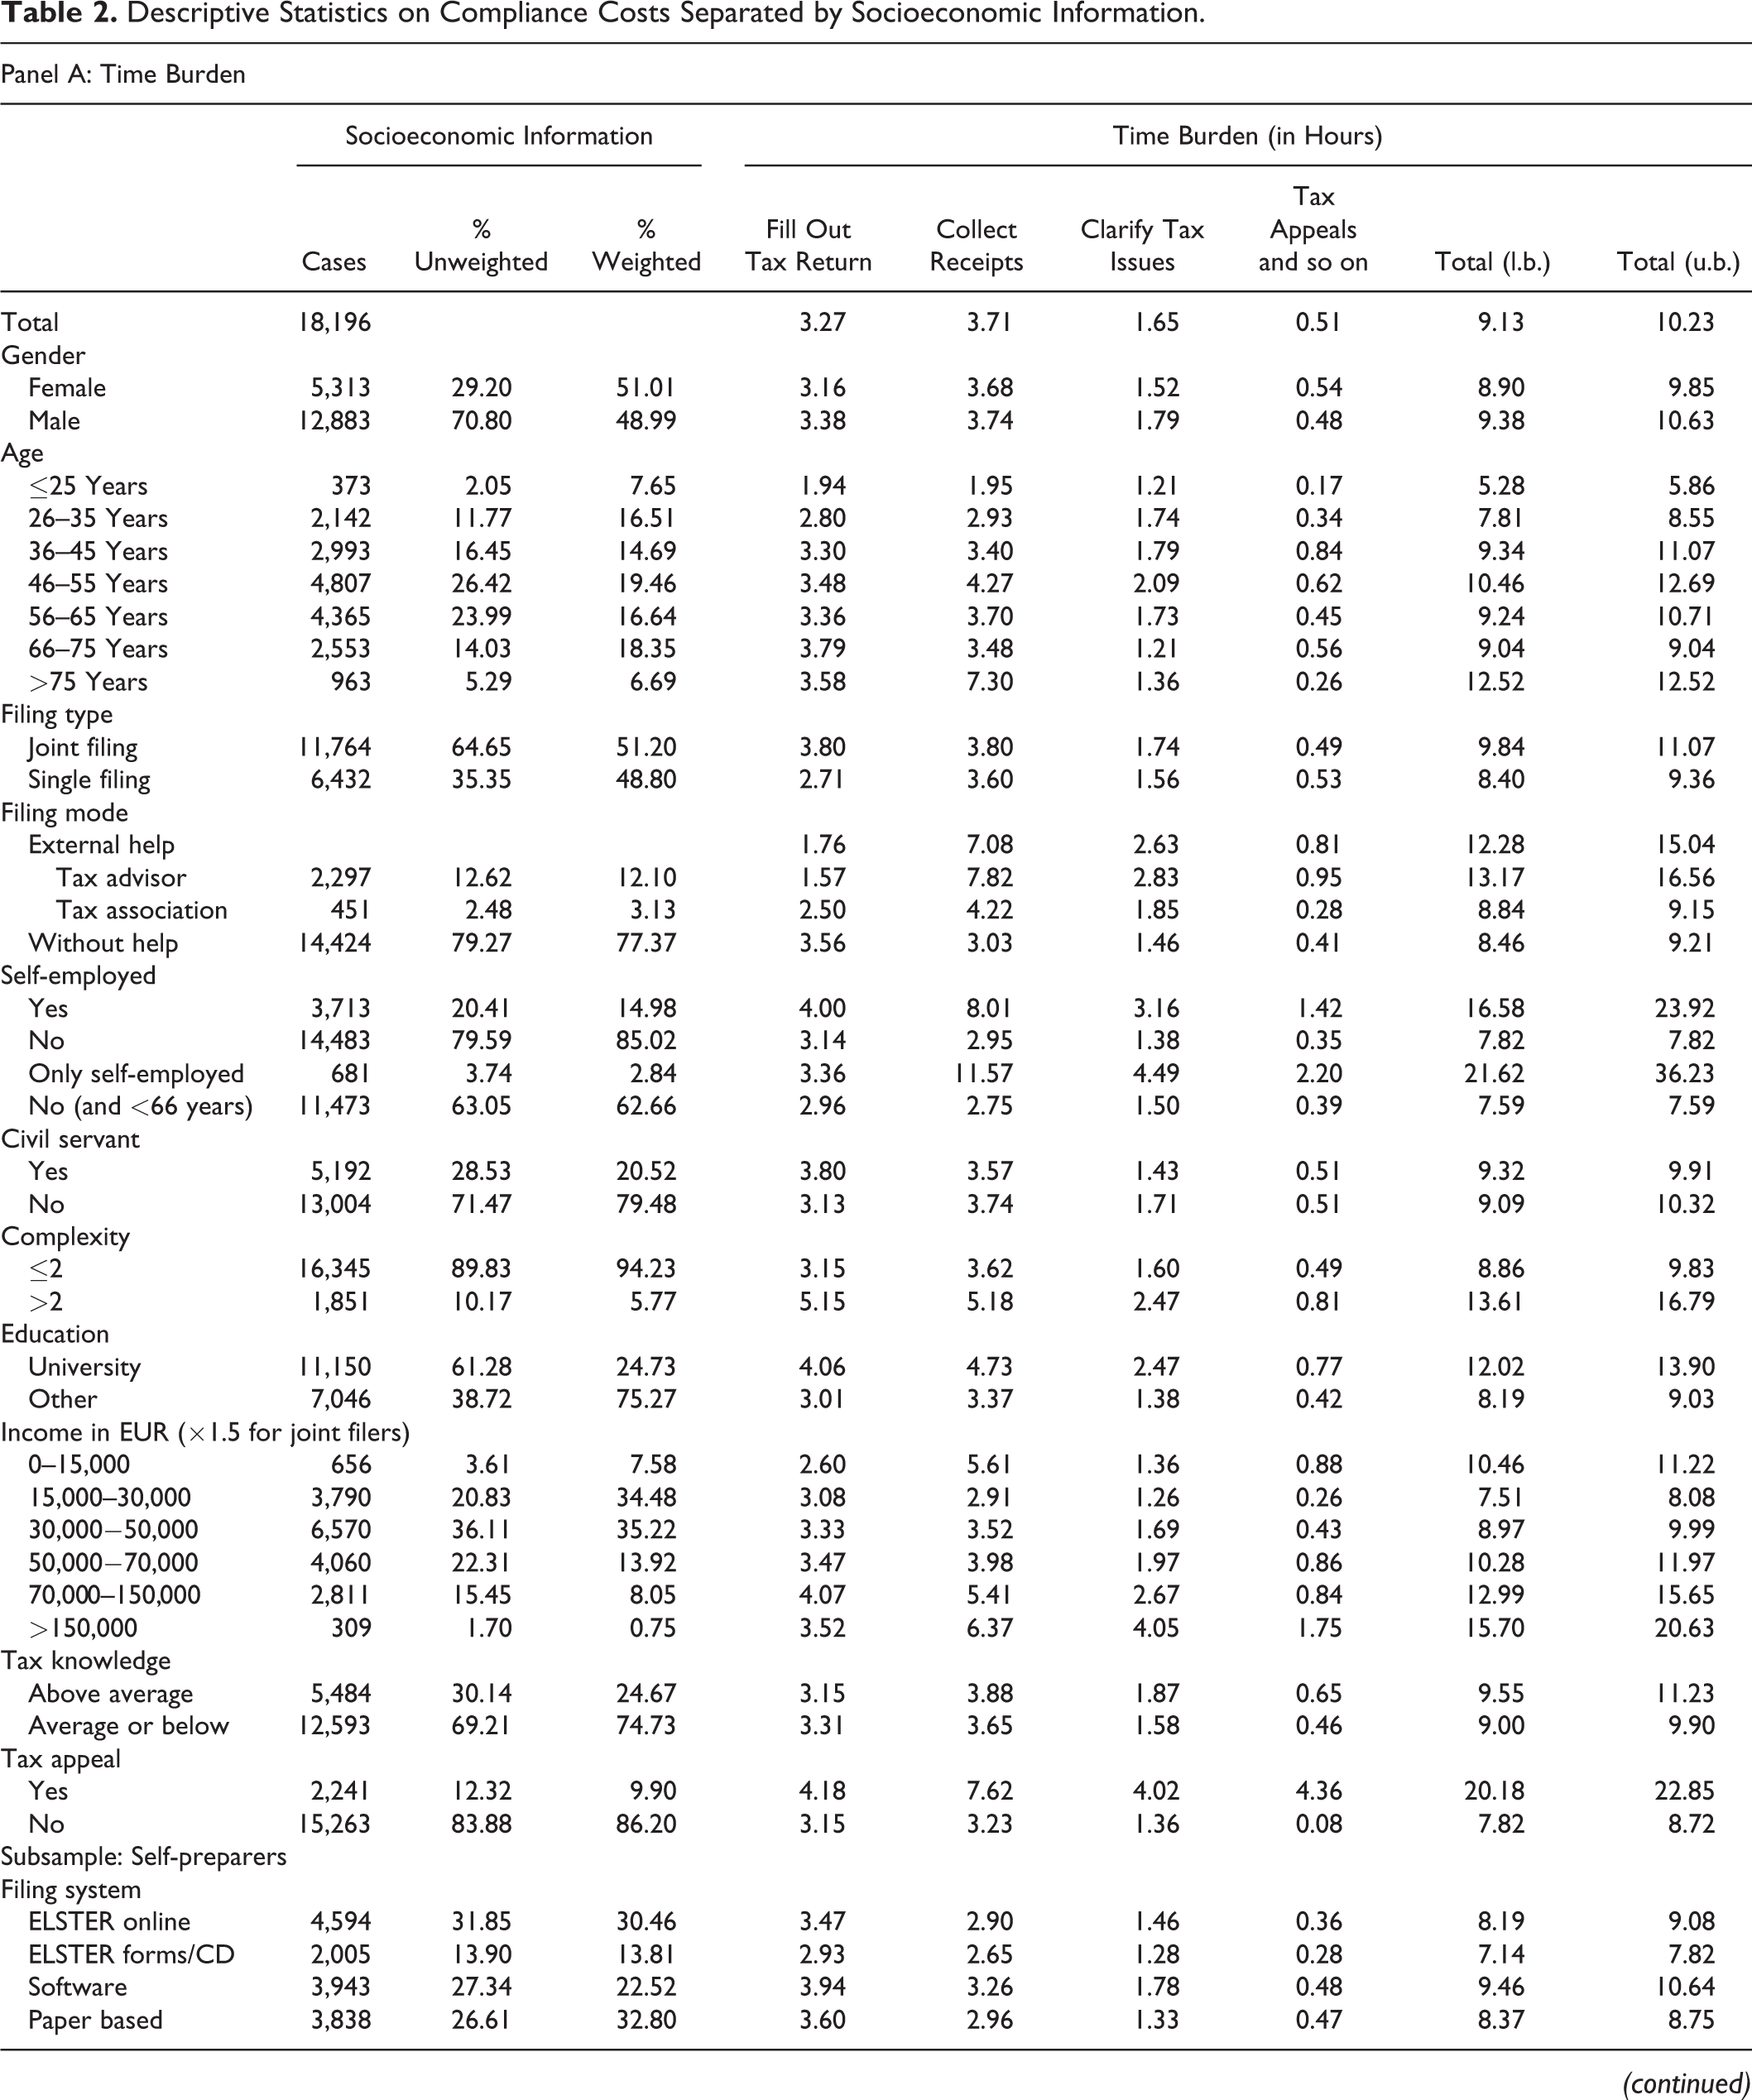
Note: Weight-adjusted mean values.
The Determinants of Income Tax Compliance Costs
Estimation Strategy
We choose a log-level model specification for our regression analysis. Consequently, our regression estimates must be interpreted as semielasticities. While the exact percentage change in the predicted compliance costs is typically calculated as
Apart from classical socioeconomic characteristics, such as gender, educational level, tax knowledge, and age, our regression model controls for the type of filing. We expect the complexity to be increased for joint filers. In addition, we use the taxpayer’s income as another proxy to capture complexity. Furthermore, the complexity of tax calculations usually increases with pretax earnings (Blaufus, Eichfelder, and Hundsdoerfer 2014). Our regression model additionally includes the number of income sources. In Germany, a separate tax return form has to be prepared for every income source. We include binary variables indicating the taxpayer’s income source (self-employment, civil servants, reference: employment and other). The variable Self-employed has been identified as a key cost driver of compliance costs (e.g., Slemrod and Sorum 1984; Blumenthal and Slemrod 1992; Guyton et al. 2003; Vaillancourt, Roy-César, and Barros 2013; Blaufus, Eichfelder, and Hundsdoerfer 2014); it is also a measure of complexity. We further control for tax appeals and the filing system (electronic vs. not electronic). 16 In line with Eichfelder and Schorn (2012) and Eichfelder and Hechtner (2018), we aim to identify the effect of an electronic data interchange. Finally, we try to determine the effect of external help on compliance costs by adding variables that indicate whether the taxpayer consulted a tax advisor or a tax assistance association. The following regression model is estimated:
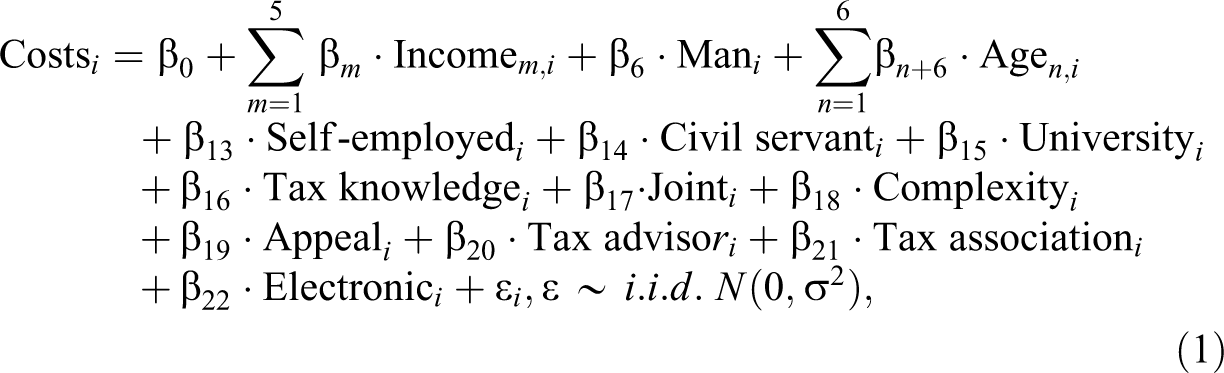
where
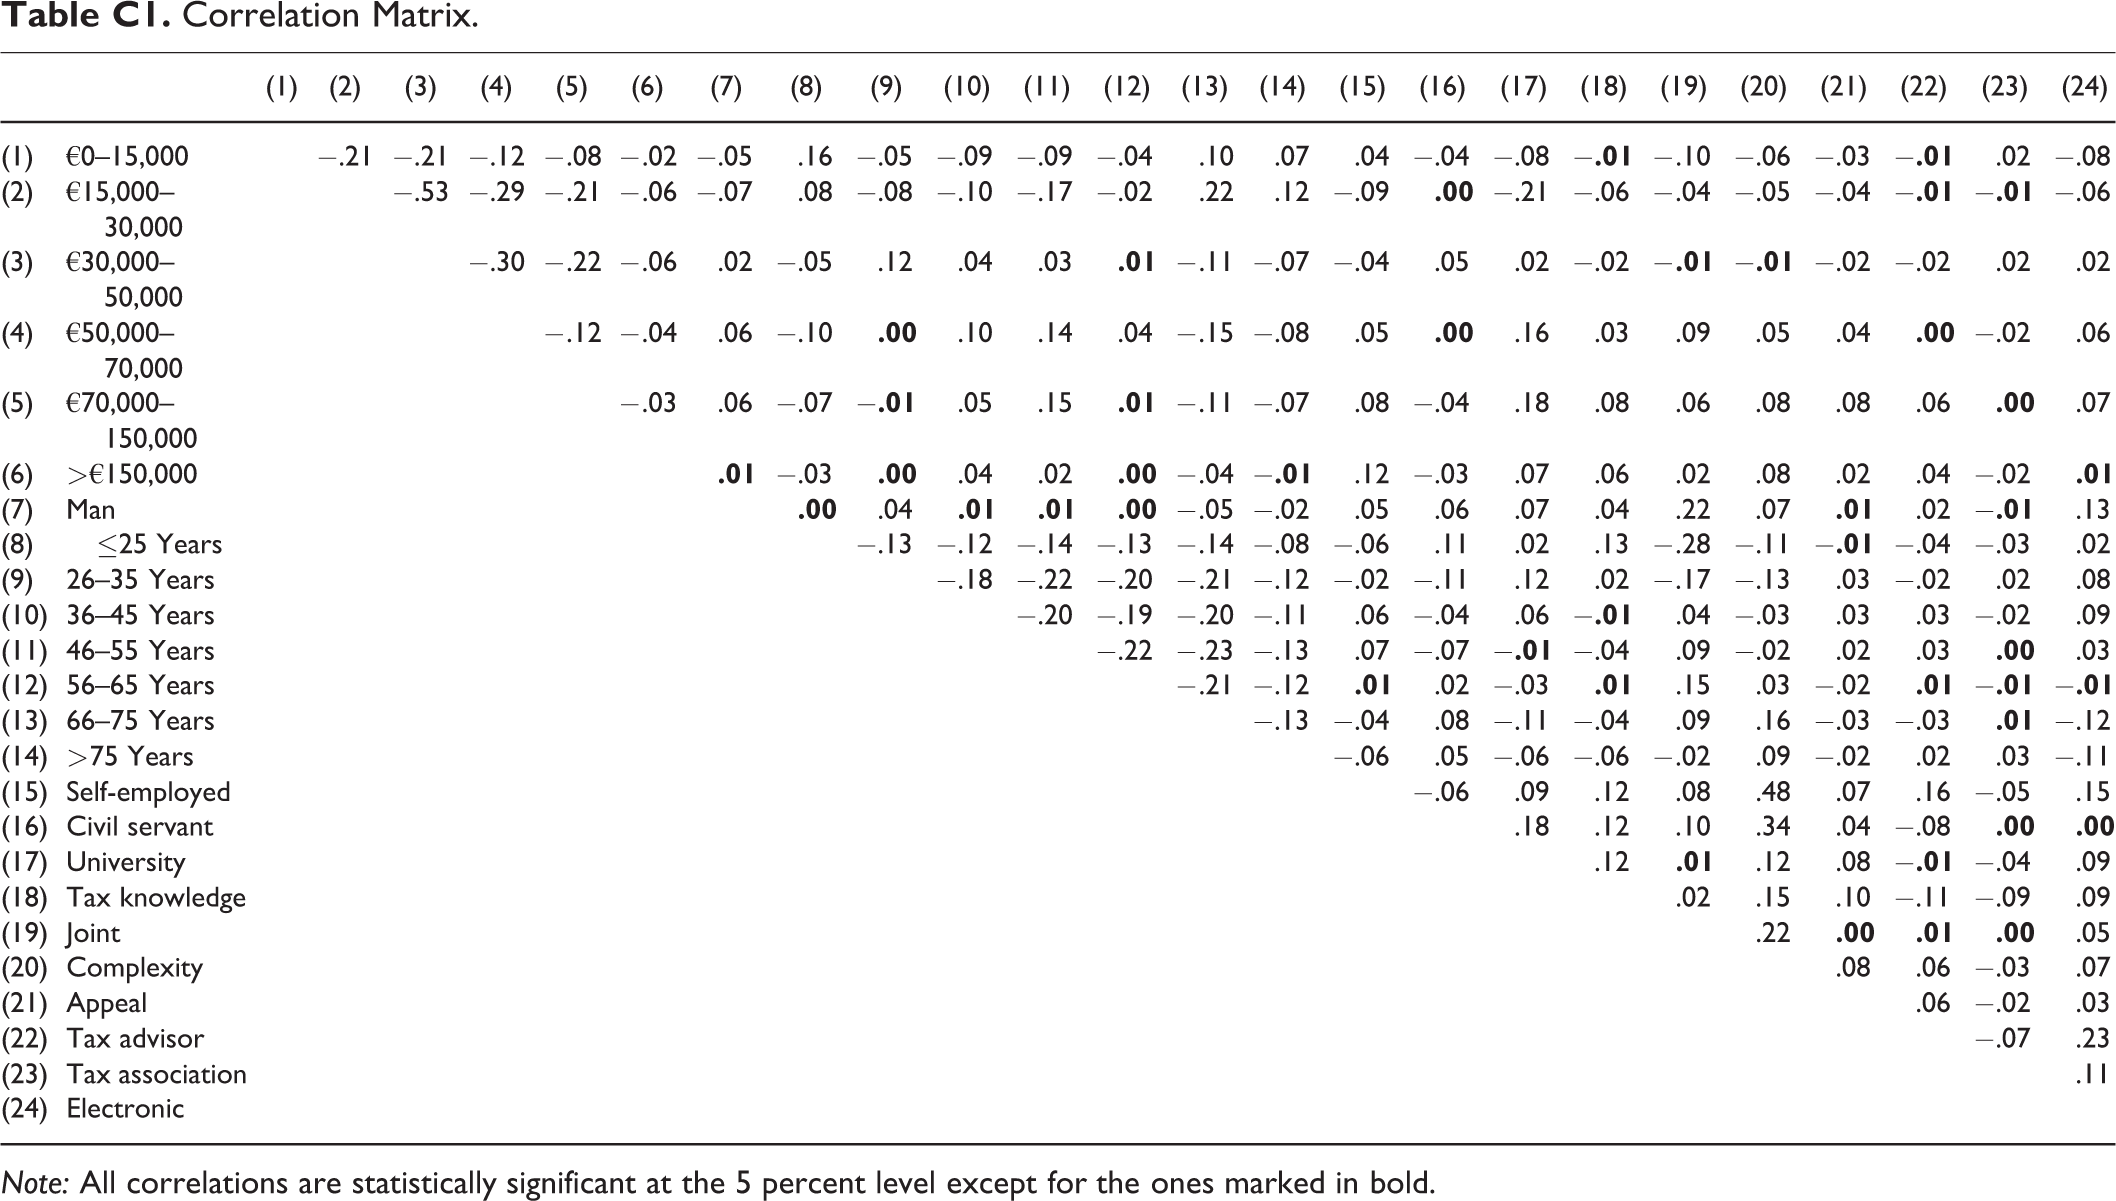
We use Huber/White standard errors to address heteroscedasticity. To ensure that our explanatory variables are not collinear, we calculate the variance inflation factors. The correlation matrix is presented in Appendix C. All the results below are based on weight-adjusted values.
Descriptive Statistics
Table 3 provides the descriptive statistics of the compliance cost estimates. On average, a respondent needs 9.13 hours to 10.23 hours and spends €105.87 for tax compliance work. Most of the time burden results from collecting receipts (on average 3.71 hours), closely followed by the time spent filling out the tax return (on average 3.27 hours). This finding is in line with previous research (Blaufus, Eichfelder, and Hundsdoerfer 2014; RWI 2003; Vaillancourt 1989; Blumenthal and Slemrod 1992). Additionally, the average monetized time effort ranges between €121.75 (lower bound estimate) and €214.98 (upper bound estimate). In total, we obtain weight-adjusted mean compliance costs of €227.62 (lower bound estimate) to €320.85 (upper bound estimate). In line with Allers (1994), Delgado Lobo, Salinas-Jiménez, and Sanz Sanz (2001), and the RWI (2003), we find that the majority of compliance costs are caused by the time effort (53.49 percent to 67.00 percent).
Descriptive Statistics on Compliance Costs.
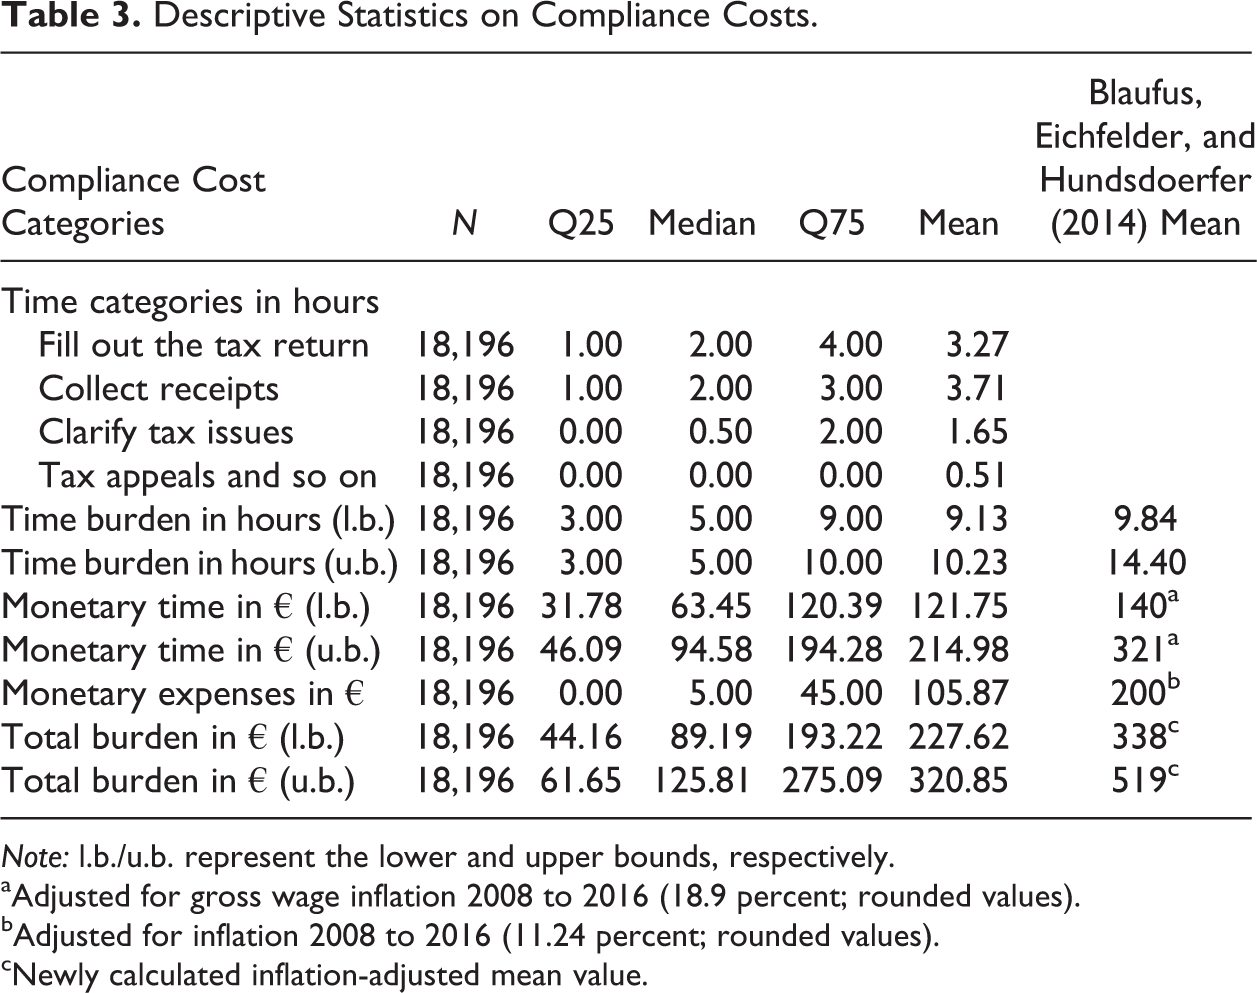
Note: l.b./u.b. represent the lower and upper bounds, respectively.
aAdjusted for gross wage inflation 2008 to 2016 (18.9 percent; rounded values).
bAdjusted for inflation 2008 to 2016 (11.24 percent; rounded values).
cNewly calculated inflation-adjusted mean value.
A direct comparison with the estimates of Blaufus, Eichfelder, and Hundsdoerfer (2014) illustrates that the compliance burden of German households seems to have declined over the last decade. Blaufus, Eichfelder, and Hundsdoerfer (2014) report an average time burden of 9.84 to 14.40 hours, average monetary expenses of €179.88 and a total compliance burden of €297.60 to €449.86 for tax year 2007. Adjusting the estimates of Blaufus, Eichfelder, and Hundsdoerfer (2014) for inflation even increases the difference. As a result, our upper bound estimate of total compliance costs (€320.85) is still less than the inflation-adjusted lower bound estimate of Blaufus, Eichfelder, and Hundsdoerfer (2014; €338). 17 Compared to other earlier compliance cost studies for Germany, our time estimates are the lowest. Tiebel (1986) documents an average time effort of 11.2 hours (including the German wealth tax), and the RWI (2003) reports an average of 15.8 hours. On an international level, German households seem to need less compliance time than in the self-reporting system of the United States (Slemrod and Sorum 1984; Blumenthal and Slemrod 1992; Guyton et al. 2003) but much more time than several European countries such as the United Kingdom (Mathieu, Waddams Price, and Antwi 2010), Slovenia (Klun 2004, 2009), Croatia (Blažić 2004), Spain (Delgado Lobo, Salinas-Jiménez, and Sanz Sanz 2001), and Sweden (Malmer 1995).
To identify whether the compliance costs decreased for a particular group of taxpayers, we compare our results with those of Blaufus, Eichfelder, and Hundsdoerfer (2014) in more detail (table 4). For this purpose, we use the data set of Blaufus, Eichfelder, and Hundsdoerfer (2014) to calculate the required estimates for the specific subgroups. Because the two data sets differ widely in terms of the proportion of taxpayers who use a tax advisor, we use a cross tabulation to control for this deviation. Table 4 indicates that the overall decrease in compliance costs is caused by taxpayers who are not self-employed and do not hire external assistance. 18 This group records a significant reduction in the time burden over the years (9.88 hours vs. 7.28 hours). 19 The implemented tax simplifications are indeed effective, especially for this group of taxpayers. The monetary expenses decrease as well but not to a significant extent. On the other hand, employed taxpayers who hired external help needed more time to complete their compliance work in 2016. A significant effect on the overall compliance costs, however, can be found only for employed, self-preparing taxpayers. Additionally, for the group of self-employed taxpayers, no significant effect on compliance costs is found. Self-employed individuals who do not use external help need more time and have higher monetary expenses. Those who use external assistance, on the other hand, need less time but have significantly higher expenses. 20 In summary, we find a reduction in the compliance costs of German households from 2008 to 2016. This reduction is mainly attributable to employees without external tax advice, who needed significantly less time to process their tax return in 2016 than in 2008. The decreased time expenditure indicates a simplification of the German tax system; thus, the simplification measures mentioned in the introduction seem to have worked.
Comparison of the Compliance Costs — 2008 versus 2016.
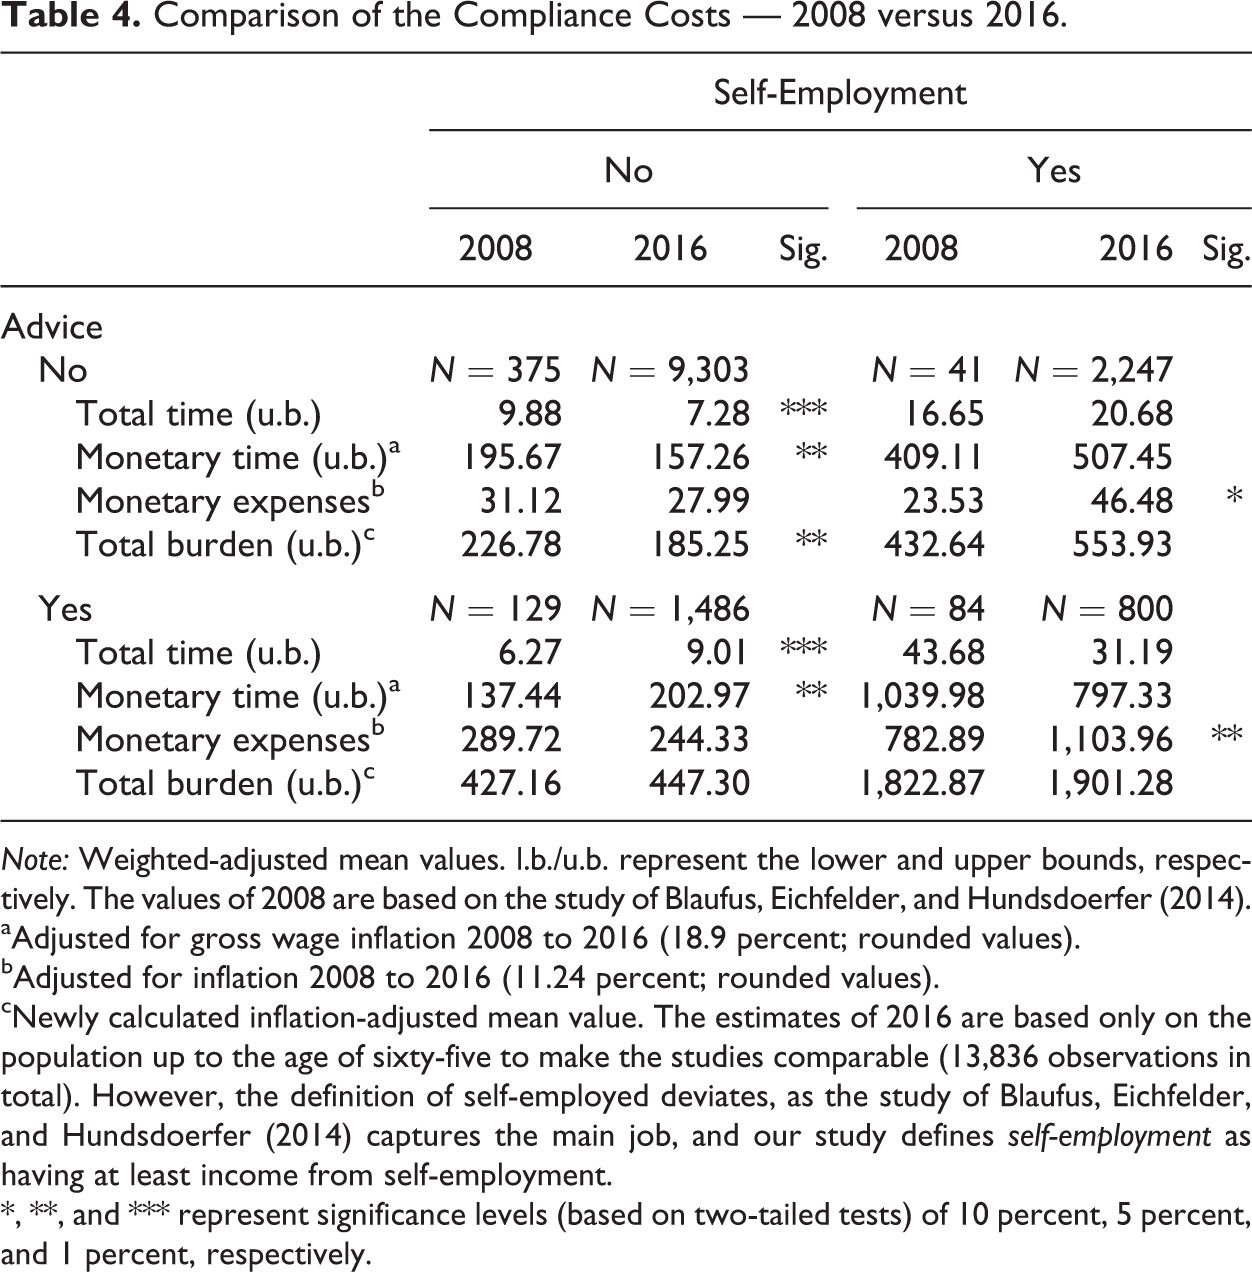
Note: Weighted-adjusted mean values. l.b./u.b. represent the lower and upper bounds, respectively. The values of 2008 are based on the study of Blaufus, Eichfelder, and Hundsdoerfer (2014).
aAdjusted for gross wage inflation 2008 to 2016 (18.9 percent; rounded values).
bAdjusted for inflation 2008 to 2016 (11.24 percent; rounded values).
cNewly calculated inflation-adjusted mean value. The estimates of 2016 are based only on the population up to the age of sixty-five to make the studies comparable (13,836 observations in total). However, the definition of self-employed deviates, as the study of Blaufus, Eichfelder, and Hundsdoerfer (2014) captures the main job, and our study defines self-employment as having at least income from self-employment.
*, **, and *** represent significance levels (based on two-tailed tests) of 10 percent, 5 percent, and 1 percent, respectively.
Table 2 presents the cost estimates separated by socioeconomic characteristics. It shows that, in particular, male, joint filing, wealthy, and well-educated respondents have higher compliance costs. Surprisingly, respondents who used a tax advisor clearly spend not only more money but also more time than do self-preparers. This finding matches those of Guyton et al. (2003) and is likely due to differences in the complexity of tax returns. Regarding the filing system, we find that software users have the highest compliance costs; the increase in monetary expenses is probably triggered by the price of the software.
Multivariate Analysis
The results of equation (1) using the lower bound values are summarized in tables 5 and 6. Because the results for the upper bound values are very similar, we do not report them. In line with previous research, we find a positive impact of income on the compliance burden (Blumenthal and Slemrod 1992; Vaillancourt, Roy-César, and Barros 2013; Blaufus, Eichfelder, and Hundsdoerfer 2014). The complexity of the tax return and the interest in tax planning (as the marginal tax rate grows) generally increases with income. High-income earners usually claim more deductions and have more bookkeeping obligations. Moreover, they value their time to be tax compliant higher, on average, than do low-income earners. A gender effect can be found only with respect to monetary expenses and the total burden; one possible explanation is that due to the gender differences in risk-taking (Croson and Gneezy 2009), male taxpayers are more aggressive in tax planning. Our results further indicate a positive effect of age. Younger taxpayers have lower compliance costs than do middle-aged persons. The difference between middle-aged and older taxpayers, however, is significant only for taxpayers older than sixty-five years of age. As anticipated, to prepare their tax returns, self-employed taxpayers need more time and have higher expenses than do employees (Slemrod and Sorum 1984; Vaillancourt 1989; Vaillancourt, Roy-César, and Barros 2013; Blumenthal and Slemrod 1992; Blaufus, Eichfelder, and Hundsdoerfer 2014). These results are explained by the cost reduction offered to employees by the German PAYE system and the increased complexity of self-employment income. Civil servants, on the other hand, have lower compliance costs than employees. Potential reasons for the difference between civil servants and employees include the following: (1) according to our data, civil servants are less likely to use external assistance than other employees, which explains the lower monetary expenses; (2) it could be that civil servants have a different relationship with the state and therefore use less tax planning, which might explain the lower time civil servants invest into clarifying tax issues; and (3) civil servants may have to fill in fewer tax forms, for example, because private pension provisions are presumably less widespread among civil servants. While the coefficient of Tax knowledge is negative, a university degree has a positive influence on the total compliance burden (Vaillancout 1989; Mathieu, Waddams Price, and Antwi 2010; Vaillancourt, Roy-César, and Barros 2013; Blaufus, Eichfelder, and Hundsdoerfer 2014). These results suggest that the educational level may capture the increased interest in and awareness of compliance work and tax planning opportunities of highly educated taxpayers (Blaufus, Eichfelder, and Hundsdoerfer 2014). Furthermore, we find that filing jointly affects only the time burden, not monetary expenses. The effect of marriage is also unclear in the literature (Blaufus, Eichfelder, and Hundsdoerfer 2014; Slemrod and Sorum 1984; Vaillancourt 1989; Vaillancourt, Roy-César, and Barros 2013; Blumenthal and Slemrod 1992). We tried to capture the complexity of tax returns by the number of income sources, which clearly had a positive effect on compliance costs (see also Mathieu, Waddams Price, and Antwi 2010). As already mentioned, this increase can be explained by the existence of different tax return forms for every income source. Moreover, tax appeals increase compliance costs since an appeal is associated with an increased time burden.
Regression Results: Lower-bound Estimates.

Note: The dependent variables are the natural logarithm of the time burden, monetized time burden, monetary expenses, and compliance costs. The monetary expenses are increased by one before taking the logarithm. A detailed description of all variables can be found in table 1. Robust standard errors are given in parentheses.
*, **, and *** represent significance levels (based on two-tailed tests) of 10 percent, 5 percent, and 1 percent, respectively.
Corresponding to previous research (e.g., Blaufus, Eichfelder, and Hundsdoerfer 2014; Guyton et al. 2003), we find that the demand for external help has a significant positive effect on monetary expenses and overall compliance costs. The regression analysis predicts that the total compliance burden, on average, increases by 296 percent if the taxpayer hires a tax advisor (lower bound estimates − ceteris paribus). In comparison, Blaufus, Eichfelder, and Hundsdoerfer (2014) predict an increase of 272 percent. The demand for external help could also act as a proxy for complexity. For example, Blaufus, Hechtner, and Möhlmann (2017) find that taxpayers who are eligible for complex deductions or tax credits profit the most from tax preparation services. However, hiring external help has no significant effect on the taxpayer’s overall time burden (Mathieu, Waddams Price, and Antwi 2010); it significantly decreases the time spent filling out the tax return but increases the time spent collecting receipts and clarifying tax issues (table 6). This result is probably due to the amount of time that taxpayers need to contact or visit the tax advisor. In unreported results, we consider that the choice to obtain tax assistance is endogenous and conduct endogenous treatment effect regressions (Greene 2008, 890). Because the results regarding the determinants are not affected by the endogeneity of tax advice, we do not report them here.
Regression Results: Time Categories.
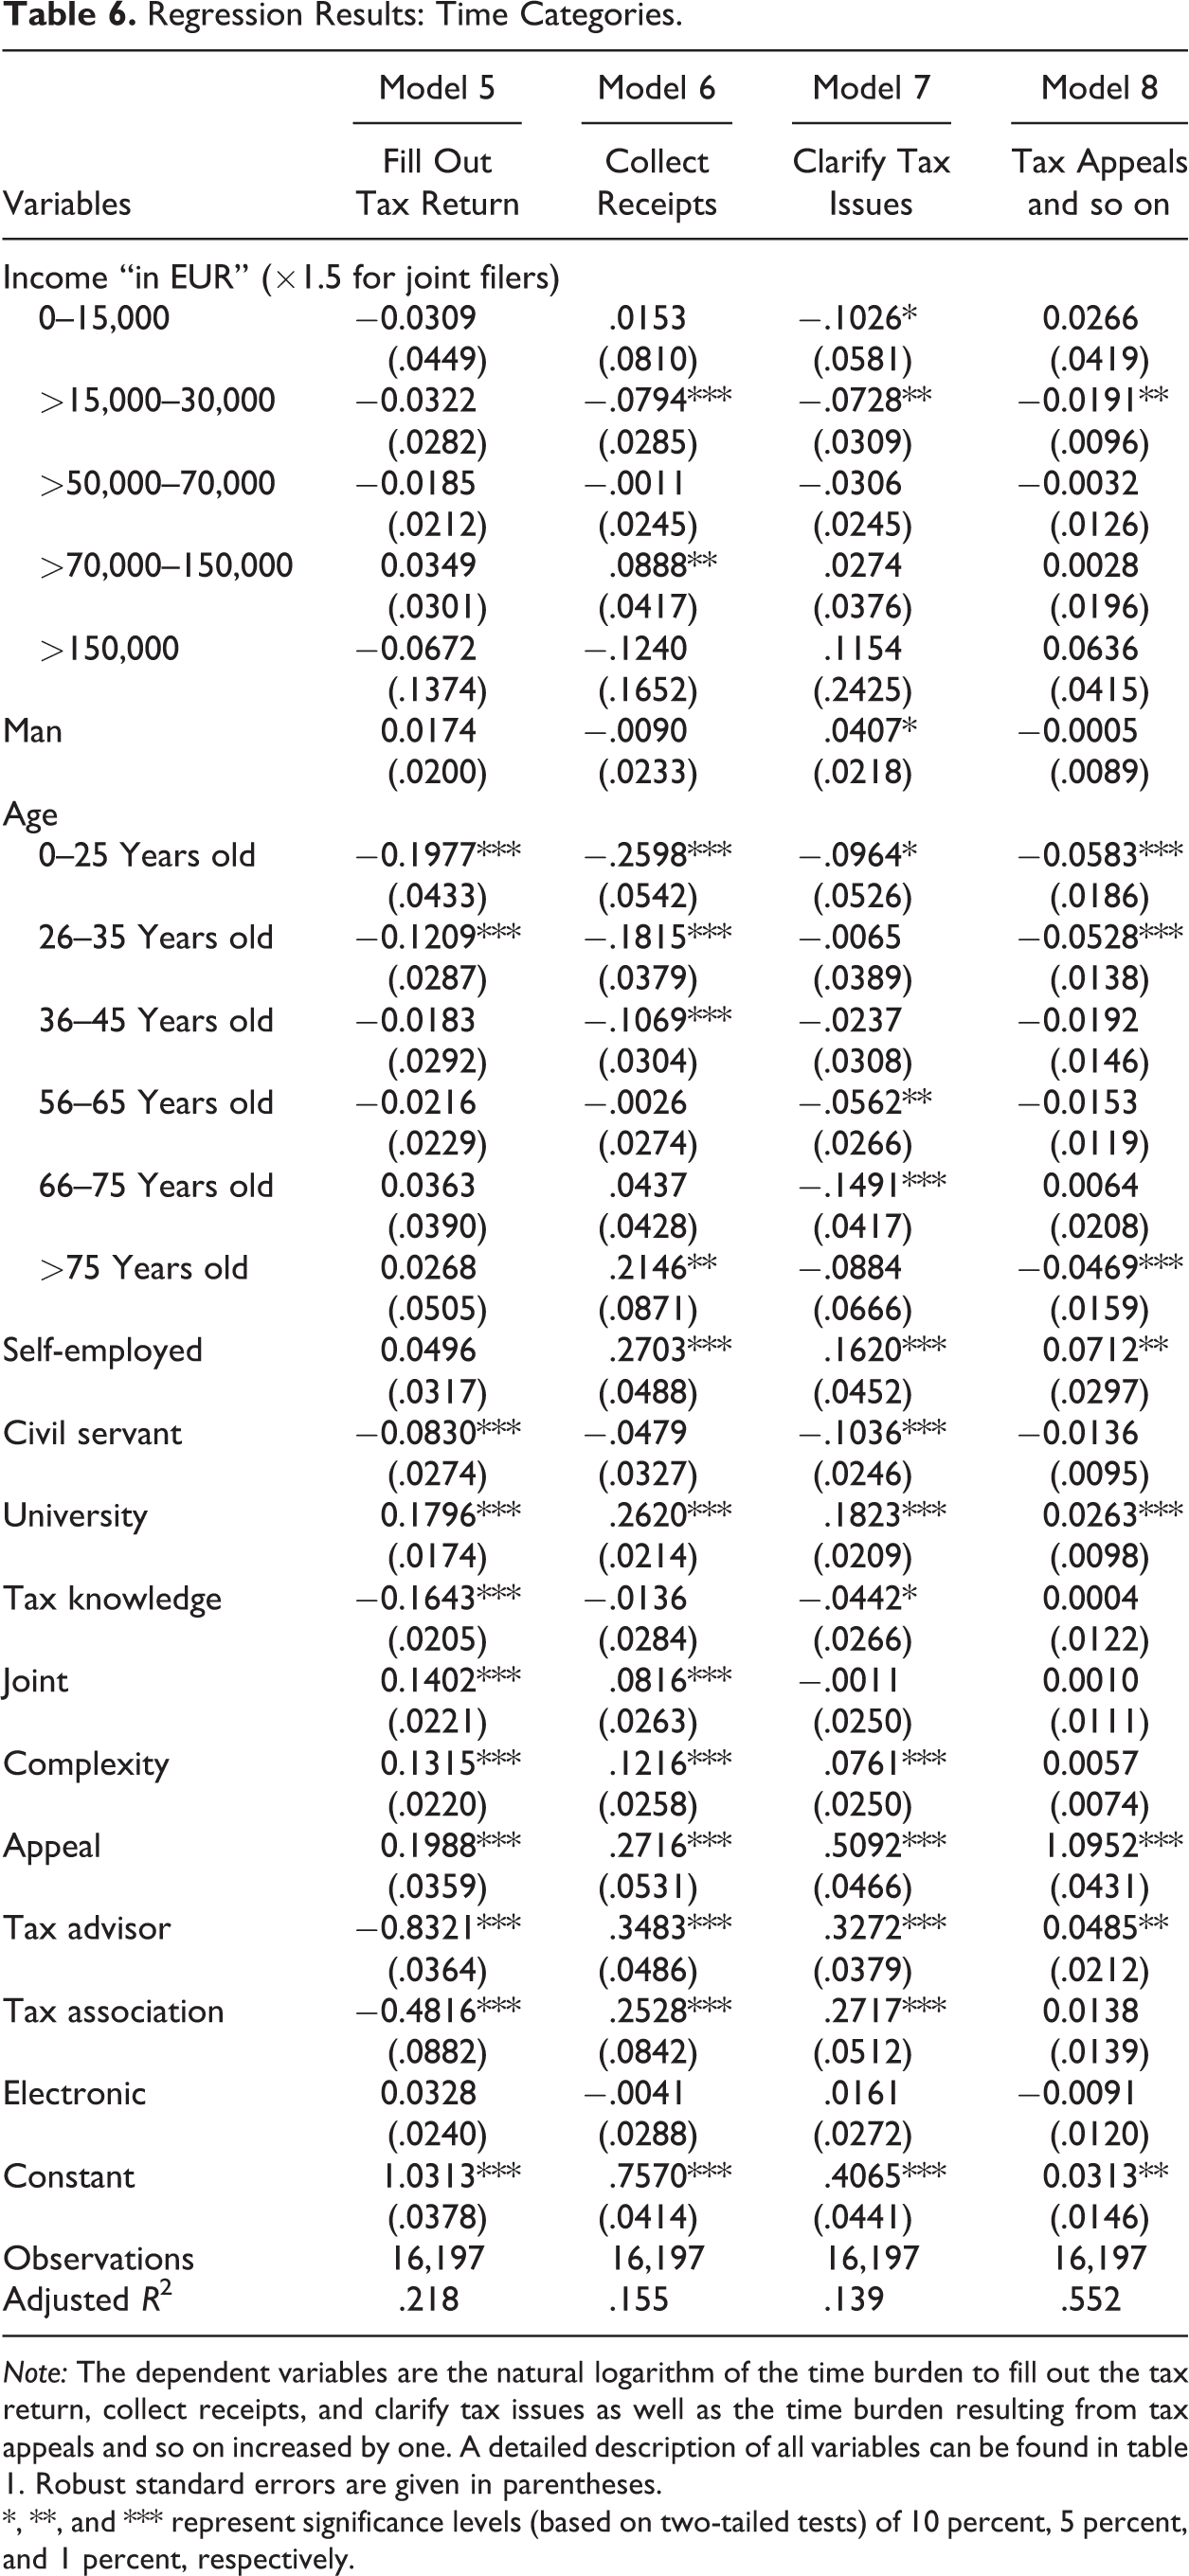
Note: The dependent variables are the natural logarithm of the time burden to fill out the tax return, collect receipts, and clarify tax issues as well as the time burden resulting from tax appeals and so on increased by one. A detailed description of all variables can be found in table 1. Robust standard errors are given in parentheses.
*, **, and *** represent significance levels (based on two-tailed tests) of 10 percent, 5 percent, and 1 percent, respectively.
Comparing standardized coefficients reveals that the most important determinants of total income tax compliance costs are (1) the use of tax advice, (2) the appeal procedure, (3) income, (4) return complexity (measured by the number of income sources of the taxpayer), and (5) education (measured by having a university degree).
Furthermore, this study seeks to investigate the influence of an electronic data exchange on the compliance burden of German households. For that purpose, we control for an electronic submission. Eichfelder and Schorn (2012) and Eichfelder and Hechtner (2018) do not find significant effects of an electronic data interchange on the compliance burden of businesses. In our full sample, however, we find nonsignificant effects on the time effort but significant positive effects on monetary expenses and the total compliance burden. The increase in monetary expenses can be explained by the acquisition costs of the software program. To analyze this effect in more detail, we conduct a subsample analysis of self-preparers. In this case, we are able to differentiate between an electronic submission via ELSTER or via other tax software. In unreported results, we find that taxpayers who submit their tax return via ELSTER have significantly lower monetary expenses than taxpayers who use the traditional paper forms; however, the effects of ELSTER on the time burden are ambiguous. The effect on the overall compliance costs is not significant. Analyzing the software versus paper users, we find strong evidence that submitting via software significantly increases the time effort, monetary expenses, and, therefore, the total compliance burden. 21 Because a tax software also provides instructions and notes, it is possible that the increased time effort is caused by greater tax planning abilities and accuracy (Guyton et al. 2005). In addition, submitting via software significantly increases the time burden for collecting receipts. This result indicates that observations involving the use of a tax software could also be more complex tax cases. Overall, we do not find any evidence of a compliance cost-decreasing effect of e-filing compared to traditional paper-based filing. Notably, however, the instrument of prefilled electronic tax returns, which has been shown to effectively reduce compliance costs in other countries (Goolsbee 2006; Klun 2009), was not introduced in Germany until 2014, and according to information from the Ministry of Finance in North Rhine-Westphalia, the use of the instrument in 2016 was still very low (<5 percent of all tax returns).
Aggregate Compliance Costs of the German Income Tax
To estimate the aggregate compliance costs of the German income tax, we follow the microsimulation approach of Blaufus, Eichfelder, and Hundsdoerfer (2014) using the 2010 German Income Tax Statistics (GITS). The 10-percent sample of the GITS is a database with information on the tax returns of approximately 3.9 million taxpayers in Germany, and thus, it is representative of the German taxpayer population (39 million taxpayers). Furthermore, it represents the latest available data. In the first step, we calculate the weight-adjusted average compliance costs for different groups of taxpayers in our survey. Using 2010 GITS information, we are able to compute estimates for the relative burden for the groups by dividing the average compliance costs by the average taxable income calculated from the GITS (table 7). Therefore, we consider the time difference in the data sets by increasing the income by an index of gross wages. In the second step, we use the relative burden and price-adjusted 2010 GITS information to calculate the compliance costs per tax return. Observations in which, due to the German PAYE system, no tax return was filed are assigned compliance costs of €0 (32.02 percent). Regarding observations with a taxable income in the amount of zero, we apply the weight-adjusted average compliance costs of the lowest income class.
Relative Compliance Burden.
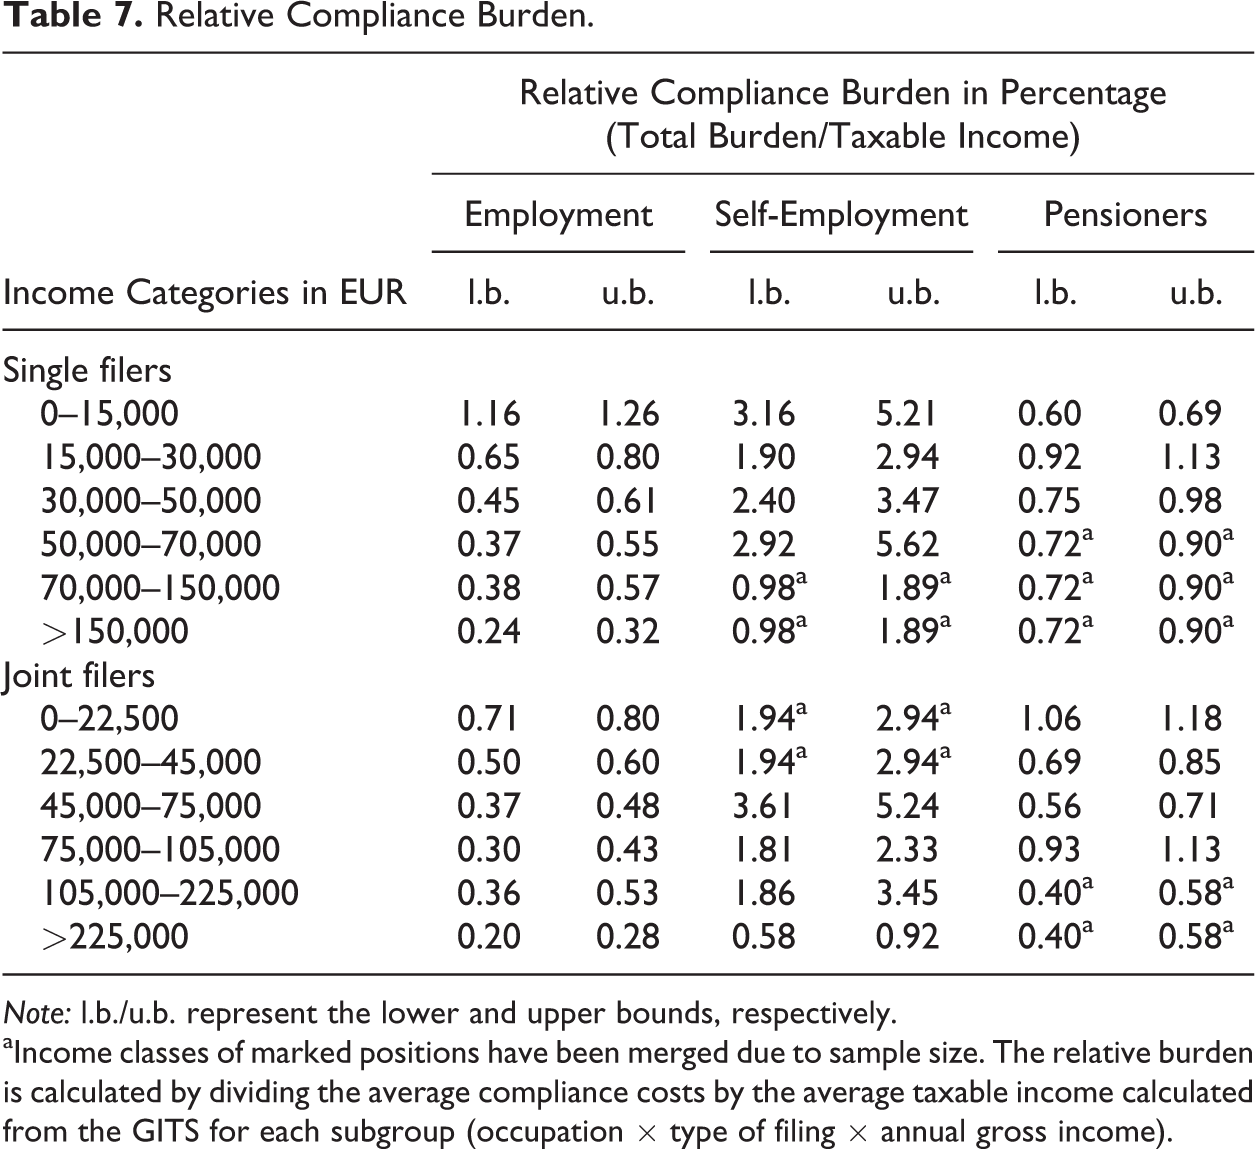
Note: l.b./u.b. represent the lower and upper bounds, respectively.
aIncome classes of marked positions have been merged due to sample size. The relative burden is calculated by dividing the average compliance costs by the average taxable income calculated from the GITS for each subgroup (occupation × type of filing × annual gross income).
The relative burden is calculated for every income class that was covered by the survey. To reduce the influence of outliers, every subgroup has to have a minimum number of twenty-five observations. Because the compliance costs of the self-employed differ significantly from the burden of other taxpayers, we calculate the relative burden separated by taxpayers who have income only from self-employment (apart from additional income) and those who earn income only from employment. Unlike Blaufus, Eichfelder, and Hundsdoerfer (2014), we further distinguish pensioners. Due to a German pension reform in 2005, many more pensioners are now obligated to file a tax return, which is why they play a more important role now than in 2008. In addition, we separate single and joint filers. To assign a relative burden to every taxpayer in the GITS, we decide to allocate the relative burden of the self-employed (pensioners) only to taxpayers who exclusively earn income from self-employment (pension). In line with Blaufus, Eichfelder, and Hundsdoerfer (2014), taxpayers with several types of income were assigned the burden of employees. The same applies for taxpayers with only additional income. Observations with negative income are assumed to have the same burden as taxpayers with the same amount of positive income in the corresponding subgroup. In this manner, the burden of tax loss relief can be considered. Furthermore, this assumption matches the findings of Eichfelder et al. (2012), who show that the demand for tax advice increases in negative income. As indicated in table 7, the relative cost burden is higher for low-income earners. This finding demonstrates the fixed costs effect in tax compliance and is in line with previous research (Tran-Nam et al. 2000; Blažić 2004; Tran-Nam, Evans, and Lignier 2014). Moreover, the relative cost burden is higher for self-employed taxpayers. While single employees with a gross income between €15,000 and €30,000 spends only 0.65 percent to 0.80 percent of their taxable income on compliance work, the share extends to 1.90 percent to 2.94 percent for self-employed taxpayers. A pensioner, on the other hand, spends 0.92 percent to 1.13 percent of his or her income.
The applied microsimulation approach yields a compliance burden of German households of approximately €5.47 billion (lower bound estimate) to €7.87 billion (upper bound estimate), which amounts to 2.03 percent to 2.92 percent of the German income tax revenues of tax year 2015 (including the solidarity surcharge). In comparison, Blaufus, Eichfelder, and Hundsdoerfer (2014) list aggregate compliance costs of €6.0 billion (lower bound estimate) to €9.0 billion (upper bound estimate), which corresponds to 3.1 percent to 4.7 percent of German income tax revenues in 2007.
Consequently, the analysis provides evidence that compliance costs in Germany decreased over the last decade, even though the number of tax returns increased. The increase in tax returns can partially be explained by the increased number of pensioners who have to file a tax return after 2005 due to the pension reform. To quantify the effect of the pension reform, we determine the increased number of tax returns filed by pensioners. According to information from the Federal Ministry (German Bundestag 2015), approximately four million taxpayers received taxable pension payments in 2015. Using the 2004 GITS data set, we estimate that the number of pensioners who filed a tax return was approximately 1 million in the prereform year 2004. Thus, the reform caused a 3 million increase in the number of filing pensioners. A pensioner has average compliance costs of €149.65 (lower bound) to €186.65 (upper bound). Thus, due to the pension reform, the aggregate compliance burden of the German tax system in 2015 increased by approximately €449 million (lower bound) to €560 million (upper bound) compared to the prereform costs in 2004.
Conclusion
Based on a survey of approximately 18,000 taxpayers, this study provides a current estimate of the income tax compliance cost burden of German households and its determinants. Taxpayers need, on average, between 9.13 and 10.23 hours and spend €106 to prepare their income tax return. The average total burden amounts to €228 (lower bound estimate) and €321 (upper bound estimate), and the aggregate cost burden ranges between 2.03 percent and 2.92 percent of the German income tax revenues of tax year 2015. Compared to tax year 2007, our findings reveal a significant cost reduction, especially for self-preparers without self-employment income. Although the costs decreased significantly over the last few years, international comparisons illustrate that the German burden is still located in the upper middle. The five most important cost determinants that increase individual compliance costs are (1) the use of tax advice, (2) the appeal procedure, (3) income, (4) return complexity, and (5) education. In contrast, we cannot confirm that e-filing reduces taxpayers’ compliance costs.
Regarding tax policy, our results suggest that the attempts to simplify individual income taxation have been partly successful. Interestingly, however, the taxpayers who have benefited are mainly those who are able to prepare their tax return on their own, that is, taxpayers with better tax knowledge, with better education, and without self-employed income. Therefore, future tax policy might also focus on reducing the compliance burden of other groups, particularly self-employed taxpayers. Our result is in contrast to a recent study in Australia for the tax year 2011/2012. Despite several simplification initiatives of the Australian government, Tran-Nam, Evans, and Lignier (2014) find that personal taxpayer compliance costs in Australia have increased by approximately 73 percent since 1995. However, this growth is mainly driven by an increase in tax preparer costs, while individuals’ own time spent on tax preparation has decreased. Both the decrease in time and the increase in external monetary costs are consistent with our German findings. But, in contrast to Australia, approximately only 15 percent of the German taxpayer population uses paid tax advice (compared to approximately 70 percent in Australia), which explains the different findings regarding the development of total tax compliance costs in Australia and Germany.
Moreover, our results reveal that the past reforms of pension taxation have significantly affected compliance costs. Due to the introduction of deferred pension taxation in Germany, the number of retirees who are obliged to file a tax return increased significantly. This increase shows that the international discussion about the tax treatment of pension income (Organization for Economic Cooperation and Development 2018) should also consider the effects on the compliance cost burden.
Nonetheless, when interpreting our results, one should consider certain limitations. First, our study relies on the ability of respondents to appropriately estimate the tax compliance costs of their last tax return. We know from previous research that these self-estimations could be biased (Eichfelder and Hechtner 2018). Second, this study does not cover the compliance costs of employers to comply with the German income tax. Third, although we present the largest data set on individual compliance costs in Germany that has been investigated to date, the sample was not representative of the whole population; thus, we must rely on the use of weighting factors. Fourth, comparing our results with international evidence, one must bear in mind that the differences in sampling methodologies, the methods for valuing the time effort, the definition and coverage of compliance costs, and the influence of the tax rate on the burden per tax revenue limit the comparability of international studies (Eichfelder and Vaillancourt 2014). Fifth, the data set of Blaufus, Eichfelder, and Hundsdoerfer (2014) is small, especially for the subsamples, and thus restricts the feasibility of the temporal comparison. In this context, another limitation is that the survey in our study was conducted for the first time. As a result, panel data are not yet available. Panel data would have made it possible to make a more sophisticated intertemporal comparison, for example, regarding the effect of e-filing.
Footnotes
Appendix A
Appendix B
Appendix C
Correlation Matrix.
| (1) | (2) | (3) | (4) | (5) | (6) | (7) | (8) | (9) | (10) | (11) | (12) | (13) | (14) | (15) | (16) | (17) | (18) | (19) | (20) | (21) | (22) | (23) | (24) | ||
|---|---|---|---|---|---|---|---|---|---|---|---|---|---|---|---|---|---|---|---|---|---|---|---|---|---|
| (1) | €0–15,000 | −.21 | −.21 | −.12 | −.08 | −.02 | −.05 | .16 | −.05 | −.09 | −.09 | −.04 | .10 | .07 | .04 | −.04 | −.08 | − |
−.10 | −.06 | −.03 | − |
.02 | −.08 | |
| (2) | €15,000–30,000 | −.53 | −.29 | −.21 | −.06 | −.07 | .08 | −.08 | −.10 | −.17 | −.02 | .22 | .12 | −.09 |
|
−.21 | −.06 | −.04 | −.05 | −.04 | − |
− |
−.06 | ||
| (3) | €30,000–50,000 | −.30 | −.22 | −.06 | .02 | −.05 | .12 | .04 | .03 |
|
−.11 | −.07 | −.04 | .05 | .02 | −.02 | − |
− |
−.02 | −.02 | .02 | .02 | |||
| (4) | €50,000–70,000 | −.12 | −.04 | .06 | −.10 |
|
.10 | .14 | .04 | −.15 | −.08 | .05 |
|
.16 | .03 | .09 | .05 | .04 |
|
−.02 | .06 | ||||
| (5) | €70,000–150,000 | −.03 | .06 | −.07 | − |
.05 | .15 |
|
−.11 | −.07 | .08 | −.04 | .18 | .08 | .06 | .08 | .08 | .06 |
|
.07 | |||||
| (6) | >€150,000 |
|
−.03 |
|
.04 | .02 |
|
−.04 | − |
.12 | −.03 | .07 | .06 | .02 | .08 | .02 | .04 | −.02 |
|
||||||
| (7) | Man |
|
.04 |
|
|
|
−.05 | −.02 | .05 | .06 | .07 | .04 | .22 | .07 |
|
.02 | − |
.13 | |||||||
| (8) | ≤25 Years | −.13 | −.12 | −.14 | −.13 | −.14 | −.08 | −.06 | .11 | .02 | .13 | −.28 | −.11 | − |
−.04 | −.03 | .02 | ||||||||
| (9) | 26–35 Years | −.18 | −.22 | −.20 | −.21 | −.12 | −.02 | −.11 | .12 | .02 | −.17 | −.13 | .03 | −.02 | .02 | .08 | |||||||||
| (10) | 36–45 Years | −.20 | −.19 | −.20 | −.11 | .06 | −.04 | .06 | − |
.04 | −.03 | .03 | .03 | −.02 | .09 | ||||||||||
| (11) | 46–55 Years | −.22 | −.23 | −.13 | .07 | −.07 | − |
−.04 | .09 | −.02 | .02 | .03 |
|
.03 | |||||||||||
| (12) | 56–65 Years | −.21 | −.12 |
|
.02 | −.03 |
|
.15 | .03 | −.02 |
|
− |
− |
||||||||||||
| (13) | 66–75 Years | −.13 | −.04 | .08 | −.11 | −.04 | .09 | .16 | −.03 | −.03 |
|
−.12 | |||||||||||||
| (14) | >75 Years | −.06 | .05 | −.06 | −.06 | −.02 | .09 | −.02 | .02 | .03 | −.11 | ||||||||||||||
| (15) | Self-employed | −.06 | .09 | .12 | .08 | .48 | .07 | .16 | −.05 | .15 | |||||||||||||||
| (16) | Civil servant | .18 | .12 | .10 | .34 | .04 | −.08 |
|
|
||||||||||||||||
| (17) | University | .12 |
|
.12 | .08 | − |
−.04 | .09 | |||||||||||||||||
| (18) | Tax knowledge | .02 | .15 | .10 | −.11 | −.09 | .09 | ||||||||||||||||||
| (19) | Joint | .22 |
|
|
|
.05 | |||||||||||||||||||
| (20) | Complexity | .08 | .06 | −.03 | .07 | ||||||||||||||||||||
| (21) | Appeal | .06 | −.02 | .03 | |||||||||||||||||||||
| (22) | Tax advisor | −.07 | .23 | ||||||||||||||||||||||
| (23) | Tax association | .11 | |||||||||||||||||||||||
| (24) | Electronic |
Note: All correlations are statistically significant at the 5 percent level except for the ones marked in bold.
Acknowledgment
We thank three anonymous reviewers, Alexander N. Schwäbe, and the Ministry of Finance of North Rhine-Westphalia.
Declaration of Conflicting Interests
The author(s) declared no potential conflicts of interest with respect to the research, authorship, and/or publication of this article.
Funding
The author(s) received no financial support for the research, authorship, and/or publication of this article.