
Abstract
We analyze the Italian personal income tax (PIT) in the light of the different tools available to the government to achieve income redistribution. We focus in particular on three mechanisms: marginal tax rates, deductions, and tax credits. Exploiting an extended version of the standard Pfähler decomposition, we estimate the contribution of each of these three tools to the overall redistributive effect of the PIT using administrative data on more than 1.3 million individual tax returns. Our estimates suggest that more than half of the total PIT redistributive effect is due to the two most important tax credits (the tax credit for employment and the tax credit for retirement income), while the marginal rates schedule contribution is about 40 percent. On the contrary, most of the itemized expenditures do not show any sizable impact on redistribution.
In most of the countries around the world, the personal income tax (hereafter PIT) is a comprehensive tax on individual incomes that is thought of as a fundamental tool to redistribute resources, thanks to its progressive nature. This role of PIT is confirmed by the literature analyzing the political economy of redistribution, which shows, however, a great variation around the globe in terms of both the importance of PIT revenues and the redistribution achieved, together with the key role played by political institutions in influencing the performance (e.g., Verbist and Figari 2014; Keefer and Milanovic 2014; Ardañaz and Scartascini 2013; Padovano and Turati 2012). Italy is an interesting case study in this respect: it is a country where total public revenues (and spending) represent a large share of gross domestic product (GDP), more than 40 percent in latest years; the efficiency impact of this high level of taxes is pretty much clear from the worrying economic prospect in terms of potential growth and productivity, but the degree of redistribution achieved by the overall tax-benefit system is among the lowest in the context of Western countries (e.g., Lefranc, Pistolesi, and Trannoy 2008). When better exploring the role of PIT in this context, results are somewhat mixed. By focusing only on PIT around the 1990 fiscal year, Wagstaff et al. (1999) show that also the redistributive effect of the Italian PIT is among the lowest in a group of Organization for Economic Cooperation and Development (OECD) countries. This result is further confirmed by more recent empirical analyses considering European Union countries, which also reinforce the substantial role played by the PIT in achieving the overall redistributive effect within each country (e.g., Verbist and Figari 2014). On the contrary, Joumard, Pisu, and Bloch (2013), relying on a synthetic indicator of tax progressivity, suggest that the Italian PIT is quite close to the OECD average in terms of redistributive performance, while cash transfers, mostly represented by old-age pensions related to previous earnings, show very little progressivity. Hence, the poor performance of the Italian tax-benefit system should be identified on the spending side more than on the tax side.
But besides the level of redistribution, how does PIT redistribute resources? What are the most effective tools within the PIT, those that contribute most to achieve redistribution? In order to answer these questions, in this article, we analyze the Italian PIT in the light of the different tools that are available to the government in order to influence the degree of progressivity of the tax as well as its redistributive role: (1) deductions, (2) marginal tax rates, and (3) tax credits. In particular, we compute the Reynolds–Smolensky (RS) index and decompose it according to an extended version of the Pfähler (1990) methodology, considering a sample of more than 1.3 million individual real tax return forms. Our estimates suggest that more than half of the total redistributive effect of the PIT is due to just two tax credits (the one for employment and the one for retirement income), while 40 percent is due to the marginal rate schedule. On the contrary, most of the itemized expenditures do not show any sizable impact. These general conclusions are robust to a number of additional exercises, including the decomposition of the RS index according to the recent methodology proposed by Onrubia, Picos-Sánchez, and del Carmen Rodado (2014). In a policy perspective, consistently with conclusions reached for other countries (e.g., Poterba 2011), our findings call for an agenda that methodically revises all categories of tax credits in order to simplify the structure of the PIT, broaden the tax base, and obtain resources to lower marginal tax rates or to increase the tax credits, showing the highest contribution to the overall redistributive effect; in this respect, a particularly important area would be to reform tax credits for dependent individuals within the household.
This article is structured as follows. The second section provides essential background information on the Italian PIT, while the third section is devoted to our empirical analysis: we first present the Pfähler decomposition; we then describe our data set and the main results. The fourth section briefly concludes the article.
The PIT in Italy
Like in many other countries, the Italian PIT (Imposta sui Redditi delle Persone Fisiche) is a progressive tax on individual incomes introduced in the Italian legislation in 1974 and discretionally modified almost every year in most of the relevant parameters (like the marginal rate schedule, the tax allowances, or the tax credits). It provides about one-fourth of the total public revenues in the latest years, approximately €158 billion in 2013 (excluding regional and municipal surtaxes), which represents one-tenth of the Italian GDP. As also recalled by a recent report on tax erosion in the Italian PIT (see Ministry of Economy and Finance [MEF] 2011), the original aim was to define a comprehensive income tax à la Schanz–Haig–Simons, adding up all possible income categories. These still include labor and pension incomes, entrepreneurial incomes, figurative property incomes, incomes from financial capital, plus a residual category trying to capture most of the capital gains, and all other income sources that cannot be summarized in one of the previous groups. In practice, however, fiscal rules are such that most of the incomes from financial capital are typically not included in the tax base (and taxed separately with a substitute tax), which by itself is eroding the tax base (see, again, MEF 2011). As a consequence, labor and pension incomes represent the lion’s share of the tax base, more than 80 percent of the whole taxable income. More precisely, in recent years, active workers’ incomes are about half of the whole taxable income, while pensions (de facto, a deferred labor income) amount to one-third of the total.
Leaving aside the issue of income categories typically excluded from the PIT base (like, as already remarked, capital incomes, which are taxed at a lower proportional rate via a substitute tax), the PIT degree of progressivity is influenced by (1) tax allowances (i.e., deductions from the tax base), (2) increasing marginal tax rates, and (3) tax credits (i.e., reductions in tax liability). Both the first and the third category represent tax expenditures, that is, foregone government revenues as a result of preferential treatment of certain taxpayers, which are extensively used in the Italian tax system (e.g., Tyson 2014). According to available estimates (e.g., OECD 2010), foregone revenues because of tax expenditures related to the PIT amount to about 4.7 percent of GDP (40.4 percent of PIT revenues) in Italy, compared to other European countries like Spain (2.6 percent of GDP), Germany (0.55 percent), and France (0.81 percent); figures that make Italy more similar to the United States (where PIT tax expenditures are estimated at a 4.8 percent of GDP) and the United Kingdom (5.4 percent) in contrast with the different orientation in terms of the benefit system, since public spending is much higher in Italy than in both the United States and the United Kingdom. This extensive role played by tax expenditures makes it crucial to understand their redistributive role for designing a better tax system.
Since our data refer to the year 2011, we describe here the main institutional characteristics of the 2011 PIT concerning deductions, marginal tax rates, and tax credits, leaving the details to the Online Technical Appendix A. First, the Italian tax law considers two different kinds of allowances: a deduction for the cadastral income of the main residence (on housing taxation in Italy, see, e.g., Pellegrino, Piacenza, and Turati 2012) and a deduction for items like compulsory social security contributions to welfare and pension schemes for self-employed individuals, alimonies, and donations. Second, marginal tax rates range from 23 percent to 43 percent; they were varied last in 2007 and have remained unchanged since then (see Table A1 in the Online Technical Appendix A). Third, the Italian law admits—similarly to other countries— three distinct kinds of effective tax credits: (1) a sort of “Making Work Pay” tax credit, that is, credits for wage income from employment, pensions, self-employment, and similar incomes. According to available estimates, this is by far the largest tax expenditure in the Italian PIT, amounting to more than €37 billion in 2010 (about 2.41 percent of GDP; e.g., MEF 2011; Tyson 2014). Leaving aside pensions, a sort of deferred labor income, these credits aim at realizing a qualitative discrimination of income sources. They are thought to promote labor force participation, making work more attractive, and to support low-income earners at risk of social exclusion even if employed (e.g., European Commission 2014). (2) Tax credits for dependent relatives, amounting to €10 billion (about 0.67 percent of GDP; e.g., MEF 2011; Tyson 2014), with the aim of lowering the average tax rate for taxpayers with dependent family members with respect to those without, and of achieving horizontal redistribution. (3) Tax credits for specific expenditure items, which include very different types of spending and have different purposes: for example, tax credits for medical expenses and childcare centers’ fees show a clear orientation toward welfare goals, while tax credits for home restructuring aim at sustaining the construction sector by supporting private demand (MEF 2011). These expenditure items can be classified in three large categories according to the percentage (19 percent, 36 percent, and 55 percent) of the expense the tax law admits as a reduction of liability. There are nineteen different items (such as expenses for health care and mortgage interests but also for veterinary expenses), allowing the 19 percent tax credits. The 36 percent tax credits are allowed for home restructuring, while the 55 percent tax credits are allowed for a number of different interventions for energy saving. Altogether, the tax law for 2011 admits thirty different tax credits for expenditure items, which makes administratively quite complicated the PIT structure.
Assessing the PIT Redistributive Effect
The Extended Pfähler Methodology
As the PIT makes use of (1) deductions, (2) increasing marginal tax rates, and (3) tax credits to define its degree of progressivity, in a policy perspective, it is important to understand which of these three different tools contributes more to define the PIT redistributive effect. To this end, we use the methodology first developed by Pfähler (1990), extended by Lambert (2001), and later completed and summarized by Urban (2006). Here we further expand the original methodology in order to consider the impact of each of the several allowances and tax credits characterizing the Italian tax code. In particular, the overall RS index is “decomposed” in the contributions due to (1) deductions, (2) the rate schedule, and (3) each tax credit. The Online Technical Appendix B provides the relevant details. Notice that, in order for the Pfähler decomposition to work, taxpayer’s total deductions cannot be greater than his or her gross income, or, similarly, taxpayer’s total tax credits cannot be greater that his or her gross tax liability. These considerations impose a choice in the empirical implementation of the decomposition about the order with which to apply deductions or tax credits for the taxpayers with null net tax liability. In what follows, we decided to apply the following order:
The Data
We run the Pfähler decomposition analysis using data provided by the Centri di Assistenza Fiscale (CAF, literally, Tax Assistance Centers) of the Associazione Cristiana Lavoratori Italiani (ACLI, literally, Italian Association of Christian Workers). The CAF-ACLI assists more than 1 million taxpayers and collects all information required in filling in their tax return. This allows us to access very detailed data on all different types of incomes, as well as allowances and credits, which are largely unavailable to researchers running microsimulation models on survey data. In particular, we have full information for the 2011 fiscal year on 1,370,982 individual tax returns Modello 730. This is a simplified income tax return, which can be filed only if the taxpayer has a withholding agent in Italy in the period of the filing of the tax return and does not have business incomes. There are two main advantages in using this tax return: first, no calculation is required by the taxpayer, since calculations are made by the tax assistance center; second, the balance resulting from the tax return is directly withheld or refunded to the employee in his or her pay slip for the month of July. 2 This is the reason why a withholding agent in Italy is required and why employees and pensioners with large amounts in allowances and tax credits are particularly keen at using this way to declare their incomes. All data have been anonymized to ensure individual privacy according to the Data Protection Law. Given the characteristics of the Italian PIT described above, and to consider a more homogeneous sample, we decided to exclude from the analysis the few taxpayers (56,105 taxpayers) who are not employees or pensioners but have received their incomes from various sources, mainly property incomes, and have very low incomes (most of them get less than €1,000); this choice does not alter our main conclusions below. Our final sample includes 1,314,877 individuals.
However, the advantage of accessing very detailed information comes at a cost, which is evident by looking at figure 1, where we plot the distribution of gross incomes in our data set and the corresponding distribution on the same fiscal year made available by the Department of Finance of the MEF (2013). Despite being very large (including about 3.2 percent of all Italian tax returns), our data set clearly overestimates employees and taxpayers belonging to the middle class and underestimates the poorest taxpayers with respect to the whole distribution. These features are clear also when considering more formally the most important redistributive indices in table 1, where column 2 refers to our data and column 3 computes the corresponding figures for the whole Italian PIT by means of a microsimulation model using survey data provided by the Bank of Italy (Morini and Pellegrino 2014). For instance, the Gini coefficient of the gross income distribution for our data is .3191, while that of the net income distribution is .2705 using the CAF data. Both figures are unsurprisingly lower than those obtained from the microsimulation model: Gini coefficient of the gross income distribution is .4434, while that of the net income distribution is .3914. Clearly, the less dispersed income distribution of our sample will reduce the room for the redistributive role of PIT. However, this is not really an issue for our analysis, since we are more interested—considering the Pfähler decomposition—in understanding the relative role of tax credits, allowances, and marginal tax rates, and not in the absolute magnitude of the degree of redistribution.
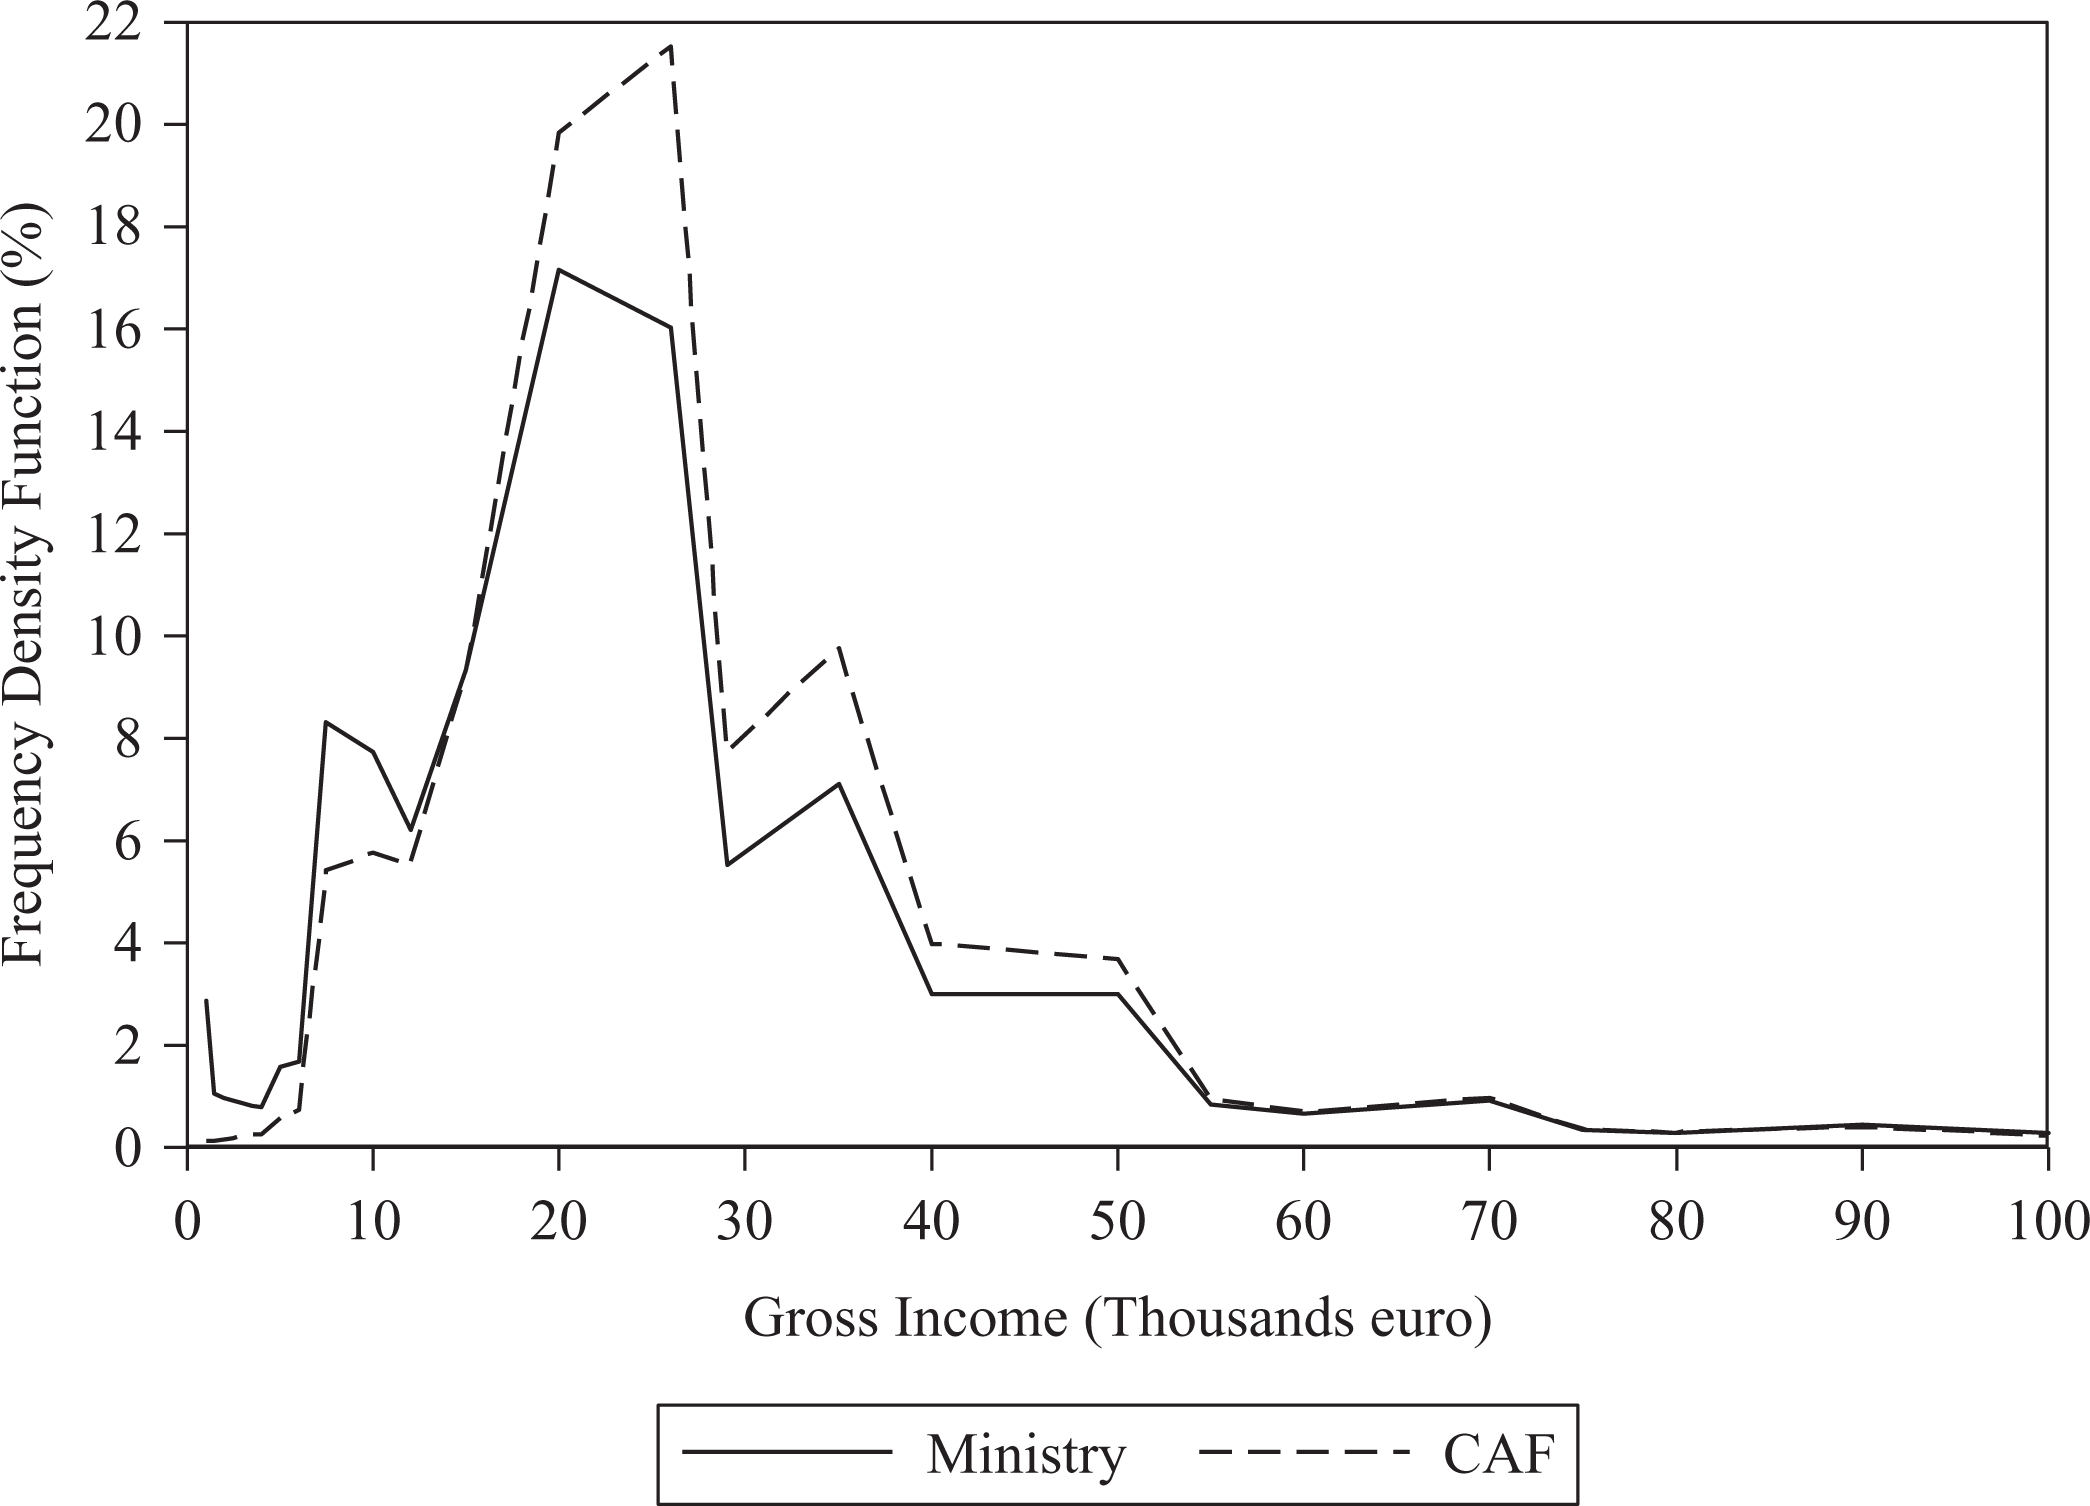
The distributions of gross incomes.
Redistributive Indexes.

Source: Own elaborations based on CAF (2012) and Bank of Italy (2012).
Note: CAF = Centri di Assistenza Fiscale; RS = Reynolds–Smolensky.
A second drawback in using administrative data is represented by the difficulties in identifying households starting from anonymized individual tax returns. Unfortunately, in Italy as elsewhere, single taxpayers have to assess individually their incomes, their allowances, and the credits they are entitled to. It is then impossible, in the absence of additional information, to couple, for instance, two married individuals forming a household, when they both work and file individual tax returns. It is also impossible to know whether these two individuals have nondependent children in their household. We will discuss both of these limits of our data below.
Results
Before moving to the extended Pfähler decomposition, let us first concentrate on the distribution across taxpayers of all allowances and tax credits, information that is usually unavailable when using survey data. 3 Notice that also the assessment recently provided by the Ministry of Finance (see MEF 2011) of all tax expenditures available in the Italian tax code does not one include this information. For each allowance or credit, the report concentrates on the total foregone revenues, as well as on the number of taxpayers involved, distinguishing also individuals by geographical areas and income brackets, but does not consider explicitly the shape of the distribution, which is what we add here. For each specific item, our analysis in table 2 shows the Gini coefficient, the concentration coefficient, the share of taxpayers with positive deductions and tax credits, and their average values. For instance, let us consider the tax credit for mortgage interests on the main residence. This item is positive only for 14.4 percent of taxpayers, which explains why the Gini coefficient is very high (.91); on the contrary, since the share of these taxpayers is decreasing with income, the corresponding concentration coefficient is expected to be lower (.28). Figure 2 provides a visual representation of the Gini and the concentration curves for this item.
Indexes for Deductions and Tax Credits.
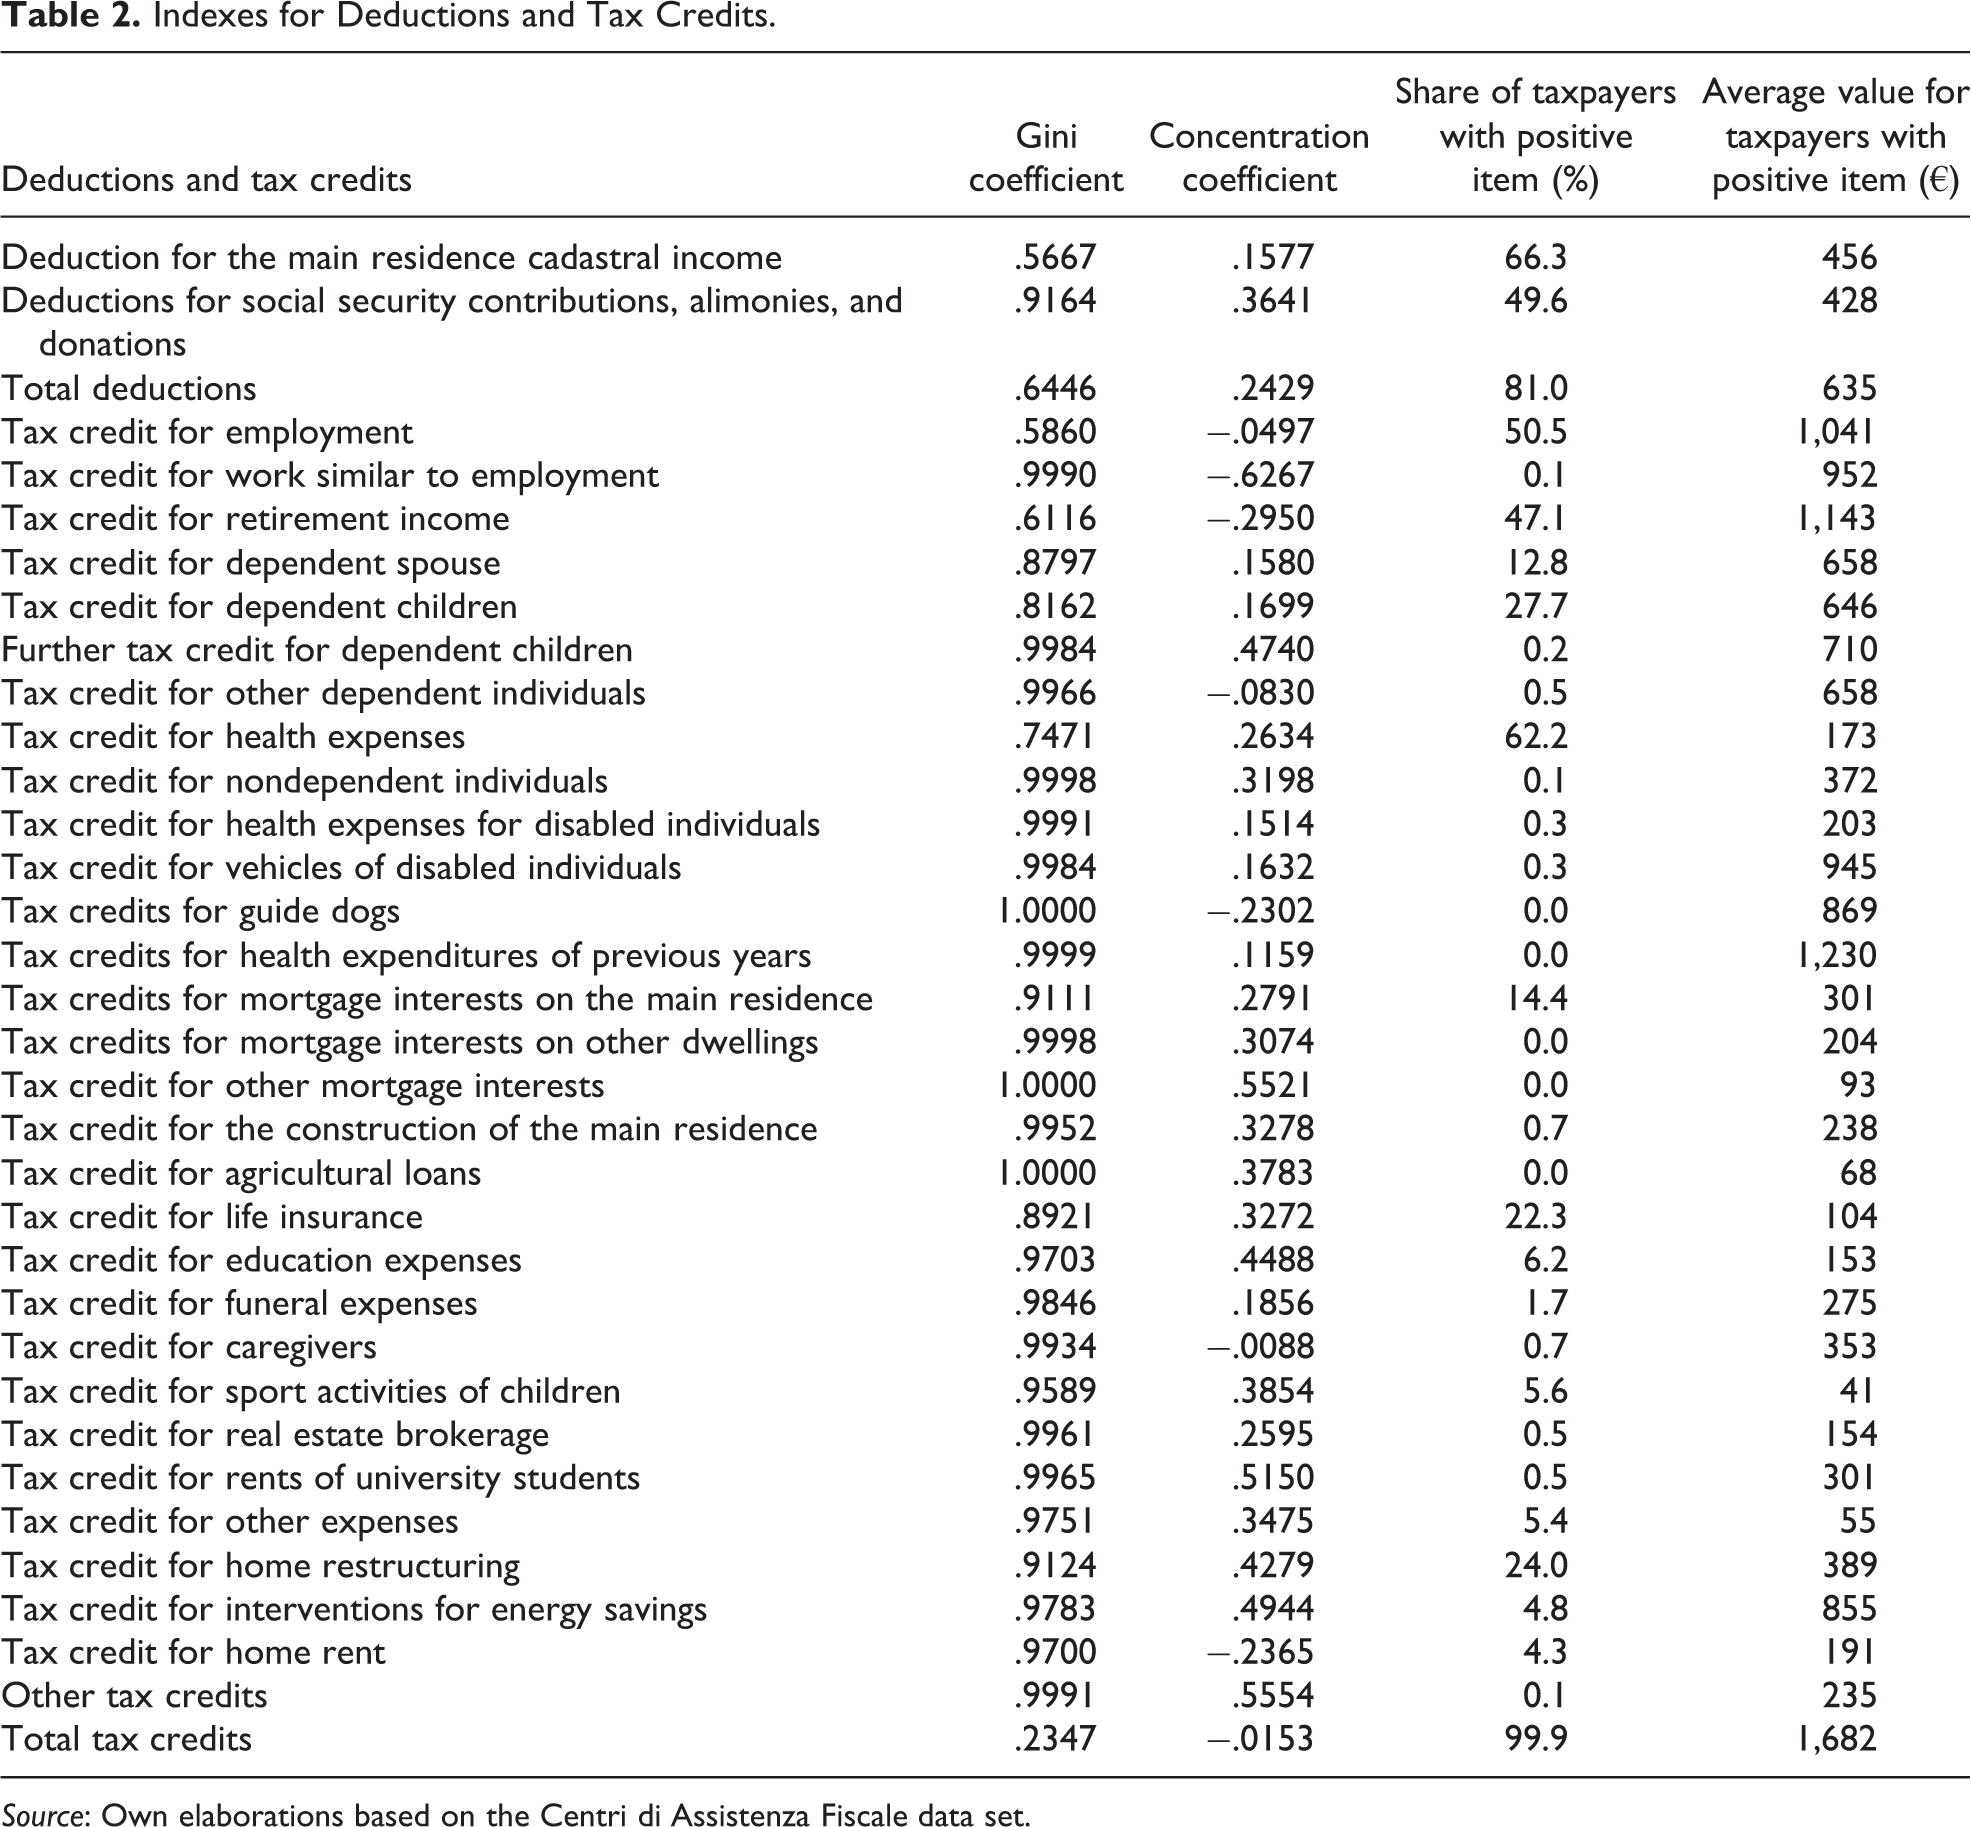
Source: Own elaborations based on the Centri di Assistenza Fiscale data set.
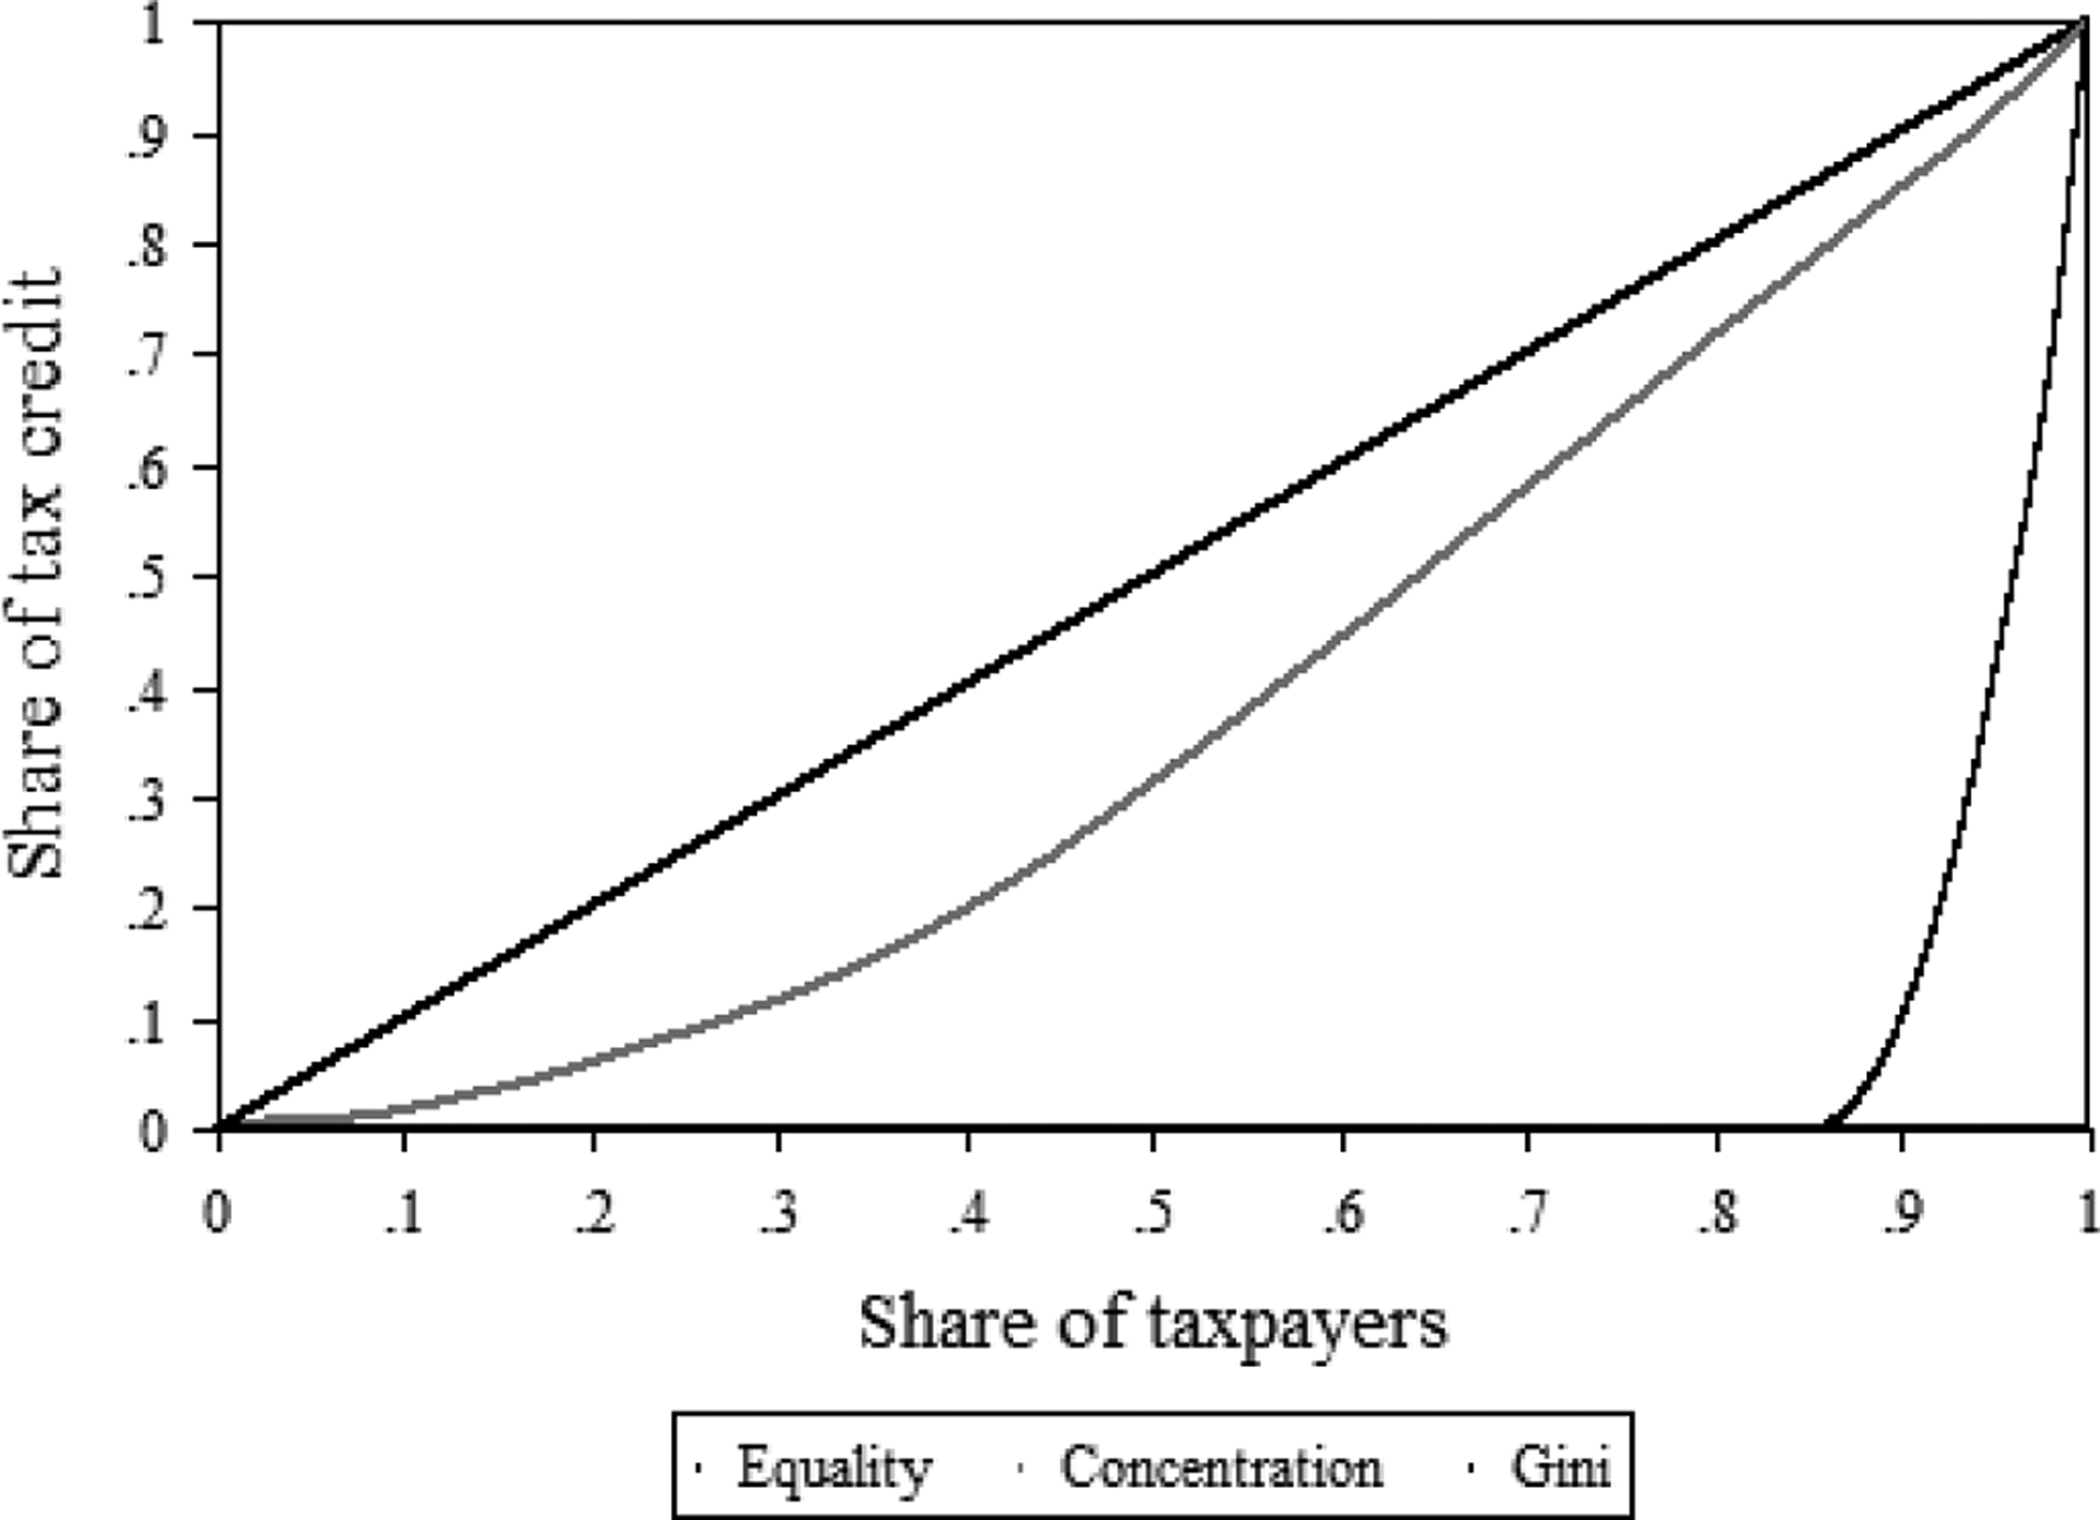
Lorenz and concentration curves for mortgage interests on the main residence.
Few considerations emerge from table 2. First, despite the large number of expenditure items for which allowances and tax credits are available, 4 very few are used by a large number of taxpayers. These include, for instance, out-of-pocket health expenses, itemized by more than 60 percent of individuals in our sample. Despite the large number of taxpayers exploiting these tax credits, their concentration is pretty much high, since both average expenses and the number of individuals are increasing with income. However, average spending is likely to be a small fraction of taxpayers’ income. Second, most tax credits are used by very few individuals, so that their Gini coefficient is very high. A clear example is the expenses for guide dogs for blind individuals, which are characterized by a Gini coefficient of 1. Average expenses are, however, pretty much high in this case, suggesting that these can represent a large share of taxpayers’ income. Third, Making Work Pay tax credits (for both employment and retirement income), which are linearly decreasing with income, are characterized by the lowest Gini indices, and negative concentration coefficients, showing the most “fair” side of the whole system of tax credits and deductions. Fourth, tax credits for dependent family members, which are also decreasing with income, show higher Gini with respect to Making Work Pay tax credits and positive concentration coefficients. Interestingly, only a few taxpayers make use of these credits.
These considerations are clearly confirmed by the Pfähler (1990) decomposition reported in columns 2 and 5 of table 3. Considering the three tools available to government to modify the PIT’s degree of redistribution, tax credits are by far those most effective in the Italian 2011 PIT: according to the Pfähler (1990) decomposition, 60.38 percent of the RS index is due to their role. The statutory rate schedule contributes a share of 38.50 percent, while deductions affect redistribution with a mere 1.11 percent. These shares are quite different from, for instance, those computed by Onrubia, Picos-Sánchez, and del Carmen Rodado (2014) for Spain, a country characterized by a similar progressivity index according to Joumard, Pisu, and Bloch (2013), but where deductions play a much bigger role. Hence, it is a specific choice of the Italian government to focus redistribution within the PIT on the use of tax credits. However, the contribution of the numerous tax credits is largely different. Indeed, more than half of the total redistributive effect of the PIT is due to the Making Work Pay sort of tax credits, in particular, the tax credit for employment (20.85 percent of the total) and the tax credit for retirement income (35.54 percent). On the contrary, most of the other credits do not show any sizable impact. For instance, tax credits for dependent spouse and dependent children contribute with a share of 1.45 percent and 2.87 percent, respectively. Since half of the support to families goes through these tax breaks, this can help explain why the Italian tax-benefit system provides a limited support to households, well below the OECD average of about 2 percent of GDP (OECD 2011).
The Pfähler Decomposition and the Onrubia et al. Decomposition.
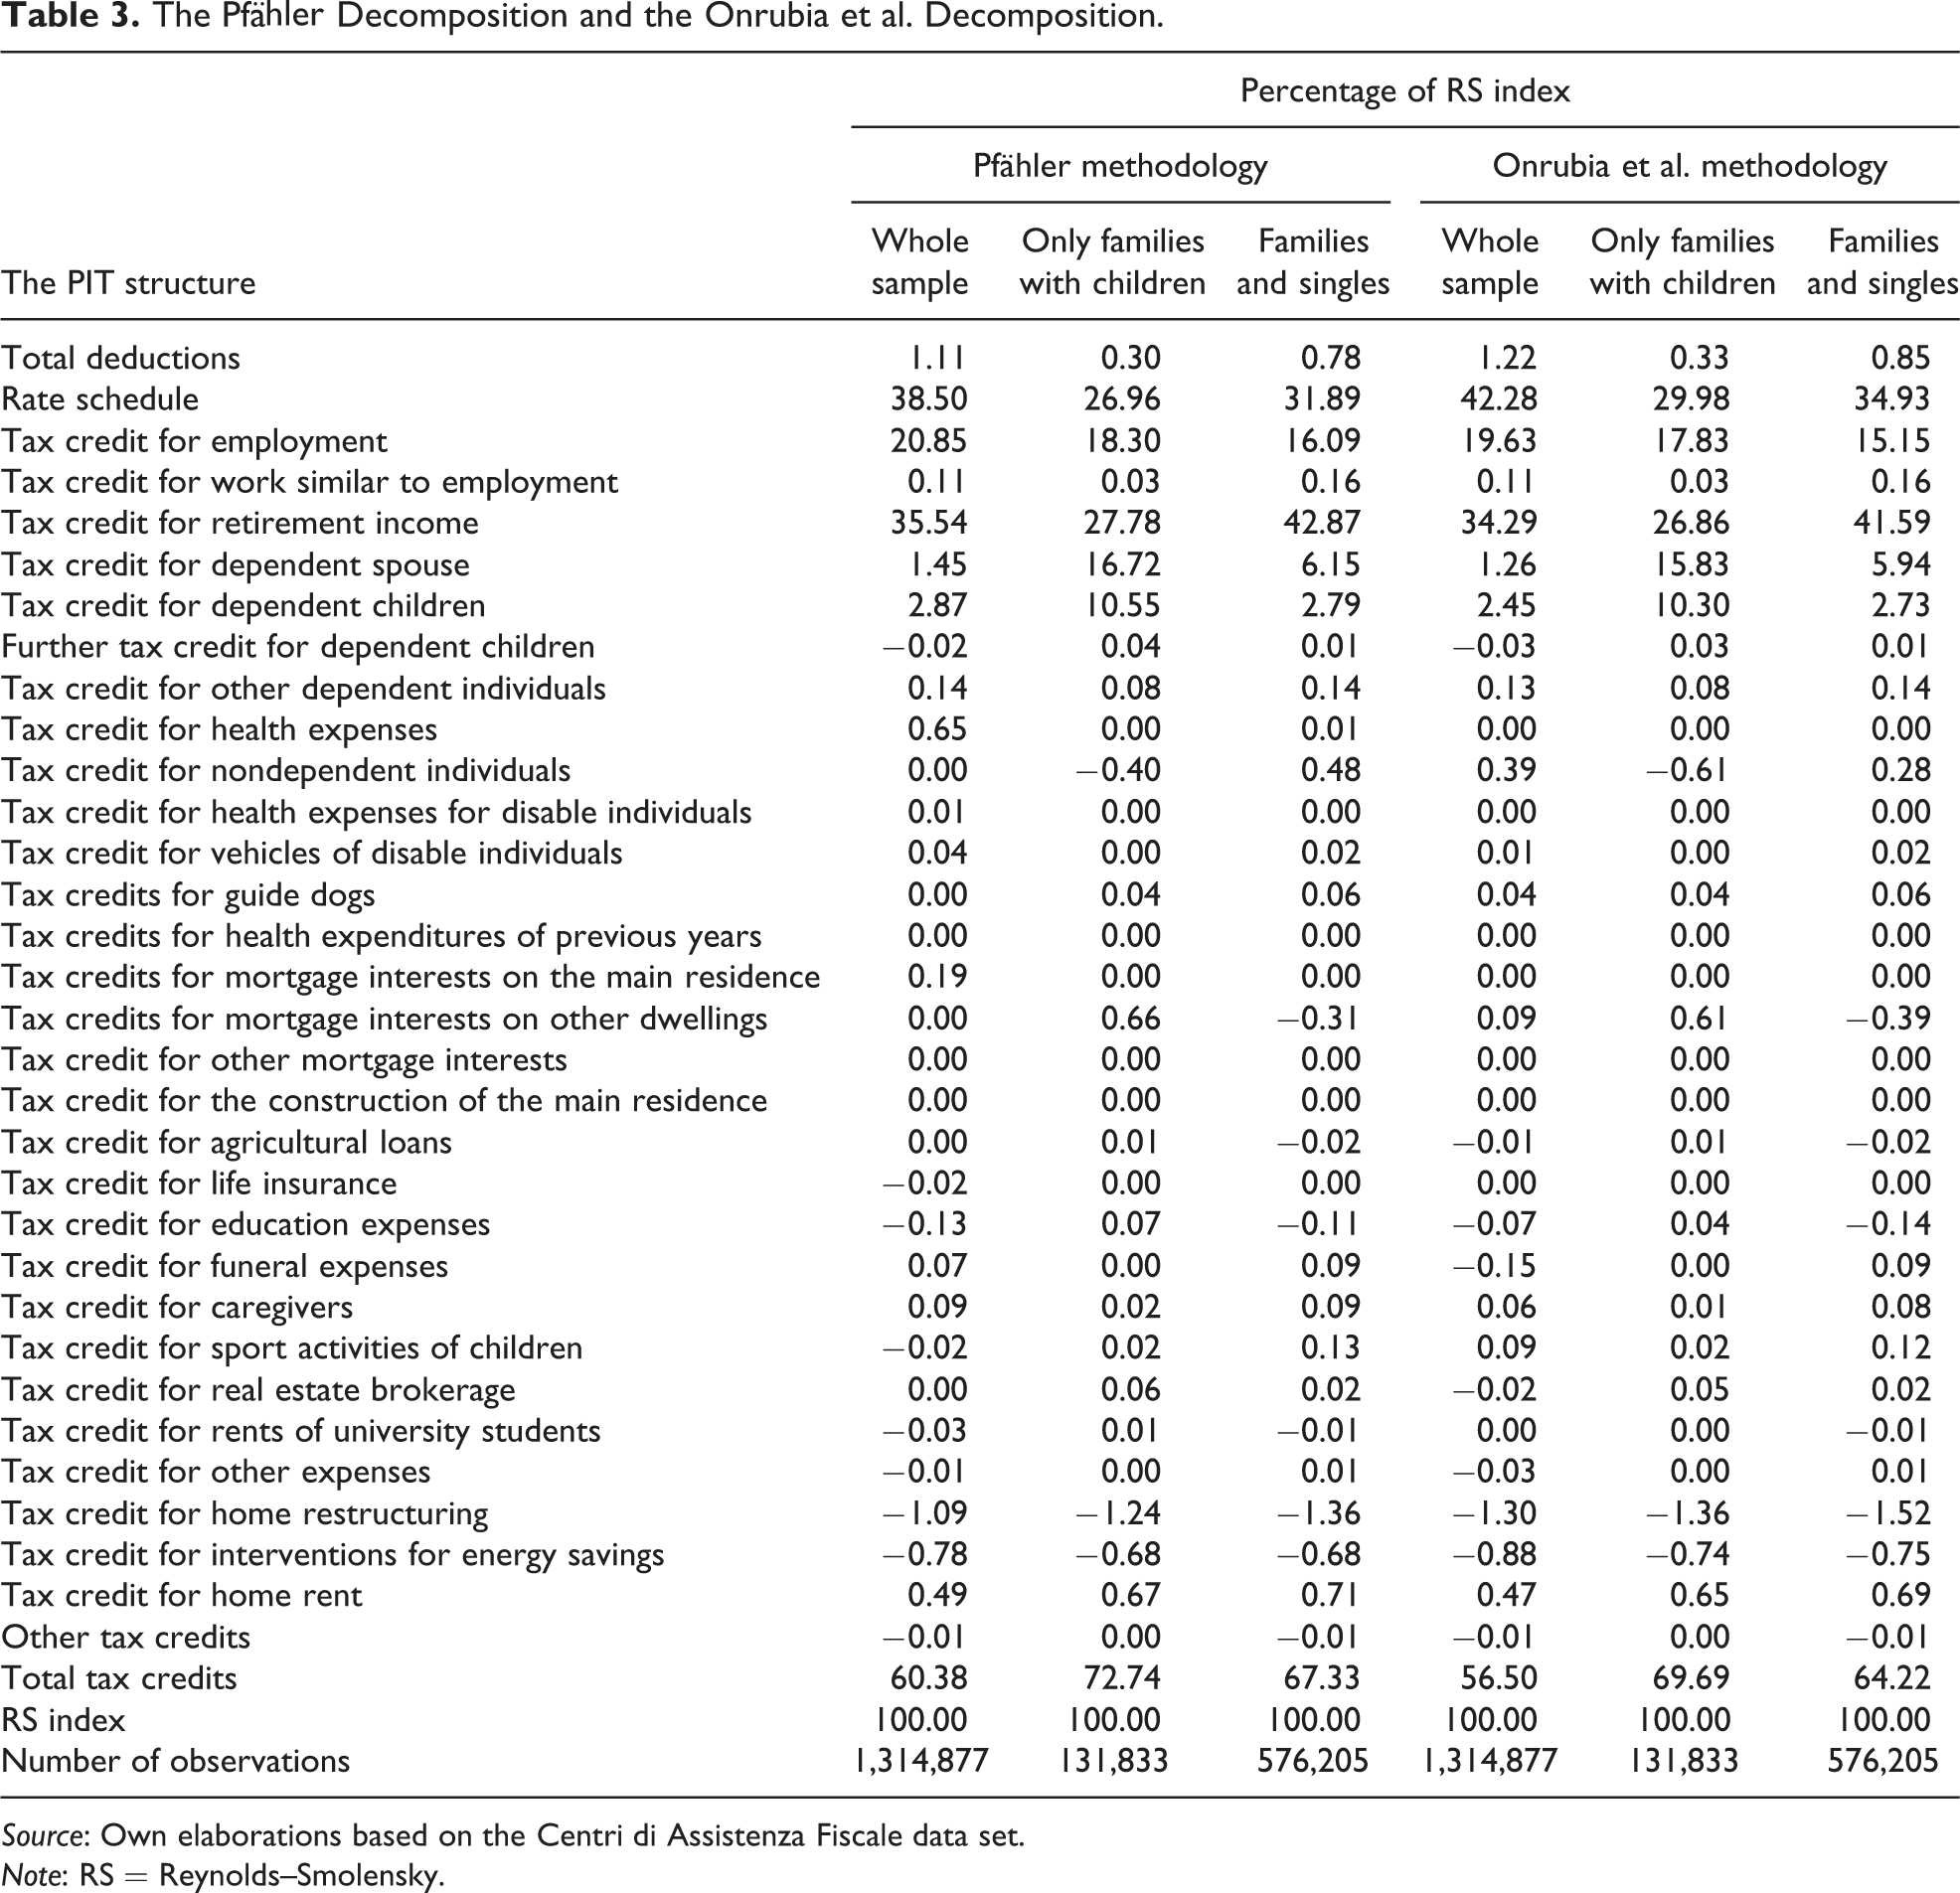
Source: Own elaborations based on the Centri di Assistenza Fiscale data set.
Note: RS = Reynolds–Smolensky.
Moreover, itemized expenditures account for less than 1 percent of the total redistributive effect, and some tax credits show a negative contribution to the overall redistributive effect. For example, one of the most common categories among taxpayers, health expenses, contributes with a mere 0.65 percent. Tax credit for home restructuring shows instead a negative contribution, reducing the total redistributive effect by 1.09 percentage points. Of course, one can argue that tax credits for itemized expenses are not thought mostly for redistributive purposes but to subsidize consumption of certain goods and services. However, even from the point of view of efficiency, they do not seem to perform very well according to available evidence on specific items. For instance, Jappelli and Pistaferri (2007) find that changes in the deductibility of mortgage interests, following the PIT reforms in 1992–1994, did not affect the demand for mortgage debts; the authors explain this fact with borrowing constraints and the lack of financial information about the after-tax interest rate. As for life insurance, Jappelli and Pistaferri (2003) exploit—still in the context of the 1992–1994 reforms of the Italian PIT—the elimination of tax incentives in life insurance contracts for investors with high marginal tax rates and the introduction of incentives for those with low rates. Again, they find no effect of these fiscal reforms, neither on the demand for life insurances nor on the amount invested. Notice that—according to our calculations—tax credits for mortgage interests contribute to either a modest 0.19 percent of the total redistributive effect considering debts subscribed for the main residence or 0 percent for other types of mortgages. Contribution of tax credit for life insurance is even negative. Adding to the fact that they do not contribute to redistribution, most of the itemized credits and deductions do certainly play a role in making the tax structure more complicated from an administrative point of view (for both taxpayers and tax authorities), and more subject to pressures from various lobby groups, a problem emphasized also by international organizations (see, e.g., OECD 2010; Tyson 2014).
Discussion and Policy Implications
Our findings seem to suggest that tax expenditures should be revised. However, these results are subject to a number of limitations that need to be discussed before drawing any policy conclusions. One main problem is the use of individual tax returns, which implies that the analysis is conducted at the individual level. This can severely limit, for instance, the redistributive role of tax credits for dependent relatives, which appear to play a minor role according to the findings discussed above. To overcome this problem, we consider two additional subsamples. The first one only includes taxpayers with dependent spouse and/or children; to be sure that all children are dependent, we consider a very restrictive definition, identifying only taxpayers with each child below the age of six. In order to obtain equivalent incomes, we then apply the equivalence scale given by the square root of the number of households’ components. The second subsample is obtained by adding to the first one all single-member households. Results are in table 3, columns 3 and 6 and 4 and 7, respectively. When only households with children are considered, the role of tax credits increases from 60 percent to 72 percent of the RS index, while the share due to the marginal rate schedule goes from 38 percent to 27 percent. Unsurprisingly, most of the variation is related to the tax credits for dependent spouse and dependent children, while the role of the Making Work Pay credits is reduced. However, when widening the sample to also include singles, results are closer to our baseline estimates. The marginal rate schedule is responsible for about 32 percent of the RS index, while tax credits explain a share of 67 percent. More importantly, the role of the tax credits for dependent spouse and children are substantially reduced to about 6 percent and 3 percent, respectively, while the weight of credit for retirement income sharply increases, suggesting that most of the single-member households are indeed widowed elderly living alone. All in all, however, these results do not change our main conclusion above with respect to the role played by credits for itemized expenditures, which still remain negligible, and sometimes negative.
A second issue is related to the representativeness of our sample, since—from figure 1—it overrepresents the middle class. To overcome this shortcoming, we run a decomposition exercise with a microsimulation model using data from the 2012 Survey on Household Income and Wealth provided by the Bank of Italy, which are instead representative of the Italian population and are widely used for the analysis of redistribution. As already discussed above, this comes at the cost of not being able to distinguish all credits for itemized expenditure. Results from this exercise are given in table 4. Considering individuals or equivalent households produces substantially the same picture, which is actually quite close to our results on the whole sample given in table 3. Considering individuals, the largest share of the RS index (about 51 percent) is explained by the Making Work Pay tax credits, while the marginal rate schedule makes up a share of about 41 percent and the credits for dependent spouse and children is 5 percent. Considering equivalent households, the corresponding values are 46 percent, 40 percent, and 13 percent, respectively. These figures are very close to those coming from our decomposition exercise on CAF data. We find that deductions still play a very minor role (about 2–4 percent), though a bit larger than in our results on CAF data. Finally, we confirm the negligible role played by tax credits on itemized expenditures too. Besides reassuring on the representativeness of our sample, these findings are comforting also on the issue of considering individuals versus households.
The Pfähler Decomposition on Survey Data.

Source: Own elaborations based on the Survey on Household Income and Wealth, 2012.
A third issue that can bias our results is the ordering required by the Pfähler decomposition to work. We already observed that, given the small number of taxpayers with null net tax liability, the choice of ordering should have minor implications for our findings. Nevertheless, a recent improvement proposed by Onrubia, Picos-Sánchez, and del Carmen Rodado (2014) allows us to overcome this issue. We then rerun the same decomposition exercises on the whole sample, the subsample of families with children aged less than six years, and the subsample of these families and single-member households. Results are given in table 3 and provide a consistent picture with respect to the standard Pfähler methodology. Limiting the discussion to the whole sample, we find that the share of the RS index explained by the marginal rate schedule is 42 percent with the Onrubia, Picos-Sánchez, and del Carmen Rodado (2014) methodology, while the share of tax credits is 56 percent. These figures compare with 38 percent and 60 percent using the standard Pfähler methodology. As for deductions, results are almost identical: 1.22 percent with the new approach and 1.11 percent with the standard one.
Finally, also tax evasion could impact on our results. This is an important issue within the Italian PIT, since estimates of the tax gap are relatively large among Western countries, though they might be upward biased by not acknowledging the role of illegal production (see, e.g., the discussion in Ardizzi et al. 2014). We are not able to consider this issue further with our data. However, we can build on available literature to provide some speculative observations on the likely effect of tax evasion on the redistributive effect of the Italian PIT. For instance, Fiorio and D’Amuri (2005) show that, contrary to what one can expect, not only self-employed but also employees hide income from tax authorities, especially in lower deciles. Hence, by allowing unskilled workers to supplement their little income, tax evasion improves equality and makes the PIT more progressive. Of course, this opens the issue of potential horizontal inequities and reranking effects that might arise between tax evaders and fully compliant taxpayers (see also Albarea et al. 2015, on this point). The impact on the relative role of tax deductions, tax credits, and the marginal rate schedule is more difficult to identify and rests on the characteristics of tax evaders in the bottom deciles.
What are then the policy implications of our findings? Considering the standard Pfähler methodology, more than 90 percent of the whole redistribution is made up by the rate schedule and two Making Work Pay sort of credits, for current employees and for pensioners. The contribution of credits for itemized expenditures and tax deductions is negligible and even negative in some cases. Hence, credits and deductions for expenditure items should be revised taking into account the goal that is pursued and the potential alternatives (in this sense, see also, e.g., Tyson 2014; MEF 2011; OECD 2010). For instance, tax credit for health expenses (which include co-payments for accessing publicly provided treatments) should be compared with the increase in direct health care spending. Tax credits for mortgage interest should be compared with social housing initiatives. Eliminating some of these allowances and credits might free resources to lower the average tax rate, either by modifying the marginal rate schedule or by increasing tax credits that are effective in influencing redistribution. In this framework, one should carefully consider credits for dependent spouse and children, since we have shown that they can play a crucial role in terms of horizontal redistribution, despite the little share of RS index they explain.
Concluding Remarks
In this article, we apply an extended version of the standard Pfähler approach in order to estimate the contribution of the tax deductions, the marginal rate schedule, and the tax credits to the overall redistributive performance of the Italian PIT. The analysis is based on a very large sample of real tax return forms provided by the tax assistance centers of the Italian Association of Christian Workers, which allow us to estimate the contribution of each specific deduction/credit admitted by the tax legislation.
Our estimates suggest that more than half of the total redistributive effect of the PIT is due to the tax credit for employment and the tax credit for retirement income, while the marginal rate schedule contributes with about 40 percent. On the contrary, most of the itemized expenditures do not show any sizable impact on redistribution, and some of them negatively contribute to the overall redistributive effect. In a policy perspective, this calls for an agenda that methodically revise all the categories of tax credits, in order to both simplify the structure of the PIT and obtain resources to reduce the tax wedge without affecting the degree of redistribution.
Footnotes
Acknowledgments
We would like to thank the three anonymous referees and the editors for their useful comments that helped us improving this article. Thanks are also due to the tax assistance centers of the Italian Association of Christian Workers (Centri di Assistenza Fiscale dell’Associazione Cristiana Lavoratori Italiani) for having kindly provided the data. Usual disclaimers apply.
Declaration of Conflicting Interests
The author(s) declared no potential conflicts of interest with respect to the research, authorship, and/or publication of this article.
Funding
The author(s) received no financial support for the research, authorship, and/or publication of this article.
Supplemental Material
Supplementary material for this article is available online.
Notes
References
Supplementary Material
Please find the following supplemental material available below.
For Open Access articles published under a Creative Commons License, all supplemental material carries the same license as the article it is associated with.
For non-Open Access articles published, all supplemental material carries a non-exclusive license, and permission requests for re-use of supplemental material or any part of supplemental material shall be sent directly to the copyright owner as specified in the copyright notice associated with the article.