



Abstract
This study aims at identifying the dimensions of experiential quality and examining the interrelationships among experiential quality, perceived value, heritage image, experiential satisfaction, and behavioral intentions for heritage tourists. The dimensions of experiential quality are built on a basis of reflective indicators, and a multidimensional and hierarchical model is used as a framework to synthesize the effects of experiential quality, perceived value, heritage image, and experiential satisfaction on behavioral intentions perceived by heritage tourists. Analysis of data from 427 tourists in the Historic Center of Macau indicates that the proposed model fits the data well. The results reveal that there are four primary dimensions and 10 subdimensions of experiential quality perceived by heritage tourists. In addition, the results indicate that outcome quality is identified as the most primary dimension of experiential quality perceived by heritage tourists.
Keywords
Introduction
Tourism industry has played a key role in boosting the global economy, generating $3.5 trillions in annual revenue (Mouaffo, 2007). In 2012, the United Nations World Tourism Organization’s (UNWTO; 2013) latest report mentioned that a record 1 billion tourists crossed international borders. In its long-term forecast, the UNWTO states that international tourism will continue to grow in a sustained manner in the next two decades (2010-2030), with the number of international tourist arrivals worldwide increasing by an average of 3.3% a year. The World Travel and Tourism Council forecasts that global tourism will have exceeded $10.8 trillion in tourism expenditures and 296.2 million in jobs by 2018 (Guliling, Abdul Aziz, Bojei, & Sambasivan, 2013). These figures reveal the vast potential of the tourism sector to be expanded further in coming years (Guliling et al., 2013).
Heritage tourism, like other leisure and tourism activities, has been considered to a great extent as an experiential consumption (Chen & Chen, 2010). Nowadays, the development of heritage tourism is significantly successful in Macau. The culture of Macau is not merely gaming but also east–west cultural pluralism (StudyMode, 2013). In addition, Macau possesses the world’s highest density of the United Nations Educational, Scientific and Cultural Organization (UNESCO) World Heritage Site features, with attractions packed into the Historic Center of Macau (HCM; Li & Wong, 2012). Despite the growing interest in heritage tourism, there is a surprising lack of understanding of tourists’ experiential quality at a cultural heritage site (Masberg & Silverman, 1996).
To increase tourists’ positive behavioral intentions, heritage managers should set their priorities to provide high experiential quality and experiential satisfaction and satisfying experiences that tourists perceive to be a good value and that leave good impressions of cultural heritage sites (Chen & Tsai, 2007; Lee, Petrick, & Crompton, 2007; Rindell, 2013). The tourist behavior includes an impression of a cultural heritage site to visit and subsequent evaluations and future behavioral intentions. The subsequent evaluations include the experiential quality during the stay, perceived value, image, and overall experiential satisfaction whereas the future behavioral intentions include the intention to revisit and the willingness to recommend (Chen & Chen, 2010; Chen & Tsai, 2007; Rindell, 2013). These complex interrelationships between behavioral intentions at a cultural heritage site and direct (e.g., heritage image and experiential satisfaction) and indirect outcomes (e.g., experiential quality and perceived value) create an imperative to improve insight into the effects of new attractions on the cultural performance of an organization involving a cultural heritage site (Chen & Chen, 2010; Chen & Tsai, 2007; Jin, Lee, & Lee, 2013; Rindell, 2013). However, few studies pay attention to whether experiential quality, perceived value, heritage image, and experiential satisfaction affect behavioral intentions in a heritage context (Chen & Chen, 2010; Huh, Uysal, & McClearly, 2006; Kao, Huang, & Wu, 2008; Prayag, 2009; Rindell, 2013).
The primary dimensions and subdimensions of quality perceived by customers have been applied in different industries, using multidimensional and hierarchical modeling as a robust and testable framework (Brady & Cronin, 2001; Caro & Garcia, 2007, 2008; Dabholkar, Thorpe, & Rentz, 1996; Wu, 2014; Wu & Ko, 2013). However, several studies (Chen & Chen, 2010; Wan & Cheng, 2011) indicate that few studies focus on identifying the primary dimensions and subdimensions of experiential quality using a multidimensional and hierarchical model for heritage tourists. In addition, few studies focus on identifying the least and most important dimensions of experiential quality perceived by heritage tourists (Li, 2013; Narayan, Rajendran, Sai, & Gopalan, 2009).
In this study, there are three research objectives. The first objective is to identify the dimensions of experiential quality perceived by heritage tourists using a multidimensional and hierarchical framework. The second objective is to examine the interrelationships between behavioral intentions of tourists and the other higher order constructs: experiential quality, perceived value, heritage image, and experiential satisfaction perceived by heritage tourists. The third objective is to identify the least and most important dimensions of experiential quality perceived by heritage tourists.
The contribution of this study is twofold. First, this study contributes to the marketing literature by providing an examination of several services marketing constructs. This is an important contribution because it provides a better understanding of heritage tourists’ perceptions of experiential quality, value, image, experiential satisfaction, and behavioral intentions. Second, this study conceptualizes and measures heritage tourists’ perceptions of experiential quality using a multidimensional and hierarchical approach. This approach helps overcome some of the weaknesses of traditional measurement methods (SERVQUAL [service quality], SERVPERF [service performance], and HISTOQUAL) and thus provides a more accurate approach to assessing the heritage tourist perception of experiential quality.
Conceptual Background
Service Quality
Parasuraman, Zeithaml, and Berry (1988) define service quality as “a global judgment, or attitude, relating to the superiority of the service (p. 16).” Zeithaml, Berry, and Parasuraman (1996) indicate that a better understanding of what customers expect has been the most crucial step in defining and delivering high service quality. Service quality is therefore an enduring construct that encompasses quality performance in all activities undertaken by managers and employees (Prayag, 2009). The SERVQUAL scale was designed to measure consumers’ perceptions of service quality using 22 items representing five distinct dimensions: tangibles, reliability, responsiveness, assurance, and empathy (Parasuraman et al., 1988). Traditionally, several researchers (Cheng & Wan, 2012; Hwang, Lee, & Chen, 2005; Tribe & Snaith, 1998; Wan & Cheng, 2011) have applied this scale to measure service quality in the tourism industry. Despite the widespread adoption of this scale, it has been criticized on both theoretical and procedural grounds. Major criticisms of this scale include its length, the validity of its five generic service quality dimensions, and the predictive power of this scale to subsequent consumer purchases (Carman, 1990; Finn & Lamb, 1991). For instance, Saleh and Ryan’s (1991) study of Canadian hotel customers has identified five altered dimensions: conviviality, tangibles, reassurance, avoid sarcasm, and empathy.
According to Cronin and Taylor (1992), the SERVPERF scale is used to measure service quality with a performance-based approach. Several researchers (Nadiri & Hussain, 2005; Nadiri, Hussain, & Kandampully, 2011) aim to diagnose the applicability of the perceived service quality measurement scale to European customers in a new emerging market and to university students. They adopt the performance-based SERVPERF paradigm by using items adapted from SERVQUAL. The results of an exploratory factor analysis (EFA) reveal that the SERVPERF scale cannot form its five assumed dimensions: tangibles, reliability, responsiveness, assurance, and empathy. The results form only two dimensions: tangibles and intangibles (Nadiri et al., 2011; Nadiri & Hussain, 2005).
According to Frochot and Hughes (2000), the HISTOQUAL scale is useful in assessing service quality performance across a property and across different cultural heritage sites. This scale provides insights into which particular aspects of a dimension may pose a problem, thereby indicating suggestions for improvements. However, difficulty has been found in applying some of items in the dimensions to the evaluation of service quality in some of the cultural heritage sites (Wan & Cheng, 2011).
Experiential Quality
Service quality in tourism has been largely measured through a range of techniques that have been developed from the supplier’s viewpoint (Briggs, Sutherland, & Drummond, 2007). In the tourism context, service quality refers to service performance at the attribute level whereas experiential quality refers to the psychological outcome resulting from the tourist participation in tourism activities (Chen & Chen, 2010; MacKay & Crompton, 1988). The former has been defined as the quality of the attributes of a service that are under the control of a supplier, whereas the later involves not only the attributes provided by a supplier but also the attributes brought to the opportunity by the tourist (Chen & Chen, 2010; MacKay & Crompton, 1988). The quality tourists perceive is much more associated with their experiences during the process of visitation than services per se provided by the cultural heritage site. Unlike service quality and its measurement, however, there is still little research shedding light on the experiential quality of specific tourism participation such as heritage visitation (Chen & Chen, 2010). Several researchers (Ko, Zhang, Cattani, & Pastore, 2011; Moon, Kim, Ko, Connaughton, & Lee, 2011) have attempted to modify the concept for service quality in order to define and create a construct for ‘experiential quality’ rather than use a more general category of service quality in diverse sectors.
Following Zeithaml’s (1988) definition of quality, experiential quality in this study is defined as a perceived judgment about the excellence or superiority of the tourist experience. Chen and Chen (2010) indicate that experiential quality involves not only the attributes provided by a supplier but also the attributes brought to the opportunity by the tourist. Experiential quality can be conceptualized as tourists’ affective responses to their desired social-psychological benefits (Chen & Chen, 2010). This concept also refers to a specific service transaction, such as contact with people who contribute to the actual experience (Chan & Baum, 2007). Otto and Ritchie (1996) develop the scale of experiential quality with four factors—hedonics, peace of mind, involvement, and recognition—using consumer survey data obtained from three tourism service sectors: hotels, airlines, and tours and attractions. In addition, Cole and Scott (2004) employ three factors—entertainment, education, and community—to estimate the experiential quality of visitors to zoos. Furthermore, Jin et al. (2013) and Kao et al. (2008) propose that the measurement of experiential quality should be made in terms of immersion, surprise, participation, and fun for theme parks. Moreover, Verhoef et al. (2009) state that the measurement of experiential quality involves cognitive, affective, social, and physical responses to the retailer without further elaboration. Therefore, several studies (Chen & Chen, 2010; Cole & Scott, 2004; Li & Wu, 2013; Otto & Ritchie, 1996; Wan & Cheng, 2011) indicate that experiential quality should be measured based on a multidimensional and hierarchical model to appropriately measure the heritage tourist’s perceptions of experiential quality.
In this study, a multidimensional and hierarchical model of experiential quality is measured using the concept of reflective factor models. Reflective factor models are based on the assumption that latent constructs result in measured variables (indicators). Alternatively, formative factor models are based on the assumption that measured variables (indicators) result in latent constructs (Bollen & Lennox, 1991; Kline, 2005). Reflective factor models are different from formative factor models in several aspects. In reflective factor models, all indicator items are caused by the same latent construct and are highly correlated with each other. The high correlations among the indicator items make internal consistency and reliability useful validation criterion for reflective factor models (Bollen & Lennox, 1991). In contrast, all formative indicators do not have to be highly correlated in formative factor models; therefore, indicator reliability cannot be assessed empirically in formative factor models (Diamantopoulos & Siguaw, 2006). In addition, a single formative measurement model cannot be tested for the model fit using structural equation modeling (SEM) without some alteration, as a formative factor model is unidentified (Hair, Black, Babin, Anderson, & Tatham, 2006). However, reflective factor models can be identified and be directly tested for fit. Several researchers (Bollen & Lennox, 1991; Diamantopoulos & Winklhofer, 2001; Fornell & Bookstein, 1982) recommend that reflective factor models are suitable for measuring psychological constructs such as attitudes and personality. This study suggests that guidelines for validating reflective factor models are more easily determined than guidelines for validating formative factors. However, a multidimensional and hierarchical model of experiential quality as a reflective construct has not been developed in an applied framework to identify the primary dimensions and subdimensions of experiential quality or to analyze the relationship between experiential quality and the primary dimensions and subdimensions of experiential quality perceived by heritage tourists (Li, 2013).
Perceived Value
Zeithaml (1988) defines perceived value as “the consumer’s overall assessment of the utility of a product or service based on perceptions of what is received and what is given” (p. 14), that is, a trade-off between perceived benefits and perceived costs (Lovelock, 2000). Babin, Darden, and Griffin (1994) indicate that it is worth noting that the general definition of value is a consumer’s perception of the subjective worth of some activity or object considering all net benefits and costs of consumption. Previous studies suggest that perceived quality has been considered to be an antecedent of perceived value of tourism services (Duman & Mattila, 2005), and perceived value is an important antecedent to satisfaction (Cronin, Brady, & Hult, 2000; McDougall & Levesque, 2000).
Heritage Image
Heritage image represents the temporal dimension in the tourist’s impression of cultural heritage sites (Rindell, 2007). This concept has been generated based on the findings from the empirical research focusing on consumers’ corporate image. Corporate image is referred to as perceptions of an organization reflected in the associations held in the consumer’s memory (Keller, 1993). In contrast, heritage image is conceptualized as the tourist’s earlier cultural heritage sites–related experiences from multiple sources over time, which merge indistinguishably with more recent experiences during current image construction; there is always an element of “then” in the “now” (Rindell, 2013). The concept of heritage image is proposed as a useful conceptual framework for understanding the influence of the past on individuals’ present heritage image construction processes. However, few studies pay attention to exploring the measurement of heritage image in the tourism industry (Rindell, 2007, 2013).
Experiential Satisfaction
Experiential satisfaction derives from the concept of service satisfaction, though it extends beyond service satisfaction in that it focuses on consumers’ overall evaluation of their experiences after consumption (Kao et al., 2008). In this study, experiential satisfaction is defined as a tourist’s overall satisfaction with the visit experienced at a cultural heritage site, as proposed by Chen and Chen (2010). From an experiential perspective, experiential satisfaction reflects the satisfaction experienced from the service content associated with a specific transaction. Tourists compare their experiences with their prior expectations, which cause positive or negative disconfirmation. The emotional responses resulting from positive or negative disconfirmation form the basis for tourist satisfaction or dissatisfaction (Bigne, Andreu, & Gnoth, 2005). Namely, a tourist whose experience falls below his/her prior expectation will be dissatisfied. In contrast, tourists whose experiences are consistent with or higher than their prior expectations will be satisfied (Chen & Chen, 2010; Dobrota, Nikodijevic, & Mihailovic, 2012). Therefore, here the concept of experiential satisfaction is proposed based on an experiential perspective, and it is considered to be the result of tourists’ evaluation of the contents presented by service providers (Kao et al., 2008).
Behavioral Intentions
The concept of behavioral intentions is referred to as people’s beliefs about what they intend to do in a certain situation (Ajzen & Fishbein, 1980). Favorable behavioral intentions frequently represent customers’ conative loyalty. Customer loyalty is an important goal in the consumer marketing community as it is a key component for a company’s long-term viability or sustainability. Measuring loyalty can provide a better understanding of customer retention (Chen & Chen, 2010). According to Oliver (1999), customer loyalty can be identified into four stages: cognitive loyalty, affective loyalty, conative loyalty, and action loyalty. In practice, action loyalty is difficult to measure, and thus most researchers use behavioral intentions, that is, conative loyalty, as a compromise of action loyalty (Yang & Peterson, 2004). On the other hand, several researchers (Varki & Colgate 2001; Yi & La 2004) have considered the attitudinal part of loyalty to be an adequate measurement for the evaluation of loyalty. This has very frequently been measured in studies of tourism services as behavioral intentions, namely, intentions to revisit or repurchase and willingness to recommend to other people (Bonn, Joseph-Mathews, Dai, Hayes, & Cave, 2007; Chen & Chen 2010; Yi & La, 2004). Thus, positive experiences of services generate repeat visits and result in positive recommendations to acquaintances and friends (Chen & Tsai 2007; Lee, Lee, & Choi 2011), which are considered to be the most important and most trusted source of information for potential tourists (Williams & Soutar, 2009).
Research Model and Hypothesis Development
The conceptual research model was developed using a multidimensional and hierarchical structure based on the framework adapted from several studies (Brady & Cronin, 2001; Dabholkar et al., 1996; Pollack, 2009). To form an overall experiential quality perception, the multi-imensional and hierarchical model reflects the proposition that tourists form their perceptions of each of four primary dimensions: interaction quality, physical environment quality, outcome quality, and access quality. In the research model, a tourist’s perception of experiential quality influences experiential satisfaction and value, which in turn, results in experiential satisfaction. In addition, heritage image has an influence on experiential quality and experiential satisfaction, respectively. Finally, both experiential satisfaction and heritage image affect behavioral intentions. The proposed subdimensions of experiential quality in the research model have been identified by an extensive review of the tourism literature and using the results obtained in focus group interviews.
Interaction Quality
Chan, Fielt, Gable, and Stark (2010) indicate that interaction quality focuses on the measurement of quality delivered by service providers. The literature identifies four subdimensions of interaction quality: (a) attitude (Lu, Zhang, & Wang, 2009), (b) behavior (Clemes, Shu, & Gan, 2014), (c) problem solving (Dabholkar et al., 1996), and (d) expertise (Caro & Garcia, 2008). These subdimensions are expected to have a positive relationship with interaction quality. Therefore, the first hypothesis is proposed:
Hypothesis 1: There is a positive relationship between the subdimensions of interaction quality (Hypotheses 1a-1d) and interaction quality.
Physical Environment Quality
Lu et al. (2009) consider physical environment quality as how the service is effectively transmitted from service providers to consumers. The literature and focus group interviews identify four subdimensions of physical environment quality: (a) physical facility (Clemes, Wu, Hu, & Gan, 2009), (b) environment (focus group sessions), (c) design (Wu, Lin, & Hsu, 2011), and (d) location (focus group sessions). These subdimensions are assumed to have a positive relationship with physical environment quality. Therefore, the second hypothesis is proposed:
Hypothesis 2: There is a positive relationship between the subdimensions of physical environment quality (Hypotheses 2a-2d) and physical environment quality.
Outcome Quality
Outcome quality focuses on the outcome of the service act, indicating what customers gain from the service—in other words, whether outcome quality satisfies the customer’s needs and wants (McDougall & Levesque, 1994; Rust & Oliver, 1994). The literature and focus group interviews have identified three subdimensions of outcome quality: (a) valence (Brady & Cronin, 2001), (b) venue (focus group sessions), and (c) sociability (Clemes et al., 2009). These subdimensions are assumed to have a positive relationship with outcome quality. Therefore, the third hypothesis is proposed:
Hypothesis 3: There is a positive relationship between the subdimensions of outcome quality (Hypotheses 3a-3c) and outcome quality.
Access Quality
Several researchers (Chen, Lee, Chen, & Huang, 2011; Shonk & Chelladurai, 2008) define access quality as the ease and speed with which tourists can reach their desired location. Two subdimensions making up access quality have been identified in the literature: (a) convenience (Chen et al., 2011) and (b) information (Wu, 2012). These subdimensions are assumed to have a positive relationship with access quality. Accordingly, the fourth hypothesis is proposed:
Hypothesis 4: There is a positive relationship between the subdimensions of access quality (Hypotheses 4a and 4b) and access quality.
Overall Perceived Experiential Quality
Tourists assess their overall perceptions of experiential quality by evaluating each primary dimension of experiential quality: interaction quality, physical environment quality, outcome quality, and access quality (Brady & Cronin, 2001; Clemes, Gan, & Kao, 2007; Kao et al., 2008; Li & Wu, 2013; Shonk & Chelladurai, 2008). The primary dimensions of experiential quality, as identified in the literature, are hypothesized to have a positive relationship with tourists’ overall perceptions of experiential quality. Therefore, the following four hypotheses are proposed:
Hypothesis 5: There is a positive relationship between interaction quality and overall perceptions of experiential quality.
Hypothesis 6: There is a positive relationship between physical environment quality and overall perceptions of experiential quality.
Hypothesis 7: There is a positive relationship between outcome quality and overall perceptions of experiential quality.
Hypothesis 8: There is a positive relationship between access quality and overall perceptions of experiential quality.
The Interrelationships Between the Higher Order Constructs: Experiential Quality, Perceived Value, Experiential Satisfaction, Heritage Image, and Behavioral Intentions
Several researchers (Chen & Chen, 2010; Chen & Tsai, 2007; Kao et al., 2008) indicate that experiential quality has been found to positively influence perceived value and experiential satisfaction. According to supports in previous studies, perceived value has a positive influence on overall experiential satisfaction (Cronin et al., 2000; Kao et al., 2008; Petrick & Backman, 2002), which appears to be a direct antecedent of behavioral intentions. Therefore, the following four hypotheses are proposed:
Hypothesis 9: Experiential quality positively influences perceived value.
Hypothesis 10: Experiential quality positively influences experiential satisfaction.
Hypothesis 11: Perceived value positively influences experiential satisfaction.
Hypothesis 12: Experiential satisfaction positively influences behavioral intentions.
Tourists having a favorable heritage image will perceive their experiential quality positively (Andreassen & Lindestad, 1998; Bolton & Drew, 1991; Rindell, 2013). Several studies (Kandampully & Suhartanto, 2000; O’Leary & Deegan, 2005) indicate that image is a critical factor in influencing satisfaction. In contrast, the literature indicates that image is an antecedent of revisit intentions and likelihood to recommend or say positive thing about an attraction (Chen & Tsai, 2007; Petrick, 2004; Rindell, 2013; Wu et al., 2011). Therefore, the following three hypotheses are proposed:
Hypothesis 13: Heritage image positively influences experiential quality.
Hypothesis 14: Heritage image positively influences experiential satisfaction.
Hypothesis 15: Heritage image positively influences behavioral intentions.
The multidimensional and hierarchical model of experiential quality presented in Figure 1 summarizes the hypotheses formulated to test each path in the research model.
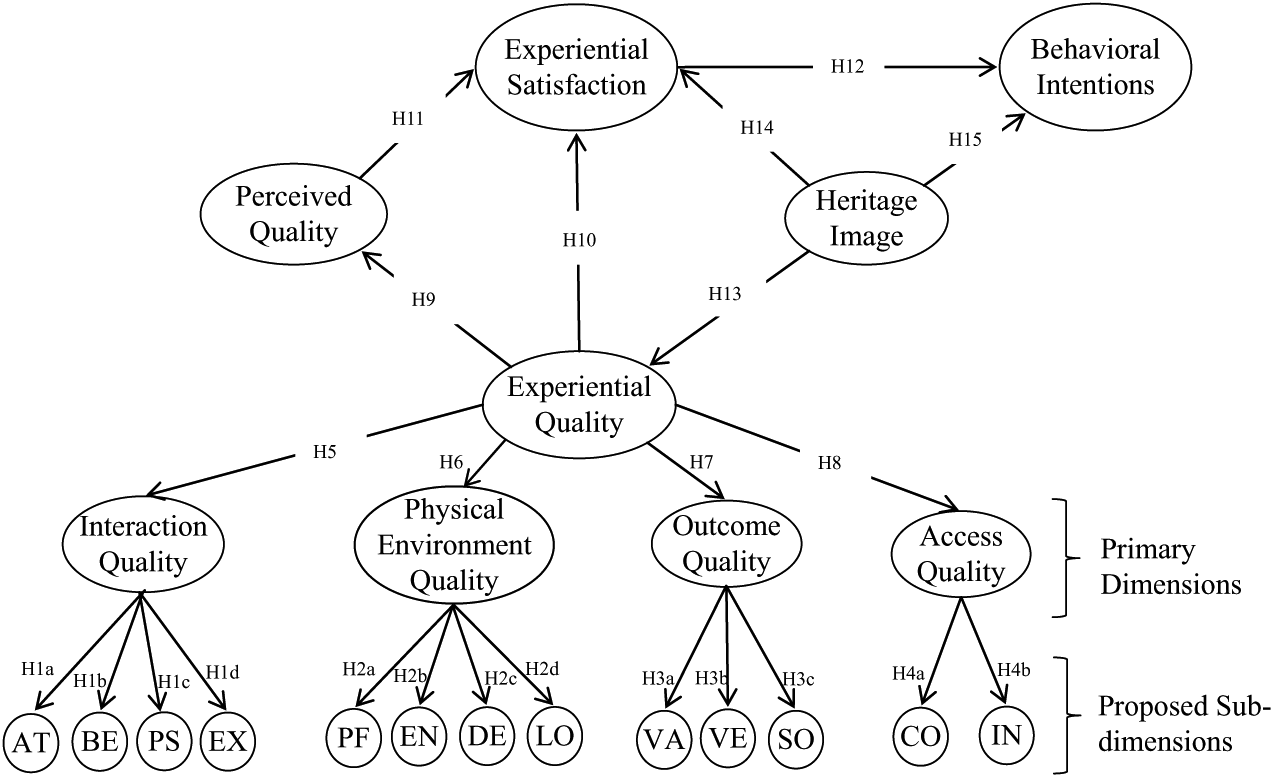
A Conceptual Research Model
Research Design and Method
Questionnaire Development
This study involves a two-stage design, consisting of focus group interviews and self-administered questionnaires. The first stage consisted of focus group interviews to gain in-depth insights into the tourists’ overall visiting experiences at the cultural heritage site. Krueger (1998) shows that a focus group study is frequently used to design a questionnaire for a quantitative survey. The subdimensions pertaining to the four primary dimensions have been identified in the literature review. However, not all of the subdimensions can be fully identified in the literature review. To further identify more subdimensions, three focus group interviews were conducted, as suggested by Edmunds (1999). Each group was composed of six travelers who were required to have recently visited the HCM. Participants in the focus groups were recruited using a convenience sample drawn from the Mainland China, Hong Kong, Taiwan, Korea, Japan, Malaysia, Singapore, and Philippines population. The tourists from eight regions and countries have been seen as the largest traveling groups in Macau, as proposed by the Statistics and Census Service (2012). The focus group participants were males and females of mixed age, represented several occupations, and had varying incomes. Before the focus group interviews were conducted, the researchers telephoned people to confirm whether they were 18 years or older in order to ascertain that each group member was mature enough to understand the content of the interview questions. During the interviews, participants were encouraged to list all factors that influenced their perceptions of experiential quality according to their recent visiting experiences at the HCM. To develop a self-administered questionnaire, the participants were required to describe the factors they believed were necessary for experiential quality at this cultural heritage site in Macau after the focus group interviews were conducted. After the focus group interviews were completed, the researchers identified two subdimensions of physical environment quality (environment and location) and one subdimension of outcome quality (venue) that were not identified in the literature review (see the sections Physical Environment Quality and Outcome Quality). Factors identified in the focus groups were combined with a review of the relevant literature to identify variables, assist in item generation, and recommend the dimensionality of experiential quality at the cultural heritage site. This process resulted in an initial pool of 41 items of experiential quality.
The second stage consisted of self-administered questionnaires conducted to verify the dimensions of experiential quality for cultural heritage sites (based on the Stage 1 findings), the variation of perceived experiential quality over time, and the antecedents and consequences of experiential quality for cultural heritage sites. In this study, the self-administered questionnaire included six sections. The first four sections included the items of interaction quality, physical environment quality, outcome quality, and access quality. The items were grouped in accordance with each of the primary dimensions, as perceived by the focus group participants. The fifth section included the questions on experiential quality, perceived value, heritage image, experiential satisfaction, and behavioral intentions. The final section focused on demographic information, such as gender, marital status, age, and so on. The questionnaire was reviewed for content validity by senior services marketing and research methodology academics, and managers and service providers for cultural heritage sites. Minor wording changes were suggested and the action to be taken. The original questionnaire was written in English, translated into Chinese, and then back-translated to ensure accuracy. All surveyors spoke both English and Mandarin with most also speaking Cantonese.
Several studies (Brady & Cronin, 2001; Chen & Chen, 2010; Dabholkar et al., 1996; Kao et al., 2008) indicate that a multidimensional and hierarchical model of experiential quality as a framework should be measured based on tourists’ overall perception of the visiting experience rather than the gap between tourists’ perceptions of performance and their performance expectations. Therefore, respondents were required to evaluate their overall visiting experiences at the cultural heritage sites in Macau (Brady & Cronin, 2001; Frochot & Hughes, 2000). As the questionnaire was developed specifically for this study, a pretest was conducted with 50 participants who had actually visited the HCM in the past 12 months. A period of 12 months was chosen to provide a common time frame as well as to limit the time frame within the recall ability of most respondents, as suggested by Singh (1990). During the pretest procedure, respondents were encouraged to comment on any questions that they thought were unclear or ambiguous or that they were unable to answer. Some minor grammatical changes were made to the questionnaire following the pretest process. Subsequently, a 5-point Likert-type scale (1 = strongly disagree, 5 = strongly agree) was used in the revised questionnaire. The revised questionnaires were given to the tourists at the HCM. The next section provides a brief description of the HCM.
The HCM
Macau, a lucrative port of strategic importance in the development of international trade, was under Portuguese administration from the mid-16th century until 1999, when it came under Chinese sovereignty. Today Macau is famous not only for its gaming industry but also for its world cultural heritage: the HCM (Io, 2011). Since the inscription of the HCM on the World Heritage list in 2005, the Macau SAR government has been promoting Macau as a destination for heritage tourism (Dewar, du Cros, & Li, 2012; Io & Hallo, 2011). According to Macau Government Tourist Office (2007), the HCM encompasses 22 monuments and eight squares (or piazzas). In addition, the HCM represents the architectural legacies of the city’s cultural heritage sites, including monuments such as urban squares, streetscapes, churches, and temples (Dewar et al., 2012).
The potential of developing the HCM as a popular tourist attraction site exists, according to another previous study examining the attractiveness of the HCM from tourists’ perspectives (Cheng & Wan, 2008). In addition, Cheng and Wan (2008) find that tourists appreciate and have some interest in a lot of cultural heritage sites (at the Center), though some weaknesses of these sites need to be improved. In 2001, the number of tourists to Macau reached 10 million for the first time in culture and it increased to 22.93 million in 2008, half of whom came from Mainland China (Chen & Fu, 2013). Based on the aforementioned statements, the data collection in this study was conducted at the HCM to increase response rates.
Sample and Data Collection
Due to limited time and manpower, data were collected using a convenience sample of tourists, older than 18 years, who actually visited the HCM between April 1, 2013, and June 1, 2013. The students from Macau University of Science and Technology were recruited and then trained to randomly approach respondents, informing about the purpose of the survey in advance before they were given the questionnaire. Therefore, the tourists who actually completed their visitation at the HCM were asked their willingness to participate in the questionnaire survey. The reason for choosing the HCM for sample collection is that the number of tourists is large and it is suitable for measuring the tourist’s perception of experiential quality, value, image, experiential satisfaction, behavioral intentions, and the dimensions of experiential quality at this cultural heritage site, as suggested by several studies (Cultural Affairs Bureau, 2013; Dewar et al., 2012).
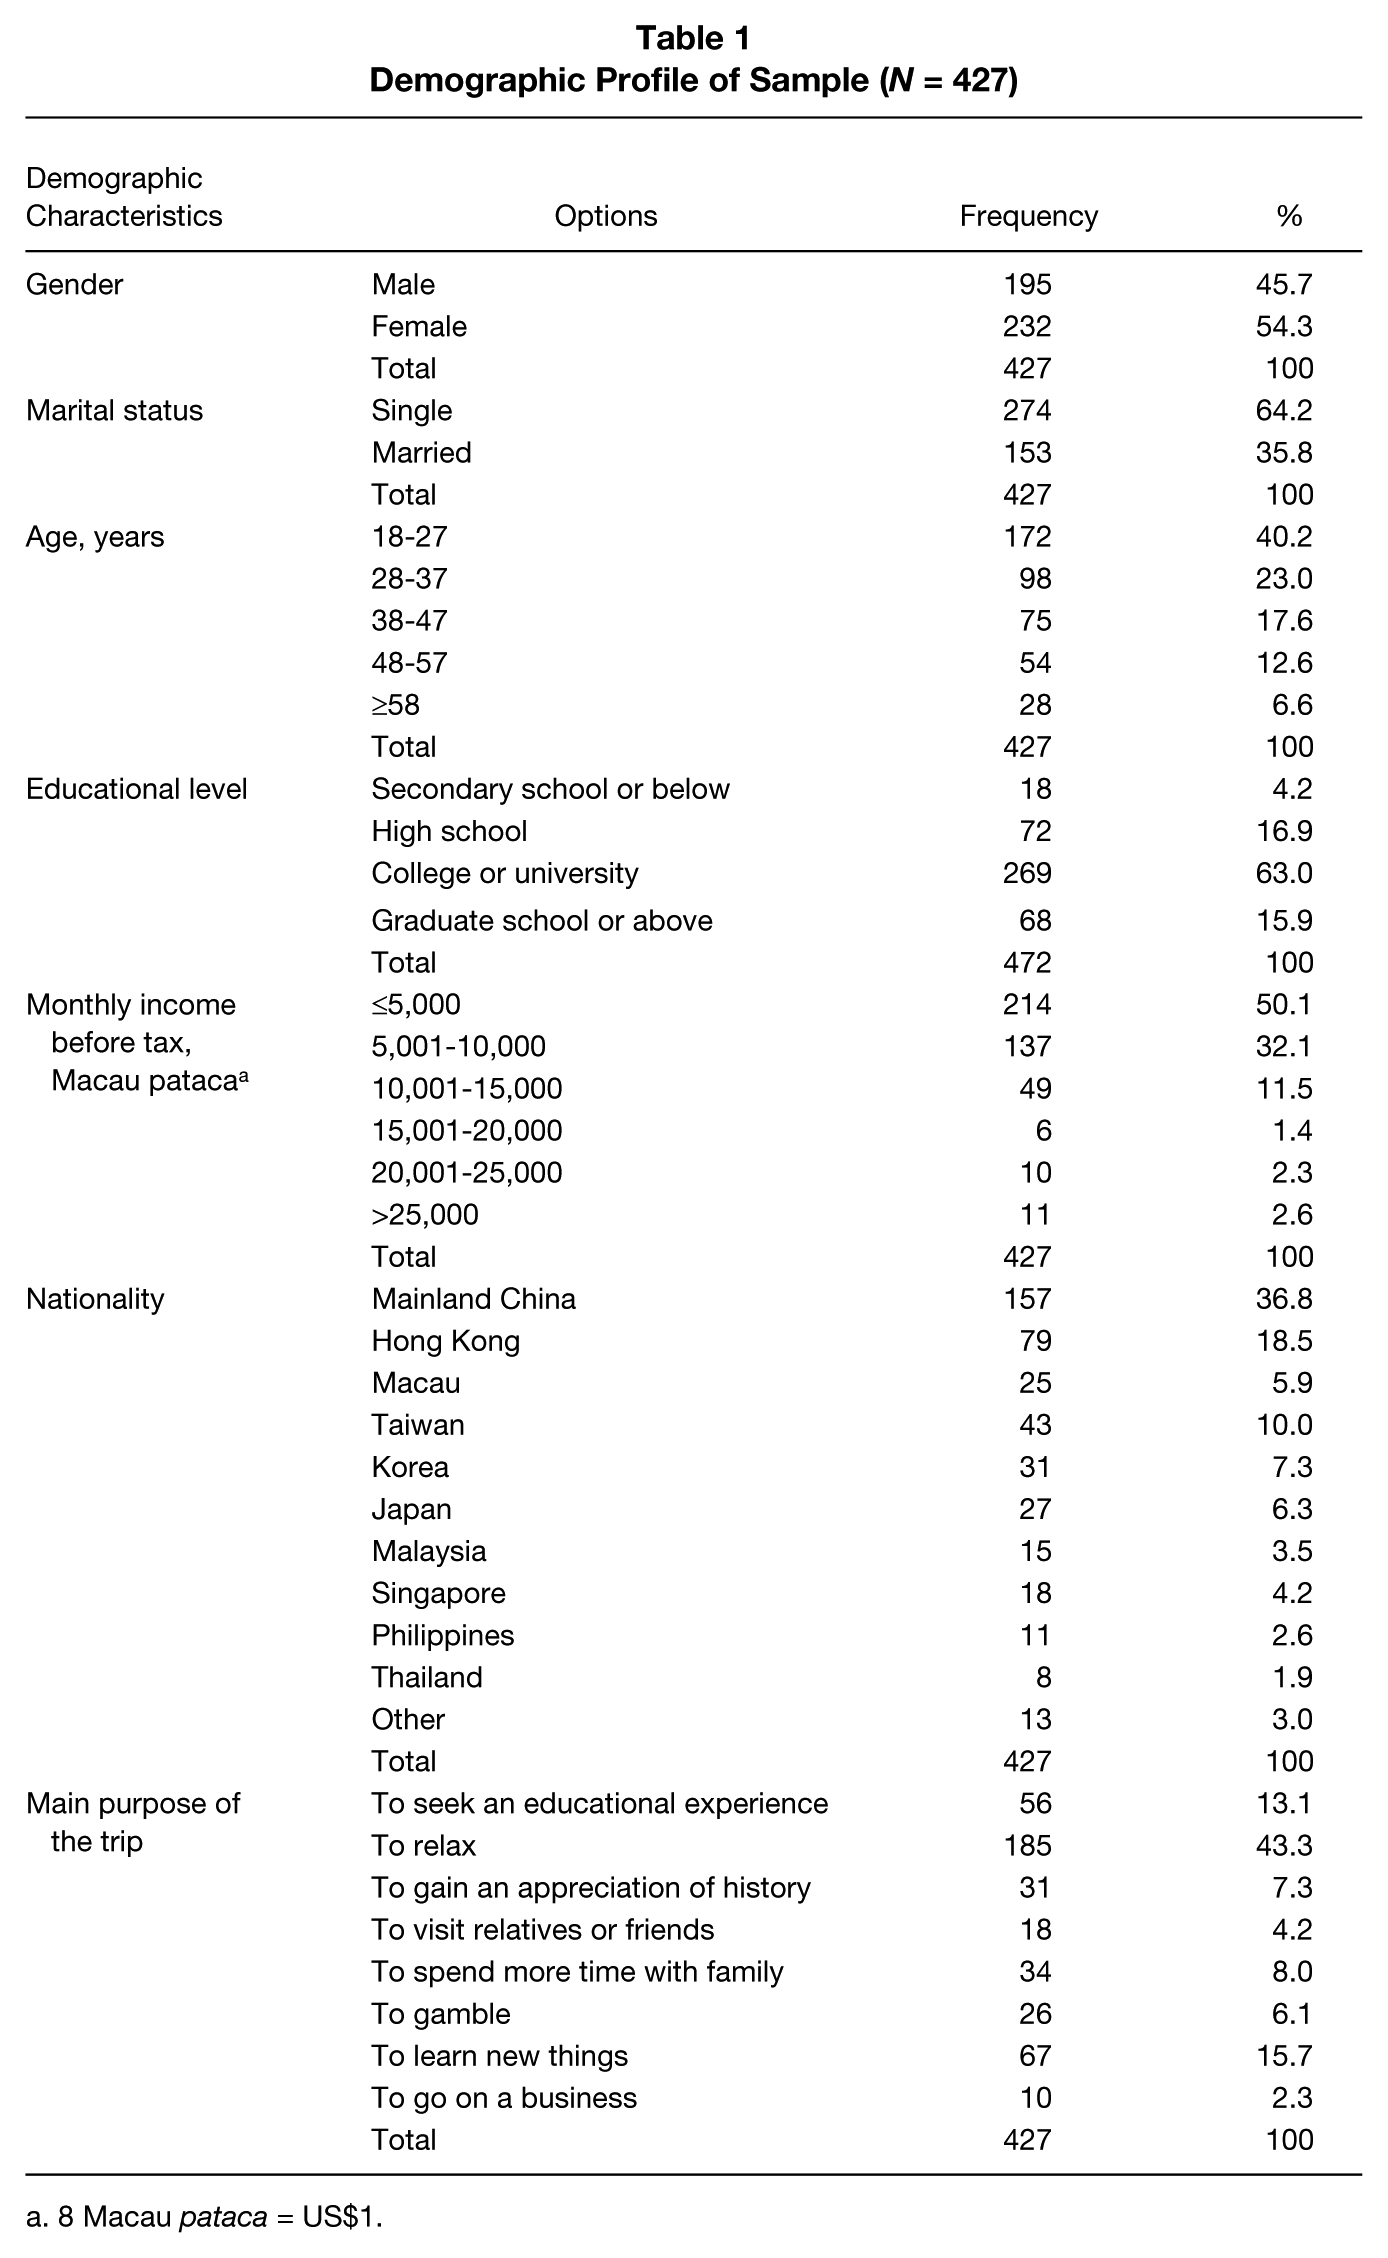
Out of 580 questionnaires distributed, 450 (77.6%) were retuned; 23 incomplete returned were discarded. The total usable sample of 427 represents an overall response rate of 94.9%. The usable responses were above the minimum sample size of 345, as suggested by Hair et al. (2006). The descriptive statistics of the sample are summarized in Table 1. There were 195 (45.7%) males and 232 (54.3%) females. Most of the respondents (81.3%) were single and between 18 and 27 years (40.2%) old. A total of 63.0% of respondents had obtained a college or university degree. As for the respondents’ occupation and nationality, most of them worked as office or administrative workers (31.2%) and came from Mainland China (36.8%). In terms of the monthly income before tax, the largest group was below MOP5,000 and less (MOP = Macau pataca; roughly US$625 and less; 50.1%). The main purpose of the trip for majority of the respondents was to relax (43.3%).
Demographic Profile of Sample (N = 427)
8 Macau pataca = US$1.
Findings
Following the recommendations of Armstrong and Overton (1977), nonresponse bias was assessed. In this study, 214 responses were received during the period April 1 to May 1, 2013, and the last 213 questionnaires were received during the period of May 2 to June 1, 2013. The underlying assumption is that later respondents are in some way more like nonrespondents. No statistically significant differences (p > .10 in all cases) exist between the two groups on the means for experiential quality, perceived value, heritage image, experiential satisfaction, behavioral intentions, and primary dimensions and subdimensions of experiential quality. These results recommend that nonresponse bias is not an issue in this study.
To validate the consistency of the item and factor structure results, the sample was randomly split into two equal groups (Aaker, Kumar, & Day, 2007). Initially, an examination was made of the equality of the means of the two groups for all experiential quality items. Independent sample t tests revealed that there were no significant mean differences across the two randomized groups (p > .05 in all cases). Confirmatory analyses and tests of factorial invariance were then conducted to examine the factorial stability of the data (Madrigal, 2006). First, a test of configural invariance was conducted. This test invariance investigates whether there is the same pattern of fixed and free elements across the two groups. In this test, the same pattern of factor loadings is specified for each group. Second, a test of metric invariance was conducted. This is a test of a strong factorial invariance null hypothesis that factor loadings for like items are invariant across the groups. These two tests establish whether there is a conceptual equivalence of measures and equivalent calibration of measures to constructs across the groups (Vandenberg & Lance, 2000). The factor structure for the confirmatory tests was derived from an EFA with the varimax orthogonal rotation method (Dagger, Sweeney, & Johnson, 2007). This was applied to the 41 individual item responses perceived by focus group participants to represent the subdimensions of experiential quality, as suggested by several studies (Brady & Cronin, 2001; Chen, Lee, & Lin, 2012; Clemes et al., 2009, Clemes, Brush, & Collins, 2011; Clemes, Gan, & Ren, 2011; Dabholkar et al., 1996). The data set was randomly divided into two subsamples of equal size: Sample 1 and Sample 2. The data in Sample 1 were used and then analyzed using an EFA. The examination of the scree plot and latent root criterion and the researcher’s interpretation of the factor solution indicate that 10 dimensions should be extracted. A thorough analysis of the substantive meanings of the factors and corresponding items was performed to purify the uncovered factors. Items loading highly on each factor were examined carefully so that only those with consistent meanings and a high loading on a single factor were retained for measuring the factors. After the orthogonal rotation was conducted, 3 items whose factor loadings were less than .50 were removed from an EFA. According to Hair et al. (2006), factor loadings of .50 have been generally considered necessary for practical significance. These 3 excluded items often refer to variables that may not play an important or significant role in the evaluations of experiential quality. These items included the service provider’s individual attention, watching families to have fun together, and a large variety of goods available at the shop of cultural heritage sites. A revised EFA was conducted on the remaining 38 items. The 10 retained factors had eigenvalues greater than 1, as suggested by Kaiser (1960). In addition, these factors explained a cumulative total of 61.23% of the variance in the data, as suggested by several studies (Ford, MacCallum, & Tait, 1986; Nunnally, 1978), indicating that a cumulative percentage of variance explained being greater than 50% is the criterion used in determining the number of factors. After an EFA was conducted, the subdimensions were identified and renamed: (a) service providers’ ability (6 items), (b) service providers’ conduct (4 items), (c) service providers’ professionalism (2 items), (d) tangibles (6 items), (e) facility (2 items), (f) location (3 items), (g) pleasant visit (5 items), (h) social factors (4 items), (i) convenience (3 items), and (j) information (3 items). All factor loadings for the retained items were above .50 (see Table 2).
Factor Loadings, Eigenvalues, Percentage of Explained Variance, and Cumulative Percentage of Explained Variance of Scaled Items for Subdimensions of Experiential Quality
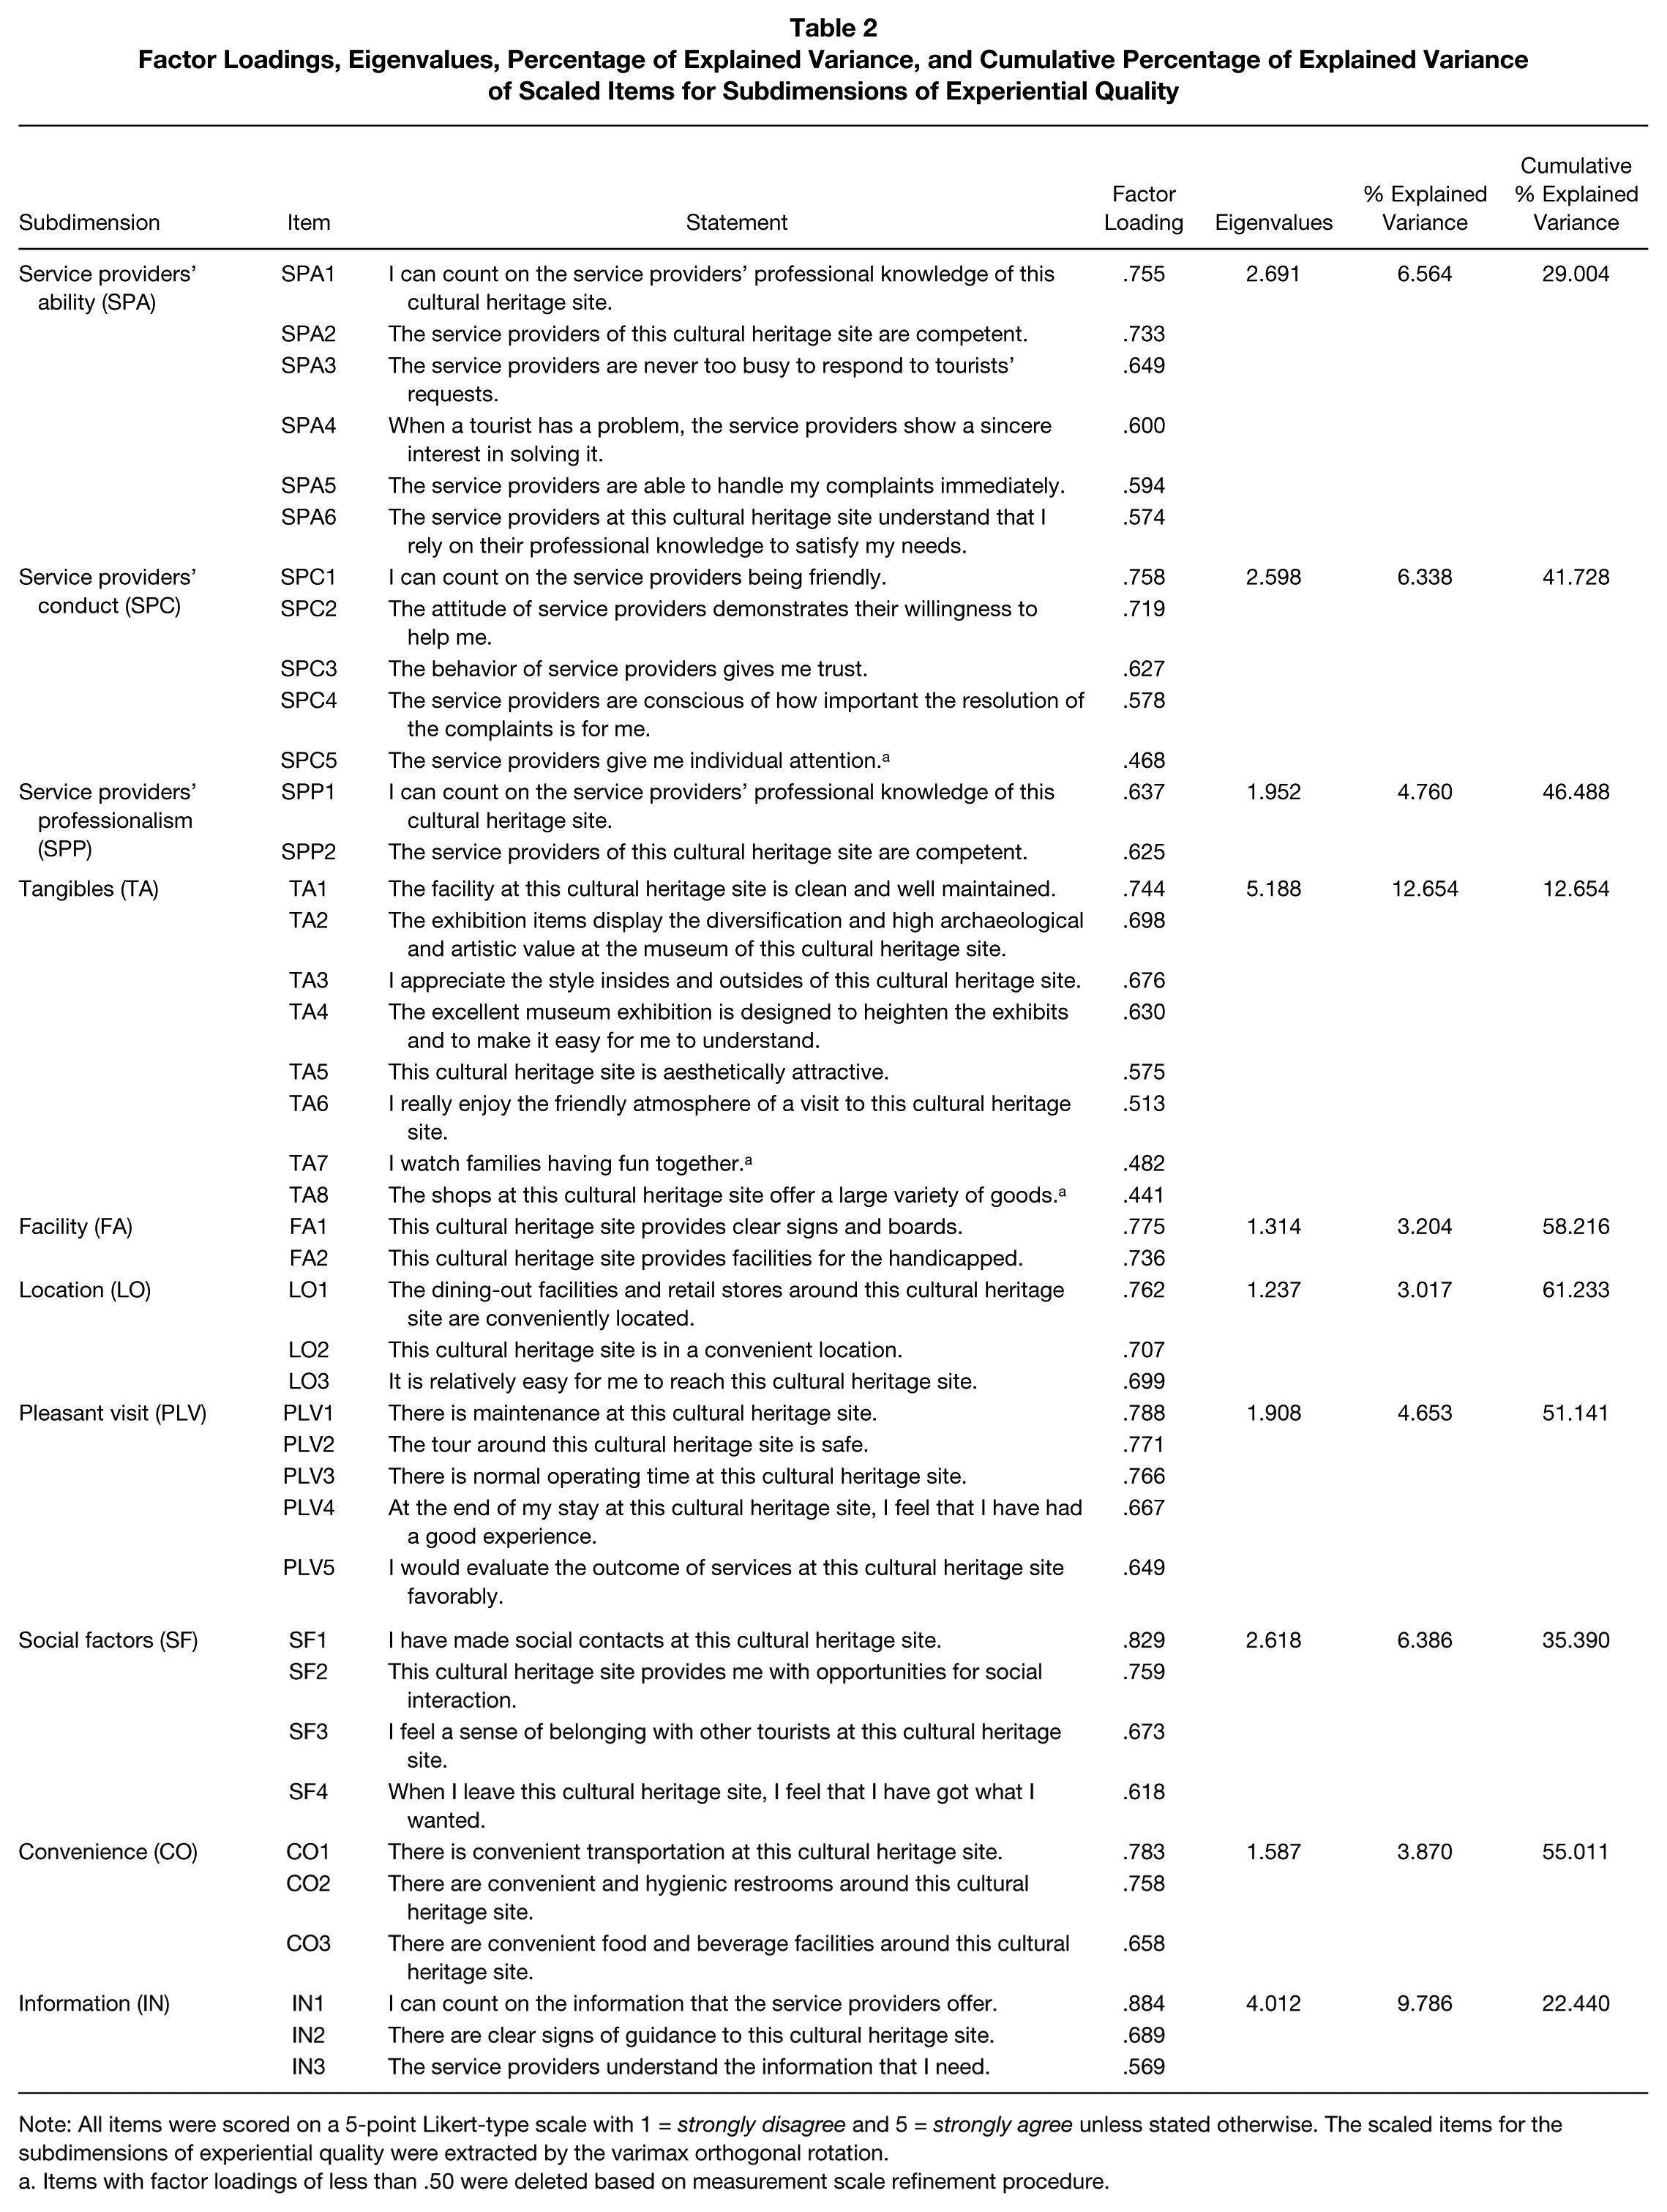
Note: All items were scored on a 5-point Likert-type scale with 1 = strongly disagree and 5 = strongly agree unless stated otherwise. The scaled items for the subdimensions of experiential quality were extracted by the varimax orthogonal rotation.
Items with factor loadings of less than .50 were deleted based on measurement scale refinement procedure.
On the basis of the tests for configural and metric invariance, the results indicated that the subdimensional model of experiential quality was equivalent across the two random sample groups. This provided confidence in the consistency of the study results. Given model equivalence and the need for a large sample size to examine the research model, the full data set was used in subsequent analyses. Confirmatory factor analysis (CFA) was used to test the validity by applying the SEM analysis through the analysis of moment structure (AMOS) 7.0. CFA is often the analytic tool of choice for developing and refining measurement instruments, assessing construct reliability and validity, identifying method effects, and evaluating factor invariance across time and groups (Brown, 2006). The data in Sample 2 were used and then analyzed using CFA. The results of the CFA (i.e., measurement model) are presented in Table 3 Cronbach’s coefficient alpha estimates for the 10 subdimensions of experiential quality ranged between .65 and .88, exceeding the minimum value of .60, as suggested by Churchill (1979). This study then applied the standardized factor loadings and average variance extracted (AVE) of each construct to verify the convergent validity. For each construct, the standardized factor loading was above the threshold of .50 and the AVE estimate was higher than the threshold of .50, as suggested by several studies (Bagozzi & Yi, 1989; Fornell & Larcker, 1981). The composite reliability (CR) for each construct is used to verify the convergent reliability. The CR was greater than the recommended value of .60, as suggested by Fornell and Larcker (1981). These results revealed that the instrument had good convergent validity. Likewise, the interconstruct correlations were consistent, indicating that the nomological validity was present. Therefore, the results of CRs, AVEs, construct correlations, and descriptive statistics are presented in Table 3. As Cronbach’s alpha is one of the most widely used metrics for reliability evaluation, it is also provided in Table 3. The data of this study indicated the strong evidence of construct validity and reliability for the scales of experiential quality, perceived value, heritage image, experiential satisfaction, behavioral intention, and a set of primary dimensions and subdimensions of experiential quality.
Descriptive Statistics and Correlation Matrix of Latent Variables

Note: SPA = service providers’ ability; SPC = service providers’ conduct; SPP = service providers’ professionalism; TA = tangibles; FA = facility; LO = location; PLV = pleasant visit; SO = sociability; CO = convenience; IN = information; IQ = interaction quality; PEQ = physical environment quality; OQ = outcome quality; AQ = access quality; EQ = experiential quality; PV = perceived value; ES = experiential satisfaction; HI = heritage image; BI = behavioral intentions; CR = composite reliability; AVE = average variance extracted.
The overall fit measures suggest a satisfactory fit to the data for all five models, especially in view of the large sample size; interaction quality (χ2/degrees of freedom [df] = 1.781, p < .01; root mean square error of approximation [RMSEA] = 0.043; standardized root mean square residual [SRMR] = 0.019; Tucker–Lewis index [TLI] = 0.973; comparative fit index [CFI] = 0.980; goodness-of-fit index [GFI] = 0.972; normed fit index [NFI] = 0.962, adjusted goodness-of-fit index [AGFI] = 0.951), physical environment quality (χ2/df = 1.712, p < .01; RMSEA = 0.041; SRMR = 0.017; TLI = 0.982; CFI = 0.986; GFI = 0.972; NFI = 0.968, AGFI = 0.955), outcome quality (χ2/df = 2.034, p < .01; RMSEA = 0.049; SRMR = 0.027; TLI = 0.973; CFI = 0.980; GFI = 0.972; NFI = 0.962, AGFI = 0.951), access quality (χ2/df = 1.966, p < .01; RMSEA = 0.048; SRMR = 0.031; TLI = 0.974; CFI = 0.984; GFI = 0.976; NFI = 0.959, AGFI = 0.949), and experiential quality evaluation (χ2/df = 2.212, p < .01; RMSEA = 0.053; SRMR = 0.023; TLI = 0.967; CFI = 0.981; GFI = 0.978; NFI = 0.967, AGFI = 0.952). All factor loadings are statistically significant (p < .01). Parameter estimates range from 13 to 27 times as large as their standard errors. The parameter estimates are significant, lie within the range of permissible values, and the associated standard errors are of reasonable size. These results add additional support for the measurement model.
The overall fit measures of the structural model suggest that the hypothesized model provides an acceptable fit to the data. The chi-square difference test is used to examine the model difference between two groups. The result indicates that there is no model difference between two groups (χ2/df = 1.89, p < .01). The fit statistics (RMSEA = 0.05, SRMR = 0.04, TLI = 0.96, CFI = 0.97, GFI = 0.94, NFI = 0.93, AGFI = 0.92) suggest a satisfactory fit in light of the extremely high statistical power of the model and the consequent need to accept a more relaxed interpretation of fit than is typical, as proposed by McQuitty (2004). The large sample size and the number of parameters estimated contribute to a strong downward bias of the descriptive fit statistics.
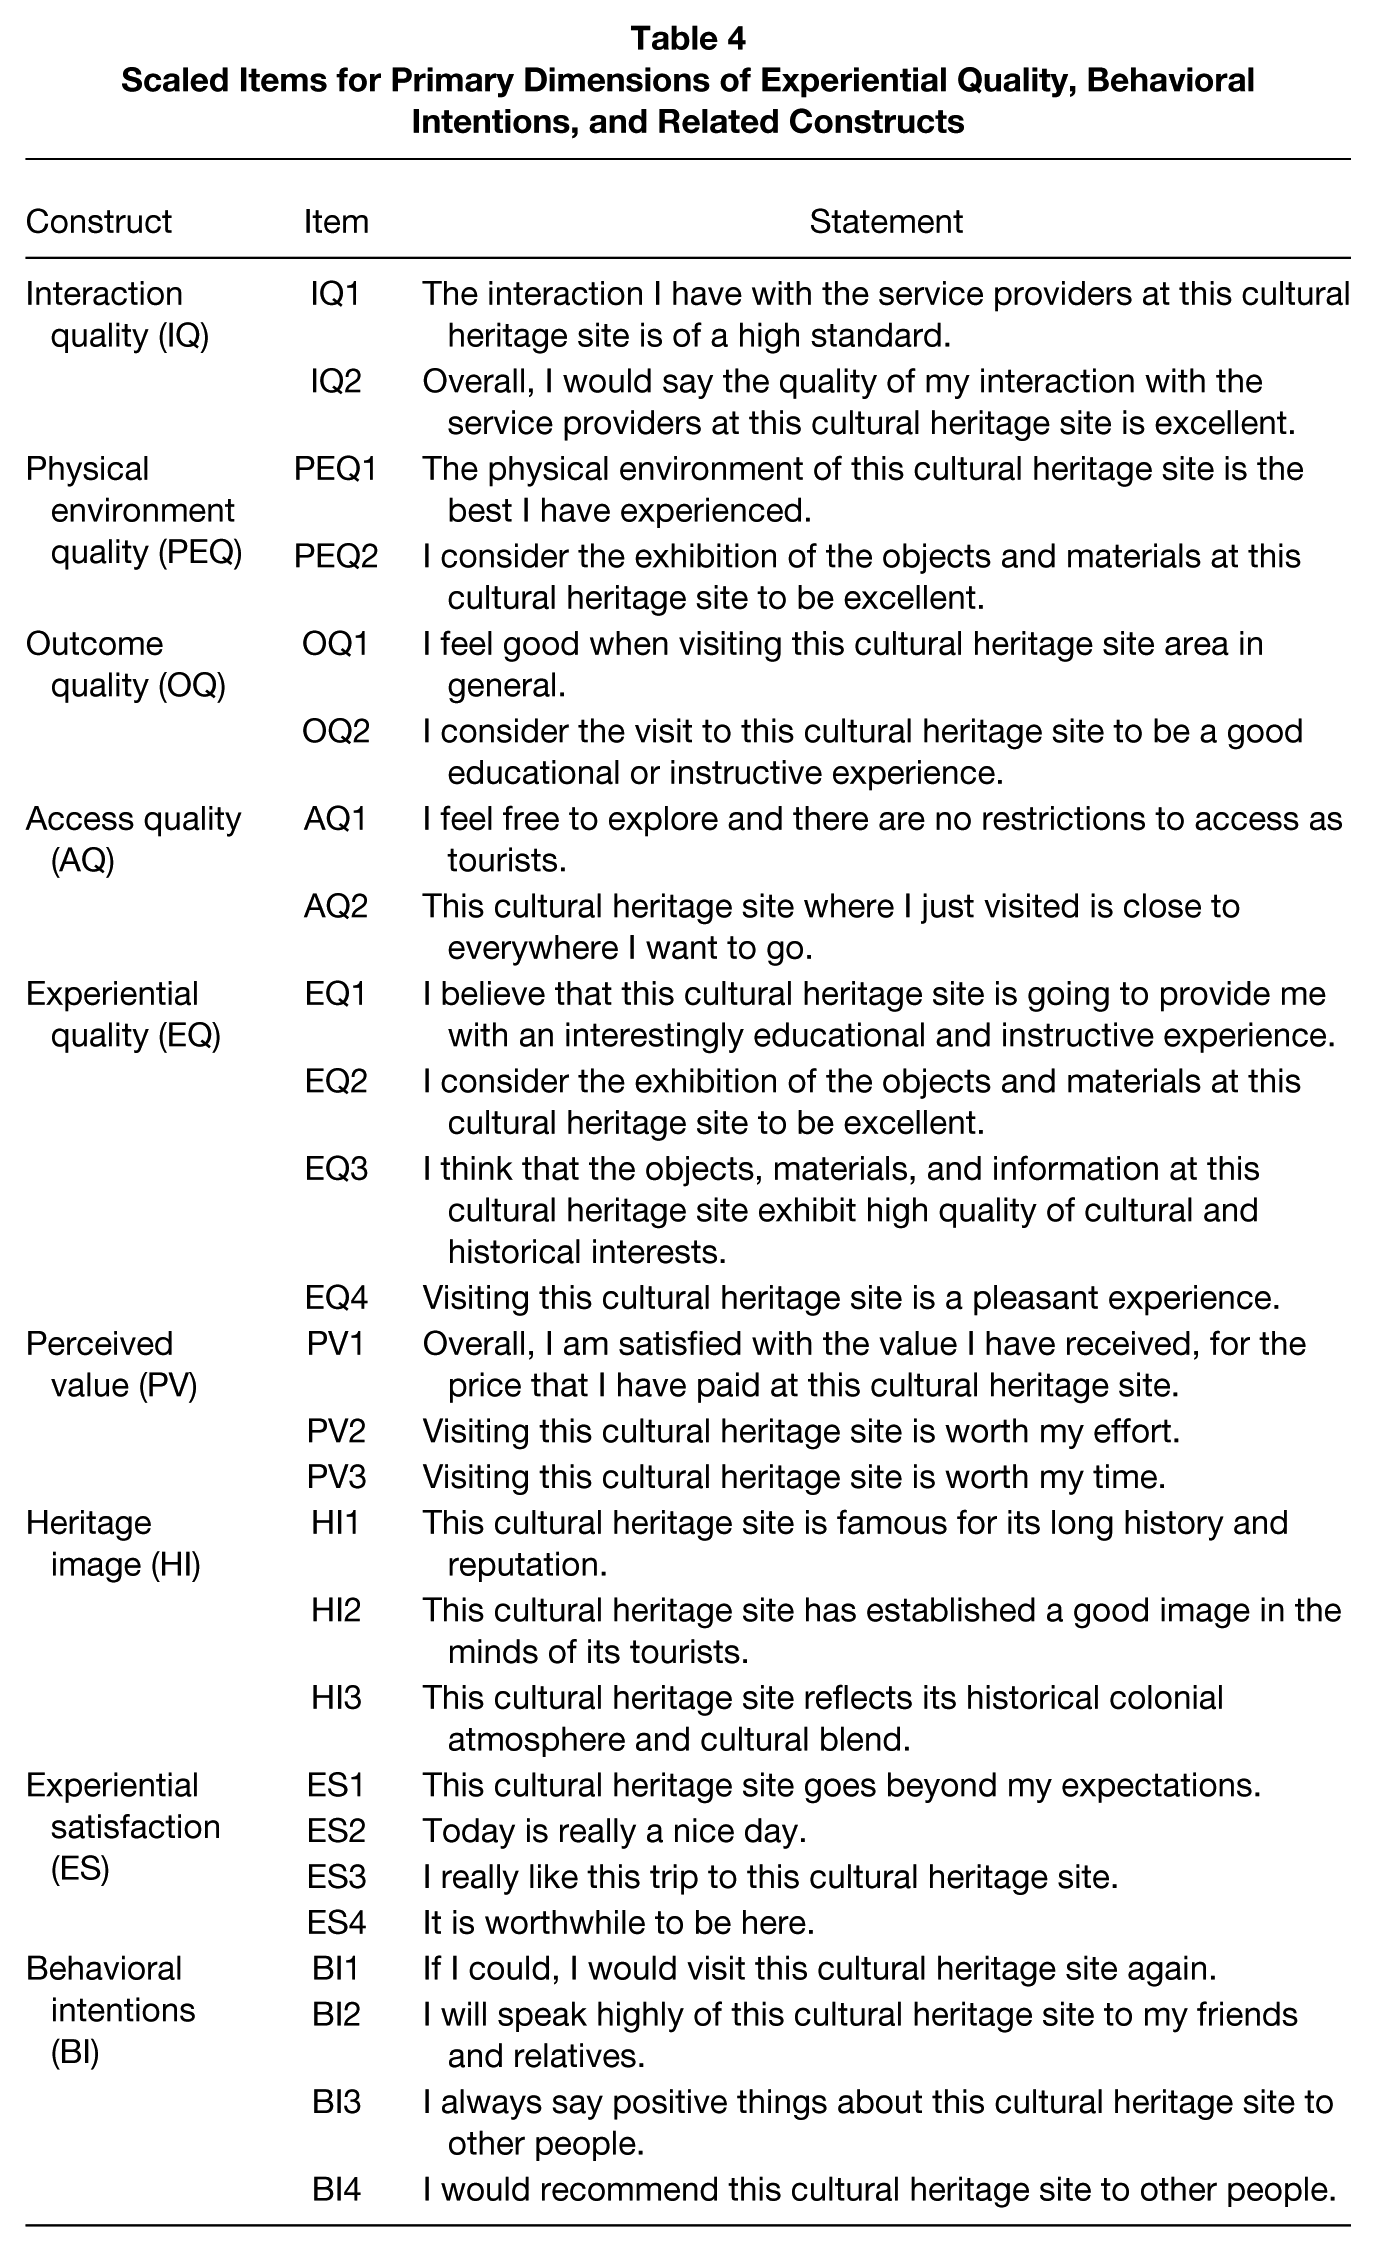
To assess tourists’ perceptions of the four primary dimensions and extracted 10 subdimensions of experiential quality, the measurement items to measure primary dimensions and subdimensions were adapted from several studies (Brady & Cronin, 2001; Caro & Garcia, 2007, 2008; Chen et al., 2011; Chen et al., 2012; Clemes et al., 2009; Dabholkar et al., 1996; Ko & Pastore, 2005; Shonk & Chelladurai, 2008; Wu et al., 2011; Wu & Hsu, 2012; see Table 2). The measurement items of experiential quality, perceived value, heritage image, experiential satisfaction, and behavioral intention constructs were adopted on the basis of several researchers’ results (Chen & Chen, 2010; Chen & Tsai, 2007; Clemes et al., 2009; de Rojas & Camarero, 2008; Kao et al., 2008; Rindell, 2013; Wu, 2013; Zins, 2002; see Table 4). The full questionnaire can be obtained on request.
Scaled Items for Primary Dimensions of Experiential Quality, Behavioral Intentions, and Related Constructs
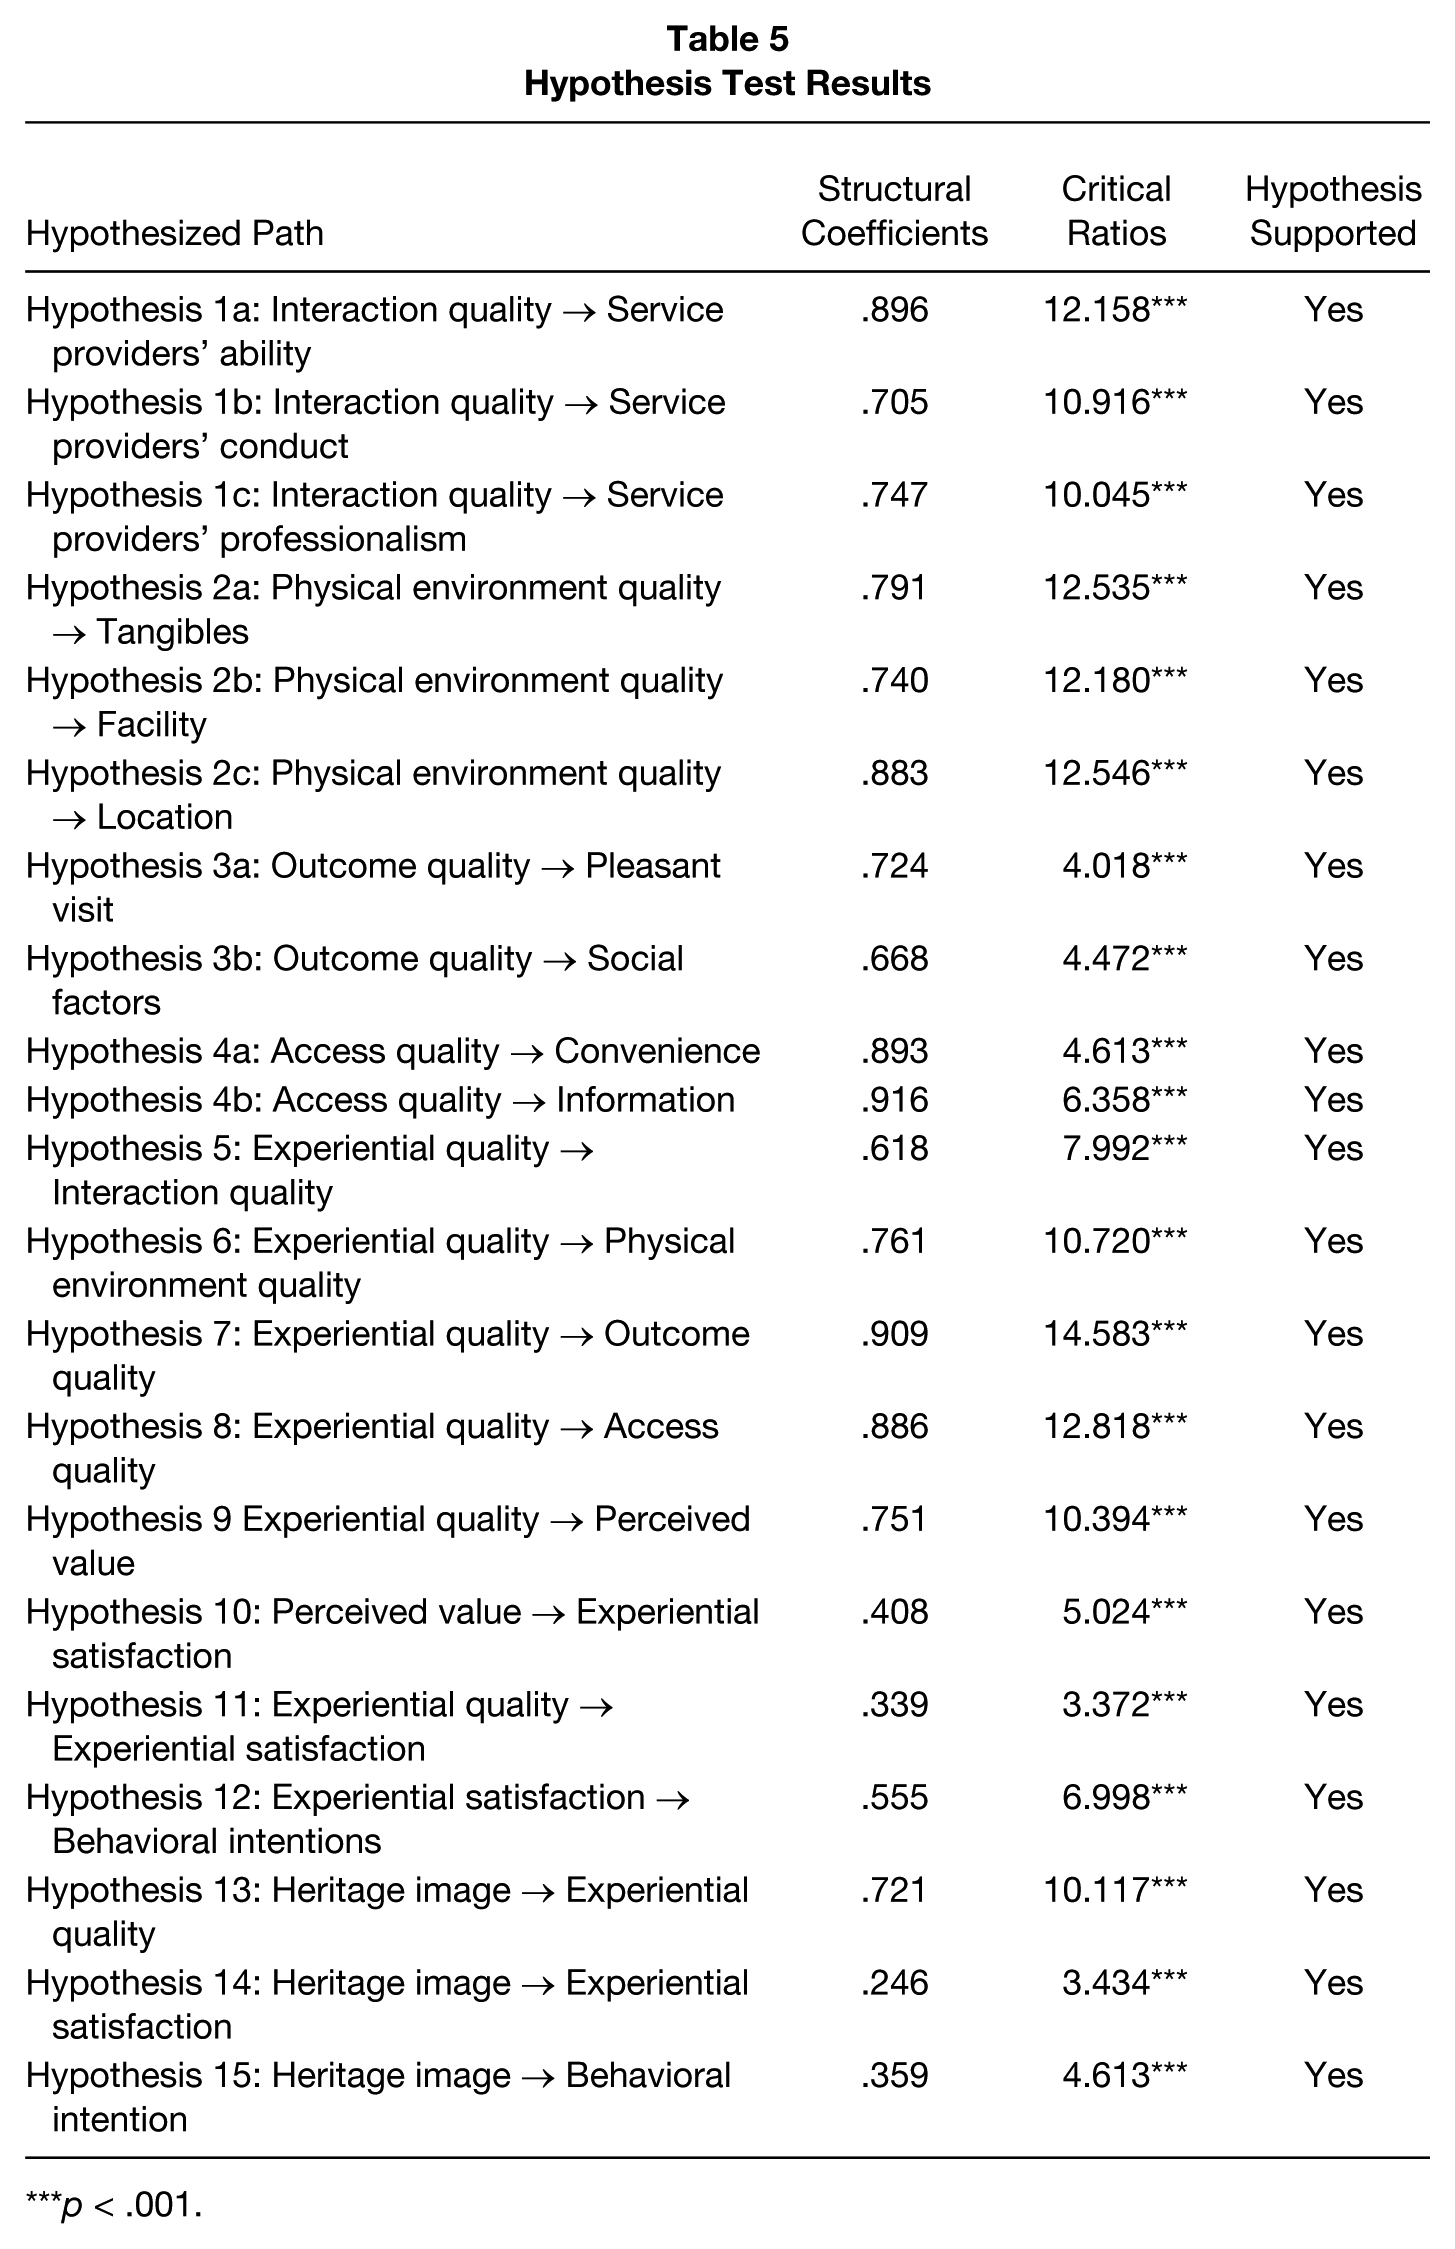
To test the hypotheses in the conceptual research model (see Figure 1), this study applies SEM through AMOS 7.0. Therefore, the results of the hypothesis tests are given in Table 5. All 15 hypotheses are fully supported.
Hypothesis Test Results
p < .001.
Hypothesis 1 proposes that there is a positive relationship between the subdimensions of interaction quality (service providers’ ability, service providers’ conduct, and service providers’ professionalism) and interaction quality. The results fully support this hypothesis. Service providers’ ability (b = 0.90, p < .001), service providers’ conduct (b = 0.71, p < .001), and service providers’ professionalism (b = 0.75, p < .001) are all positively and significantly related to interaction quality. Interaction quality explains 81.0%, 50.4%, and 56.3% of the variation in service providers’ ability, service providers’ conduct, and service providers’ professionalism, respectively.
Hypothesis 2 assumes that there is a positive relationship between the subdimensions of physical environment quality (tangibles, facility and location) and physical environment quality. Therefore, this hypothesis is fully supported by the results. Tangibles (b = 0.79, p < .001), facility (b = 0.74, p < .001) and location (b = 0.88, p < .001) are all positively and significantly related to physical environment quality. Physical environment quality explains 62.4%, 77.4%, and 54.8% of the variation in tangibles, facility, and location, respectively.
Hypothesis 3 predicts that there is a positive relationship between the subdimensions of outcome quality (pleasant visit and social factors) and outcome quality. The results fully support this hypothesis. Pleasant visit (b = 0.72, p < .001) and social factors (b = 0.67, p < .001) are all positively and significantly related to outcome quality. Outcome quality explains 51.8% and 44.9% of the variation in pleasant visit and social factors, respectively.
Hypothesis 4 proposes that there is a positive relationship between the subdimensions of access quality (convenience and information) and access quality. The results fully support this hypothesis. Convenience (b = 0.89, p < .001) and information (b = 0.92, p < .001) are all positively and significantly related to access quality. Access quality explains 79.2% and 84.6% of the variation in convenience and information, respectively.
Hypotheses 5 to 8 propose that there is a positive relationship between the primary dimensions of experiential quality (interaction quality, physical environment quality, outcome quality, and access quality) and experiential quality. The results provide full support for all four hypotheses. Tourists’ overall perceptions of experiential quality are all positively and significantly related to interaction quality (b = 0.62, p < .001), physical environment quality (b = 0.76, p < .001), outcome quality (b = 0.91, p < .001) and access quality (b = 0.89, p < .001). Experiential quality explains 38.4%, 57.8%, 82.8%, and 79.2% of the variation in interaction quality, physical environment quality, outcome quality, and access quality, respectively.
Hypothesis 9 tests that experiential quality positively influences perceived value. This hypothesis is fully supported by the result. The relationship is statistically significant (b = 0.75, p < .001), as experiential quality explains 31.8% of the variance in perceived value.
Hypotheses 10, 11, and 14 examine the effects of perceived value, experiential quality and heritage image on experiential satisfaction. The results fully support three hypotheses. Perceived value (b = 0.41, p < .001), experiential quality (b = 0.34, p < .001) and heritage image (b = 0.25, p < .001) are significant predictors of experiential satisfaction. These three variables explain 60.7% of the variance in experiential satisfaction.
Hypothesis 13 examines heritage image positively influences experiential quality. The result fully supports this hypothesis. The relationship is statistically significant (b = 0.72, p < .001), as heritage image explain 51.8% of the variation in experiential quality.
Hypotheses 12 and 15 test the effects of experiential satisfaction and heritage image on behavioral intentions. Both of hypotheses are fully supported by the results. Experiential satisfaction (b = 0.56, p < .001) and heritage image (b = 0.36, p < .001) positive affect behavioral intentions. These two variables explain 52.0% of the variance in behavioral intentions.
Each path estimate based on the interrelationships among experiential quality, perceived value, heritage image, experiential satisfaction, behavioral intentions, and primary dimensions and subdimensions of experiential quality in the conceptual research model was subsequently tested using CFA to prove SEM built in Figure 2.
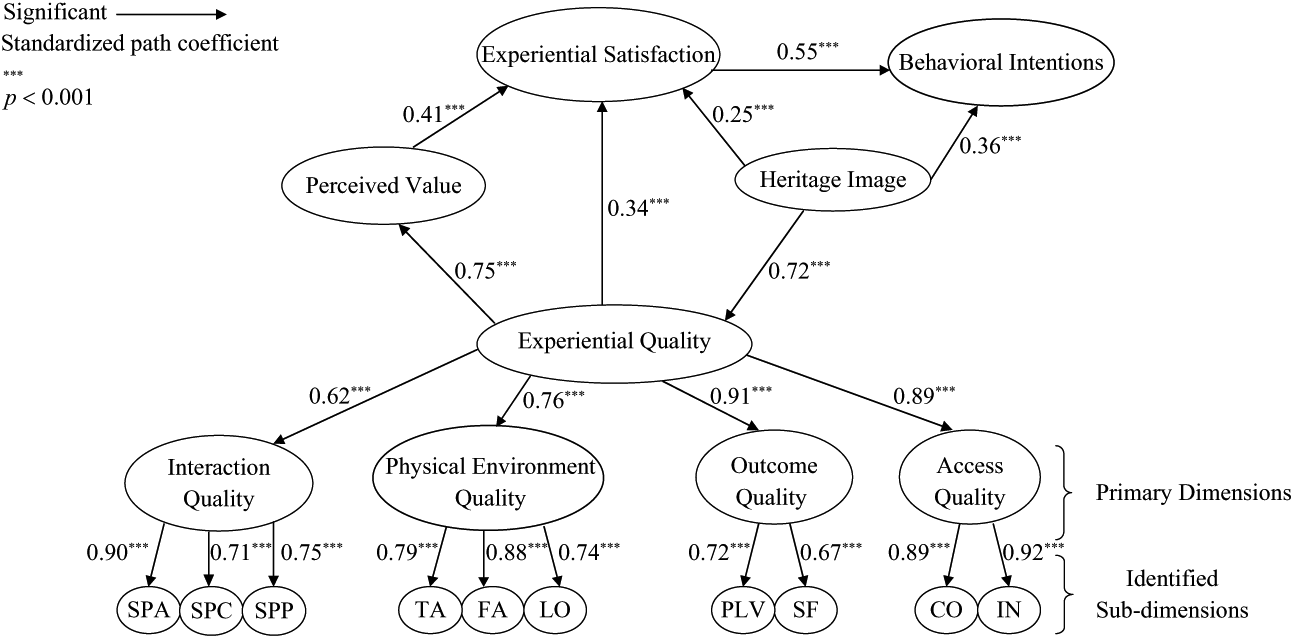
A Path Model
Discussion
The results for Hypotheses 1 through 8 provide support for a multidimensional and hierarchical dimensional structure of experiential quality (Brady & Cronin, 2001; Dabholkar et al., 1996; Li & Wu, 2013), as perceived by heritage tourists. The results for Hypotheses 1 through 4 support the presence of 10 subdimensions of experiential, as perceived by heritage tourists. The results for Hypotheses 5 through 8 substantiate the presence of four primary dimensions of experiential quality: interaction quality, physical environment quality, outcome quality, and access quality in a heritage context.
The results of the EFA reduced the 13 subdimensions originally proposed to 10 subdimensions using a multidimensional and hierarchical approach. The 10 subdimensions include service providers’ ability, service providers’ conduct, service providers’ professionalism, tangibles, facility, location, pleasant visit, social factors, convenience, and information. Some of the subdimensions are different in content from the subdimensions identified for the higher education sector (Clemes, Cohen, & Wang, 2013; Clemes et al., 2007), the health care industry (Dagger et al., 2007), the life insurance industry (Mittal, Gera, & Singhvi, 2013), the recreational sports industry (Ko & Pastore, 2005), the accommodation industry (Clemes et al., 2009, Clemes et al., 2011; Wu & Ko, 2013), the travel and tourism industry (Caro & Garcia, 2008; Shonk & Chelladurai, 2008), the transport industry (Caro & Garcia, 2007; Wu & Cheng, 2013), the gaming industry (Wu & Hsu, 2012), the quick-service restaurant industry (Wu, 2013), the exhibition industry (Gottlieb, Brown, & Drennan, 2011), the telecommunication industry (Clemes et al., 2014; Fassnacht & Koese, 2006; Lu et al., 2009), and four service industries (fast-food, photograph developing, amusement parks, and dry cleaning; Brady & Cronin, 2001). This finding supports the contentions of earlier studies (Chen & Chen, 2010; Kao et al., 2008) that have identified different dimensional structures across tourism industries.
The 10 subdimensions factored in this study for cultural heritage sites are similar in content to the dimensions identified by other studies that have focused on the tourism industry (Caro & Garcia, 2008; Chen & Tsai, 2007; de Rojas & Camarero, 2008; Narayan et al., 2009). However, the 10 subdimensions also differ in content and number from those for tourism studies undertaken in Macau (Cheng & Wan, 2012; Humborstad, Cheng, & Ng, 2008; Wan & Cheng, 2011). This study focuses on tourists’ perceptions rather than on local residents’ or group visitors’ perceptions. Therefore, tourists’ perceptions of the attributes of experiential quality may be different from local residents’ or group visitors’ perceptions in Macau. The different subdimensional-factor structure identified in this study for cultural heritage sites supports the view that the dimensionality of the experiential quality construct is dependent on the tourist experience. These results also support the claims that industry- and cultural-specific measures of quality need to be developed to identify different dimensional structures (Brady & Cronin, 2001; Cheng & Wan, 2008, 2012; Wan & Chan, 2013; Wan & Cheng, 2011).
The primary dimension, outcome quality, is perceived as the most important primary dimension, followed by access quality, physical environment quality, and interaction quality. This finding suggests that heritage tourists perceive outcome quality as the most important dimension of experiential quality. This finding supports the contentions of earlier studies (Clemes et al., 2009; Powpaka, 1996; Wu & Cheng, 2013) that outcome quality is perceived as the most important dimension when people provide their overall assessment of quality. Access quality is identified as the second most important dimension of experiential quality perceived by heritage tourists. These results are consistent with the contentions of several studies (Li & Wu, 2013; Parasuraman, Zeithaml, & Berry, 1985; Wu, Wong, & Cheng, 2013) that access quality has been considered to be one of the important attributes of experiential quality. Physical environment quality is confirmed to be the third most important dimension of experiential quality perceived by heritage tourists. This finding supports de Rojas and Camarero’s (2008) study, indicating that physical environment quality has been considered to be a major contact arena for tourists and service providers in a cultural heritage site. Interaction quality is perceived as the least important dimension of experiential quality; however, it has an impact on experiential quality. In this study, a majority of tourists who have visited the cultural heritage site are Asian people rather than Western people. This finding supports the contention of Hofstede, Hofstede, and Minkov (2010) that Asian cultures are collectivist whereas Western cultures are individualist. In addition, the results of this study agree with Donthu and Yoo’s (1998) study, demonstrating that collectivistic people do not expect service providers to respect and care about them and show empathy and attention compared with individualistic customers.
The hypothesized paths (Hypotheses 9-15) relating to experiential quality, perceived value, heritage image, experiential satisfaction, and behavioral intentions in the conceptual model are confirmed. These findings indicate that experiential quality, perceived value, and heritage image positively influence experiential satisfaction. Therefore, these findings are consistent with the contentions of earlier studies (Chen & Chen, 2010; Chen & Tsai, 2007; de Rojas & Camarero, 2008; Guliling et al., 2013; Kao et al., 2008) that experiential quality, perceived value and heritage image are supported as direct determinants of experiential satisfaction in the tourism industry. These results reveal that experiential quality positively influences perceived value. These findings agree with the contentions of earlier studies (Chen & Chen, 2010; Smith, Kyle, & Sutton, 2010; Yuan & Wu, 2008) that have identified experiential quality as an important indicator of perceived value in the tourism industry. Alternatively, these results indicate that heritage image has a positive influence on experiential quality. This finding concurs with several researchers (Chen & Chen, 2010; de Rojas & Camarero, 2008; Guliling et al., 2013; Li, 2013; Rindell, 2007, 2013), indicating that heritage image has been found to be an antecedent of experiential quality in a heritage context. Finally, these results indicate that both experiential satisfaction and heritage image are antecedents of behavioral intentions. This result is consistent with the findings of several studies (Baker & Crompton, 2000; Chen & Chen, 2010; Palau-Samell, Forgas-Coll, Sánchez-García, & Prats-Planagumà, 2013), indicating that experiential satisfaction is a predictor of behavioral intentions—that is, the higher the rate of a tourist’s experiential satisfaction, the higher the possibility to perform favorable behavioral intentions, such as recommending, saying positive things, and revisiting or returning to the same cultural heritage site. Alternatively, this result supports several studies (Mohamad, Abdullah, & Mokhlis, 2012; Ramkissoon, Uysal, & Brown, 2011; Rindell, 2007), indicating that heritage image is a salient factor influencing the behavioral intentions of heritage tourists.
The least and most important experiential quality dimensions, as perceived by heritage tourists, are identified. Each of the subdimensions varies in terms of their importance to the four primary dimensions (see Figure 2). Outcome quality is composed of two significant subdimensions, namely, pleasant visit (b = 0.72) and social factors (b = 0.67). These findings are consistent with the contentions of earlier studies (Chen & Chen, 2010; Clemes et al., 2011; Wan & Cheng, 2011) that pleasant visit is perceived as an important factor by heritage tourists. In addition, these findings reveal that outcome quality has less impact on social factors than pleasant visit. The main reason is that Asian culture is more conservative than Western culture. In general, most Asian tourists are not accustomed to socializing with other tourists during their visits to cultural heritage sites (Clemes et al., 2009; Hofstede et al., 2010; Wan & Cheng, 2011).
Access quality comprises two significant subdimensions, information (b = 0.92) and convenience (b = 0.89). These findings are consistent with the contentions of several studies (Huh et al., 2006; Huh & Uysal, 2003; Wan & Cheng, 2011) that information has played a key role in influencing tourists to determine whether they will visit the cultural heritage site. In addition, these findings agree with several researchers (Chen et al., 2011, de Rojas & Camarero, 2008; Wu & Cheng, 2013), proposing that convenience is an important component of access quality perceived by heritage tourists. Physical environment quality consists of three significant subdimensions: location (b = 0.88), tangibles (b = 0.79), and facility (b = 0.74). This study identifies location as a significant subdimension. This result is consistent with the contention of Riley, Baker, and Doren (1998), supposing that a strong perception of the location may create unrealistic tourists’ expectations and issues of authenticity, to such an extent that tourists may subsequently feel disappointed when the cultural heritage site does not live up to the expectations. Moreover, this study identifies tangibles and facility as significant subdimensions of physical environment quality, supporting the findings of several researchers’ (Canny, 2013; Clemes et al., 2011; de Rojas & Camarero, 2008; Huh & Uysal, 2003) studies that tangibles and facility have been identified as important determinants of experiential quality perceived by heritage tourists.
Service provider’s ability (b = 0.90) is perceived as the most important subdimension of interaction quality, followed by service provider’s professionalism (b = 0.75) and service provider’s conduct (b = 0.71). These findings support several studies (Caro & Garcia, 2008; de Rojas & Camarero, 2008; Wan & Cheng, 2011), suggesting that service provider’s ability is perceived as an important factor by heritage tourists. These findings are also consistent with Canny (2013), who notes that service provider’s professionalism and conduct have a positive impact on heritage tourists’ level of satisfaction.
Theoretical Implications
To the researcher’s best knowledge, this study is a pioneer in applying a concept of experiential quality to the heritage context. This study presents a comprehensive evaluation of heritage tourists’ perceptions of experiential quality by developing and estimating a hierarchical and multidimensional model. The results of this study support the use of a hierarchical and multidimensional approach for conceptualizing and measuring tourists’ perceptions of quality, like the models developed by several researchers (Brady & Cronin, 2001; Dabholkar et al., 1996; Dagger et al., 2007; Ko & Pastore, 2005). The results of the measurement model tests indicate that all measurement models for measuring experiential quality and its dimensions have a good model fit. In addition, the results of the reliability and validity tests indicate that the measurement scales for measuring experiential quality and its dimensions reveal adequate reliability and validity.
This study provides a theoretical framework for understanding the relationships among five important marketing constructs (experiential quality, perceived value, heritage image, experiential satisfaction, and behavioral intentions). The result of this study also reveals that experiential quality has a direct and significant impact on perceived value. The positive relationship that is identified between experiential quality and perceived value may be interpreted as the higher the experiential quality perceived by heritage tourists, the more willing tourists are to pay higher prices and spend more time for their attraction sites. In addition, this study identifies experiential quality, perceived value, and heritage image as having a positive effect on experiential satisfaction in a heritage context. This may be interpreted as experiential quality, perceived value, and heritage image being antecedents of experiential satisfaction because experiential quality, perceived value, and heritage image play a key role in increasing experiential satisfaction (Chen & Chen, 2010; de Rojas & Camarero, 2008; Kandampully & Suhartanto, 2000; O’Leary & Deegan, 2005). Moreover, heritage image is empirically tested and confirmed as having a positive impact on experiential quality and experiential satisfaction. The positive relationship identified between experiential heritage image and experiential quality may be interpreted as the tourists’ perceived experiential quality being increased when the tourists’ impression of a cultural heritage site is improved. Alternatively, the positive relationship identified between heritage image and experiential satisfaction may be interpreted as the better impression of experiential quality at the cultural heritage site tourists have in their minds, the more satisfied they are. Furthermore, both experiential satisfaction and heritage image positively affect behavioral intentions. The positive relationship identified between experiential satisfaction and behavioral intentions may be interpreted as satisfied tourists having favorable behavioral intentions to revisit or return to the same cultural heritage site after paying high prices and spending more time to experience high levels of quality at the cultural heritage site that produces a good image in their minds. In addition, the positive relationship identified between heritage image and behavioral intentions may also be interpreted as it being likely that tourists will have favorable behavioral intentions to revisit or return to the same cultural heritage site after leaving with a good impression of the quality of heritage experiences in their minds.
This study identifies the comparative importance of the four primary dimensions in heritage tourists’ overall evaluation of perceived experiential quality. Among the four primary dimensions, outcome quality is the most important primary dimension of experiential quality, followed by access quality, physical environment quality, and interaction quality. The results provide empirical evidence for the notion that the outcome that results in visiting often has the greatest effect on tourists’ perceptions of experiential quality (Graefe & Vaske, 1987). However, the interpersonal interactions that occur during service delivery have the attitudinal effect on tourists’ perceptions of experiential quality, because service providers and tourists at the cultural heritage sites are seldom concerned about how they interact with each other.
This study identifies 10 subdimensions pertaining to the four primary dimensions of experiential quality perceived by heritage tourists. In particular, this study identifies the comparative importance of the 10 subdimensions in tourists’ evaluation of experiential quality. Among the 10 subdimensions, service providers’ ability is the most important subdimension of the interaction quality primary dimensions and location is the most important subdimension of the physical environment quality primary dimension. In addition, pleasant visit and information are the most important subdimensions of the outcome quality and access quality primary dimensions, respectively. These 4 subdimensions seem to be important components of the four primary dimensions of experiential quality. When tourists evaluate their overall quality of visiting experiences at a cultural heritage site, they may consider these 4 subdimensions as a part of the overall assessment of their experiential quality. Therefore, these 4 subdimensions should be seriously considered when researchers conduct similar studies of heritage tourists’ experiential quality.
Managerial Implications
Heritage management can use the multidimensional and hierarchical model developed in this study in its strategic planning process as the cultural heritage site provides a framework for evaluating heritage tourists’ perceptions of their overall visiting experiences. This study identifies four primary dimensions of experiential quality and 10 subdimensions pertaining to the primary dimensions. For example, heritage management can use the information from this study to improve its understanding of the factors that create pleasant visitation and act to increase tourists’ favorable behavioral intentions. Comprehending what tourists seek at a cultural heritage site will help heritage management to better understand what its tourists want. However, as the dimensions of experiential quality may vary across industries and cultures, heritage management should note that primary-dimensional and subdimensional structures may need to be factored for its own specific situation and cultural setting. This information will enable heritage management to accurately measure its heritage tourists’ perceptions of their heritage experiences.
The result of this research provides heritage management with an improved understanding of the effect of experiential quality on perceived value. The result suggests that increasing tourists’ experiential quality can increase the heritage tourists’ perceptions of value. In addition, the results of this research provide heritage management with a better understanding of the effects that experiential quality, perceived value (time and money sacrifice), and heritage image have on experiential satisfaction, which in turn, results in favorable future behavioral intentions. The results in this study show that improving heritage tourists’ perceptions of experiential quality, value, and image can effectively increase experiential satisfaction levels, and higher levels of experiential satisfaction should ultimately result in favorable behavioral intentions. In this vein, heritage management should invest more efforts into providing a consistently reliable experience to satisfy its tourists’ demands.
In addition, the results of this study provide heritage management with an improved understanding of the influence of heritage image on experiential quality and behavioral intentions, respectively. The results in this research suggest that building or improving a tourist’ impression of the cultural heritage site can help tourists increase their perceptions of experiential quality. In addition, an improved impression of the cultural heritage site enables loyal tourists to revisit the same cultural heritage site or recommend it to their friends or relatives.
As noted in this study, researchers have studied the relationships between the higher order constructs such as experiential quality, perceived value, heritage image, experiential satisfaction, and behavioral intentions in a heritage context. However, the relationship between these constructs and their supporting dimensional structures has received little attention in the tourism literature. The multidimensional and hierarchical model of experiential quality and methodology developed in this study may serve as a useful framework for researchers seeking to determine the interrelationships among these important constructs perceived by heritage tourists. Modeling the higher order constructs with the primary dimensions and subdimensions of experiential quality provides a holistic view for heritage management to use in its strategic-planning process.
Heritage management should be aware of the importance tourists place on each of the primary dimensions and subdimensions of experiential quality. In addition, heritage management should structure management strategies and resource allocation based on the relative importance of the experiential quality dimensions of its particular target tourist market. In this study, outcome quality is the most important primary dimension for favorable perceptions of overall experiential quality, followed by access quality, physical environment quality, and interaction quality. When designing a measurement to evaluate the tourist perception of experiential quality, heritage management should recognize that the order of importance of the primary dimensions of experiential quality may vary across different cultural heritage sites. In general, heritage management should concentrate on the subdimensions under outcome quality and improve the performance of cultural heritage sites on the subdimensions according to the respondents’ responses to the survey in this study. However, the subdimensions of interaction quality, physical environment quality, and access quality should also be resourced, as tourists’ overall perceptions of experiential quality while visiting cultural heritage sites depend not only on the service provider–tourist relationship but also on the relationship between tourists, the service environment, and accessibility.
Service provider’s ability is considered to be important for perceptions of interaction quality; thus, particular attention should be paid to training service providers to deal with tourists’ problems or complaints. Location has been identified as an important component of physical environment quality. Heritage management should note that the location of cultural heritage sites is a tourist’s primary concern in selecting a cultural heritage site as his/her visit. Identifying different cultural heritage sites that tourists visit for different reasons may result in the provision of different services for tourists. It may contribute to more direct marketing, where groups of tourists are approached based on their own reasons for visiting the site (Poria, Butler, & Airey, 2004a). Pleasant visit has been identified as an important component of perceptions of outcome quality. Heritage management should make tourists well prepared and familiar with the cultural heritage site. The primary responsibility of heritage management is to conserve our common cultural and natural heritage of outstanding universal value and sustain development through appropriate tourism management, as suggested by the UNESCO World Heritage Center (2013). Through the effective conservation and appropriate management of cultural heritage sites, heritage management can provide tourists with a pleasant environment when visiting the cultural heritage sites. In addition, heritage management should establish a cultural heritage site that tourists want to be with emotionally and relate themselves with to satisfy their demands for pleasant visitation. Information has been found to play a critical role in access quality. To attract more tourists to visit the cultural heritage site, heritage management should provide tourists with the feasibility of obtaining up-to-date information about activities, promotions, and other services. In addition, heritage management can provide tourists with news from mass media and word of mouth from their friends and relatives in order to enable them to have easy access to cultural heritage sites.
Limitations and Directions for Future Research
Although this study provides a number of important contributions to marketing theory and heritage management, there are some limitations. First, in spite of the amount of literature on experiential quality, it has been difficult to offer a full description of the nature of the experiential quality construct in a heritage context. Despite this difficulty, this study conducted in-depth focus group interviews to identify and examine all dimensions of experiential quality perceived by heritage tourists, because focus group interviews are believed to be more useful than literature reviews. However, there may be some other primary dimensions and subdimensions of experiential quality not identified in the conceptual framework of this study. Future studies should seek to identify additional primary dimensions (i.e., program quality, venue quality, administrative quality, etc.) and subdimensions (i.e., ambience, aesthetics, cleanliness, operating time, amenity, reliability, etc.) of experiential quality that significantly affect heritage tourists’ perceptions of experiential quality that have not been identified in this study. Second, the survey is taken from the tourists who have visited only the HCM in Macau. However, the tourists’ perceptions of experiential quality, value, heritage image, experiential satisfaction, and behavioral intentions and the primary dimensions and subdimensions of experiential quality at the HCM may be different from tourists’ perceptions at the cultural heritage sites in other regions or countries. Therefore, the findings cannot be generalized for other regions or countries. When applying the results of this study to other regions or countries, future studies should seriously consider the tourists’ perceptual differences owing to the existence of cultural or regional issue. Third, this study focused on tourists’ perceptions of the HCM only rather than an individual’s perception of his or her own cultural heritage site. Future research can aim to explore individuals’ perceptions of a site relative to their own heritage that can be linked to behaviors at cultural heritage sites, as suggested by several studies (Poria, Biran, & Reichel, 2009; Poria, Butler, & Airey, 2003, 2004b; Poria et al., 2004a; Poria, Reichel, & Biran, 2006). Finally, since exploratory research and research testing theory are used for this study, the convenience sampling design is a suitable method as it provides a fundamental base for further research. However, caution must be used when generalizing the results of this study from a convenience sample. Future studies should consider developing a systematic design such as probability sampling to better represent the target sample. For example, if possible, the surveyors can stand at the exits of cultural heritage sites and then ask every fifth person leaving the cultural heritage site to respond to several questions about his or her overall visiting experience at the cultural heritage site. Through the systematic sampling, the researchers can guarantee that each unit of the sample represents an equivalent portion of the whole population, as suggested by Jawale (2012).
Footnotes
Authors’ Note:
We would like to thank Meng-Yu Li for her assistance in this research. We would also like to thank the three anonymous reviewers for their precious and helpful comments.