
Abstract
The purpose of this study is to investigate the competitiveness of tourism destinations, worldwide, utilizing a regional economic policy tool known as the shift-share analysis. The changes in tourist arrivals, tourism receipts, and per-tourist-dollars of each country are assessed and compared with the overall tourism development across 150 countries in the world using a 17-year period (2000-2017). The findings indicate that Japan, Thailand, and Turkey are the most competitive countries when tourist arrivals are specified, but Turkey drops to the least competitive country when tourism receipts are specified as the base indicator. Thailand and Japan rank among the most competitive destinations based on their tourism receipts. Yet further results show that Luxembourg is the most competitive country, demonstrating the largest growth in per-tourist-dollar. Overall, results imply that the competitiveness of the countries and regions vary based on the aggregated measure of tourism development, suggesting that destinations need to focus on growth mechanisms and capitalize on their tourism potential. Practical implications are discussed.
Introduction
The world’s second largest industry, tourism, has grown remarkably since the turn of the 21st century, accounting now for 10% of the world’s gross domestic product (GDP) with an estimated $1,340 billion in tourism receipts and approximately 13,260 billion international tourist arrivals, worldwide (United Nations World Tourism Organization [UNWTO], 2018). Destinations are striving to increase their competitiveness by attracting more and more tourists and by capturing larger shares of tourist dollars. Although countries often measure the growth of tourism through historical changes in tourism receipts and tourist arrivals, these indicators, alone, cannot account entirely for the changes related to tourism development. Measurement usually includes the tourism industry’s composition, strength, and performance relative to that of the regional and global economy. From a macroeconomic perspective, development in tourism can be attributed to overall global or regional economic trends, tourism trends in the world or the region, and the tourism industry’s competitiveness in the country under investigation (Dogru & Sirakaya-Turk, 2017; Perloff et al., 1960). However, the extent to which tourism development in a particular country is driven by these factors is largely not known.
The purpose of this study is, therefore, to investigate the worldwide competitiveness of tourism destinations utilizing a regional economic policy tool known as shift-share analysis (SSA). Since the early 1960s, the SSA has been applied in many fields, such as spatial economics (Curtis, 1972), political economics (Glickman & Glasmeier, 1989), geography (Plane, 1987), urban planning (Stilwell, 1969), and international trade (Cheptea et al., 2005). While a few studies have applied the shift-share technique to investigate the tourism industry’s economic competitiveness within a smaller economic region (Dogru & Sirakaya-Turk, 2017; Sirakaya et al., 2002), this powerful, yet simple, method has not been applied to assess tourism development and its competitiveness across worldwide destinations.
From an economic theoretical perspective, application of the shift-share technique in alternative contexts can demonstrate its efficacy and adaptability in analyzing the changes in tourism development in a particular country or region based on the global economic growth, global industry growth, and global competitive growth. Tourism development in a country can be attributed to the aggregate of three indicators, which we term as the global growth effect (GGE), the global industrial mix effect (GIME), and the global competitive share effect (GCSE).
GGE is a measure of tourism development in a country that would have occurred in the country if tourism had developed at the same rate as the world economy, which shows the extent to which tourism development in the country is attributable to the overall economic development in the world (Dogru & Sirakaya-Turk, 2017). GIME links the difference in the growth rate in tourism development between the country under investigation and the world with weaknesses and strengths of the tourism industry in the world considered. GIME shows the extent to which tourism development in the country is attributable to the overall tourism development in the world. GCSE measures the extent to which a country is more or less competitive in tourism development compared with other countries, securing a larger share of total tourist arrivals and/or tourism receipts than other countries and thus indicating a higher degree of competitiveness.
The shift-share technique is a useful method for researchers seeking to analyze the composition, performance, and strength of the tourism industry (Sirakaya et al., 1995). However, the SSA has not been extensively applied in the context of tourism. In this study, we utilized the SSA in the context of destination competitiveness. In so doing, this study attempts to contribute to tourism literature in the context of destination competitiveness, which has been a controversial subject matter in the extant literature because of the subjectivity involved in measuring the competitiveness of destinations. As a result, strategies can be developed for governments to efficiently allocate resources, reevaluate current policy, capitalize on existing tourism resources, and introduce new tourism activities. While the shift-share technique has been applied to measure the competitiveness of destinations within a specific region or industry in the context of employment, in this study, we investigate the competitiveness of countries on a global basis in the context of overall tourism development.
Literature Review
Tourist arrivals and spending from tourism provide economic benefits to destinations, promoting infrastructure development, and investment (Assaker et al., 2014; Fletcher & Archer, 1991). Many countries depend on tourism as their primary source of economic activity and plan for growth (Dogru & Bulut, 2018; Gooroochurn & Sugiyarto, 2005). The potential of economic growth from tourism has been noted in many recent studies (Armenski et al., 2018; Assaf & Josiassen, 2012; Tsai et al., 2009) and it is expected that tourism will continue to play a significant role in propelling increased growth and opportunities, particularly in many smaller countries (Croes, 2011). Thus, competitiveness among countries for market share is increasing. Understanding the determinants of destination competitiveness is therefore a top priority to researchers and important to policy makers. In fact, there has been a growing stream of academic research on destination performance and competitiveness for a decade now (Crouch, 2011; Gómez-Vega & Picazo-Tadeo, 2019).
Notably, Crouch and Ritchie (1994) developed the most comprehensive definition and framework for destination competitiveness based on Porter’s (1990) core diamond theory of competition and comparative advantages. Conceptually, key elements such as supporting resources, destination management policy, and planning and development determinants were included in the framework. Dwyer and Kim (2003) further determined how the supporting resources interact with tourism demand, thus influencing destination competitiveness. Subsequently, definitions have propagated as tourism has grown and more destinations appeared on the global market. Tourism researchers struggle with defining the concept of destination competitiveness, while most researchers focus on destination competitiveness through pricing factors—foreign exchange and economic welfare associated with tourism (Sequeira & Nunes, 2008)—others dwell on destination competitiveness as the quality of tourism experience, social, cultural, and environmental factors (Go & Govers, 2000; Hassan, 2000).
de Holan and Phillips (1997) recommended, specifically, Porter’s (1990) basis for destination competitiveness among countries, which postulates that success in international competition depends on the relative strength of the economy. As such, many econometric studies on tourism highlight the implicit market shares, spending in destinations, and employment generated to measure relative performance. In addition, the extant empirical studies include investigations on price competitiveness and comparisons of countries to analyze how price competitiveness affects regional economies and tourism (Croes, 2011; Dwyer et al., 2000; Dwyer et al., 2001; Giordano & Zollino, 2016).
Given the complexity of investigating the range of dimensions of destination competitiveness covered in the body of literature (for a detailed list of dimensions in the literature, see Peng et al., 2015), the current study investigates competitiveness from an economic perspective. In fact, a more specific notion of “competitiveness” exists in the economics literature and is “the capacity of businesses, industries, regions, nations or supranational associations exposed, and remaining exposed to, international competition to secure a relatively higher return on the factors of production and relatively high employment levels on a sustainable basis” (Turner, 2002, p. 17). Similar to the economic concept of competitiveness, “destination competitiveness” can focus on the economic impact of tourism. In this sense, tourism is an industry with the capacity to attract tourists and spending that sustains employment and develops resources for a destination while maintaining market positions in relation to tourism industries in competing destinations (Li et al., 2013). With regard to this definition, our study adopts economic indicators to measure relative destination competitiveness.
In acknowledgement of destination competitiveness comprising multidimensional demand indictors, we adopted a multifaceted approach to the global economic concepts thought to influence the competitiveness of countries included in our analysis. Appropriately, our approach is consistent with Ritchie and Crouch’s (2003) macroeconomic theoretical “onion skin taxonomy.” The onion skin taxonomy reflects the complexity and multidisciplinary of contextual industries affecting destinations. Studies of Ritchie and Crouch (2003) and Mazurek (2014) postulate that many external and internal factors shaping the opportunities in a destination build-up the body of what has been referred to as an “onion” from layers surrounding the destination. According to Ritchie and Crouch (2003), however, the economic inner layer of the onion may be the greatest determinant of competitiveness for particular destinations. Onionskin taxonomy applied to the present study’s destination competitiveness and tourism demand concept to analyze how a country’s tourism industry performs globally and regionally. Also, the process of developing models and knowledge of destination competitiveness is still open and not definite (Mazurek, 2014). The present study attempts to fill this gap by introducing a theoretical perspective on destination competitiveness in the context of tourism. The complexity of epistemologies on tourist arrivals in destinations, as highlighted in the literature by Getz (1986), include a “number of descriptive, explanatory, and predictive models which form the building blocks of theories and describe whole or subsystems.” Thus, destination competitiveness studies should seek broader pragmatic umbrellas to underlie their measurement. Our specific aim is to indicate the factors decisive in terms of a country’s competitiveness in tourism development both globally and regionally.
In addition, our study follows previous studies (particularly Dogru & Sirakaya-Turk, 2017, but see also Dogru & Sirakaya-Turk, 2016) to argue that the understanding of destination competitiveness requires the inclusion of a broader range of factors involved in growing the tourism industry. In other words, a tourist destination is competitive if its growth and development of resources are evidenced by increased tourism expenditures and tourist arrivals. Consistent with Sahli (2006) and Craigwell (2007), countries with more tourist arrivals and tourist receipts or with a higher market share in the world market relative to other countries are considered more competitive. Thus, our study addresses the lack of testing of this postulation and measurement of competitiveness across countries and provides an operationalization of measures of tourism development.
Moreover, by implementing the comparison on more than a single region, this study also includes a universal measure of competitiveness with respect to a significant proportion of the countries in the world. The question is whether the determinants of tourism development have the same relative impact on the competitiveness of each country. In the exploration of these issues, tourism development is restricted to shift-share determinants of GGE, the GIME, and the GCSE.
SSA, initially developed by Dunn (1960) to be employed in the areas of geography and regional economics, is effective at analyzing a region’s competitiveness in various sectors in comparison with a country’s overall economic progress (Dogru & Sirakaya-Turk, 2017; Sirakaya et al., 1995; Sirakaya et al., 2002). SSA delineates economic growth, measures the effects of policy, and predicts variational growth rates among different regions (i.e., cities, states, or countries; Andrikopoulos et al., 1990) and a region’s future growth (Sirakaya et al., 1995). Additionally, SSA is effective in measuring a country’s performance relative to its region across a given time frame (Chun-yun et al., 2008; Doeringer et al., 1987; Leigh & Blakely, 2013).
The traditional SSA measures an industry’s development in comparative terms. In other words, SSA is considered to be an accounting tool that provides comparative measures to policy makers regarding the relative industry development compared to the general economic development. In previous studies, employment statistics were utilized to gauge the economic growth of a country (Bendavid-Val, 1991). While a few studies have applied SSA and analyzed the tourism industry’s weaknesses and strengths of the tourism industry in the context of employment (see, e.g., Dogru & Sirakaya-Turk, 2017, Sirakaya et al., 1995; Sirakaya et al., 2002; Sobral et al., 2007; Toh et al., 2004; Yasin et al., 2005), and SSA with regression (see studies by Blien and Wolf [2002] and Kowalewski [2011]), the shift-share method has not been applied in the context of destination competitiveness.
Our study utilizes the SSA technique to examine the relative destination competitiveness of 150 countries. We utilized, specifically, a dynamic SSA which takes the year-over-year changes in tourism development as measured by tourist arrivals and tourism receipts into account, which is not the case in a static SSA (Andrikopoulos et al., 1990; Patterson, 1991). Although the shift-share regression technique provides statistical significance measures regarding the destination competitiveness of the countries, it requires extensive data, software packages, and statistical skills (Dogru & Sirakaya-Turk, 2017). Therefore, we utilize the dynamic SSA, which is an efficient tool and can be easily applied by policy makers.
Methodology
Sample and Data
Tourist arrivals, tourism receipts, and GDP data were obtained from the World Bank database, online. While the GDP data were available in constant terms (2010 US$), the tourism receipts data were in current form and hence adjusted for inflation using the consumer price index of respective countries (2010 = 100). The sample of this study consists of countries for which annual tourist arrivals, tourism receipts and GDP data were available on the World Bank database. Although the GDP data dates back to the 1960s on the World Bank database and the tourist arrivals and tourism receipts data were only available from the 1995s onward, one or more of these variables were not available for many countries prior to 2000. Therefore, our study period is delimited to the years between 2000 and 2017. The country observations with missing variables were removed from the analysis. Accordingly, the final sample—which is essentially the census of this study—consists of 2,700 countries—year observations with 150 countries. The list of countries included in the sample can be found in Tables 2, 3, and 4.
Regional Shift-Share Analysis
Note: GGE = global growth effect; GIME = global industrial mix effect; GCSE = global competitive share effect.
Global Shift-Share Analysis: Country Rankings Based on Tourist Arrivals (TA)
Note: GGE = global growth effect; GIME = global industrial mix effect; GCSE = global competitive share effect; RGE = regional growth component; RIME = regional industrial mix component; RCSE = regional competitive share component.
Global Shift-Share Analysis: Country Rankings Based on Tourism Receipts (TR; in Thousands)

Note: GGE = global growth effect; GIME = global industrial mix effect; GCSE = global competitive share effect; RGE = regional growth component; RIME = regional industrial mix component; RCSE = regional competitive share component.
Global Shift-Share Analysis: Country Rankings Based on Per-Tourist-Dollar (PTD)
Note: GGE = global growth effect; GIME = global industrial mix effect; GCSE = global competitive share effect; RGE = regional growth component; RIME = regional industrial mix component; RCSE = regional competitive share component.
The Shift-Share Model
The SSA assesses tourism development via the changes in the tourism industry as measured by the following indicators: the GGE, the GIME, and the GCSE.
First, the GGE measures tourism development in a country that would have occurred in the country if tourism had developed equivalent to the development of the global economy (Tervo & Okko, 1983). The GGE shows the extent to which tourism development in the country is attributable to the overall economic development in the world. The country is considered to be at a disadvantage, in terms of tourism development, if the country grows as much as the global economy. The GGE is computed by multiplying the country’s base-year tourist arrivals and/or tourism receipts by the average economic growth in the world and then calculating the sum of the products (Sirakaya et al., 1995). The resulting amounts show the number of newly added tourist arrivals or the amount of newly generated tourism receipts that are attributed to trends in the global economy, alone.
Second, the GIME links the differential rate of growth in tourism development in the country under investigation to the weaknesses and strengths of the global tourism industry. Preferably, a large quantity of a country’s economy is expected to be concentrated in faster growing industries and also a smaller proportion of the economic development is preferred to be in the sectors of the economy with little or no growth. The difference in the global growth rate for the tourism industry and the average economic growth in the world is multiplied by the country’s tourist arrivals and/or tourism receipts to calculate the GIME. The GIME indicator shows the extent to which tourism development in the country is attributable to the overall tourism development in the world. The resulting figures illustrate the number of newly added tourist arrivals or the amount of newly generated tourism receipts that are attributable to the global tourism trends and nothing else.
Third, the GCSE measures the extent to which tourism development is driven by the country’s competitiveness in the tourism industry. That is, this measure indicates whether the country under examination (e.g., The United States) is relatively competitive in capturing a greater share of tourist arrivals and/or tourism receipts compared with the capture rate of other countries in the world. The GCSE is a production of the country’s tourist arrivals and/or tourism receipts and the difference in the growth rate of the tourism industry in both the country and the world. After completing this process, the outcomes are added to produce the differential-shift effect. A positive figure suggests that the country has a competitive advantage in terms of attracting more tourists and/or increasing tourism receipts. The GCSE is the vital factor in the SSA because it shows a country’s attractiveness to visitors and/or ability to increase tourism receipts. Hence, it is considered as an indicator of tourism development and a measure of a destination’s competitiveness.
The classical shift-share technique is presented in the following equation:

where i: the index referring to the countries in the global economy; ∆Ti: total change in tourist arrivals and/or tourism receipts in the ith country;
The three accounting identities are calculated as follows:


where the global growth component, GGE is given by the base period of tourism development (as measured by tourist arrivals, tourism receipts, and per-tourist-dollar) in the ith country,
When the above-illustrated Equation (1) is employed to the data year-over-year, the model is named the dynamic SSA, which takes the yearly changes in tourist arrivals and/or tourism receipts into consideration and thus incorporates the year-over-year changes in tourism development. That is, the dynamic SSA is a more accurate comparison of the components of growth compared with static SSA. The dynamic SSA allows the identification of extraordinary years; for example, economic crisis, recession, or other regional and/or global economic transitions. The dynamic shift-share model is summarized in the following equation:

where k = 1, 2, . . . t is the sequence of adjacent years. The summation is for the periods 2000-2017 in this study. Accordingly, countries can be ranked based on the GCSE to identify their tourism development or tourism competitiveness as measured by tourist arrivals, tourism receipts, and per-tourist-dollar, which is calculated by dividing the tourism receipts by the tourist arrivals for each country.
We further decompose the changes in tourist arrivals, tourism receipts, and per-tourist-dollar in a particular country into alternative components to account for the potential differences in regional economic factors. Indeed, comparing the tourism and economic development of the countries in different regions might be less than perfect because of the economical differences across the regions. Instead of assessing the worldwide competitiveness of the countries, we assess their regional competitiveness to determine the extent to which tourism development in the country is attributable to the regional economic development, regional tourism development, and the extent to which tourism development is driven by the country’s competitiveness in the region. The UNWTO classifies 15 tourism regions in the world, mainly based on geographical structures. We conduct the regional analysis based on the 15 tourism regions defined by the UNWTO. In this context, the accounting identities for the regions are computed as follows:


where the regional growth component, RGE is given by base period tourism development (as measured by tourist arrivals, tourism receipts, and per-tourist-dollar) in the ith country,
Empirical Results
This section presents the findings from the SSA of world’s regions and countries. First, we investigate the development of the tourism industry across the world’s regions, which are classified by the UNWTO mainly based on their geographical locations. North Africa region includes Algeria, Morocco, Sudan, and Tunisia. Sub-Saharan Africa region includes Angola, Benin, Botswana, Burundi, Cabo Verde, Congo Republic, Ethiopia, Ghana, Kenya, Lesotho, Madagascar, Malawi, Mali, Mauritius, Namibia, Niger, Nigeria, Seychelles, and Sierra Leone. South Africa region includes Tanzania, Togo, Uganda, Zambia, and Zimbabwe, North America region includes Canada, Mexico, and the United States. Caribbean region includes Antigua and Barbuda, Aruba, the Bahamas, Barbados, Bermuda, British Virgin Islands, Cayman Islands, Cuba, Curacao Dominica, Dominican Republic, Grenada, Haiti, Jamaica, Puerto Rico, St. Lucia, St. Kitts and Nevis, Sint Maarten (Dutch part), St. Vincent and the Grenadines, Trinidad and Tobago, and U.S. Virgin Islands.
Central America includes Belize, Costa Rica, El Salvador, Guatemala, Honduras, Nicaragua, and Panama. South America region includes Argentina, Bolivia, Brazil, Chile, Colombia, Ecuador, Guyana, Paraguay, Peru, Suriname, Uruguay, and Venezuela. North-East Asia region includes Mainland China, Hong Kong (China), Japan, Korea Republic, Macao (China), and Mongolia. Southeast Asia region includes Cambodia, Indonesia, Lao People’s Democratic Republic, Malaysia, Myanmar, Philippines, Singapore, and Thailand. Oceania region includes Australia, Fiji, French Polynesia, Marshall Islands, New Caledonia, New Zealand, Papua New Guinea, Samoa, Solomon Islands, Tonga, and Vanuatu. South Asia region includes Bhutan, India, Iran, Maldives, Nepal, and Sri Lanka. Northern Europe region includes Denmark, Finland, Iceland, Ireland, Norway, Sweden, and the United Kingdom. Western Europe region includes Austria, Belgium, France, Germany, Luxembourg, Netherlands, and Switzerland. Central/Eastern Europe region includes Armenia, Belarus, Bulgaria, Czech Republic, Estonia, Georgia, Hungary, Kazakhstan, Kyrgyz Republic, Latvia, Lithuania, Poland, Romania, Russian Federation, Slovak Republic, and Ukraine.
Southern/Mediterranean Europe region includes Albania, Croatia, Cyprus, Macedonia, Greece, Israel, Italy, Malta, Portugal, Slovenia, Spain, and Turkey. Middle East region includes Bahrain, Egypt, Jordan, Lebanon, and Oman. Table 1 presents these results.
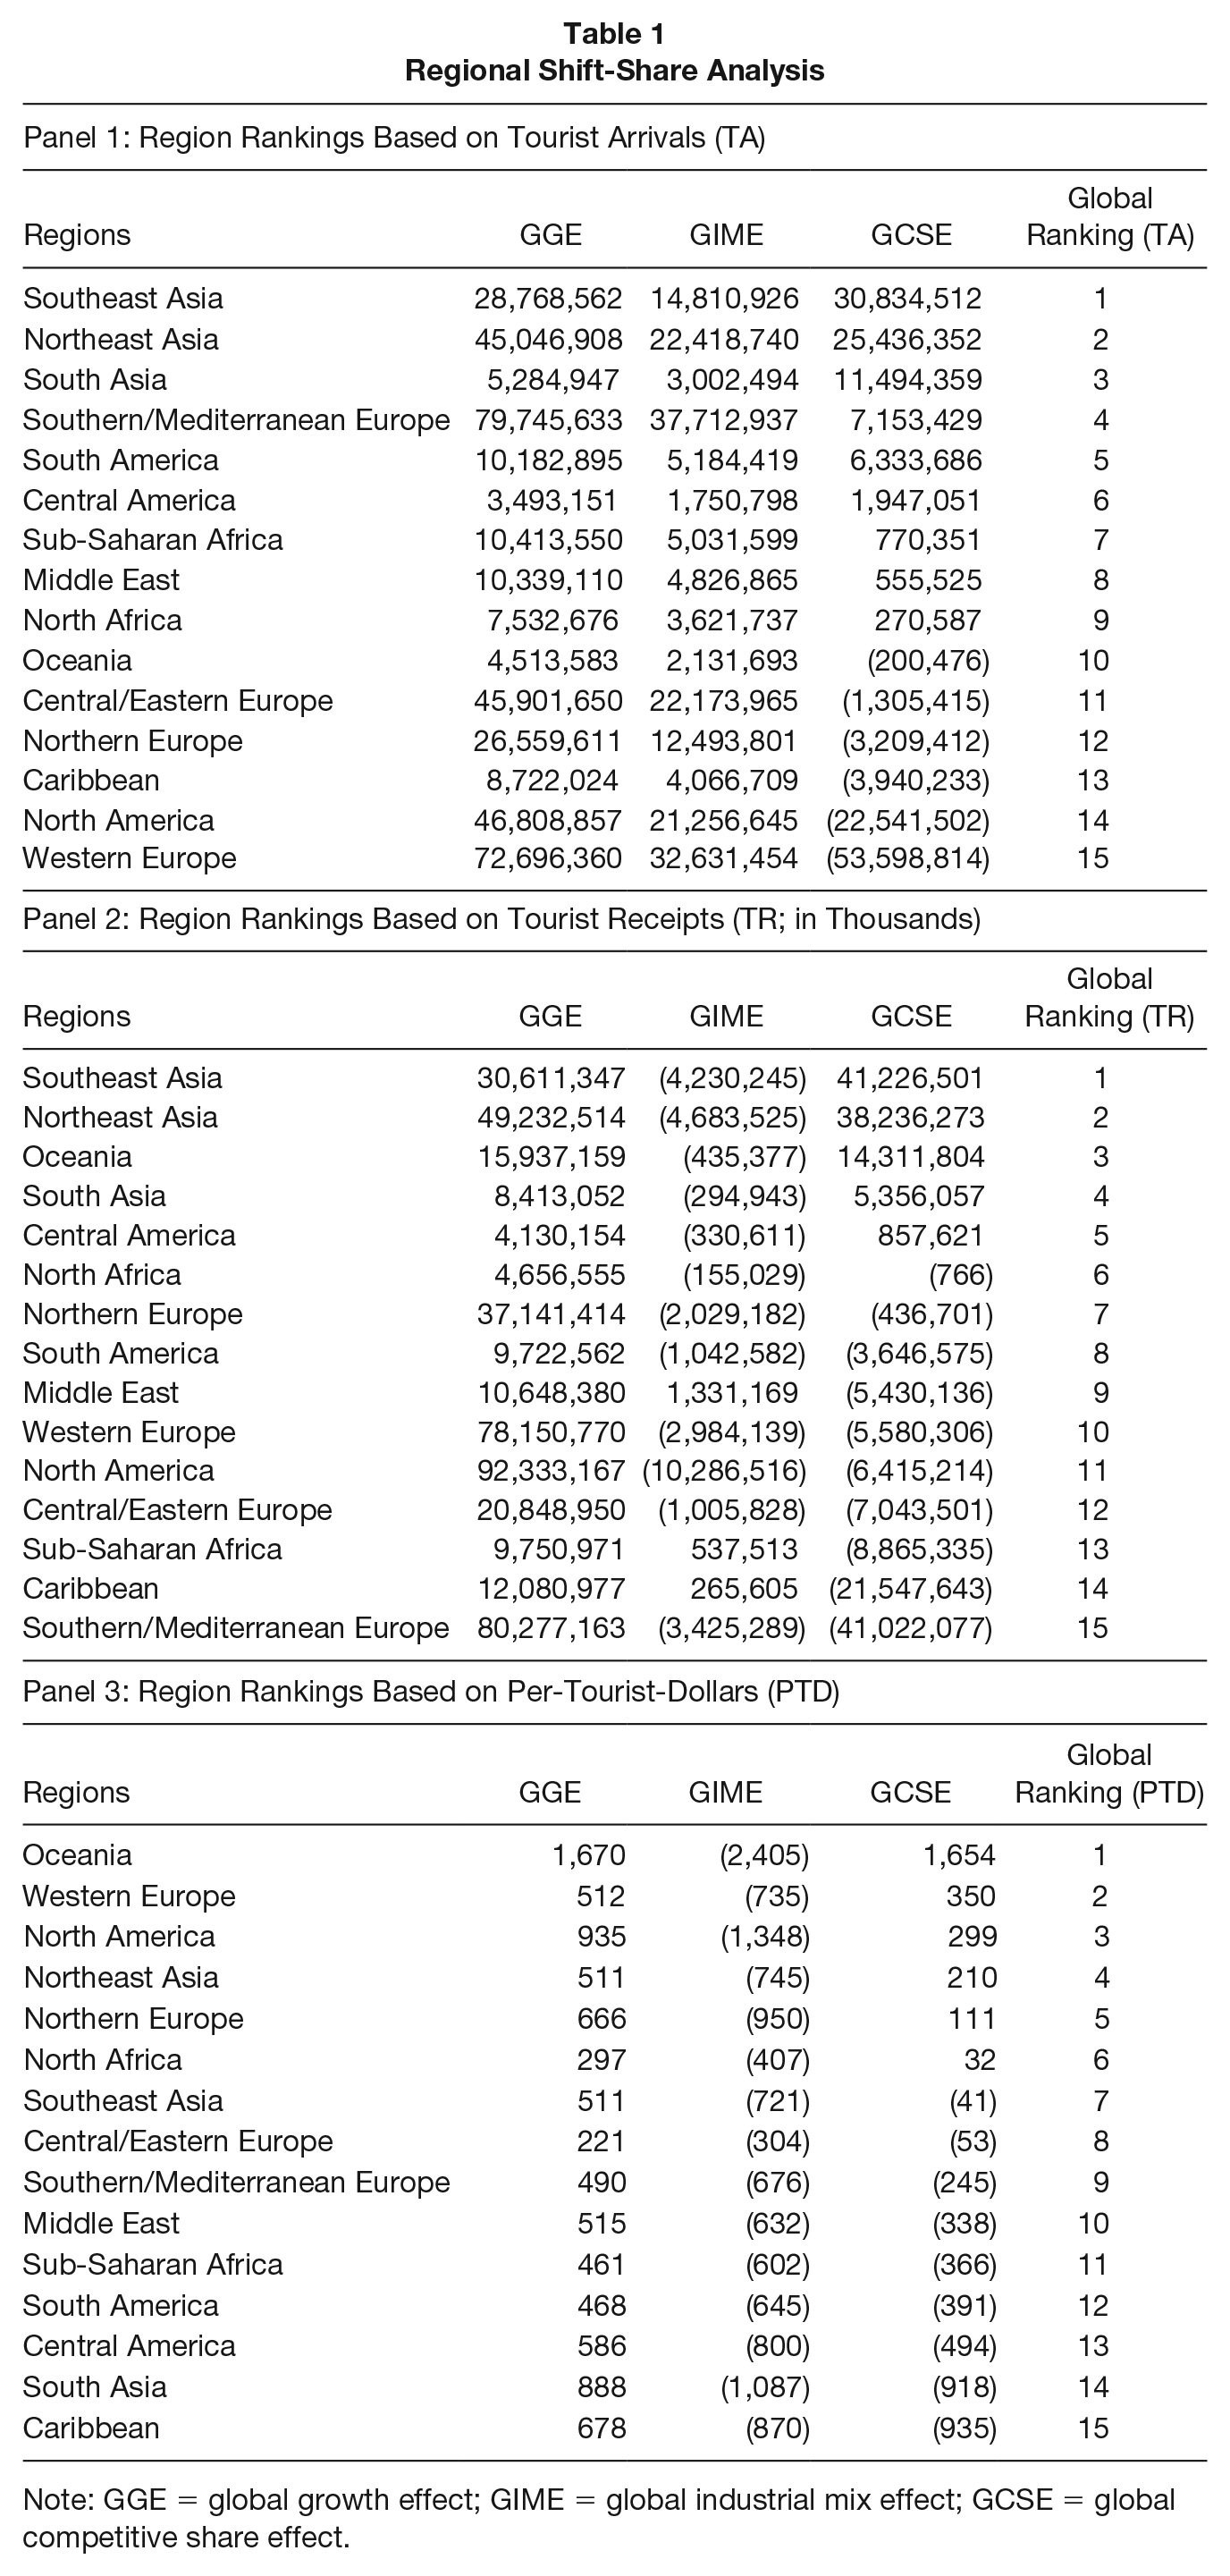
Panel 1 of Table 1 presents the findings from the SSA of regions’ tourist arrivals. The GGE column shows the tourist arrivals growth in each region due to GGE. The resulting figures present the number of new tourist arrivals that are attributable to the global economic trends. The results show that the number of tourist arrivals has increased due to GGE in every region. That is, tourist arrivals in all of the world’s regions have experienced a gain due to positive developments in the global economy. The highest GGE is observed in Southern Europe and Mediterranean Europe along with the Western European region, while the lowest increase in tourist arrivals based on the GGE is seen in Central America.
The GIME column of Panel 1 of Table 1 shows the changes in tourist arrivals associated with the differential growth rate in tourism development (i.e., tourist arrivals) between the regions and the world. The increase in tourist arrivals across the regions due to the GIME overall tourism development in the world has led to increases in tourist arrivals in every region in the world. Tourist arrivals have increased substantially in Southern and Mediterranean Europe along with the Western Europe regions due to global tourism development, whereas the increase in tourist arrivals due to GIME was minimal in the Oceania and South Asia regions.
The GCSE column presents the strength of the competitiveness of the tourism industry in each region. The GCSE figures are the indicators of the competitive advantage (or disadvantage) of tourism industry in a region. The results show that Southeast Asia, Northeast Asia, South Asia Southern and Mediterranean Europe, South America, Central America, Sub-Saharan Africa, Middle East, and North Africa regions are more efficient at securing larger shares of tourist arrivals than Oceania, Central/Eastern Europe, Northern Europe, Caribbean, North America, and Western Europe regions. It is the GCSE component of the SSA that shows a region’s ability to attract more tourists and, hence, it is considered to be a measurement of the tourism competitiveness. We further ranked the regions based on their tourism competitiveness as measured by the GCSE component. Accordingly, the Southeast Asia region ranks first among tourism regions in the world as the most competitive, followed by the Northeast Asia and South Asia regions. Western Europe, however, appears to be the least competitive at increasing the tourist arrivals followed by the North America and Caribbean regions.
Although tourist arrival figures are a commonly used proxy to measure tourism development, these figures, alone, are not sufficient to capture the overall tourism development of the regions or countries. When the number of tourist arrivals increase, the amount of money tourists spend in the regions or countries may not increase in tandem with the number of tourist arrivals. Therefore, we further analyzed the tourism competitiveness of the regions via the shift-share method based on tourism receipts and per-tourist-dollar. Panels 2 and 3 of Table 1 illustrate these results. Accordingly, the results from Panel 2 of Table 1 show that tourism receipts have increased due to positive developments in the global economy across the regions. The highest growth in tourism receipts that is attributable to GGE is materialized in North America, whereas the increase in tourism receipts due to GGE was minimal in Central America. The results from the GIME in Panel 2 of Table 1 are different than those in Panel 1 of Table 1. The outcome shows that the overall tourism development in the world was not the primary driver of the tourism receipts in many of these regions. Tourism receipts have only increased in the Sub-Saharan Africa and Caribbean regions. These results suggest that only these two regions have a highly concentrated tourism industry within their economies, while other regions have a more diverse economy that is less concentrated in tourism. The GCSE column in Panel 2 of Table 1 shows a region’s ability to generate more revenues and, hence, it is considered to be a proxy for tourism competitiveness. The results show that the Southeast Asia, Northeast Asia, Oceania, South Asia, and Central America regions are more efficient at securing larger shares of tourism receipts than other regions and, hence, they have a competitive advantage. The ranking of tourism competitiveness appears to be different for many regions when compared with the rankings based on tourist arrivals and tourism receipts. While Southeast Asia and Northeast Asia are the most competitive regions based on both measures of tourism development, Western Europe was ranked the least competitive based on tourist arrivals but is the 10th most competitive regions, if tourism receipts are used as the measurement proxy.
In addition to the tourist arrivals and tourism receipts, which are the most commonly utilized proxies to assess tourism development, we propose an alternative measure of tourism development to analyze the tourism competitiveness of the regions and countries, which we label as per-tourist-dollar. This measure merely shows the amount of money a tourist spends in a given destination visited. Panel 3 of Table 1 presents these findings. Accordingly, per-tourist-dollar spending has increased in each region, albeit at varying degrees, due to developments in the global economy. However, the results from the GIME in Panel 3 of Table 1 shows that the overall tourism development in the world was not the primary driver of change in per-tourist-dollar. The regions’ capacities in generating more per tourist dollar is illustrated in column GCSE of Panel 3. According to the results, Oceania, Western Europe, North America, North-East Asia, Northern Europe, and North Africa are the most competitive tourism regions as these regions are more efficient at increasing per-tourist-dollar revenues compared with other regions. Increase in per tourist dollar in the regions with negative GCSE suggest that these regions do not possess a competitive advantage in generating higher per tourist dollar. The change in the GCSE in these regions are primarily driven by the overall growth in global economy. In fact, the negative GCSE combined with the negative GIME suggests that tourism has developed less than the overall global economy in these regions. In other words, tourism development in the regions with negative GIME and GCSE were not able to keep up with the overall global economic growth.
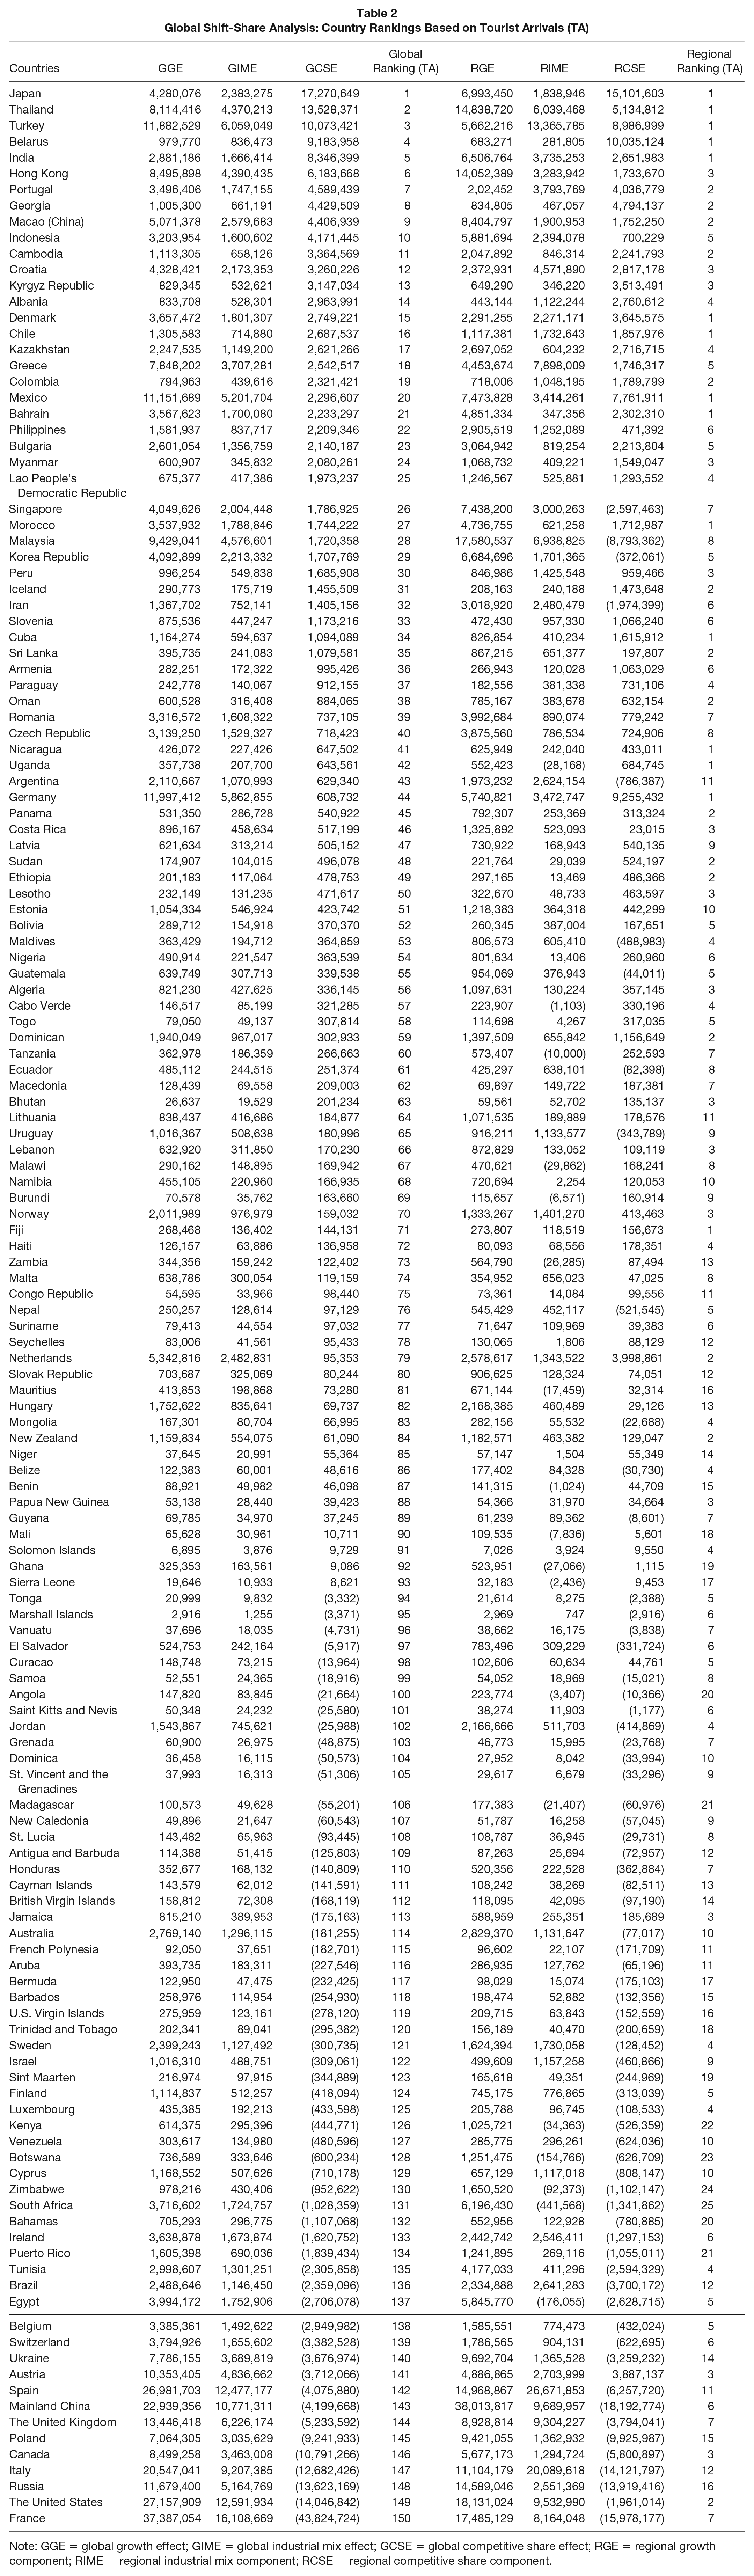
While measuring the tourism development of the regions can be insightful, there might be significant variations in destinations’ competitiveness among the countries within the regions. Therefore, a separate SSA based on individual countries’ tourist arrivals, tourism receipts, and per-tourist-dollar is necessary to identify the competitiveness of tourism in each country in the world. Also, comparing tourism industries and economic development of the countries in different regions might be less than perfect because of the economical differences across the regions. Therefore, further decomposition of the changes in tourist arrivals, tourism receipts and per-tourist-dollar in a particular country into alternative components are necessary to account for the potential differences in regional economic factors. Instead of assessing the worldwide competitiveness of the countries, assessing their regional competitiveness seems more plausible in order to determine the extent to which tourism growth in a country is attributable to regional economic development, regional tourism development, and the country’s competitiveness in the region. Table 2 presents the results from the SSA of countries based on tourist arrivals.
The GGE column shows the tourist arrivals growth in each country due to GGE. The resulting figures present the number of new tourist arrivals that are attributable to the global economic trends, alone. The results show that the number of tourist arrivals has increased due to GGE in every country. The results from the GIME column of Table 2 show that the overall tourism development has led to an increase in all countries’ tourist arrivals, suggesting that every country is focused on increasing tourist arrivals to boost their economies. The strength of the competitiveness of the tourism industry in each country is measured in CGSE column of Table 2. While 93 countries out of 150 countries examined in this study are efficient at securing larger shares of growth in tourist arrivals, the top five most competitive countries are Japan, Thailand, Turkey, Belarus, and India, respectively. The least competitive countries in capturing growth in tourist arrivals are Canada, Italy, Russia, the United States, and France. Although these findings may seem to be counterintuitive, these results suggest that these countries were not able to grow their tourist arrival numbers more than the overall global economic growth or global tourism development. That is, while tourist arrivals have increased, the growth in tourist arrivals is primarily driven by the global economic and tourism trends.
The regional rankings of these countries are also noteworthy. As can be seen in RCSE column of Table 2, the top five most competitive countries in the world are also the most competitive countries in their respective regions. Nevertheless, there is a greater variation in the regional competitiveness of the countries. For example, Morocco is the 27th most competitive country in capturing larger shares of growth in tourist arrivals in the world, but it is the most competitive in North Africa. Similarly, Germany is the 44th most completive country in the world, whereas it is the most competitive country in capturing larger shares of growth in tourist arrivals in Western Europe.
We also analyzed the competitiveness of the countries based on tourism receipts and per-tourist-dollar because changes in tourist arrivals may not necessarily reflect the changes in tourism revenues generated by the countries. Tables 3 and 4 present these findings.
The results presented in Table 3 show the country rankings based on tourism receipts, suggesting that tourist arrivals and tourism receipts yield different competitiveness figures for majority of the countries. While Thailand and Japan are still the most competitive countries in capturing larger shares of growth in tourism receipts, Turkey, Belarus, and India, which were among the top five most competitive destination based on tourist arrivals, have shifted down in ranking based on tourism receipts. Turkey appears to be the least competitive country, while India and Belarus are ranked as the 9th and 55th most competitive countries, respectively, in capturing the growth in tourism receipts.
A closer examination of the divergence between rankings based on tourist arrivals and tourism receipts suggests that tourists do not spend the same amount of money in each country. The primary reason of this divergence could be due to differences in purchasing power in each country, which can be caused by the exchange rate of the domestic currency against the U.S. dollar. To objectively rank the countries included in the sample of this study, we use the U.S. dollar as the currency, which is also the standard currency used by the World Bank, United Nations, and other major institutions. For example, US$1 was approximately equal to 1.20 Turkish Lira in 2007 and 2.91 Turkish Lira in 2016. Most recently, US$1 was approximately equal to 5.82 Turkish Lira. However, US$1 was approximately equal to 110 Japanese Yen in 2007 and 2016, whereas currently US$1 is approximately equal to 105 Japanese Yen. Considering the appreciation and depreciation of the domestic currency of these countries against the U.S. dollar, the amount of tourism receipts can vary greatly. While Turkey might be on the top in terms of the number of tourist arrivals, tourism spending in Turkey is much lower in comparison to tourism spending in Japan due to differences in cost of living and the value of local currency. Therefore, a country can be ranked on the top in terms of tourist arrivals, whereas it may not be very competitive in terms of tourism receipts.
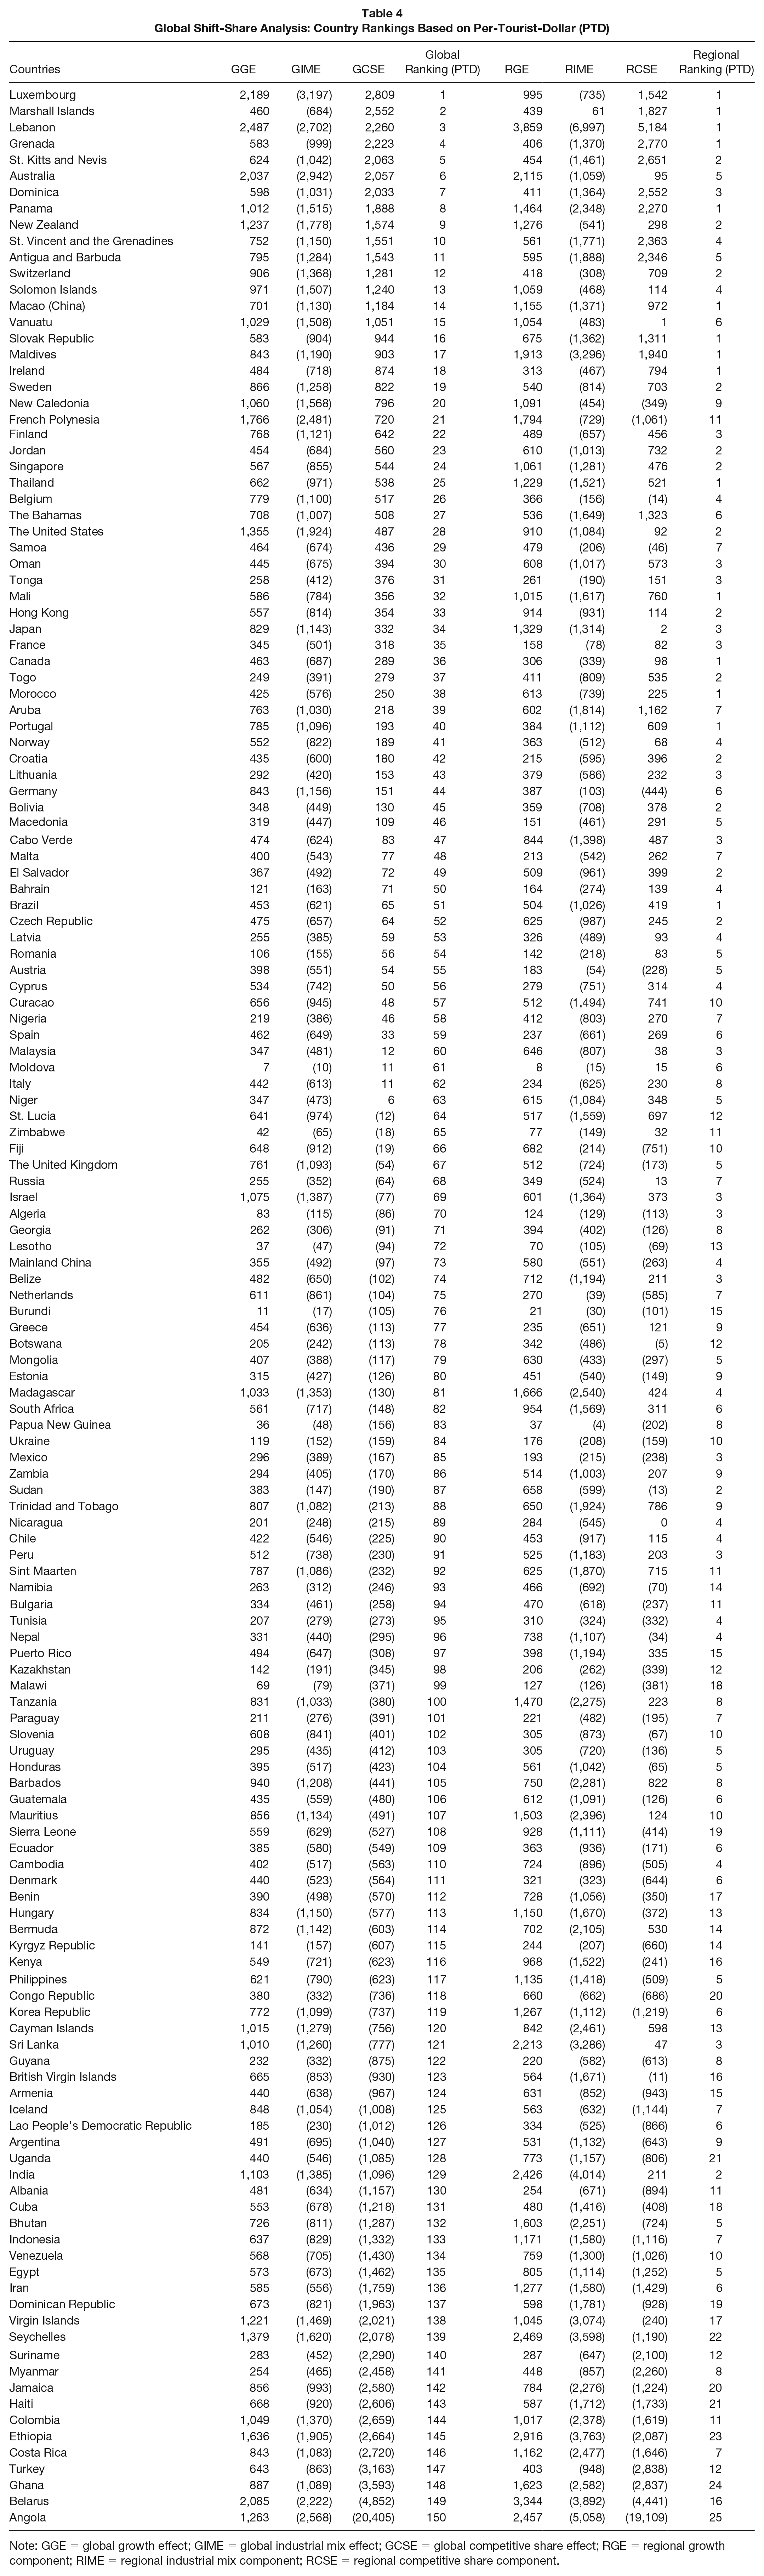
The country rankings of tourism competitiveness further fluctuate when we utilized the per-tourist-dollar measure as a proxy for tourism development. The results in Table 4 shows that Luxembourg is the most competitive tourism destination in the world, followed by Marshall Islands, Lebanon, Grenada, and St. Kitts and Nevis. The least competitive countries appear to be Belarus, Ghana, Turkey, and Costa Rica and Angola. The results further show that 63 countries have a competitive advantage in generating higher per-tourist-dollar compared to that of 87 countries, which do not seem to possess a competitive advantage in capturing higher per-tourist-dollar.
Conclusion
SSA was essentially developed to analyze the reasons for differential economic growth in a region relative to its national counterparts (Tervo & Okko, 1983). This study is an extension of the widely accepted tool that has not previously been used to investigate tourism and destination competitiveness. We applied this effective accounting tool to analyze most countries around the world, where applicable, treating them as smaller regions and the world as their base counterpart.
In this study, we postulated that global competitiveness refers to the extent to which tourism development in a country is attributable to the economic development in the world, overall tourism development in the world, and geographical or industrial specialization (in tourism) of the countries or regions (the capacity of the country in tourism). Furthermore, regional competitiveness determined the extent to which tourism development in a country is attributable to the regional economic development, development in tourism in the region, and geographical or industrial specialization (in tourism) of the countries or regions (the capacity of the country in tourism). Accordingly, the countries and regions were ranked based on their tourism competitiveness as measured by GCSE using tourist arrivals, tourism receipts, and per-tourist-dollar. The competitiveness of the countries or the regions varied based on the proxy we utilized to measure the competitiveness.
Depending on the purpose of the policy makers and their agenda, their focus should be given to the appropriate measure. Higher per-tourist-dollars infers luxury tourist segments. The competitiveness in tourist arrivals suggests that the focus of the destinations is on the number of arrivals and the governments might be primarily focused on nonluxury travelers to reduce deficits in balance of payments, provide employment (it may even be seasonal), try to attract as many tourists as possible without improving current destination infrastructure, without capital investments through providing inexpensive vacation packages that are usually all-inclusive.
Competitiveness of tourism receipts suggest that these countries or regions are primarily focusing on attracting mass tourists but do not compromise their tourism by offering low-price tourism products. The mass tourism is happening in these countries but tourists still spend relatively larger sums of money per tourist thus causing countries generate higher revenues. Per-tourist-dollar competitiveness suggests that these countries primarily focused on luxury travelers and may be providing tourism products to the luxury tourism market. These countries or regions do not seem to focus on mass tourism but rather concentrate on specific and upper segment tourism markets. Less competitive countries or regions could closely examine the most competitive countries to learn from them and implement strategies to make their tourism sector more competitive depending on the policy makers’ or governments’ goals.
It is clear that focusing on tourist arrivals alone is not helpful. For example, Turkey is the 3rd most competitive country in attracting tourists but it does not seem to be effective on generating revenues from tourism with per capita foreign tourist spending of $589. Tourism receipts are relatively lower compared with tourist arrivals. How can countries like Turkey strategize and consider long-term planning in increasing their total tourism receipts in general and per-capita-tourism spending. It seems that while countries like Turkey seem to have short-term policies that are geared toward increasing overall visitor numbers without considering social, environmental and cultural costs of tourism, other countries seem to focus increasing revenues to decrease deficits in their balance of payments.
The political systems and the efforts made by the government and other stakeholders (e.g., marketing) might contribute to the development of the tourism industry. Some countries might depend more on tourism and hence might put more efforts into generating more tourism revenues and hence advance their tourism industry. In this study, we utilized the SSA as a tool to develop an objective measure of destination competitiveness. In this context, we used GDP, tourist arrivals, and tourism receipts of the countries, all of which are objective proxies. While some countries might put more emphasis on their tourism industries, the outcome is objectively measured and compared with tourist arrivals and tourism receipts. Our interest in ranking the countries according to their respective development of the tourism industry is primarily based on the outcome (i.e., tourist arrivals and tourism receipts). That is, we investigated the competitiveness of tourism destinations worldwide from a macroeconomic standpoint. Nevertheless, we also investigate the competitiveness of tourism destinations within their respective regions to account for possible geopolitical differences across the globe. However, the factors that lead to a greater tourism development or higher tourist arrivals/tourism receipts is beyond the scope of this study. Future studies should investigate the factors, such as political systems, resources devoted to tourism development, natural resources, marketing campaigns, and so on that contributes to tourism development to account for these differences in explaining why some countries are better ranked in generating higher tourist arrivals and/or tourism receipts.
Although the traditional SSA is an effective technique to compare an industry’s progress and growth relative to macroeconomic trends, the SSA may not answer the perplexing question of whether there are statistically significant changes in a particular industry’s development. The shift-share regression analysis, however, is an alternative approach that can void this gap in the traditional SSA technique (Andrikopoulos et al., 1990; Patterson, 1991). Future research is necessary to conduct shift-share regression analysis to provide policy makers a probabilistic analysis to measure the development of the tourism industry.
Furthermore, the SSA cannot answer the puzzling questions of the essential determinants of significant changes in the tourism industry from a statistical perspective. Therefore, proposing empirical techniques that can both statistically examine the changes in tourist arrivals, tourism receipts, and per-tourist-dollars and identify the underlying reasons of such changes persists as a challenge for future studies.
Also, future studies using a variety of shift-share methods can extend the analysis to other sectors of the economy. SSA is a simple accounting technique that has proved its efficacy by decomposing the growth in various sectors of the economy. Although the SSA technique has now matured, implementation of the same method using a variety of outcome proxies is still a fertile ground for research. Future studies should explore this venue by using other outcome variables to assess competitiveness within different subsectors of the tourism industry such as the ecotourism, specialty tourism activities, and so on. While the dynamic SSA is an efficient method that can be easily applied by policy makers (advanced statistical skills are not requisite), future studies may utilize alternative SSAs, such as shift-share regression technique, to compare their efficacy in measurement of destination competitiveness.