



Abstract
EU Environmental Noise Directive recognized the importance of identifying and preserving “quiet areas.” Even if the majority of EU member states have not yet defined what is a quiet area, many researchers have started to investigate the topic using the so-called “soundscape” approach. Designing or preserving a “quiet area” in urban settings can be a challenging task. Schools and universities located in urban areas are often surrounded by areas with high traffic and noise pollution that affect the overall and sonic quality of the external spaces, which should represent pleasant areas where students can relax or study. In this study, the assessment of the soundscape and of the overall environment of the external area of the Literature Department of Roma TRE University (Italy) was investigated and discussed by analysing the acoustic, psychoacoustic and perceptual data collected. The results obtained by a summer measurement campaign were compared with the previous winter outcomes. Moreover, it was investigated how natural features, visual aspects and thermal conditions can affect the users’ judgment about the overall and the sonic environment; in particular, the Tranquility Rating Prediction Tool was evaluated, both in winter and summer. The measurements campaign revealed that the obtained values are comparable under winter and summer conditions. Due to this, the differences observed in the perception of the sonic and overall environment are ascribable to higher human voice component, more pleasant visual aspects and climate conditions during the summer. This trend was confirmed by tranquility rating values.
Introduction
In urban areas, the predominance of artificial sounds, audible wave or vibrations generated by artificial sources, in particular road traffic noise, can have a strong influence on noise annoyance of the citizens. 1 This annoyance causes a sense of psychological discomfort or negative health effects to the people. 1
According to this, it was estimated that in the Organisation for Economic Co-operation and Development (OECD) countries more than 150 million people are exposed to noise levels above 65 dB(A), indicated by the World Health Organization as a safety threshold. 1 According to the European environmental report of the European Environmental Agency 1 on the European continent, 125 million people are affected by noise levels greater than 55 dB(A) caused by traffic sources. The EU’s 7th EAP ‘Living well, within the limits of our planet’ 2 highlights that many major European urban areas are affected by high levels of noise (“High noise levels” are defined in the 7th EAP as noise levels above 55 dB Lden and 50 dB Lnight). This frequently causes adverse effects on health. Moreover, in 2 the aim of reducing noise pollution by 2020 in the EU, moving toward the World Health Organization recommended levels, is recommended by means of the EU Standard implementation about noise pollution, according to the scientific knowledge.
Although national regulations and supranational guidelines1-3 have been established in order to define the limits of sound pressure levels (SPLs) during both day and night time, their reduction is not always succeeded by a sensible improvement in the quality of the environment as perceived by the users. It has been demonstrated that subjective perceptions of an acoustic environment have an important role in the human evaluation of an open space. Most international environmental policies, however, standardize and classify areas only by means of acoustic indicators, thus exclusively focusing on noise control.3-6 A broad range of studies7-10 have shown that acoustic comfort is not just a matter of A-weighted SPL, and consequentially that reducing sound levels do not necessarily lead to an improvement of the quality of life.
The EU Environmental Noise Directive 11 has developed the concept of “quiet areas” for places located inside or outside the agglomerations. An urban quiet area is an area delimited by a competent authority that is characterized by a noise indicator lower than a limit value set by the Member State. On the contrary, a quiet area in open country is undisturbed by traffic, industry and recreational noises. Quiet areas are very important because they guarantee health benefits for the users and an increase of economic value of the surrounding agglomerations. Since the purpose of quiet areas is also to increase human health, the evaluation of how people perceive their acoustic environment is crucial, and it nourishes the interest of soundscape studies. Nevertheless, the majority of Member States have not defined any limit or procedure for identifying quiet areas yet.12–16
The definition of soundscape as “a sonic environment with emphasis on the way it is perceived and understood by the individual, or by a society” dates back to the 1970s.10,11 However, the International Organization of Standardization (ISO) has given a broader definition of soundscape only quite recently: “acoustic environment as perceived or experienced and/or understood by a person or people, in context.” 12
As it is defined, the soundscape tries to capture the holistic perception of the acoustic environment in the users’ mind through the definition of the factors that influence this perception. The soundscape is an evaluation of the acoustic quality of a space, and this cannot neglect cultural factors and living experiences of people. 13 In fact, each country promotes different actions aimed at controlling noise and creating positive soundscapes.17-21
In the last 15 years, research on “soundscape” developed exponentially, from less than 5 papers in 2000 to more than 100 papers in 2016, most likely due to a need for an innovative approach to noise control in urban environments focusing on how people experience the acoustic environments. 20
This last issue was the object of a study conducted by Kuwano et al. 22 They showed that a soundscape is perceived as a collection of various sounds and that soundscape appraisal is influenced by the assessment of these sound types. However, not all the sounds that compose the acoustic environment attract the attention of the listener, consequently impacting the soundscape evaluation.
Many studies23-27 agree that the constituent sounds of a positive soundscape are generally natural sounds (especially the sound of water) and human sounds (voices, footsteps, conversations, laughs, etc.). In particular, water sound is one of the most effective masking sounds that can be very helpful when reducing noise annoyance in urban squares. Therefore, the addition of water features to urban environments close to important noise sources can have a significant impact.19,20 This might be because natural sounds have associations with tranquility and relaxation, while human sounds suggest a sense of connection to listening subjects.
Generally, it can be stated that a soundscape is considered positive if it enhances how people feel about the place, and that the meaning of “positive” varies with the level of engagement with the soundscape. In fact, people’s perception of a sonic environment strongly depends on the activities in which they are engaged and their corresponding state of listening.14,15
Researchers with a background in environmental planning claim that soundscape quality is rather a matter of how appropriate the soundscape is to a place.30–32 Particularly, in a study conducted to better evaluate this, 46 it was pointed out that a soundscape can be appropriate even though it is poor, but no soundscape seems to be perceived as good and inappropriate.
The noise annoyance rating of an acoustic environment is the study aim of a wide set of different researches;33-39 several personal factors and non-acoustical factors play an important role in determining the perceived noise annoyance and more in general, the overall judgment of the environment.
Some literature studies16-18 also consider landscape and natural factors as important parameters that have a strong influence in soundscape evaluations. The fact that green elements affect noise annoyance has been confirmed by various researches.43,44
Since the human perception is by nature multisensorial, the degree of appreciation of an environment will be the outcome of different information gathered by all senses. 45 Understanding how visual features affect the perception of the sonic environment and vice versa is extremely difficult, but it is one fundamental aspect that the holistic approach to soundscape study tries to consider. Moreover, the Environmental Noise Directive 6 highlights the need to classify and protect “quiet areas,” and the soundscape is recognized in the European Environmental Agency “Good practice guide” as one of the approaches to classify, protect and manage quiet areas. 12
Due to this, several findings in literature focused on quietness and tranquility through the soundscape approach and models that can assess an environment’s existing tranquility rating and to estimate a tranquility rating value in response to specific visual and acoustic parameters were proposed.47-51 The sight is one of the senses that is more strongly connected with the acoustic perception as shown by different studies.26,52-56. How visual perception is affected by acoustic stimuli has been the object of studies for many disciplines since many years, 25 whereas the acoustic comfort gained importance, researchers began evaluating the influence of visual environments on acoustic annoyance and auditory perception. 23 However, visual influence depends on the type of sounds involved, 26 the level of these sounds and personal factors such as visual or auditory dominance, 27 age and length of stay of subjects. 17 In other words, the visual impact on the perception of sounds is significantly different among users with different sound sensitivity; it also varies with different sounds and with the levels with which these sounds are present.
In particular, the audio-visual interaction in soundscape, such as visibility of sound sources, esthetic values of the landscape and congruity or harmoniousness between sound and visual environment, can strongly affect soundscape evaluation, as it was demonstrated by several findings in literature.58–65
Recently, a study conducted in Belgium 37 showed that sound sensitive (auditory dominated) people tended to be less annoyed when sound sources were not in sight, while vision-dominated (sound insensitive) users were more annoyed when sound sources were visible.
Moreover, according to the same study, “hiding sound sources or adding natural green to the environment might not reduce noise annoyance for everybody”; 37 human-related factors such as sound sensitivity (audio-visual dominance) will influence the degree of annoyance and behavior of subjects, affecting the assessment of the overall environment. In fact, it seems that sound source visibility can be more important than the presence of green elements in particular occasions.
The tendency for auditory dominated people to look for sound sources has also been noticed in other experiments. 66 When put in the same audio—visual environment, these subjects had considerable different behaviors than the vision-dominated subjects, looking longer and more often at sound sources. Therefore, the simple addition of green to the environment does not necessarily lower noise annoyance, especially in urban environments since subjects will be given incongruent audio-visual info (road traffic vs green) which has shown to increase annoyance for vision-dominated subjects.
The effects of sound source visibility on noise annoyance are not the same for different SPLs of road traffic. 67 It seems that over a certain SPL, subjects with the noise source in sight (traffic) seemed to be highly annoyed by the sound environment. Generally, views of a more urban setting increase noise annoyance, however this does not apply to all kinds of sound environments. 24 In fact, user’s annoyance rating increased when sounds present were birds or traffic, but they did not assess the sound environment as less pleasant when human sounds were heard together with the view of an urban environment. When planning a soundscape, landscape interventions could be effective, and the aim is to predict how such interventions will impact sound perception and people’s feelings, keeping in mind that audio-visual dominance is another human-related factor that strongly impacts the appreciation of the urban environment. 66
Understanding how visual features affect the perception of the sonic environment and vice versa is extremely difficult, but it is one fundamental aspect that the holistic approach to soundscape study tries to consider. This approach to soundscape study is therefore essential, because it takes into account the ways a soundscape conditions mood and emotional states of subjects, which affects their behavior and the rating of the soundscape itself.
Within this context, the novelty of this work is to analyze for the first time the students’ perception of a University’s external area, both in winter and summer. The studied area is a particular outdoor environment characterized by significantly different aspects, such as greenery, water, parking spots, and traffic noise; it is attended by users not only to relax but also to study.
The aim of this article is to obtain a better understanding of how students in the external area of the Literature Department of Roma TRE University perceive and assess the overall environment by investigating the existing correlation among the judgment given to the acoustic environment, climate conditions, visual aspects and to the overall environment itself. The results obtained by the summer measurements campaigns were compared with the previous winter outcomes. The frequency distribution of the ratings given by the students to the different previously mentioned aspects, the mean value and the standard deviation for each feature were analyzed and compared. Finally, it was investigated how natural features and psychoacoustic parameters can affect the perception about the overall and the sonic environment by means of the tranquility rating value26-30,68 calculation.
The structure of this article is as follows. Section “Introduction” presents the state of the art of the international research about the soundscape. The materials and methods applied in this study are described in section “Materials and methods.” Section “Results and discussion” provides the analysis and the comparison among the acoustical, psychoacoustic and subjective data carried out through the field surveys, a critical discussion of the obtained results and a comparison between the winter and summer results. In section “Conclusion,” the main findings of the research are summarized.
Materials and methods
The case study of Roma TRE University
The area of the survey study is the external space of the Literature Department of Roma TRE University, located in the city of Rome (more precisely in the Ostiense district) and surrounded by streets characterized by high traffic flows (Figure 1(a)). The extension of the area is about 12,500 m2. In particular, three important noise sources surround the area: two streets that run along the department perimeter and a subway. Figure 1(b) shows Marconi Street in red, Valco San Paolo Street in yellow and the subway running behind the department in pink.
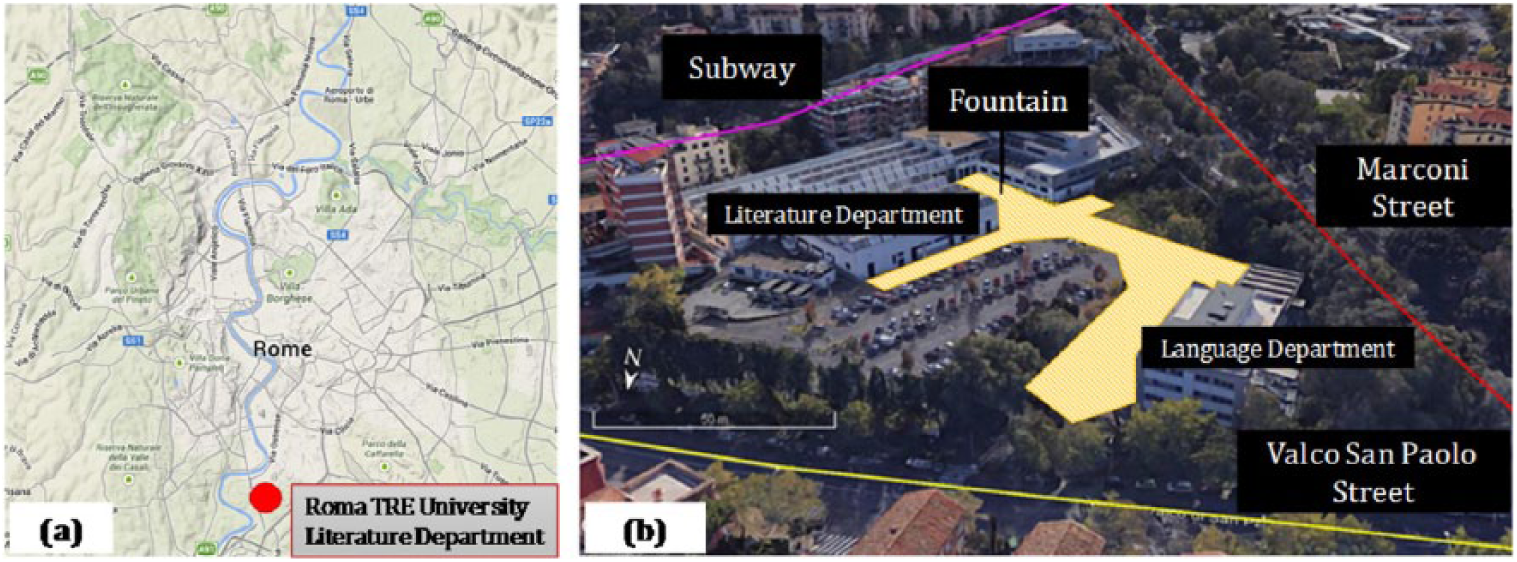
(a) Aerial view of Rome and location of the examined area and (b) Literature Department of the Roma TRE University.
Students spend a lot of time in the crisscross yellow area shown in Figure 1(b), between the two buildings: the one on the left is the Literature Department and the one on the right is the Languages Department. In this part of the department, noises from the subway and Valco di San Paolo Street are not as loud as the noise coming from Marconi Street, which is one important road of Rome, often traffic congested. The whole area, including the parking lot, is about 10 m below the level of Marconi Street. According to the Italian legislation, the acoustic zoning of Rome marks this area as “Class IV,” therefore the equivalent noise level should not exceed 65 dB(A) during daytime and 55 dB(A) at night time. The available global area used by students was divided into three sub-areas, each of them characterized by different visual and sonic features, as shown in Figure 2(a).

(a) Areas of interest, used by students and (b) measuring points.
Area 1 (about 700 m2) is characterized by a rectangular shape, closed on three sides by high buildings with a fountain, built in the center. As shown in Figure 2(a), this area is delimited by the Literature Department building. Area 2 (about 360 m2) can be considered a space where students rest or study: it is delimited by the parking area, the Literature Department building and a green area. Finally, Area 3 (about 1100 m2) is characterized by broad green spaces, in front of the Languages Department building. With this area being close to the main roads, the traffic noise is clearly perceptible. Figure 2(b) shows the points where acoustic and psychoacoustic measurements were carried out.
In the mentioned areas, where little walls designated for sitting are present, students use it to rest or study both alone or in groups (see Figure 3).
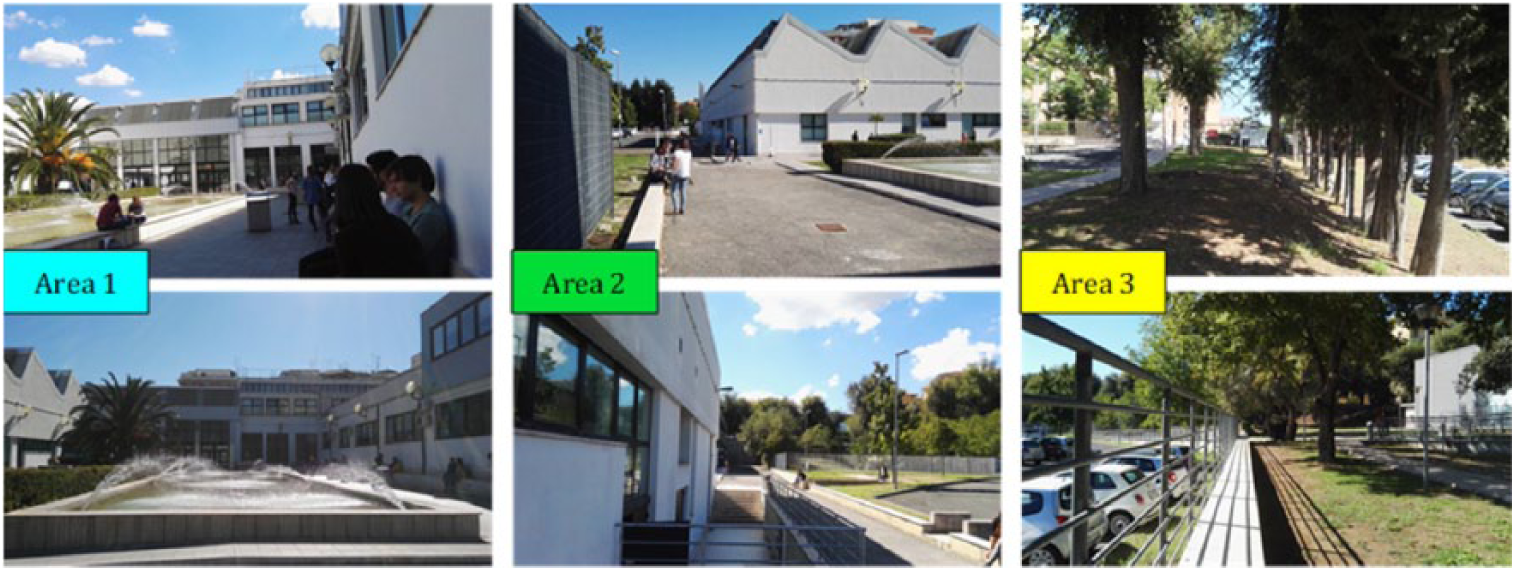
Details of the analyzed areas.
Questionnaires
In this study, only students were interviewed, this choice is due to the purpose of the research, which is to evaluate their perception of the university’s external area. The participants were properly selected to answer the questionnaires both in summer and winter, in order to avoid the individual differences (the questionnaires were applied to the same individuals, both in summer and winter).
In particular, the questionnaires employed in this study (both in winter and summer) take into account the following aspects (Table 1):
Participant sex;
Age;
Year of study;
How often the participants attend the department;
What time of the day the participants go to the department;
How long the participants stay in the open areas of the department;
Questions about the perceived sounds and how pleasing the participants find these sounds;
Questions about the importance of some factors, such as air quality, security, maintenance, natural elements, climate, visual features and smells.
Information about the demographic sample.

Acoustic and psychoacoustic measurements
Acoustic and psychoacoustic measurements were carried out by means of SPL meter Apollo Box and binaural headset Head Acoustics BHS II in order to measure the A-weighted SPL, as well as two psychoacoustic parameters: loudness (L) and sharpness (S).
The loudness of a sound is a perceptual measure of the effect of the energy of a sound perceived by people. When sounds of similar frequencies are heard together they can be heard as one, therefore partly masking each other. As a result, the perceived loudness of two mixed sounds is not the simple sum of the two SPLs, making the evaluation of loudness of sounds more complex matter. There are different methods for loudness calculation, each described in its own standard. In this study, loudness was calculated according to DIN 45631/ISO 532-1 method. 69
On the other hand, sharpness is a useful parameter used to measure the high frequency content of a sound. The spectral distribution of loudness is weighted versus frequency in order to calculate the sensation of sharpness. Finally, the center of gravity is helpful to understand how high the frequencies in a spectrum are on average. 69
Acoustic measurements were performed in six different positions, and psychoacoustic surveys were carried out in four measurements points (3–6), as shown in Figure 2(b). The picture presents with different colors the measuring points by the main roads (blue points) and the ones within the area of the department (orange points). Each acoustic measurement was characterized by a duration of 15 min and each psychoacoustic survey had the same duration of a questionnaire compiling (about 5 min).
During the questionnaire interviews, one operator simultaneously carried out recordings employing the binaural headset in a position close to the interviewee, but not affected by the dialogue between the interviewer and the interviewee (the distance between the interviewer and the operator was sufficiently to not hear the voice of the interviewee but, at the same time, to perceive the same sonic environment). These binaural recordings were then used for correlating psychoacoustic parameters with individual assessments, obtained from the questionnaires. The acoustic measurements by means of the SPL meter were carried out during the day for evaluating different traffic flow conditions, positioning the microphone of the instrument at a height of 1.6 m. Winter and summer measurements were conducted during a day of clear skies. Table 2 lists the meteorological conditions during the measurements.
Meteorological conditions during the measurement campaigns.

Tranquility Rating Prediction Tool
In order to investigate the relationship among the objective measurements, the perceived and the visual aspects and how they can affect the final rating of the overall and sonic environment by the users, the tranquility rating value was calculated and compared. The method applied to evaluate tranquility rating value was the Tranquility Rating Prediction Tool (TRAPT), which is a technique able to estimate the tranquility level in external urban areas. 29 TRAPT is a tool built starting from laboratory studies that takes into account two main factors: the average level of anthropogenic noise and the percentage of natural features in view. 30
The tranquility rating (TR) can be calculated by means of the following formula 29

where LAeq is the continuous SPL, NCF is the percentage of natural and contextual features in the scene and MF is a moderating factor which allows to take into account a minor adjustment designed to consider the actual environmental conditions at the time of assessment and is unlikely to influence the calculated TR by more than ± 1 scale point. 31
In particular, NCF was obtained by calculating the percentage of natural and contextual features by means of pictures taken in the same places of each analyzed area (both in summer and winter) and graphics software. MF was set equal to 0 due to the actual environmental characteristics.
Results and discussion
Acoustic and psychoacoustic measures
Two measurements campaigns were carried out in two different days and, for each day, data were collected in different moments during the building opening time. These measurement campaigns were conducted both during the winter and during the summer season. This subsection will be focused only on the summer results.
Table 3 lists the positions of the SPL meter measurements (see Figure 2(b)) and related significant outcomes.
Outcomes of the summer SPL measurements. Percentile levels are reported as well.

The main results obtained by the SPL meter measurements highlighted that Area 1 during the day is characterized by significant SPLs for all frequencies and a LAeq higher than 65 dB, exceeding limits imposed by the Italian Regulation on acoustic pollution (Table 3).
The high SPL in Area 1 is due to the traffic conditions, which are quite congested in the analyzed area. It is possible to observe the positive effects of the site morphology: the height difference between the main road and the internal area and the boundary greenery decrease, for example, the average value of LAeq (points 1 and 2) from 68.9 dB(A) to 58.3 dB(A) (points 3–6) during summer (compared to the winter range, from 63.5 dB(A) to 54.7 dB(A)). Taking into account the summer season, inside the area (points 3, 4, 5 and 6), the level is higher than the Italian limits for areas that require the highest acoustic safeguard (Class I, 50 dB(A)). Similarly, the psychoacoustic parameters, loudness (L) and sharpness (S), reach the highest values within Area 1 when the fountain is on (Table 3). The noise is continuous and sharp because the rushing water of the fountain increases the high frequency bands content; when the fountain is off the sonic environment is rather similar to Area 3, in terms of psychoacoustic parameters. Area 2 is strongly influenced by the presence of the fountain located in Area 1, in fact when the fountain is off very low values of loudness and sharpness were assessed but equivalent SPL similar to the ones measured when the jets are on and still higher than the limits imposed by the Italian Regulation were registered. On the other hand, Area 3 seems to be the best sonic environment in terms of acoustic and psychoacoustic measures. In fact, it shows the lowest SPLs with LAeq = 55 dB and the lowest loudness and sharpness values, also when the fountain is on (Tables 3 and 4).
Psychoacoustic parameters registered with and without the fountain ON.

The fountain effect on Areas 1 and 2 (measurements points 6, 4, and 5, respectively) is positive as the fountain fires are enhanced and the mechanical sounds and traffic noise are covered (see Figure 3). Moving away from the fountain, the unwanted sounds are most widely perceived in both Area 1 and Area 2. Regarding Area 3, the positive effect of fountain coverage is negligible; in fact, both when the fountain is on and when the fountain is off the loudness and sharpness values are comparable. This is due to the fact that the positive effect of the fountain is related to the distance from it. Area 3 is characterized by a distance of about 50 m from the fountain. Human voices represent the most significant source in this area since Area 3 is heavily populated and shielded by the low-level ground. In Area 2, the lowest values of equivalent SPL, loudness and sharpness were found. This is due to the shielding effect of low-level ground and to the fact this Area is still close enough to the fountain to capture its positive aspects keeping the analyzed parameters values lower than the ones measured in the Area 1. In fact, Area 1 is characterized by equivalent SPL, loudness and sharpness values always higher than other Areas, especially when the fountain is on: this is due to the reflection phenomenon caused by the geometrical shape of the area. Area 1 is characterized by a rectangular shape closed on three sides by buildings about 10 m high.
Subjective surveys
In order to analyze the soundscape of the area a questionnaire survey was carried. The users were first asked to indicate which kind of sounds they heard among four categories indicated in the questionnaires: traffic, mechanical sounds, human sounds and natural sounds. The interviews were realized both when the fountain was off and when it was on (both in winter and summer season), this has permitted to compare the soundscape in both cases. This subsection is regarding the summer questionnaire survey.
When the fountain (classified as natural sound) is on, the presence of the rushing water sound reduces the perception of traffic in Areas 1 and 2, maximizing the perception of natural sounds in the areas. When the water jets are turned off, the perception of mechanical and traffic noises is amplified while the possibility to hear natural sounds strongly decrease, particularly in the areas near the fountain (Figure 4(a) and (b)).
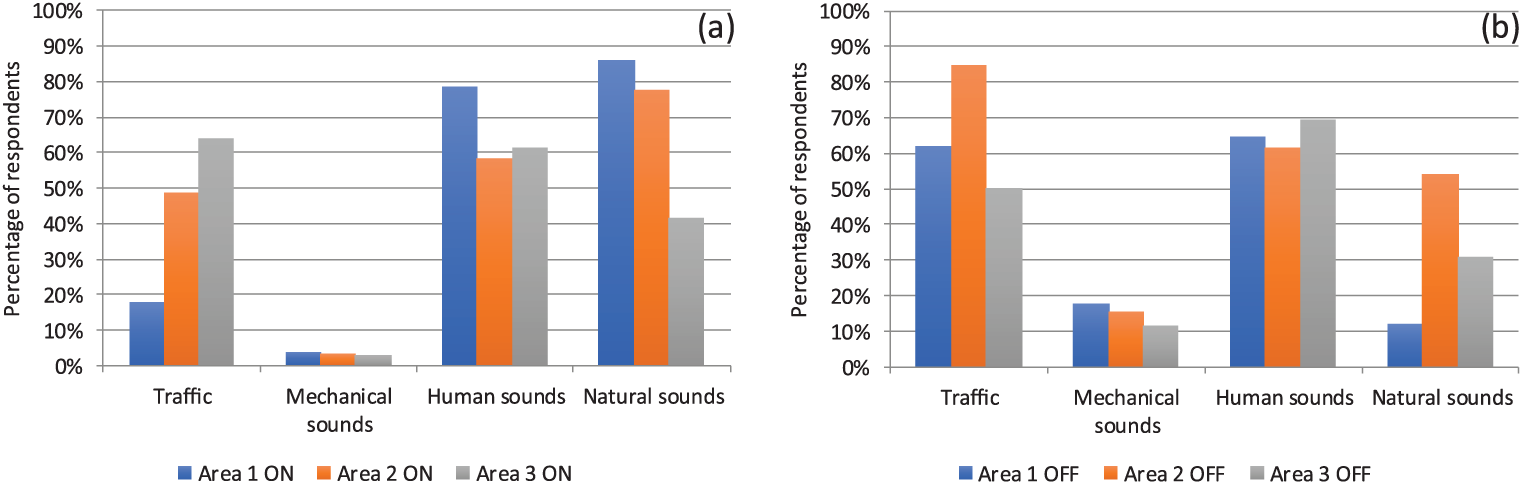
(a) Perceived sounds when the fountain is on and (b) perceived sounds when the fountain is off.
Then, the users of the areas were asked to discern the sounds they heard during the interviews. Not all of them were able to distinguish some particular sounds, but in general the most perceived ones are voices, water and cars, as it can be seen in Figure 5. Voices and cars are heard frequently in all areas, while water sounds are perceived particularly in Areas 1 and 2 when the fountain is on, these areas are the nearest to the fountain. Area 3 is the area characterized by the highest presence of greenery, and consequently, it is also characterized by a higher perception of natural sounds, such as birds and rustle of leaves. Furthermore, all areas are characterized by the presence of sounds related to traffic, like motorbike and bus noises, sirens and horns. Moreover, in these areas, it is possible to hear some sounds that are discerned only in a few cases because they are intermittent, such as the subway noise.
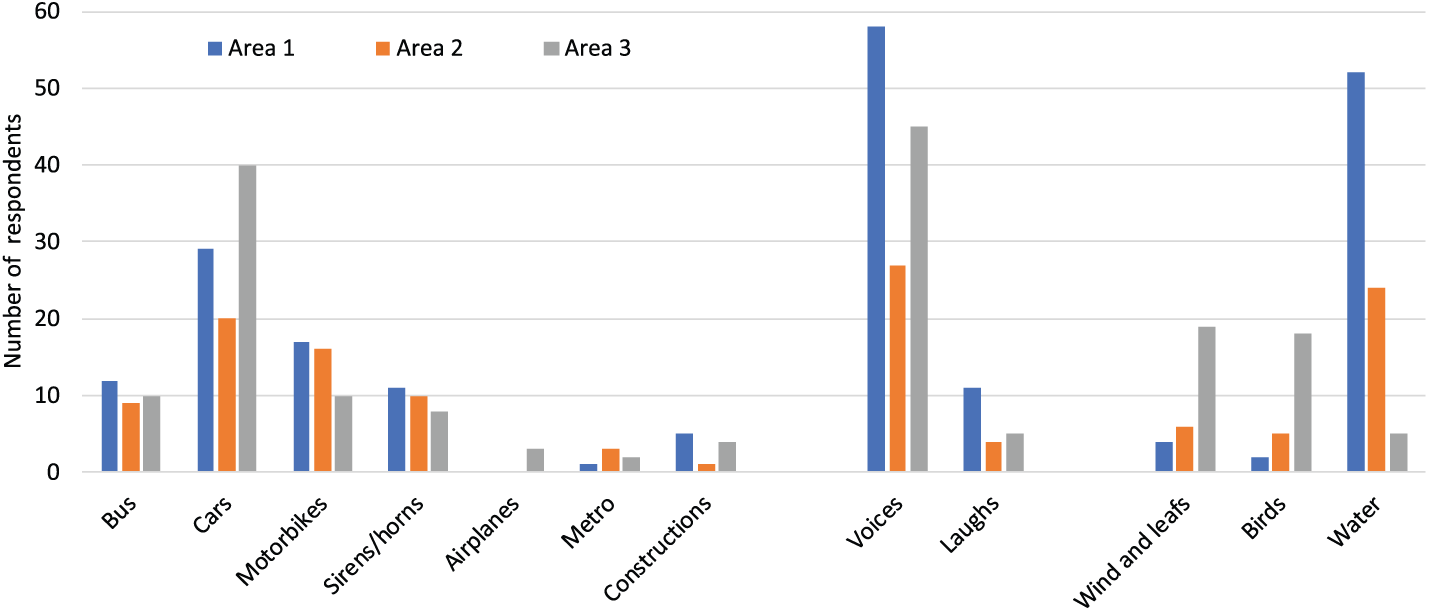
Discerned sounds during the interviews.
Looking at the features of the different areas the users show a high sensitivity related to the aspects proposed by the interviewers: in a scale from 1 to 5, the users declare to give an importance higher than 4 to all aspects except for acoustic environment, climate and smells (Figure 6(a)). The scores about the evaluation of the aspects proposed show a good appreciation for every area with a final score ranging between 3 and 4 (Figure 6(b)). In particular, Area 2 is a little more appreciated than the others in the most part of the analyzed characteristics. From the questionnaires, it is possible to gather the subjective ratings of the users of the studied areas. Taking into account Area 1, the ratings depend mainly on the fountain. When it is on, the overall environment gained the best rating (3.8 over 5) while the sonic environment has the lowest value (3 over 5) because the fountain cover traffic noise and mechanical sounds but, at the same time, water sounds are perceived as too high and users are induced to give a lower score to the sonic environment. When the fountain is off, it was assessed a lower rating of the overall environment (3.5 over 5) and a sonic environment that slightly improves (3.3 over 5). Considering Area 2, both sonic and overall environment are rated with a score equal to 3.7 points over 5.
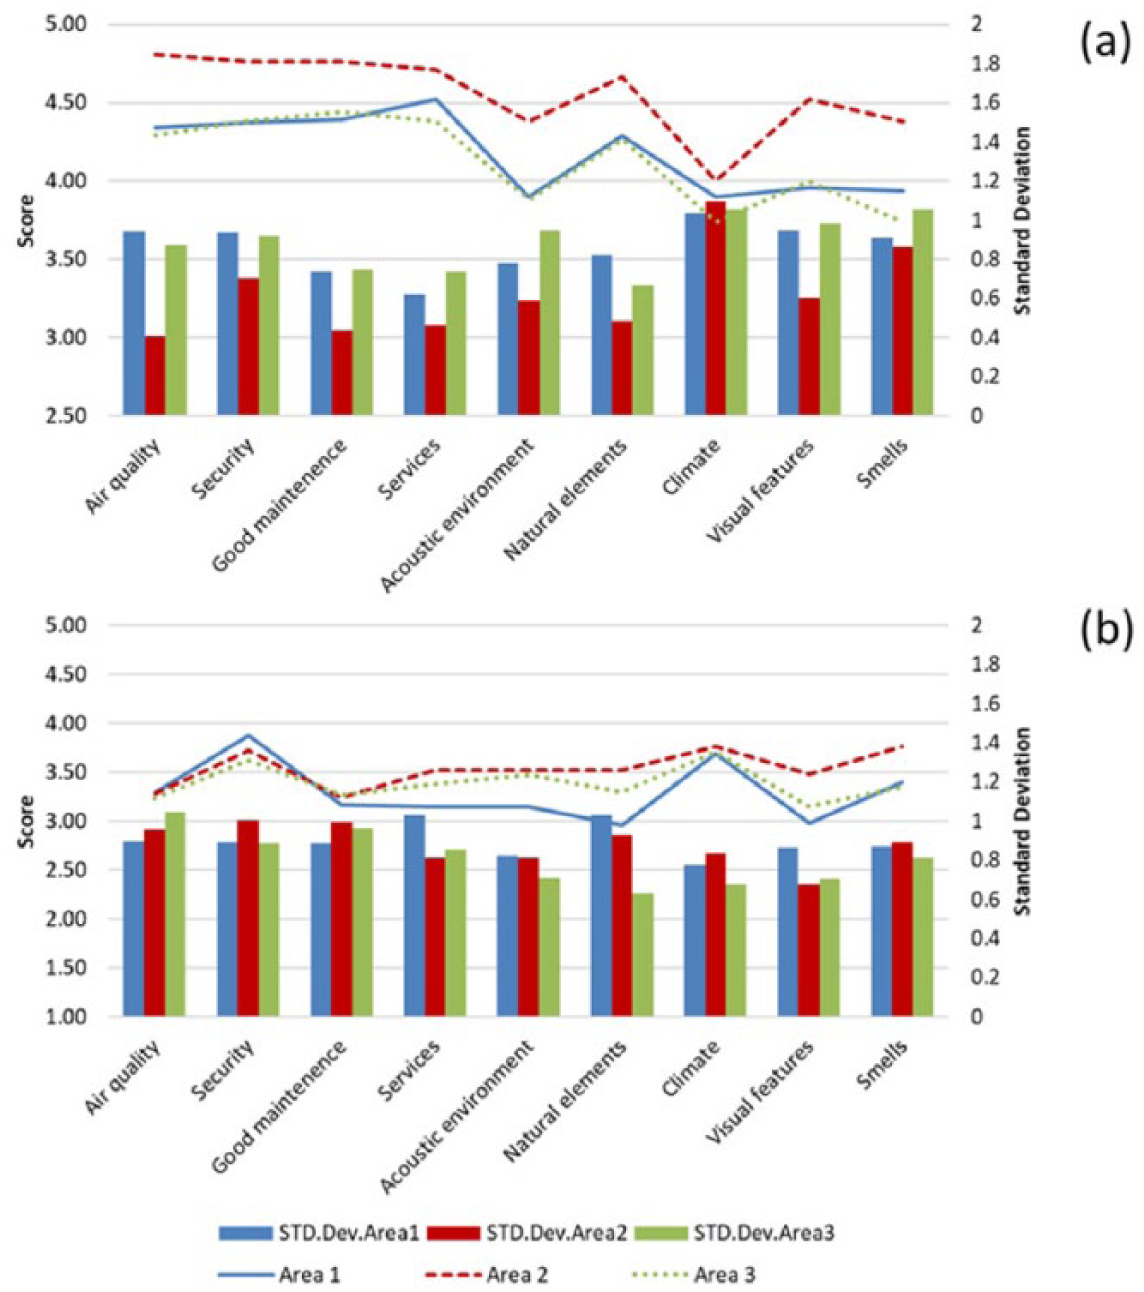
(a) Average ratings of the features of the different areas. (How important do you find these aspects in this area? From 1 = not at all to 5 = extremely). (b) Average ratings of the importance of the considered features for different areas (How do you rate these aspects in this area right now? From 1 = very unpleasant to 5 = very pleasant).
The lower values achieved by the Area 3 compared to the ones obtained by the survey carried out in Area 2, can be explained considering the sounds audible in the both areas: water and human voices in Area 2 and traffic and human voices in Area 3.
Of course, the coverage effect of the fountain is related to the distance of people from it: Area 3 is characterized by interviews where respondents were about 10 m from the two main streets and about 50 m from the fountain. Area 2 is the most appreciated, this is due to the shielding effect of low-level ground for the traffic noise and to the closeness to the fountain to capture its positive visual aspects. At the same time, the distance between Area 2 and the fountain position is sufficient to keep the SPL, the loudness and the sharpness low, allowing to appreciate both the overall and the sonic environment. Taking into account Area 1, the sonic environment final rate is also influenced by the reverberation phenomenon due to the presence of buildings and the high number of people attending the area. However, the judgment about the overall environment is good since it is positively influenced by the presence of water and natural features and by very pleasant temperature conditions.
Comparison between winter and summer results
As already said, starting from a previous winter measurement campaign a more recent summer survey was carried out with the same methodological approach and procedure. Moreover, in this work, the tranquility rating value 26 was calculated and compared for both the analyzed conditions.
In particular, to compare the soundscape evaluation of the areas in different seasons, the measurements were performed in both seasons and the same questionnaires were submitted in winter (February) and summer (early September).
Looking at the acoustic and psychoacoustic measures, it is possible to notice a slight variation in terms of equivalent SPL, loudness and sharpness values in the analyzed areas during winter and summer. The differences among the objective measured data are not significant, as well as the differences among loudness and sharpness values. On the other hand, some appreciable changes are highlighted in the questionnaire responses and they are probably related to the differences among winter and summer visual aspects, natural elements and climatic conditions. In order to investigate the relationship among the objective measurements, the perceived and the visual aspects and how they can affect the final rating of the overall and sonic environment by the users, the tranquility rating value was calculated and compared.
As it can be seen in Tables 3 and 5, considering the summer conditions, although in Area 3 the LAeq and L values are not lower than the values measured in the other two areas, tranquility rating values achieves the best value (5.15 over 10). This can be traced back to the percentage of natural features in that area, which is higher than 40%. The tranquility rating value achieved by Area 2 is higher than the one reached by Area 1, despite their natural features percentage could lead to the opposite statement. This is clearly due to the equivalent sound pressure value registered in both areas, in fact LAeq measured in Area 1 is about 15 dB higher than the one assessed in Area 2. Taking into account the winter measurement campaigns, the presence of fallow leaf trees reduces the percentage of greenery (Figure 7(a) and (b)) and it reflects in a slightly lower tranquility rating values assessed in the studied areas, as it can be seen in Table 5.
Measurement points Loudness, percentage of natural features and tranquility.

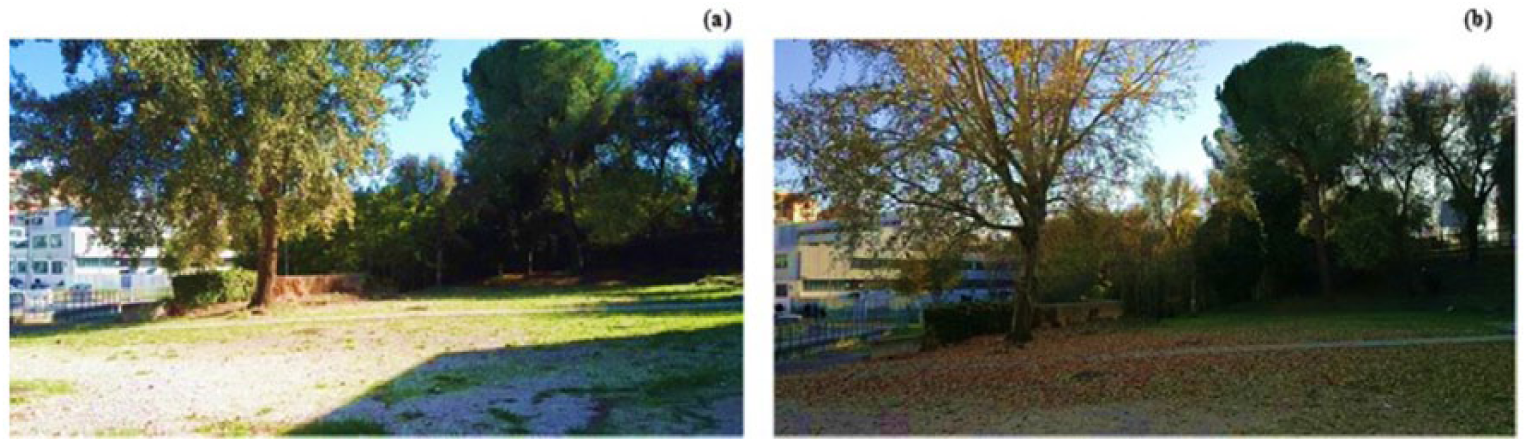
Comparison between greenery in (a) summer and (b) winter season.
This is due to the fact that the studied areas are located in a very populated area of Rome, where the SPL reaches very high values along the whole year during the building opening time, and this aspect has a significant weight in the calculation of tranquility rating values. Consequently, even if the tranquility rating values are different in the three areas accordingly with their characteristics, they never reach very high values (tranquility rating values can range between 0 and 10), even when the percentage of natural features is quite high. The tranquility rating values were calculated when fountain is on because this is the most frequent condition during the whole year.
The use of external spaces of the department is different during winter and summer season. In winter, due to the low temperatures (about 15°C lower than the temperature acquired during the summer survey), the number of people who attend the external spaces is lower and consequently also the loudness is a bit lower. On the other hand, during the summer people prefer to live in the external spaces increasing also the loudness connected to the presence of more groups of people speaking. In this context, the fountain plays an important role: during summer, the jets contribute to create an enjoyable microclimate conditions by creating also a sensible appreciation of the users that group in the spaces next to the water surface. The high overall score of Areas 1 and 2 during summer confirms this statement (Figure 8(a)). On the contrary, during this period, the sonic score is the lowest because of the presence of the fountain and of the people speaking and laughing that increase loudness. In winter, the fountain does not create the same atmosphere and the overall score of Areas 1 and 2 is lower than the acoustic score. In this season, the fountain has a lower attractive force in creating a vibrant socialization space (Figure 8(b)). The loudness is lower than the value registered during the summer because of the lower number of people who leave the external spaces, but still high due to the traffic flow conditions and mechanical sounds.
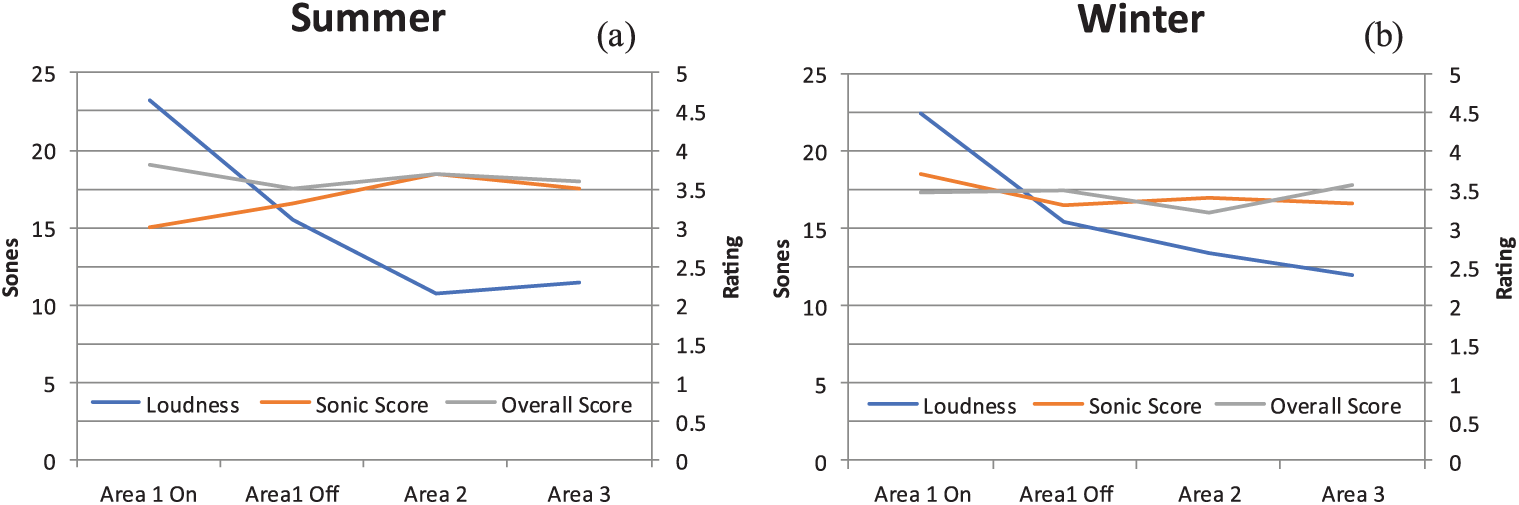
Perceived quality of the sonic environment of each sector versus loudness values for (a) summer conditions and (b) winter conditions.
The different rate of the overall and sonic environment is clearly related to the subjective evaluations of users. In fact, the different ratings of the overall and sonic environment (Figure 8(a) and (b)) are due to two main issues: on one hand, the studied area is located in a very populated area of Rome, where the equivalent SPL, caused by the traffic flow conditions, is significant during the whole year, but on the other hand, during the summer the LAeq increase because of the very high number of people using the external spaces. In particular, the overall environment rate achieved values lower than other similar quiet areas 15 probably because of the purpose of the users in attending these areas. Different from other quiet areas with similar percentages of natural features, the respondents are there to attend university classes and, consequently, the mood in judging how pleasant or unpleasant the environment significantly changes. It is possible to state that the perception of soundscape and overall characteristics of these areas are strongly related to visual aspects and climatic conditions, being about constant, in both the measurement campaigns, the objective acoustical parameters values. Observing Figure 9, it is possible to notice that the overall environment during summer is strongly related to the climate condition evaluations. The rating frequencies shown in the figure confirm this correlation, with similar mean values. Moreover, acoustic environment and visual aspects are characterized by similar frequency distributions. Observing the overall environment, over a certain score (represented by 3), climate can be considered the main aspect, with a specific importance for a better overall environment evaluation. On the contrary, up to score 3, the overall environment assessment is more dependent on acoustic environment and visual aspects.
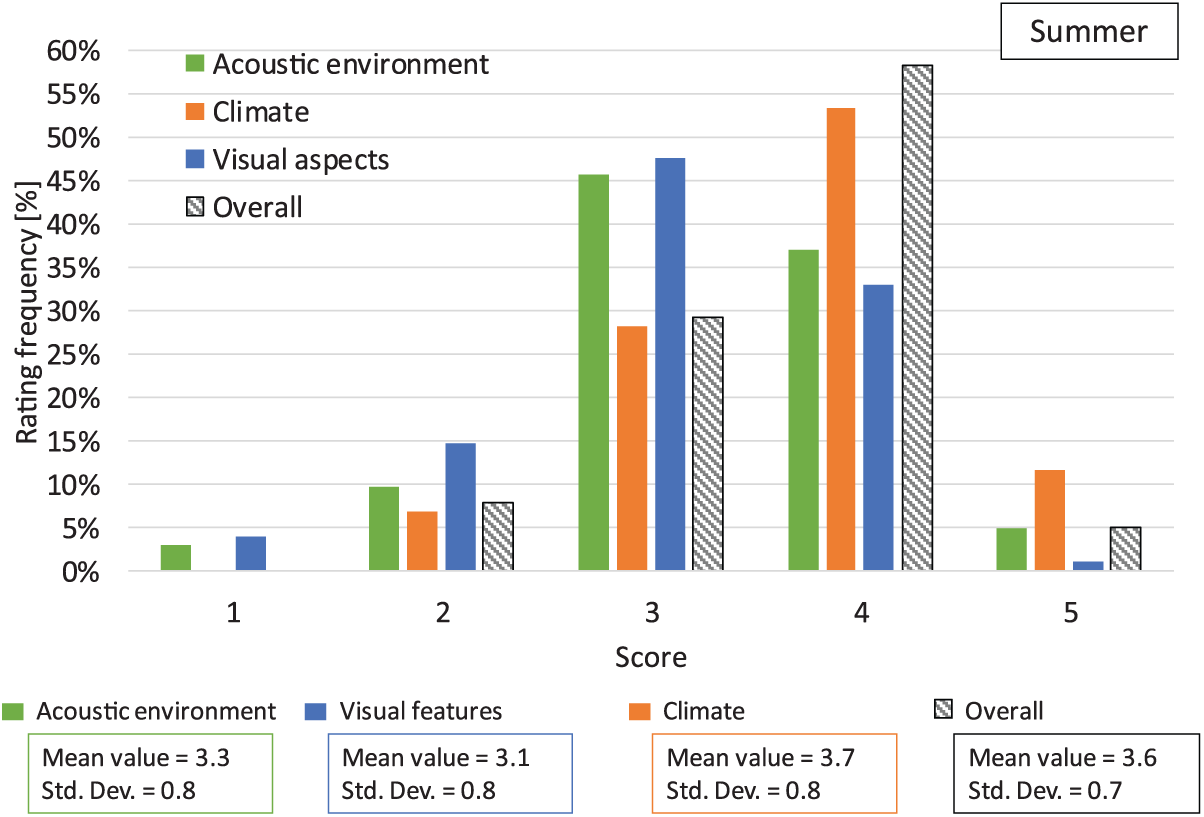
Score frequencies, mean values and standard deviations regarding acoustic environment, climate, visual aspects and overall environment responses, during summer.
On the other hand, taking into account the winter season, the rating frequencies are shown in Figure 10. It reports the results obtained during a day characterized by nice weather conditions. This can explain a rating frequency higher than 15% for the score 5: under a psychological point of view, moderate temperatures and sunny condition in winter can influence the judgment of an area, where visual aspects become essential, providing perceptions higher than expectations. 70 Comparing Figures 9 and 10, it is possible to notice that the mentioned dependence between the overall environment and climate in winter does not occur anymore. During winter, low temperatures (and consequently unpleasant climate) are not surprising and people are more influenced by other aspects, such as acoustic and visual ones. This can be deduced by observing the similar mean values of overall and visual features in Figure 10.
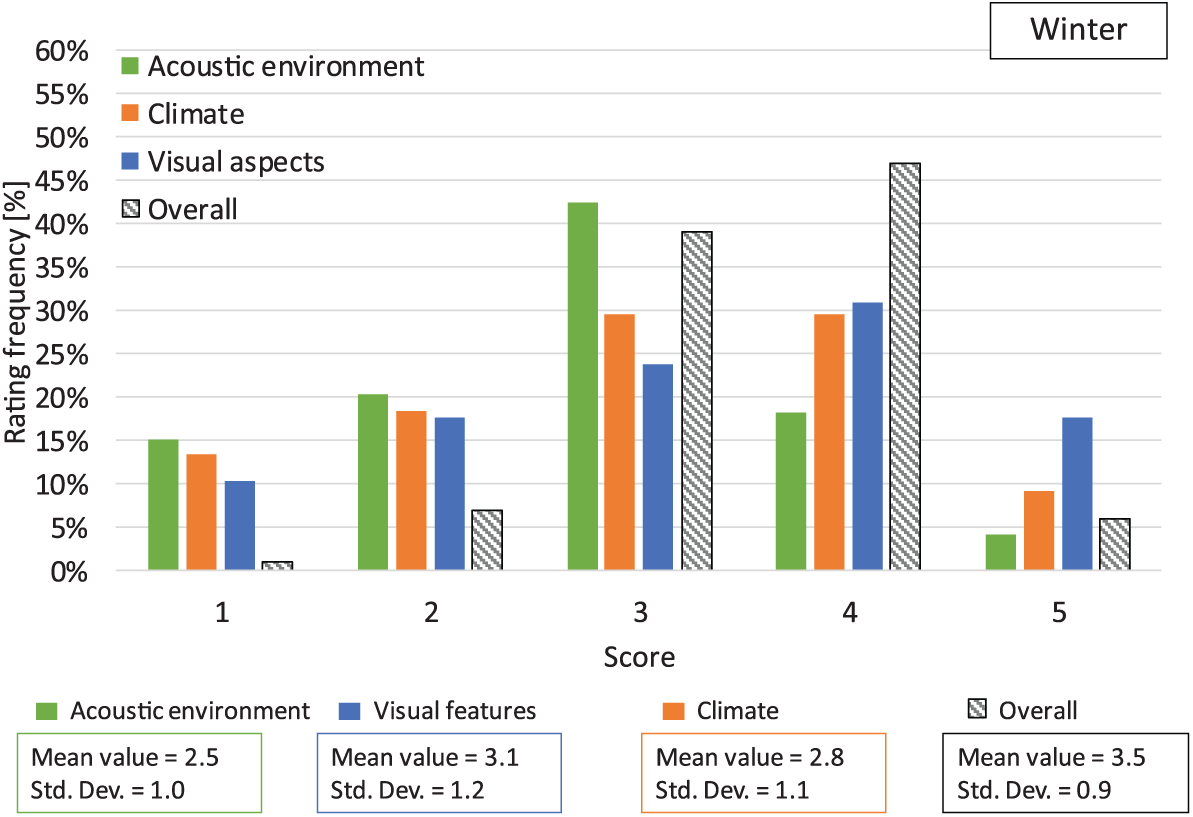
Score frequencies, mean values and standard deviations regarding acoustic environment, climate, visual aspects and overall environment responses, during winter.
Conclusion
In this study, the current overall environment of the external area of the Literature Department at Roma TRE University were investigated by comparing different features such as acoustic environment, climate conditions, visual aspects with the overall environment itself. With the aim of analyzing the relationships among the users’ perception of the acoustical and overall quality of the studied area, subjective response and selected acoustical and psychoacoustical parameters were deeply analyzed. Moreover, it was investigated how natural features, visual aspects and thermal conditions can affect the users’ final judgment by means of the tranquility rating value calculation, by comparing winter and summer results.
During the analysis, it was verified that the two main streets close to the department area are important noise sources, with high traffic equivalent SPLs. Fortunately, the position of Areas 2 and 3 below these streets levels, reduces LAeq to about 55 dB(A). However, in Area 1, a very high LAeq was assessed, due to the presence of the fountain, which seems to be an important sound source, enhanced by the shape of the surrounding buildings. The sounds present in the three areas are human voices together with rushing water in Area 2 and Area 1, and a constant traffic background noise in Area 3 and Area 1 when the fountain is off. Apart from Area 2, these sounds have not been judged particularly suited for the areas. The equivalent SPLs measured in both summer and winter conditions are comparable, and this means that the changes in the users’ final rating strongly depend on the visual aspects, climate conditions and natural features, which are quite different in the two seasons.
In fact, the presence of the fountain in Area 1 masks the traffic noise, but subjects rated the acoustic environment with lowest scores in the summer, because the water jets added to the constant and loud human voices make the sound not very quiet and natural. This has also confirmed by the highest psychoacoustic measures values and equivalent SPLs. Therefore, the working fountain seems to be an important bothering noise source in this particular case, but at the same time, on one hand, it masks traffic and mechanical sound and, on the other hand, it is a very pleasant visual feature when the temperatures are high. It can be stated because the frequency distribution of responses related to the overall environment was the highest during the summer season, when the fountain’s visual aspect has a significant weight on the users’ overall environment perception.
The judgment on the overall and sonic environment, which is opposite in winter compared to the summer one, is due to the fact that the studied area is located in a very populated area of Rome, where the SPL is significant during the whole year and students are accustomed to the traffic background noise because most of them lived nearby. Due to this, the difference in the environment’s perception is given by a higher presence of human voices, more pleasant visual aspects and climate conditions during the summer. This trend was confirmed by tranquility rating values analyses.
Although Area 3 is characterized by low equivalent SPL, loudness and sharpness values and by the highest percentage of greenery and tranquility rating value, its sonic and overall environment final rate is not so high as can be expected. This is probably due to the general purpose that users have in attending this Area, in fact, differently from other areas with similar features, here the respondents come to study or attend university classes, thus the mood in judging how pleasant or unpleasant the environment can significantly change.
It is worthy to notice how the perception of sonic and overall characteristics of these Areas is strongly related to visual aspects and climatic conditions, being the registered acoustical parameters values about constant in both the measurement campaigns.
Footnotes
Declaration of conflicting interests
The author(s) declared no potential conflicts of interest with respect to the research, authorship, and/or publication of this article.
Funding
The author(s) received no financial support for the research, authorship, and/or publication of this article.
