



Abstract
Although Korea’s dominant inbound tourism markets are Japan and China, Muslim tourists from Malaysia and other Asian source markets are rapidly growing and worthy of attention. In this analysis of Malaysian Muslim tourists, it is concluded that there is a more favorable destination brand positioning for Korea than for China, but that Korea lags behind Japan for all dimensions of brand image except for ‘access to Muslim culture’. Korea is positioned somewhere between China and Japan for brand awareness, association, and loyalty and also for emotion-related items. Respondents perceived China as more familiar than Korea. It was concluded that the tour planning preferences and gift-giving behaviors of Malaysian Muslim tourists differ according to their sociodemographic characteristics.
Introduction
According to the product life cycle, many destinations emerge, develop, and then decline (Agarwal, 1997; Pulina et al., 2006; Zhong et al., 2008). Increasing competition is evident as new destinations enter the market and as established destinations reemerge by introducing new managerial and/or technological applications. In light of the unpredictable macro- and microenvironments impacting on the fast-growing Asia-Pacific region, it is worth exploring the perceived market positioning and preferences of tourists from emerging source markets. One reason for identifying a destination’s positioning and consumer preferences is to understand a set of possible competitive advantages or disadvantages as a basis for positioning. A destination that defines its positioning and preferred tourist attributes is significantly advantageous when introducing new products or services, communicating with stakeholders, and making decisions regarding financial investment or market exit. It also assists the formulation of differentiation from competitors and the prediction of future market situations. This study focuses on two concepts that are closely connected with differentiation, namely, destination positioning and tourist preferences.
Positioning involves evaluating perceptions of a product relative to competitors concerning the attributes that are considered most important by the relevant segment (Kotler et al., 2010). Destination positioning has been examined by many researchers (Botha et al., 1999; Chen and Uysal, 2002; Crompton et al., 1992; Dolnicar and Grabler, 2004; Kim and Agrusa, 2005; Kim et al., 2000; Pike, 2012; Pike and Ryan, 2004; Qu and Qu, 2011). Image is the most popularly used measure by destinations that are seeking effective positioning and competitive advantage. A destination’s positioning results from a complex set of tourist perceptions, impressions, and feelings about the destination(s) relative to competitors (Enright and Newton, 2004; Pike, 2012). Further empirical evidence is needed to build upon the existing knowledge around applicable positioning typologies and formulate distinct value propositions to destination practitioners and market segments. The current study adopts a destination brand positioning typology. This refers to the theoretical foundations underpinning a grouping of domains that can be used to evaluate destination competitiveness.
Many previous researchers have explored tourist preferences, and this is another concept for consideration. Understanding tourist preferences is critical for enhancing service quality and attracting new tourists (Jang et al., 2004a). Along with positioning strategy, addressing tourist preferences can support the achievement of competitiveness relative to alternative destinations. Various researchers have examined disparate tourist preferences on the basis of sociodemographic characteristics (Agrusa et al., 2011; Baloglu and Shoemaker, 2001; Kim and Prideaux, 2005), purpose of visit, or preferred activities (Choi and Tsang, 1999; Hsieh et al., 1992; McKercher et al., 2002; Moscardo et al., 2000; Sung et al., 2000). Destination preferences vary according to tourist motivations (Andreu et al., 2005; Baloglu and Shoemaker, 2001; Jang and Cai, 2002; Pearce and Lee, 2005; Sirakaya et al., 2003) and cross-cultural characteristics (Bahar and Kozak, 2007; Kim and Agrusa, 2005; Kim and McKercher, 2011; You et al., 2000).
The current study has two main goals. The first goal is to make use of brand positioning typologies to analyze Korea’s destination competitiveness among prospective Malaysian Muslim tourists relative to Japan and China. This primary research goal is subdivided into six secondary objectives using the following approachesto identify relative competitiveness between the three destinations: (1) brand image, (2) brand awareness, (3) brand association, (4) brand loyalty, and (5) feelings as perceived by potential Malaysian Muslim travelers.
The second goal is to explore tourist preferences on the basis of sociodemographic characteristics. Such approaches provide a means of identifying traveler perceptions of the relative strengths and weaknesses of Korea, China, and Japan. The results should assist relevant destination stakeholders to understand the establishment of optimum destination positioning. The study will contribute to theory by measuring destination brand positioning typologies and their application to destinations.
Asian inbound tourism to Korea
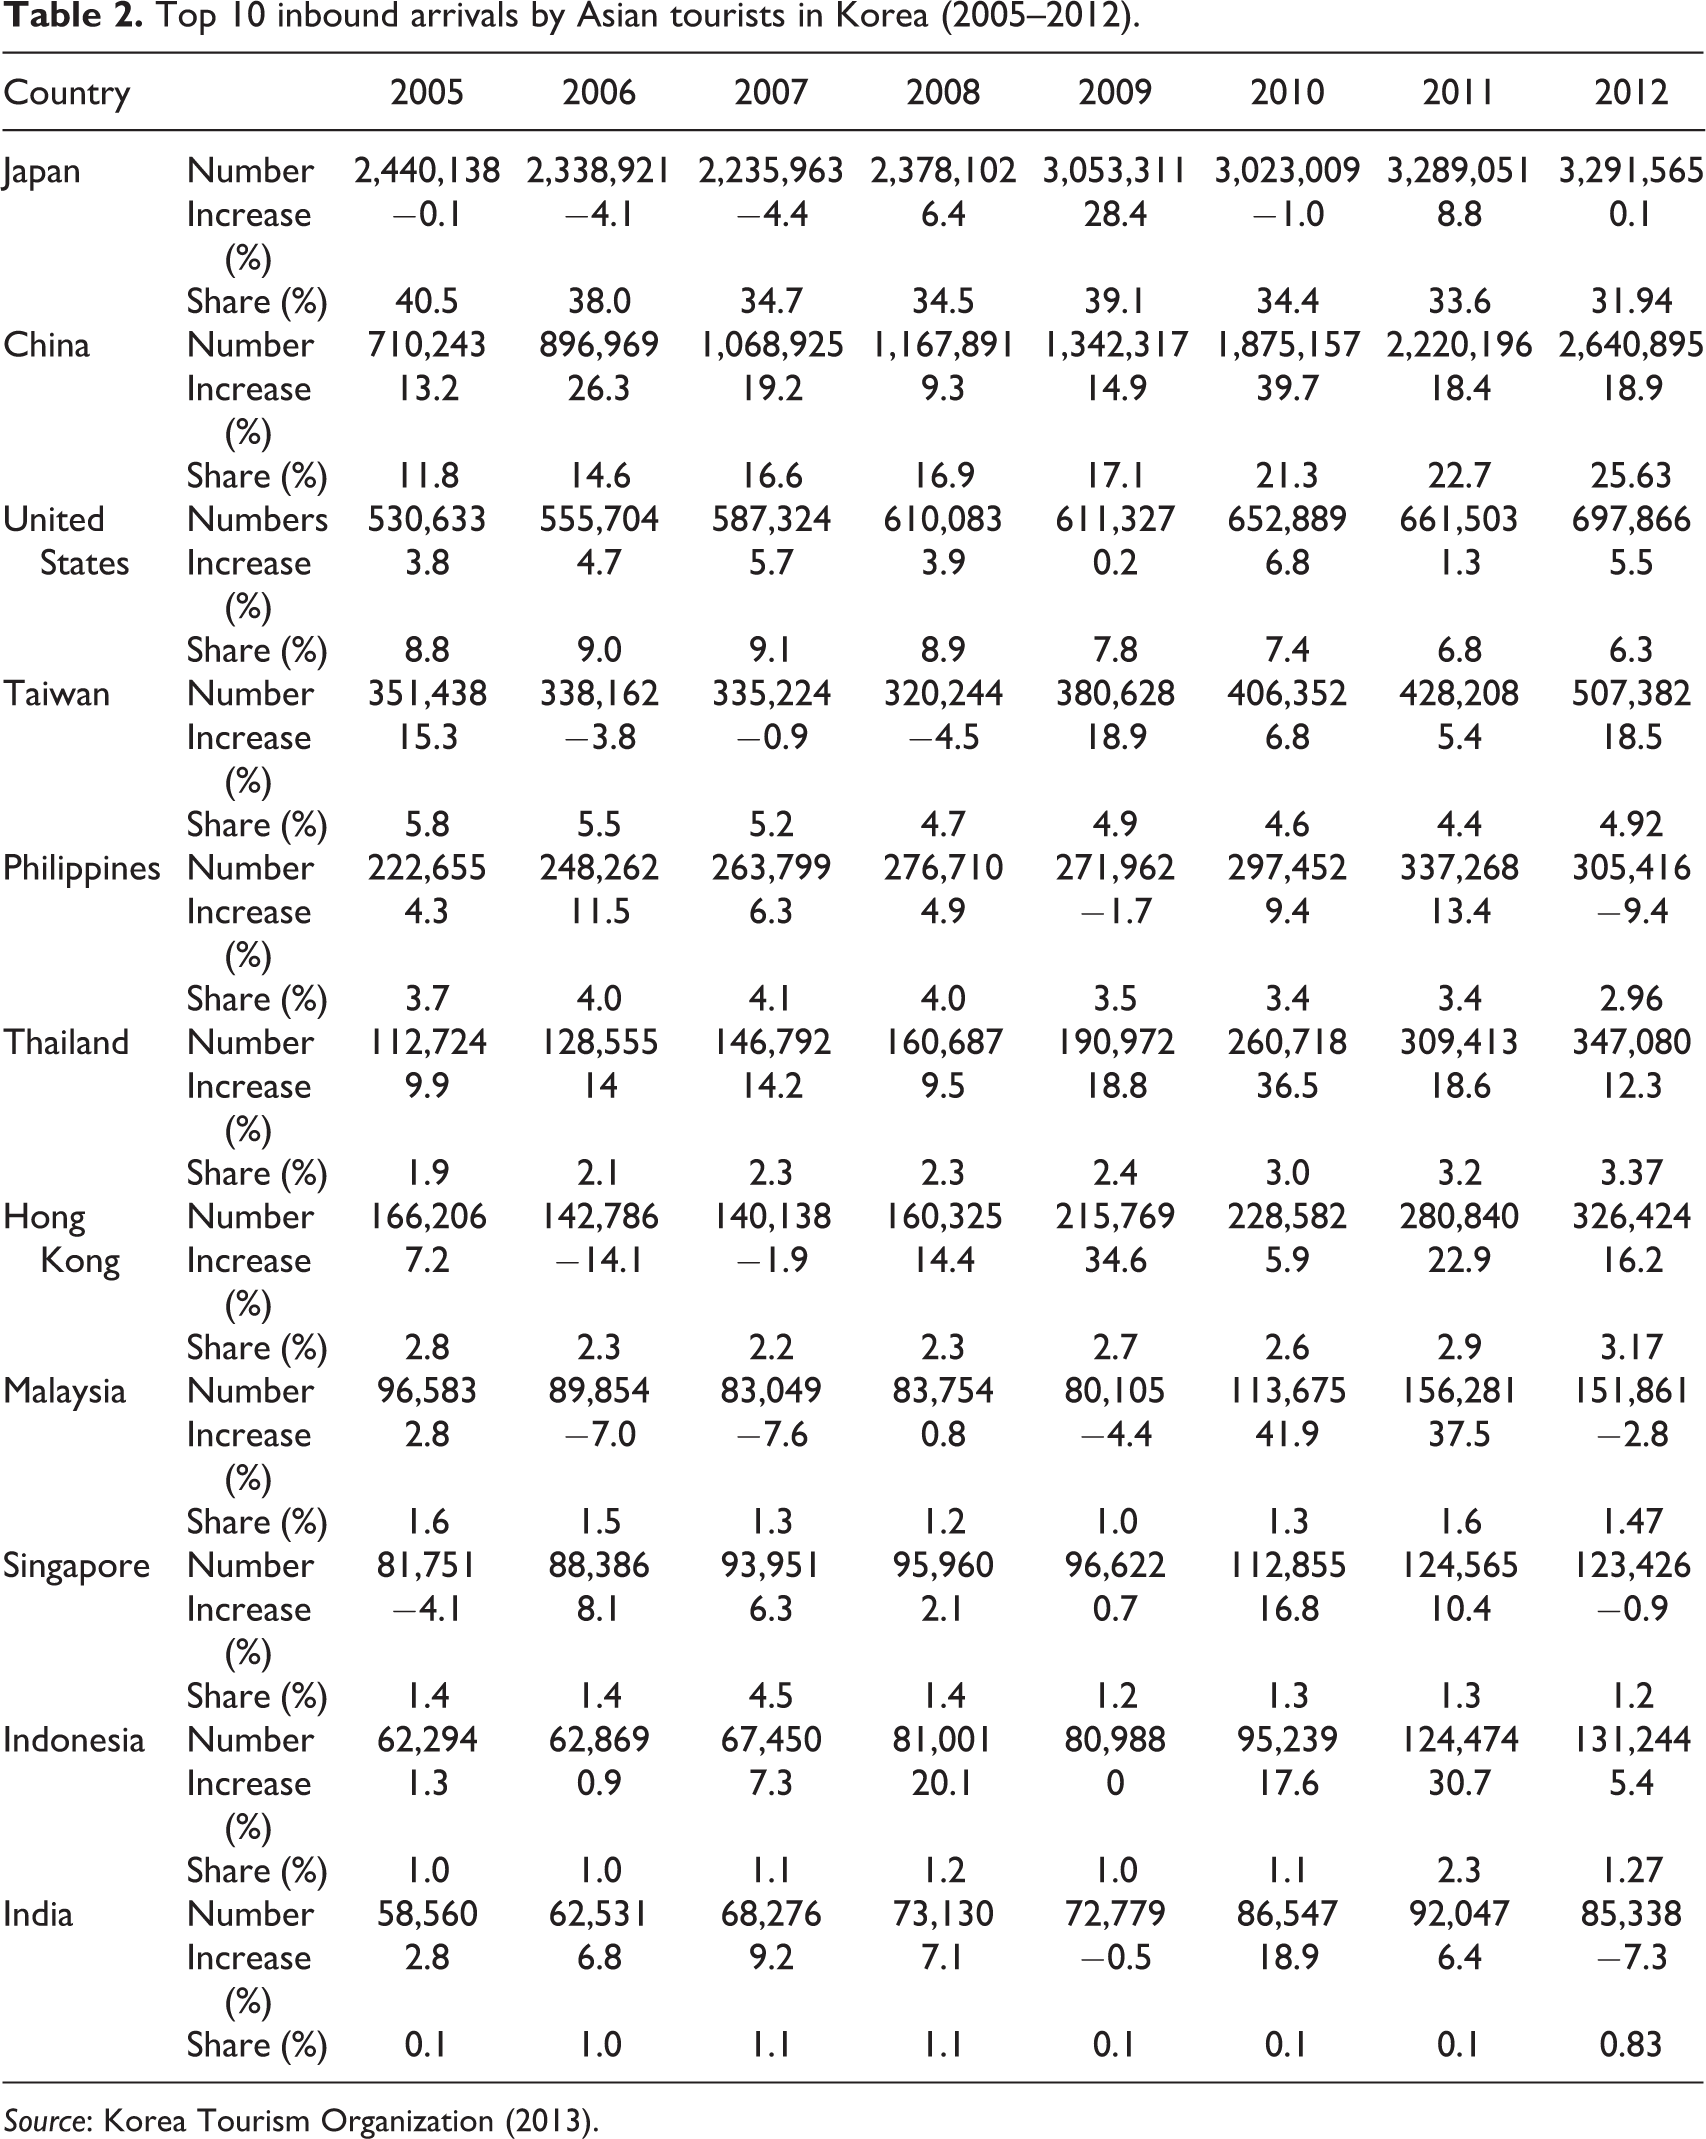
The number of Asian tourist arrivals in Korea grew steadily from 2005 to 2012. Asian visitors comprised about 79.7% of the total international visitation to Korea in 2012 (about 8.2 million), an increase of 7.2% over the previous year (Table 1). The top 10 source country markets in 2012 were Japan, Mainland China (including Hong Kong), the United States, Taiwan, Thailand, the Philippines, Malaysia, Russia, Indonesia, and Singapore (Table 2 and Figure 1). There were 3 million tourists from Japan (the top country in the list), corresponding to a 31.9% market share, followed by Mainland China, with about 2.6 million tourists (25.6% of market share). There has also been a recent increase in inbound tourists from other Southeast Asian countries, notably, Thailand, the Philippines, Singapore, and Indonesia. Tourism demand from Muslim countries to Korea has been increasing particularly fast, including from Malaysia and Indonesia. Malaysian visitation grew strongly between 2010 (a 41.9% increase over the previous year) and 2011 (a 37.5% increase over the previous year). Indonesian arrivals have also recorded substantial increases of 17.6% in 2010 and 30.7% in 2011.
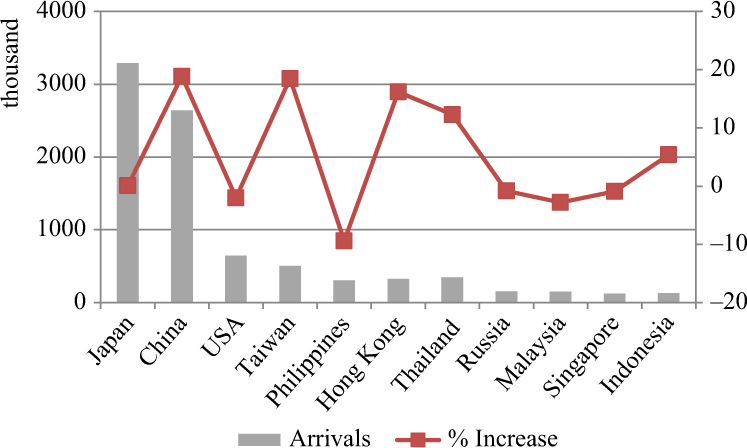
Top 10 tourist arrivals by country in 2012. Source: Korea Tourism Organization (2013).
Korea’s international arrivals by region (2005–2012).

Source: Korea Tourism Organization (2013).
Top 10 inbound arrivals by Asian tourists in Korea (2005–2012).
Source: Korea Tourism Organization (2013).
To highlight the significance of adherence to Islam in tourism movements, Malaysia should be placed within the wider context of Asia in general and of Southeast Asia in particular. Malaysia formally adopted Malay as its official language and Islam as its official religion following independence in 1957. There are three predominant ethnic groups, namely, Malay Muslims (henceforth referred to as ‘Malays’), Chinese, and Indians. The Malays, Malaysia’s largest ethnic group (about 58% of the population), are people of Malay descent who practice Islamic and Malay traditions and speak Malay (Malaysia Tourism Authority, 2011). There are a variety of reasons for treating the Malaysia inbound market separately. First, to date, most tourism research has focused on major international markets such as Japan, Mainland China, and the United States. However, the potential of the Muslim tourism market merits attention on the basis of the worldwide growth trends in the Muslim population (Battour et al., 2012). In 2010, the Muslim population constituted 1.61 billion or about 23.4% of the world’s population of 6.9 billion. Furthermore, 62% of the Muslim population resides within the Asia-Pacific region (Pew Research Center’s Forum on Religion and Public Life, 2011). Second, Malaysia is the wealthiest Muslim country in Southeast Asia as well as the opinion leader among the region’s Muslim population. Thus the increasing trend among Malaysian tourists to travel overseas may herald tourism increases from other Muslim countries. Third, Malaysia accounts for the largest number of arrivals to Korea from the 57 member countries of the Organization of Islamic Cooperation (OIC) (SESRIC, 2010). The number of Malaysian arrivals increased substantially by 41.9% and 37.5% in 2010 and 2011, respectively, though it decreased by 2.8% in 2012.
Fourth, tourism has been one of the 10 priority industrial sectors for OIC member cooperation since 1994. The staging of Islamic conferences of tourism ministers and a number of group meetings and seminars on tourism development have fostered active tourism cooperation (Pew Research Center’s Forum on Religion and Public Life, 2011). Given the relatively active network of OIC member countries, Malaysia’s Muslim tourism market can provide Korea with a bridgehead into the wider and larger Middle East Muslim market (Han and Lee, 2009). Fifth, along with the popularity of Korean pop culture, including K-pop, television (TV) dramas, and movies, Malay intentions to visit Korea are rising (Kim et al., 2007, 2010). Consistent economic, diplomatic, cultural, sports, industrial, and academic cooperation between Korea and Malaysia has stimulated reciprocal travel. Japan, China, and Korea are leaders within East Asia in terms of international economic or diplomatic influence. On this basis, it is suggested that Malays may consider these countries as destinations offering similar brand qualities.
Literature review
The formulation of a successful destination marketing strategy should be based on an understanding of positioning and tourist preferences (Kotler et al., 1993). Researchers have been increasingly interested in destination positioning in general and the evaluation of attractiveness or competitiveness within a multitude of emerging or renovating competitors in particular. In conducting positioning analyses, the first step involves identifying and evaluating competitors. To determine a primary group of competitors, researchers frequently ask visitors about other places that they have considered or visited. Crompton et al. (1992) asked respondents to list other winter destinations that they had visited recently when identifying competitors to the Lower Rio Grande Valley. One approach to identifying destination positioning is to compare the similarities and dissimilarities or strengths and weaknesses of the positioning attributes of the destination, as perceived by potential or actual visitors. The destination attributes that are selected for comparative purposes should possess importance, distinctiveness, and comparability in the context of the destination set (Kotler and Gertner, 2002). Such attributes should be understandable to tourists, affordable, and profitable from a destination perspective (Kotler et al., 2010). Positioning typologies have particular importance in the analysis of destination positioning, because the results of such analyses vary according to the selected items.
Most positioning studies have measured destination positioning through the lens of destination image and/or attributes and features (e.g. Ahmed, 1991; Valls et al., 2009; Dolnicar and Grabler, 2004; Kim and Agrusa, 2005; Pike, 2012; Pike and Ryan, 2004; Qu and Qu, 2011). Destination positioning has also been measured using tourist motivations and benefits sought (Botha et al., 1999; Crompton et al., 1992; Kim et al., 2000), preferred visitor activities in a destination (Chen and Uysal, 2002), constraints (Kim et al., 2000), personal value (Pike, 2012), personality (Qu and Qu, 2011), and satisfaction (Ibrahim and Gill, 2005). Based on the differences between applicable destinations as perceived by potential visitors, destination marketers need to understand preferences in the context of perceived needs (Kotler et al., 1993; Morgan and Pritchard, 2001). Such understanding also helps marketers to distinguish a destination from alternatives and to make use of such attributes to attract prospective visitors (Jang et al., 2004). Numerous studies have identified different preferred behaviors or attitudes toward a destination on the basis of sociodemographic variables (Agrusa et al., 2011; Baloglu and Shoemaker, 2001; Kim and Prideaux, 2005; Moscardo et al., 2000), purpose of visit, or preferred tourist activities (Choi and Tsang, 1999; Hsieh et al., 1992; McKercher et al., 2002; Moscardo et al., 2000; Sung et al., 2000). Some articles have identified distinct destination preferences or purchasing destination-based service on the basis of motivations (Andreu et al., 2005; Baloglu and Shoemaker, 2001; Jang and Cai, 2002; Pearce and Lee, 2005; Sirakaya et al., 2003).
Tourist destination preferences may vary on the basis of cross-cultural dimensions (Bahar and Kozak, 2007; Kim and Agrusa, 2005; Kim and McKercher, 2011; You et al., 2000). Different attitudinal tendencies between Asian and Western cultures are also evident in the incidence of payments and giving tips in destination settings (Murray, 1997), communications (Stevens and Brownell, 2000), complaint behaviors (Huang et al., 1996), satisfaction, and expectation levels (Bahar and Kozak, 2007; Kim and McKercher, 2011; Kivela and Chu, 2001). The evidence that cultural or national backgrounds influence tourist preferences is convincing because tourists develop familiarity with social or cultural practices by learning or absorbing language, history, philosophy, ideology, or religion (Chong, 2008; Testa, 2002). The above findings are congruent with the influence of social norms or religion on destination preferences (Bagozzi et al., 2001; Sparks and Pan, 2008). Chinese customers evidently tend to move in groups or talk loudly when with their compatriots. When they are choosing gifts, Chinese tourists tend to consider their relationships with family, coworkers, or superiors. On this basis, their preferences are likely to reflect Chinese social norms such as face-saving and collectivism. On the other hand, Muslims who are traveling may prefer destinations with a mosque or facility that incorporates a prayer room.
Already accounting for 23.4% of the world population according to the 2010 data, the Muslim population is predicted to increase, making up 26.4% of the world population of 8.3 billion by 2030 (Pew Research Center’s Forum on Religion and Public Life, 2011). Of all Asia-Pacific residents, 24.8% are Muslims (Pew Research Center’s Forum on Religion and Public Life, 2011). Despite the growing significance and potential of the segment, few researchers have focused on Muslim tourists which is compared with the prolific literature on American, Chinese, and Japanese tourists. While addressing this gap, the current study intends to stimulate interest in the attitudinal disparities of Muslim tourists based on their sociodemographic, cultural, and gender characteristics.
Methodology
Conceptualization
The conceptual framework of the study is shown in Figure 2. To evaluate a tourism destination, it is necessary to measure brand equity and identify tour products that will appeal to specific tourist groups. For the purpose of the present study, destination brand equity was conceptualized as a combination of brand image, brand awareness, brand association, and brand loyalty. The concept of brand equity was derived from the studies that have adapted Keller’s (1993) customer-based brand equity model for tourism settings (Boo et al., 2009; Im et al., 2012; Konecnik and Gartner, 2007) and hospitality. Unlike brand equity, which indicates cognitive or emotional evaluation of a destination, it is important to investigate preferences for the product-related characteristics of a destination. This involves assessing preferred tour products in a destination to demonstrate more precise understanding of the destinations preferred by Malaysian Muslim tourists. Tour product features included variables such as preferred tour type, length of stay, food, accommodation, and preferred gift purchases. The variables specify assessments of actual tour products in China, Korea, and Japan, where Malaysian Muslim tourists prefer to travel.

Conceptualization of this study.
Measurement
This study has been developed carefully to achieve the research objectives, namely, to explore emerging destination brand positioning typologies, to compare three competitive destinations on the basis of identified components, and to identify tourist preferences as regards tourism type, gifts, and provided services. The research design involved the followings stages: (1) the selection of key destination brand positioning components; (2) the generation of a pool of positioning items and exclusion of unrelated items; (3) completion of a survey of Malay perceptions of Korea as a travel destination compared with Japan and China; (4) survey data analysis; and (5) interpretation and discussion of the survey results. The first stage drew extensively from the literature and involved the selection of key destination brand positioning typologies and their associated items as well as items related to tourist preferences. A review of previous destination branding studies revealed several salient components of destination brand positioning, namely destination brand awareness, image, associations, and loyalty (Boo et al., 2009; Cai, 2002; Keller, 1993; Konecnik and Gartner, 2007; Qu et al., 2011; Yoo and Donthu, 2001). The items that indicated tourist preferences toward tourism type, gifts, and services included preferred type of tourism (i.e. independent tour, package tour, or a combination of both), length of stay, preferred food, and preferred accommodation type (Agrusa et al., 2011; Baloglu and Shoemaker, 2001; Jang et al., 2004).
The second stage involved generating a pool of items that apply to the destination brand positioning typologies in visitor perceptions of the three destination countries. As has been recommended by Churchill (2001), a focus group session was conducted. A panel was drawn up consisting of four Muslim participants majoring in Asian studies at a graduate school in Korea and the director of an international broadcasting company who was keenly interested in Muslim tourism and culture. The selection of panelists was based on an initial assessment that participants have a clear understanding of Muslim countries and of Korea. Participants were provided with statements about the image, attributes, and features of Korea as a destination. The focus group sessions generated an initial list of items. These were examined for comprehensiveness and clarity by a panel of five expert judges consisting of tourism and marketing academics and practitioners. A 5-point Likert-type scale was used to measure all items relating to the destination brand positioning typologies (i.e. destination brand awareness, image, associations, and loyalty), where 1 = strongly disagree, 3 = neutral, and 5 = strongly agree. Items indicating tourist preferences toward tourism type, gifts, and services were measured as categorical variables. The procedures noted above generated the following items: 23 image attributes, 3 brand awareness items, 5 brand association items, and 5 brand loyalty items.
Data collection
For the third stage, professional research staff from a marketing agency in Kuala Lumpur, Malaysia, administered an on-site survey in order to investigate visitor perceptions of the proposed positioning attributes and tourist preferences. The target sample consisted of attendees of one of Kuala Lumpur’s largest tourism expositions. The data were collected on-site in the expo hall. The respondents were confined to Muslim citizens aged 18 years or above who were capable of completing the questionnaires in written English. The research method used convenience sampling with respondents being chosen on the basis of their appropriateness for the study, their willingness to complete a four-page long questionnaire, and their interest in the survey. The final step involved asking potential respondents to state their religious adherence. Only those identifying themselves as Muslims were provided with a questionnaire. With a view to increasing the response rate, a key holder embroidered with Korean traditional motifs was offered as a gift for each completed questionnaire. Following the exclusion of questionnaires with multiple missing or insincere answers, 326 usable questionnaires were finally collected out of the 750 distributed, yielding a 43.4% response rate.
Data analyses
The data set was subject to further analyses, including descriptive analysis, factor analysis, paired t tests, and χ2 tests. A series of factor analyses was conducted with a view to identify the underlying domains of the four destination brand positioning constructs (i.e. brand image, awareness, association, and loyalty). Paired t tests were conducted to identify the mean differences between the set of three competing tourism countries (i.e. China, Japan, and Korea). χ2 Tests were then applied to explore statistically significant associations between the demographic variables and tourist preferences.
Results
Demographic profile
According to the analysis of frequencies, 65.4% were female and 63.4% were married. About 77% were in their 20s and 30s, and 68.0% were college graduates. The inclusion of those in their 20s may reflect interest in overseas travel on student group tours, honeymoon tours, study abroad programs, and pleasure tours with company workers before marriage. About 73% were employed; 20.2% were students, 14.6% company employees, 16.1% professionals, and 13.7% were management. The highest percentage was accounted for by those with incomes of Malaysian ringgit (MYR) 2000 or below (27.6%) and between MYR 2001 and 3000 (21.6%). The respondents emanated roughly equally from rural and urban areas. About 88% of the respondents had not previously visited Korea. The researchers consider the sample as appropriate to the study for the following three reasons. First, it reflects the increasing population of potential Malaysian Muslim tourists to Korea. Second, given that this study aims to identify the components of brand equity and feelings in relation to the three relevant countries, it may be assumed that respondents with no travel experience to Korea, China, and Japan will have similar profiles. A frequency check of respondents reporting no travel experience to the three countries revealed similar percentage values of 88%, 90%, and 87% for Korea, China, and Japan, respectively. On this basis, few respondents would be expected to have complex images accumulated after actual travel to the relevant destination. Finally, there was no evidence of skewness regarding the proportions of the categories of demographic variable (e.g. occupation, average household income, age, or living community size). As a result, this sample contained various characteristics of the population.
Factor analysis and reliability tests
Table 3 reports the findings of the factor analyses of items associated with the four brand positioning constructs. The brand image construct consisted of 23 items, and the factor analysis yielded six underlying domains with eigenvalues greater than 1.0. Varimax rotation was employed to maximize the variances of the factor loadings, and the scree plot figure revealed eigenvalues were greater than 1.0 for all six factors. The six-factor solution model explained 59.44% of the variance. The Kaiser–Meyer–Olkin (KMO) measure of sampling adequacy was 0.87, thus validating the outcome of the factor analysis to extract the factor structure. Barlett’s test of sphericity ascertained the existence of all brand image factors. This yielded a value of 0.82 (p = 0.000), indicative that one or more factors existed in the factor structure.
Factor analysis and reliability test results (N = 326).

Note: Items were measured on a 5-point Likert-type scale (1 = strongly disagree, 3 = neutral, 5 = strongly agree).
The reliability αs within the six domains were 0.80, 0.86, 0.67, 0.68, 0.63, and 0.68, respectively. This specific range of 0.63–0.80 exceeded the criterion (0.60) that was recommended by Allen and Yen (1979), indicative of high internal consistency of items within each domain. Meanwhile, factor loading assesses the correlation between observed measurements and factors, and in interpreting derived factors, the values are classified as fair or above when they exceed 0.45 (Comrey and Lee, 1992). On the basis that the factor loading values for all 23 items were greater than 0.45, they satisfied Comrey and Lee’s (1992) criterion. The mean values for all individual items showed a range of 2.75–4.07, whereas the grand means for the six image domains were 4.01, 2.90, 3.91, 3.59, 3.51, and 3.27, respectively. Interestingly, the lowest grand mean value (2.90) was recorded for ‘access to Muslim culture’, whereas the highest grand mean value (4.01) was recorded for ‘tourism facilities and attractions’.
Factor analyses were also conducted to assess the underlying dimensionality of the following constructs: brand awareness (3 items), brand association (5 items), and brand loyalty (5 items). The results of the factor analyses produced a single-factor solution structure in which only one factor had an eigenvalue greater than 1.0. The three constructs accounted for 62.60%, 57.41%, and 57.61% of the variance, respectively. The KMO measures of sampling adequacy for the three constructs were 0.67, 0.78, and 0.82, respectively. It is evident that the values confirmed a high validation of the factors. The results of the reliability α measurements to check the internal consistency of each construct were 0.70, 0.81, and 0.85, respectively. Conclusively, the three constructs confirmed the characteristic of unidimensionality.
Brand positioning perceptions of the three destinations
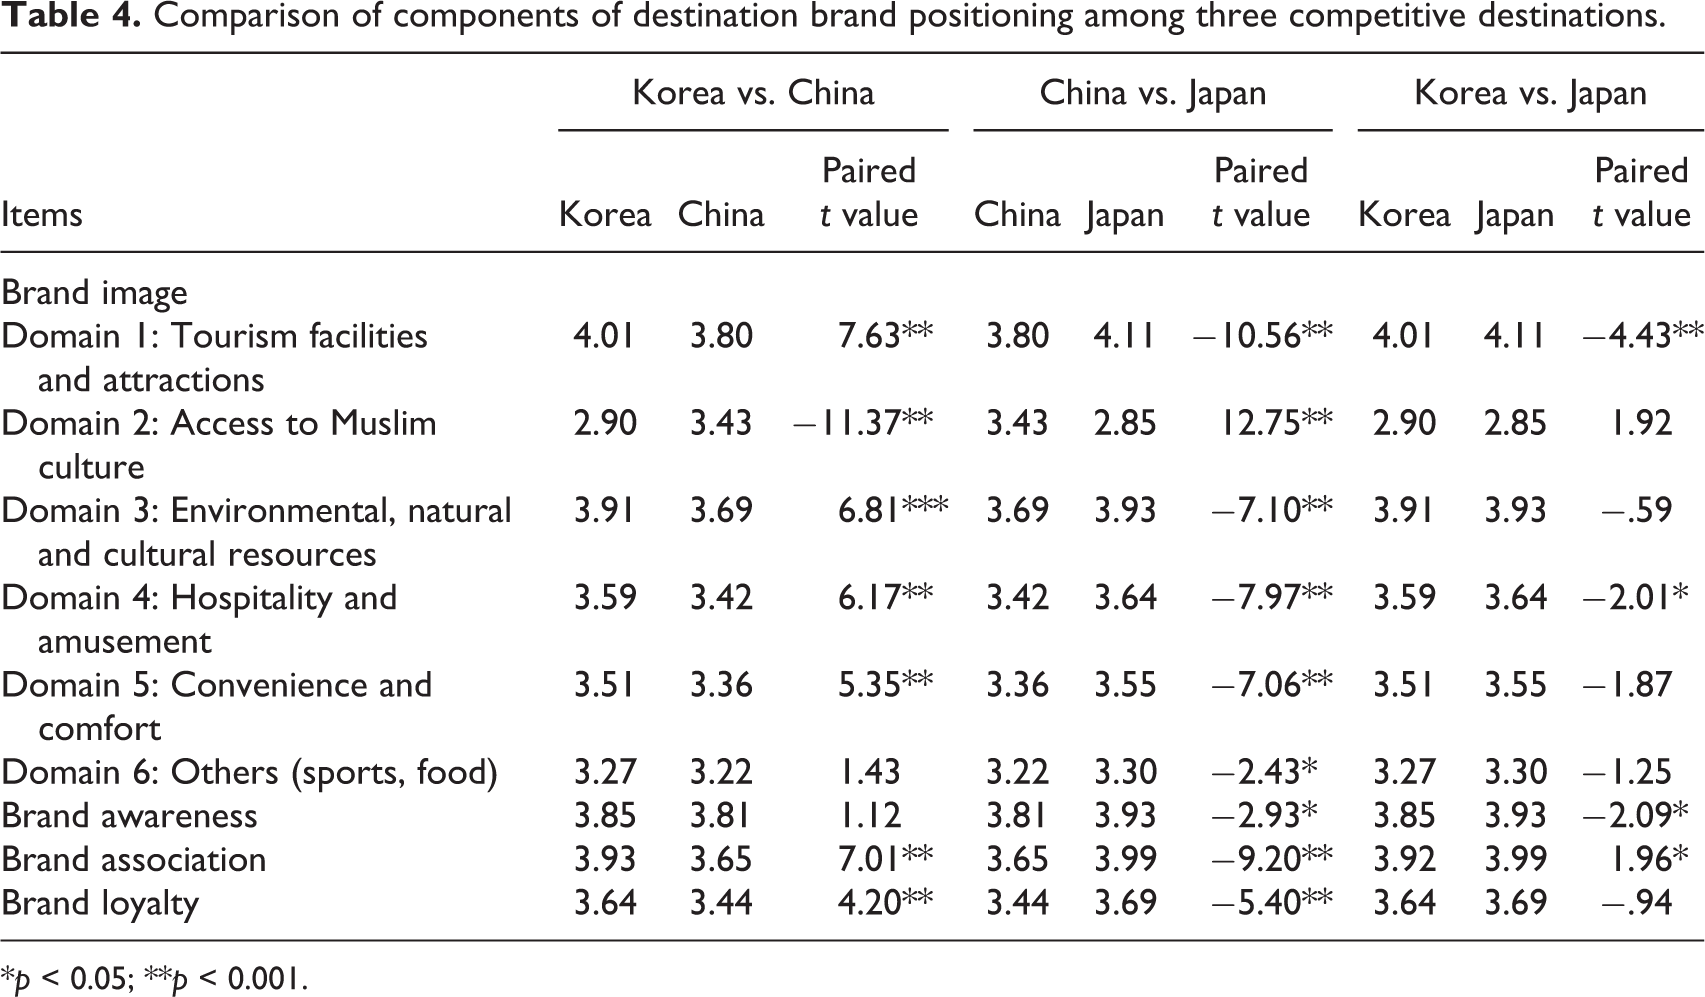
The next step involved comparing three pairs among the competitive destinations. Paired t tests were conducted to explore whether significant differences existed between Korea and China, between China and Japan, and between Korea and Japan regarding the identified destination brand positioning domains (i.e. brand image, brand awareness, brand association, and brand loyalty; Table 4). First, regarding brand image, significance was found on five of the six brand image domains at the 0.001 level. Respondents’ impressions were more favorable for Korea than for China in terms of ‘tourism facilities and attractions’, ‘environmental, natural, and cultural resources’, and ‘hospitality and amusement’. However, respondents indicated more brand image attributes for ‘access to Muslim culture’ and ‘convenience and comfort’. No significance was identified in comparing the brand awareness applicable to Korea and China, perhaps indicative of an absence of distinction between Korea and China. The mean scores for Korea around brand association and brand loyalty were higher than those reported for China. This suggests that Korea was perceived as loyal and a better service provider than China.
Comparison of components of destination brand positioning among three competitive destinations.
*p < 0.05; **p < 0.001.
Relative to China, Japan reported higher mean scores in domains such as ‘tourism facilities and attractions’, ‘environmental, natural, and cultural resources’, ‘hospitality and amusement’, ‘convenience and comfort’, and ‘others’. Conversely, respondents exhibited stronger associations with ‘access to Muslim culture’ for China than for Japan. Respondents indicated that Japan had higher brand awareness, brand association, and brand loyalty than China. They appeared to view Japan as better known and as more capable of providing quality tourism services. This led to relatively greater loyalty toward Japan as a destination. Compared with Korea, higher mean scores were reported for Japan on ‘tourism facilities and attractions’ and ‘hospitality and amusement’ domains. Respondents also gave higher mean scores to Japan on brand awareness and association. The results are presented in Table 4 and Figures 3 and 4.
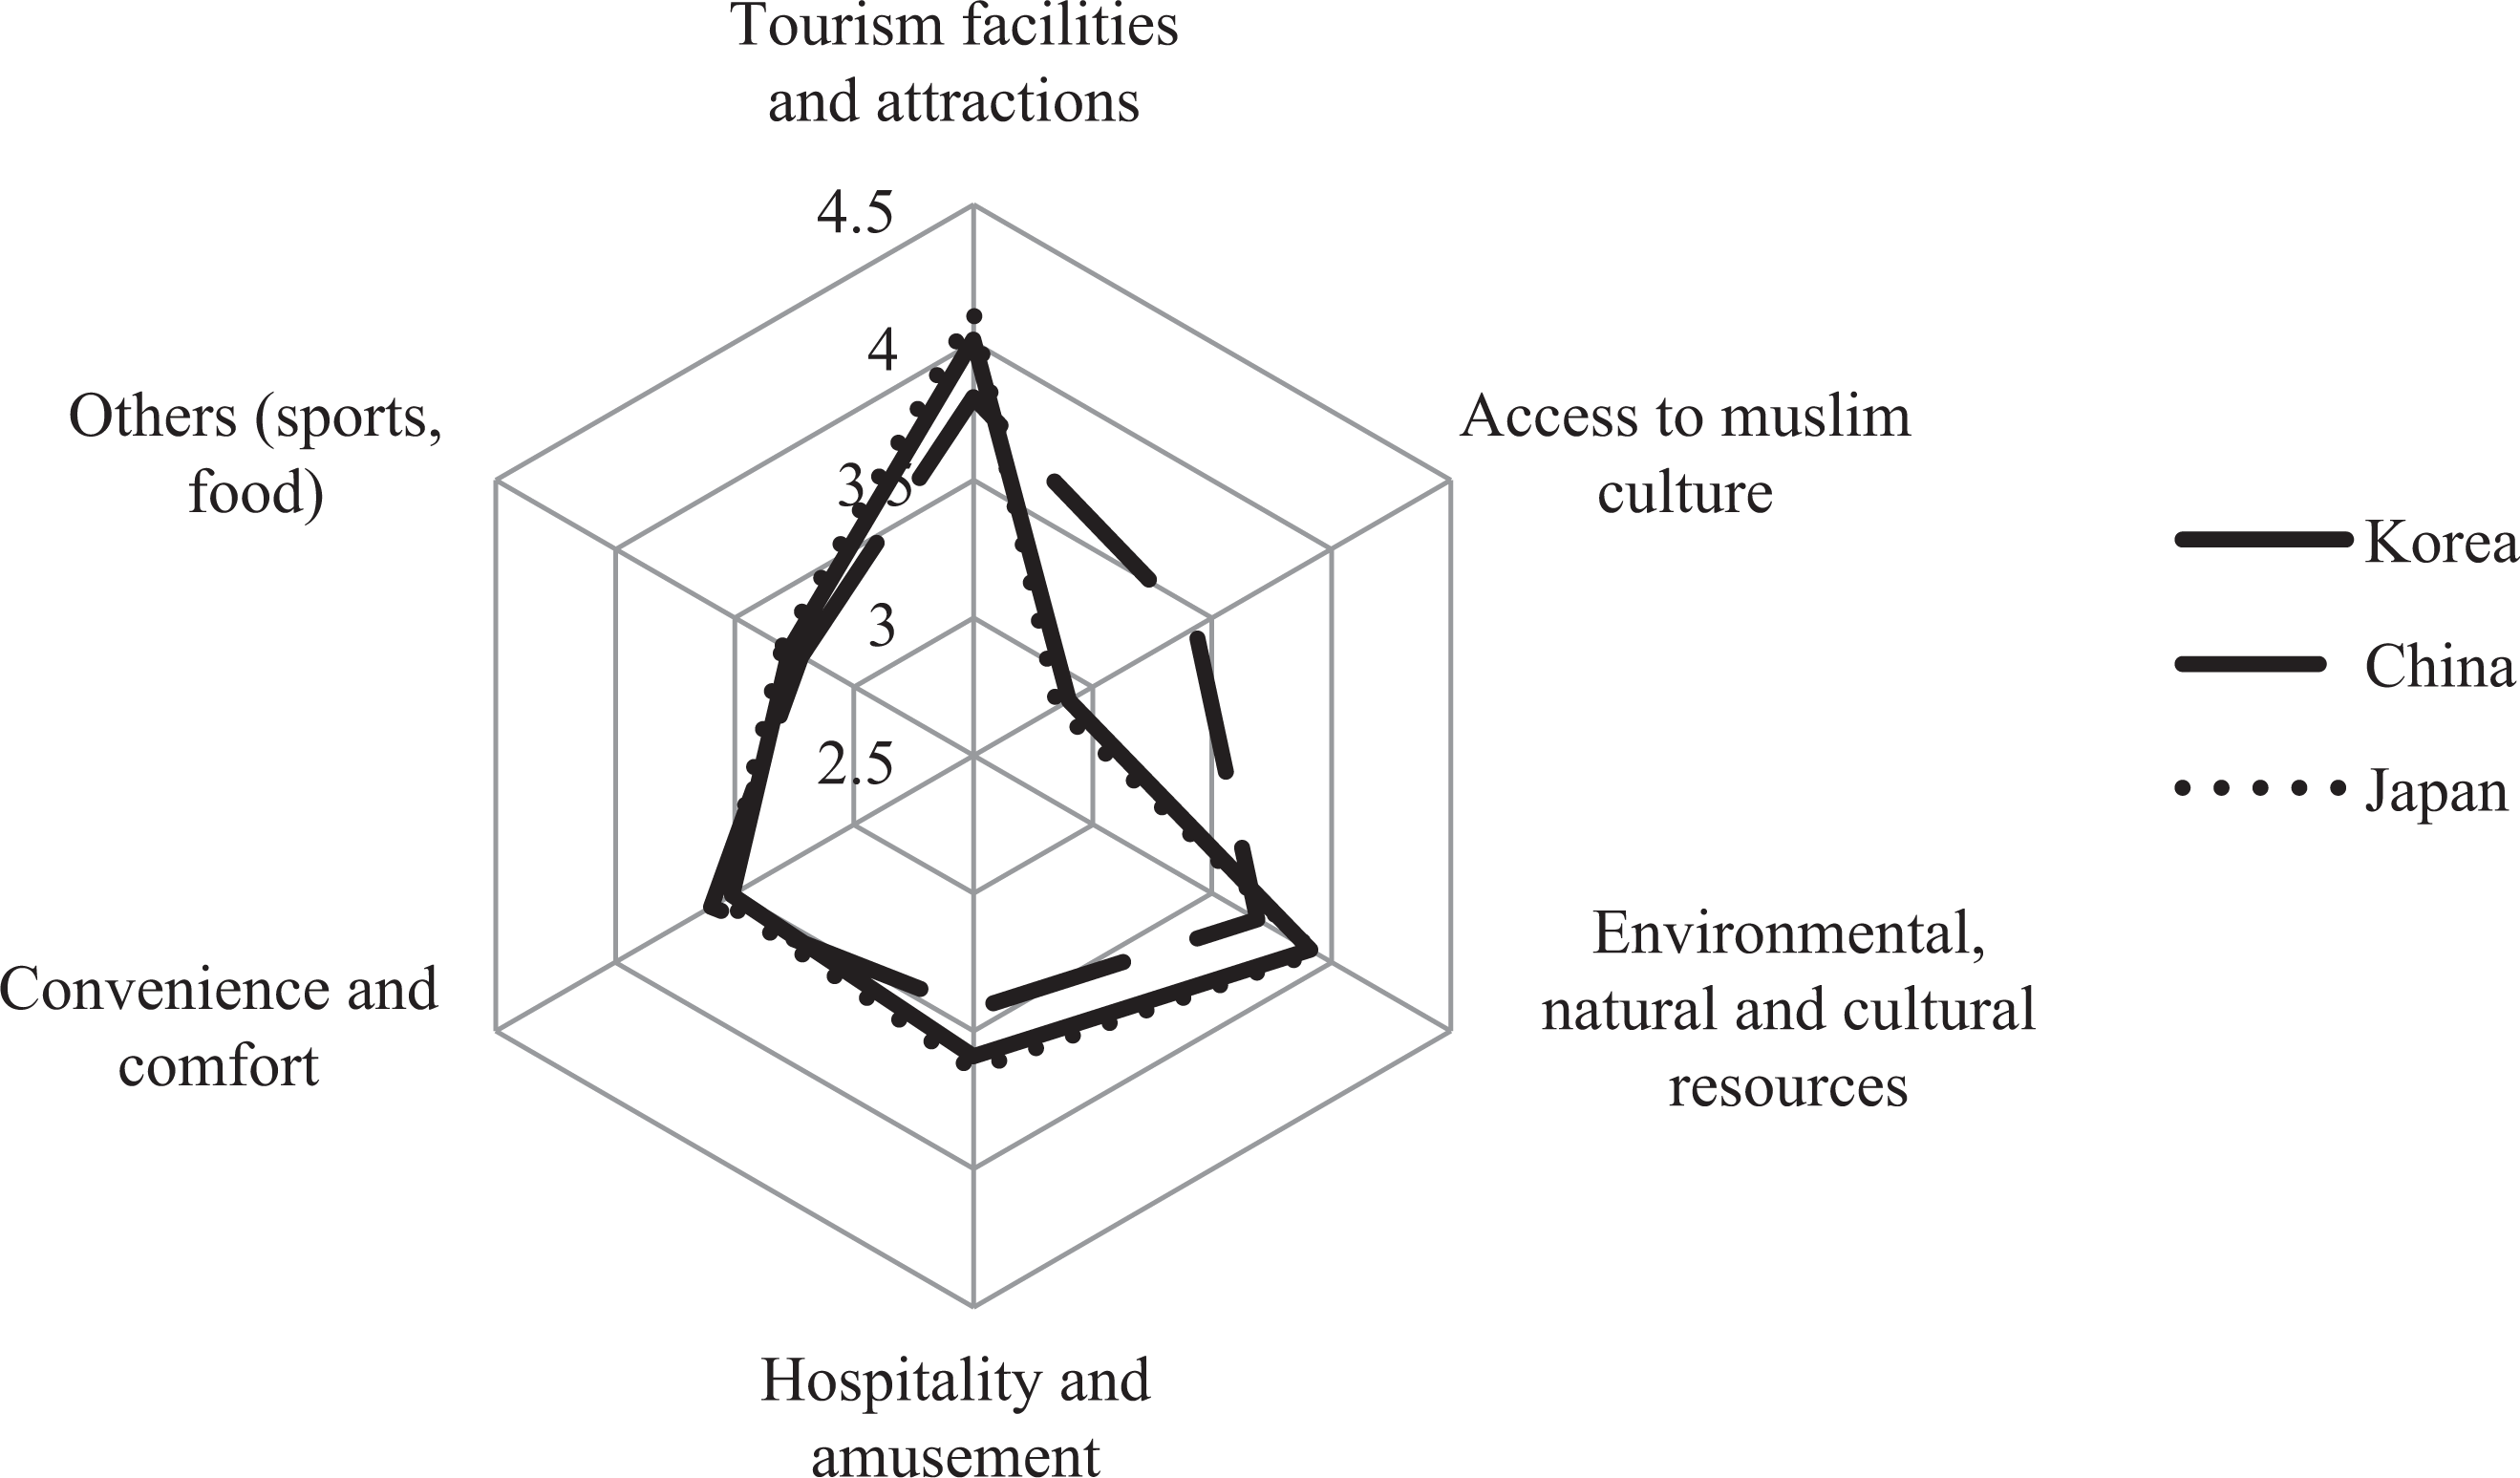
Comparison of brand image among three competitive destinations.
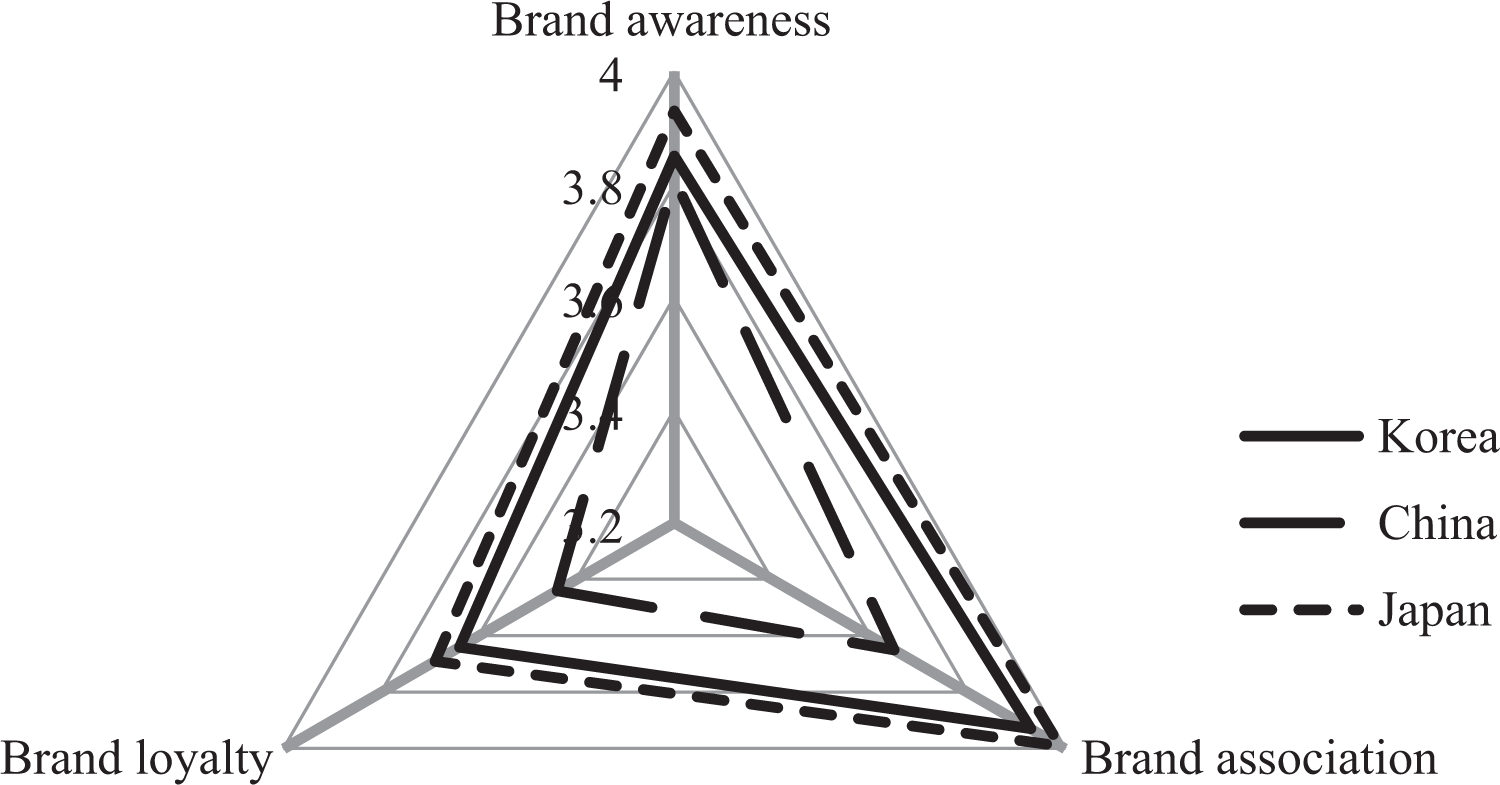
Comparison of brand awareness, brand association, and brand loyalty among three competitive destinations.
Emotions about the three destinations
When comparing the mean scores for emotional feelings toward Korea and China, 2 of the 5 relevant items were significant. Respondents perceived Korea as more peaceful and exciting than China. Of the 3 significant items that were identified between emotional feelings toward China and Japan, higher mean scores were reported for the following perceptions‘emotional’, ‘peaceful’, and ‘exciting’. When the mean scores for emotional feelings toward Korea and Japan were compared, 4 of the 5 emotional items were found to be significant. Japan was perceived to be more emotional, familiar, peaceful, and exciting. The results are shown in Table 5 and Figure 5.
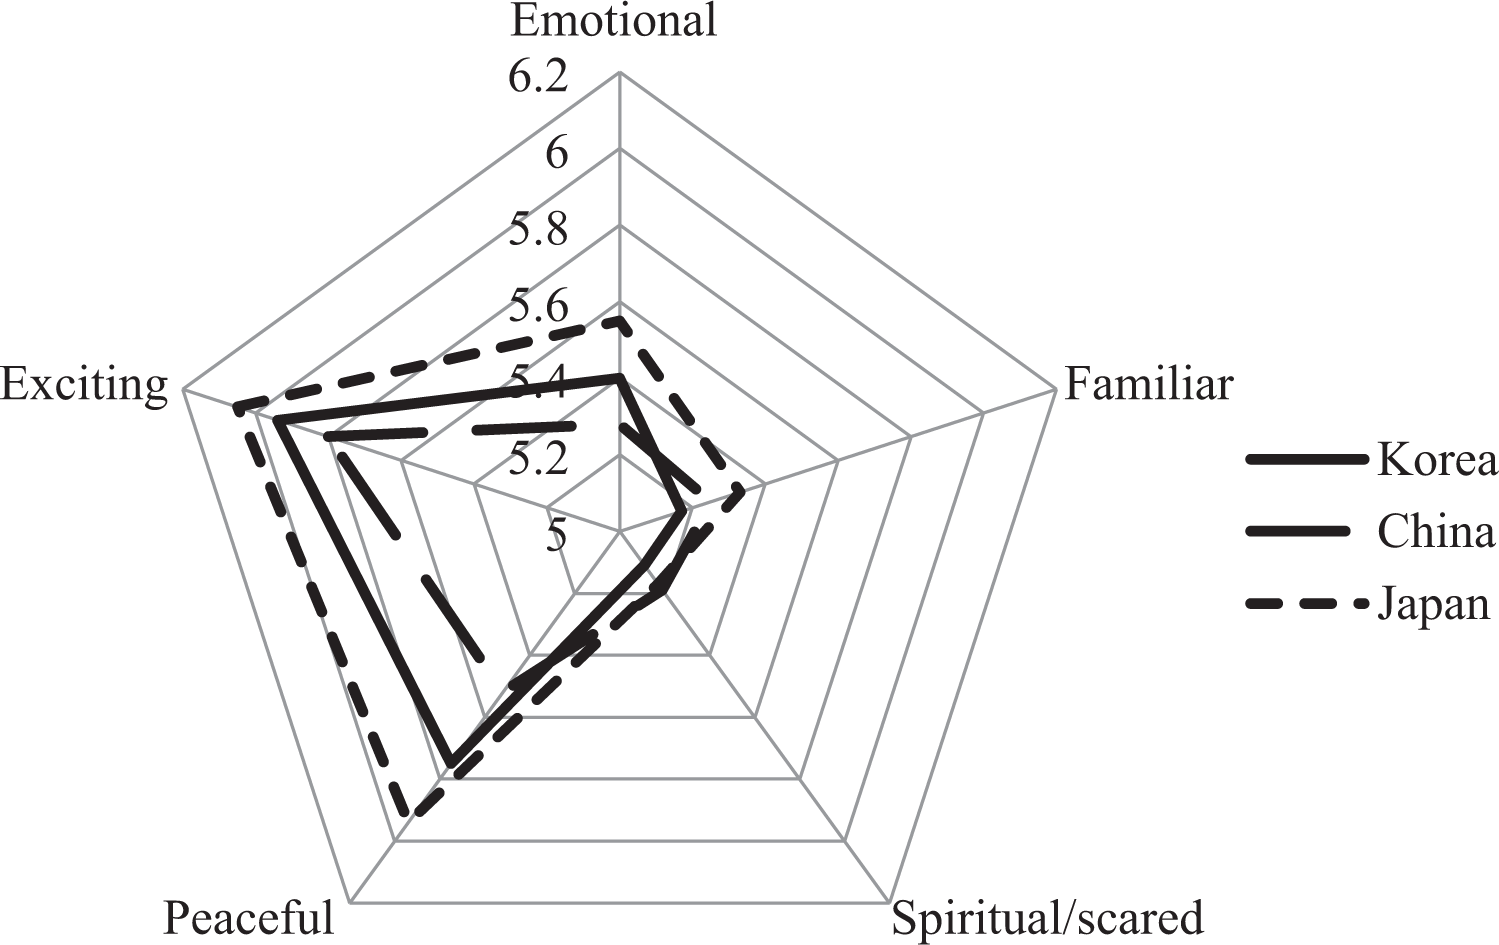
Comparison of emotional feelings toward three competitive destinations.
Comparisons of emotional feelings toward three competitive destinations.
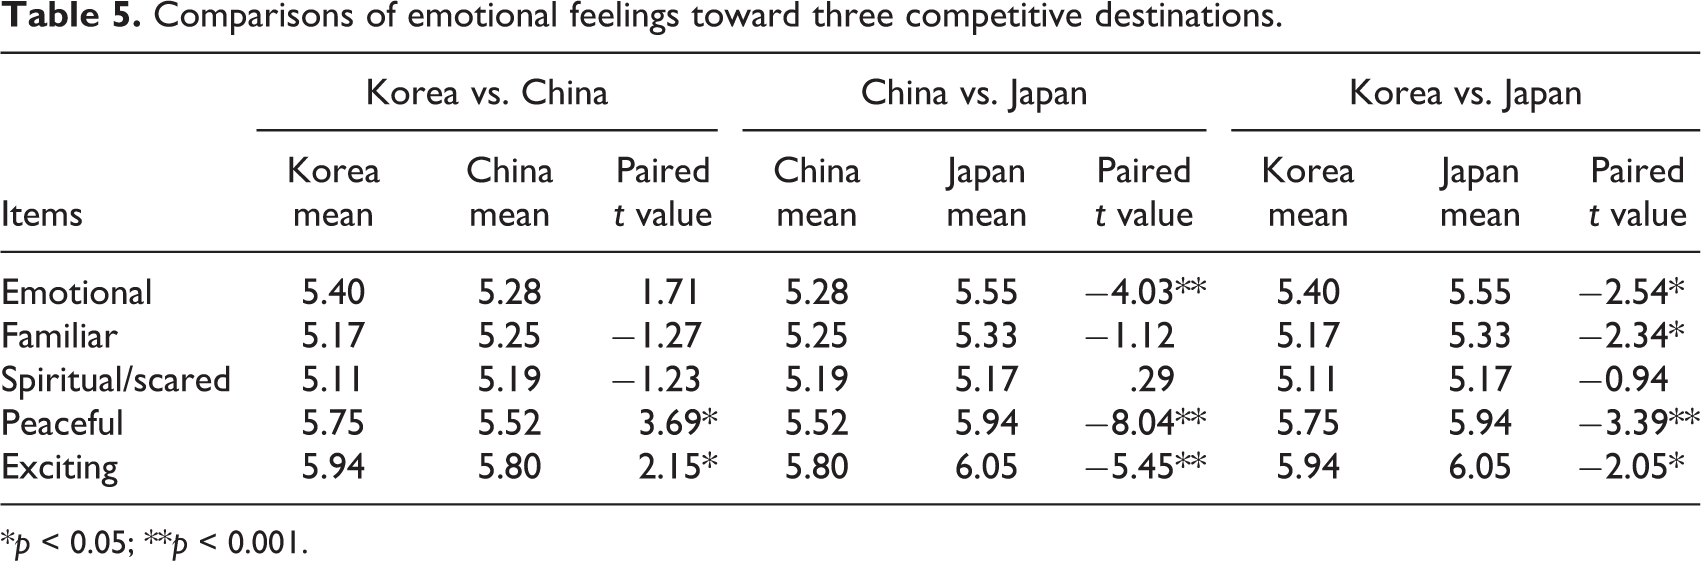
*p < 0.05; **p < 0.001.
Factors considered in deciding on a destination
Of the factors that respondents considered when determining their preferred destination, the highest mean score (4.32) was reported for ‘environmental, natural, and cultural resources’, followed by ‘access to Muslim culture’ (4.28), ‘convenience and comfort’ (4.24), ‘tourism facilities and attractions’ (4.12), ‘hospitality and amusement’ (3.86), and ‘others’ (3.48).
Preferred tourist characteristics according to sociodemographic variables
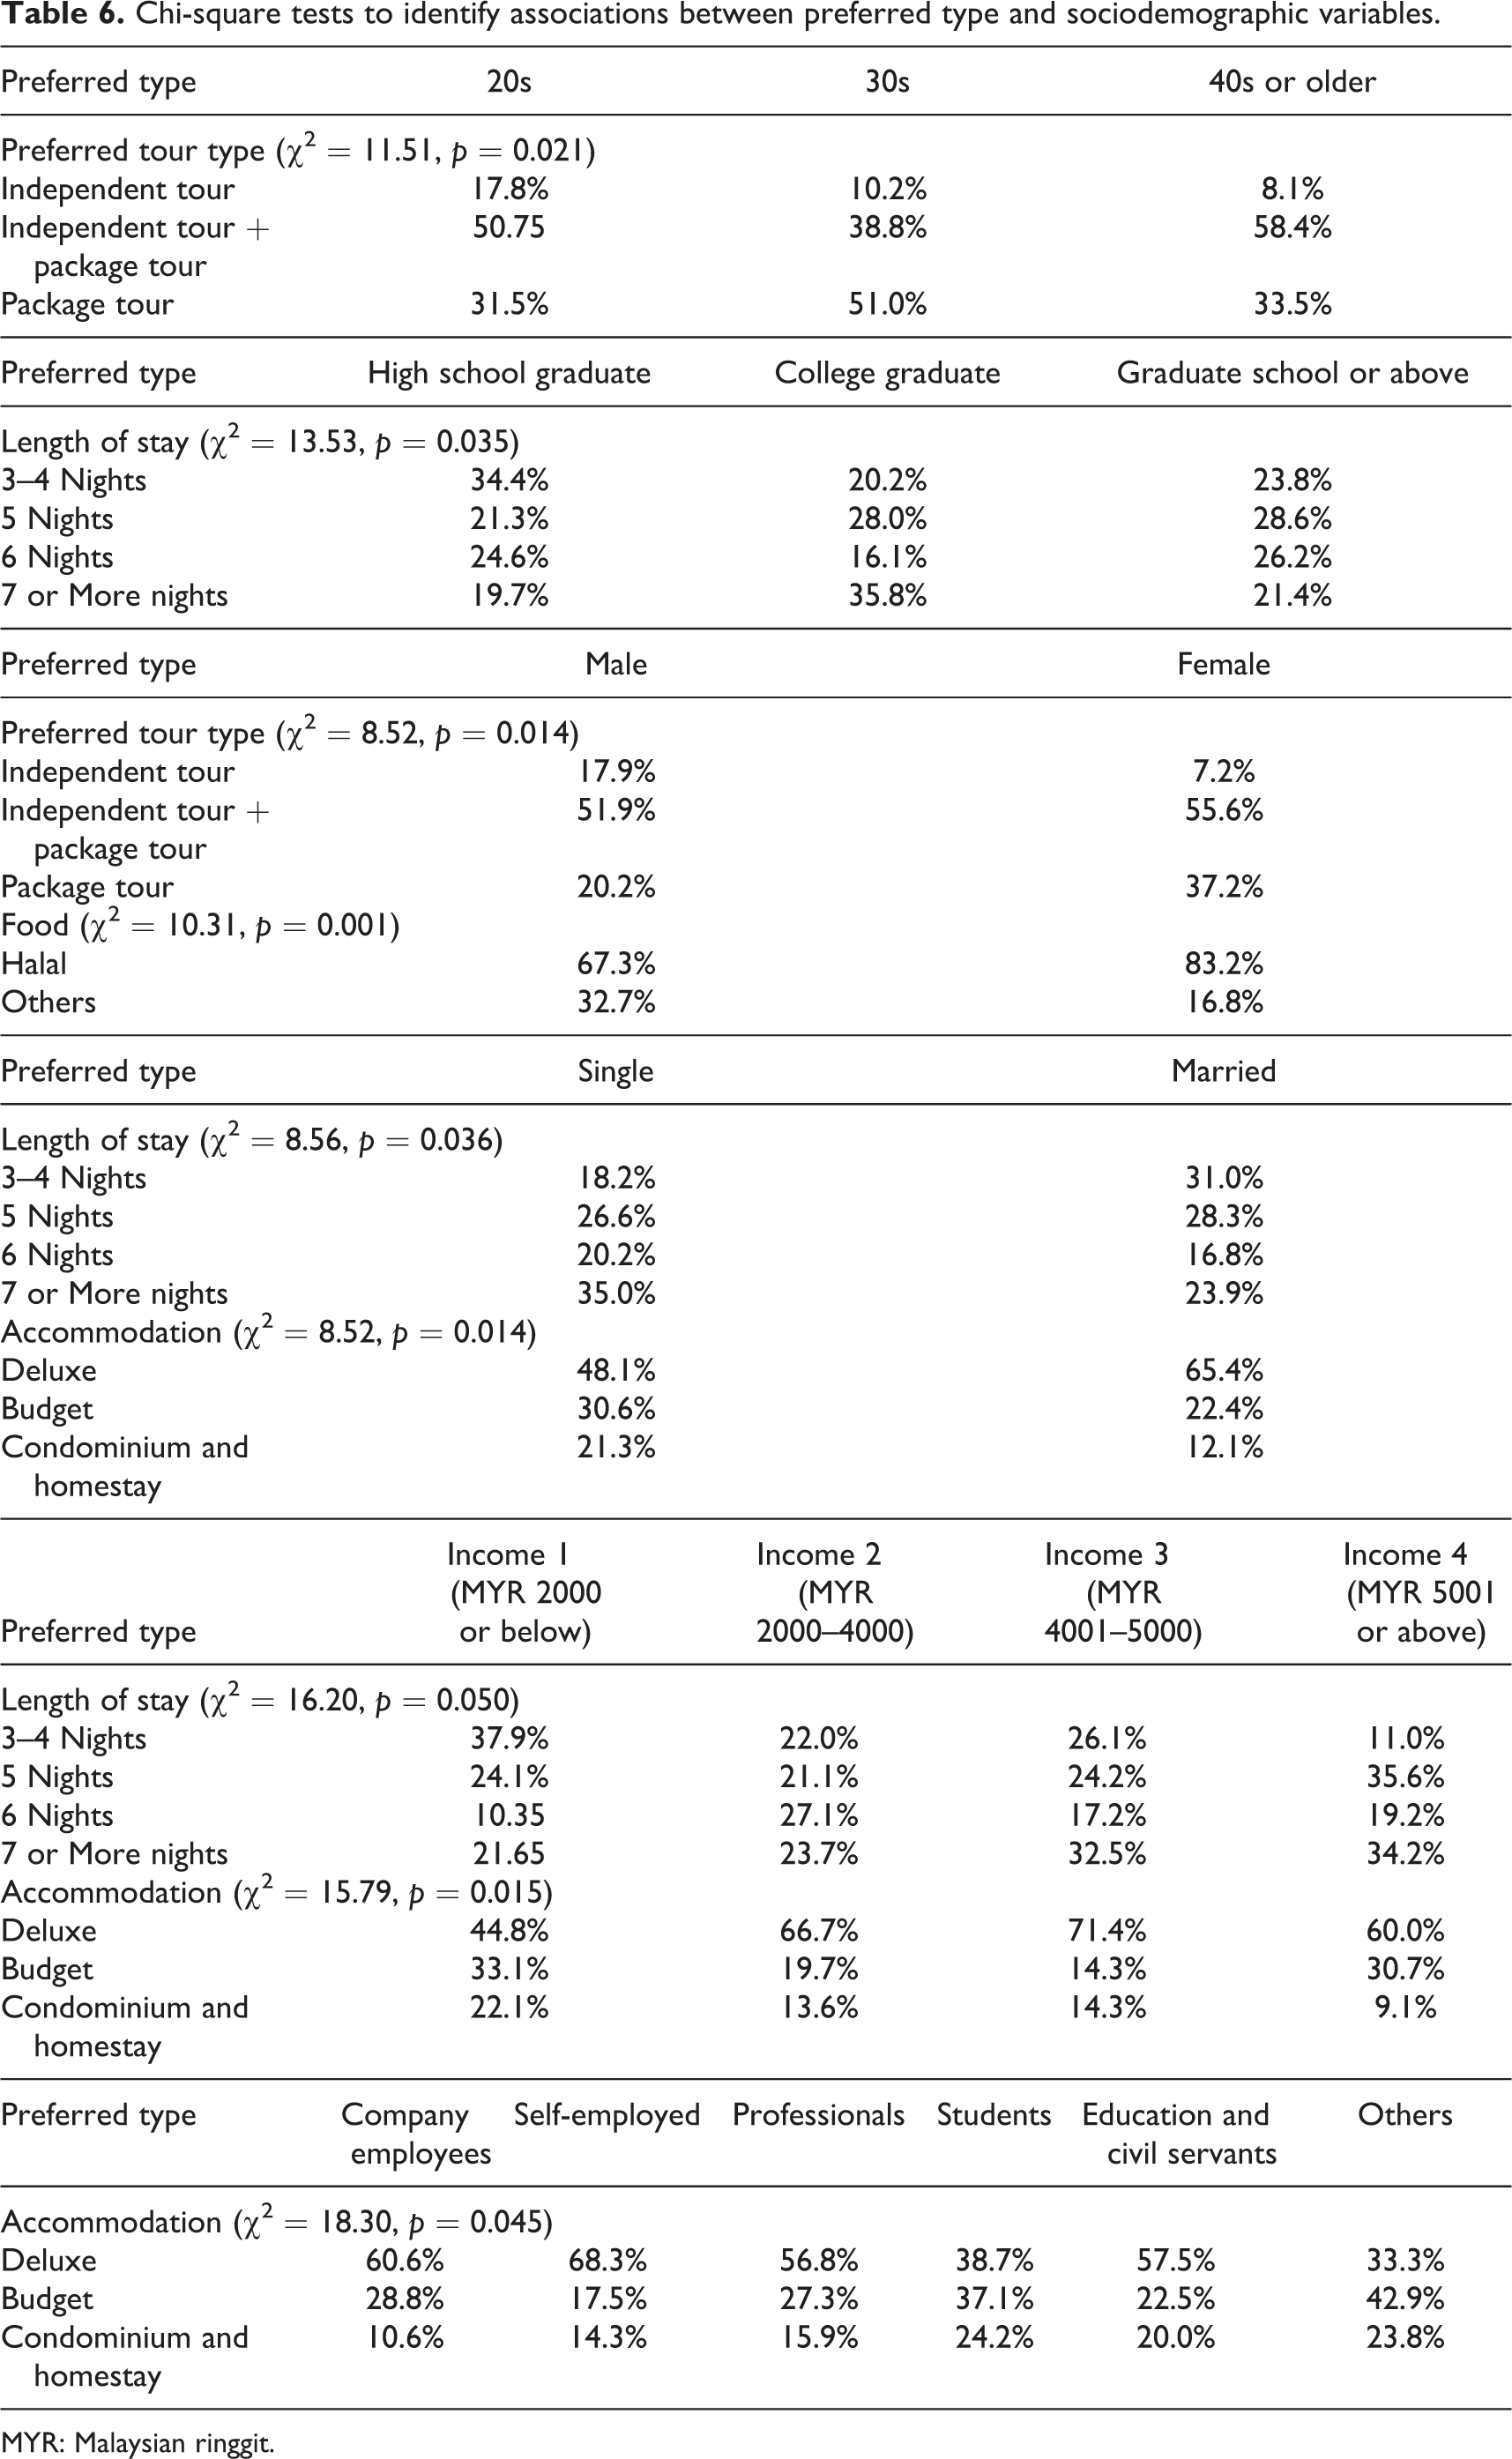
As reported in Table 6, the researchers tested for associations between preferred tourism characteristics and sociodemographic variables. The variables used for the preferred tourism characteristics included type of tour, length of stay, accommodation, season, and food. The sociodemographic characteristics included age, gender, marital status, educational level, income level, and occupation. χ2 Tests were conducted to identify associations between preferred tour type and age, which yielded significance at the 0.05 level (χ2 = 11.51, p = 0.021). It was found that the respondents in their 20s had stronger preferences for independent tours than other age-groups, whereas the oldest segment was least favorably disposed to independent tours. Significance was found (χ2 = 13.53, p = 0.035) at the 0.05 level when analyzing the preferred length of stay and educational level. Relative to other educational groups, high school graduate respondents preferred stays of three to four nights and least preferred stays of seven or more nights. The χ2 tests for any associations between gender and preferred type of tour and food indicated respective significance at the 0.05 and 0.001 levels. Males were more favorably disposed to independent tours, whereas female respondents preferred package tours. Females demonstrated a greater preference for halal food than their male counterparts do.
Chi-square tests to identify associations between preferred type and sociodemographic variables.
MYR: Malaysian ringgit.
An analysis of the association between marital status and length of stay and preferred accommodation type yielded significance at the 0.05 level. Married respondents showed a stronger preference for stays of three to four nights and for deluxe hotels than their single counterparts. χ2 Tests were undertaken to investigate income level, length of stay, and preferred accommodation type and generated significance at the 0.05 level. Wealthier respondents were more willing to stay longer than those with lower incomes. The highest income brackets expressed the lowest preference for condominiums and homestays, whereas those in the lowest income bracket preferred condominiums and homestays. Finally, χ2 tests on the relationship between occupation and preferred accommodation type yielded significance at the 0.05 level. Company employees and self-employed respondents exhibited a stronger preference for deluxe hotels than other occupation groups. Students showed the greatest preference for budget hotels and professionals showed the least.
Gift preferences according to sociodemographic variables
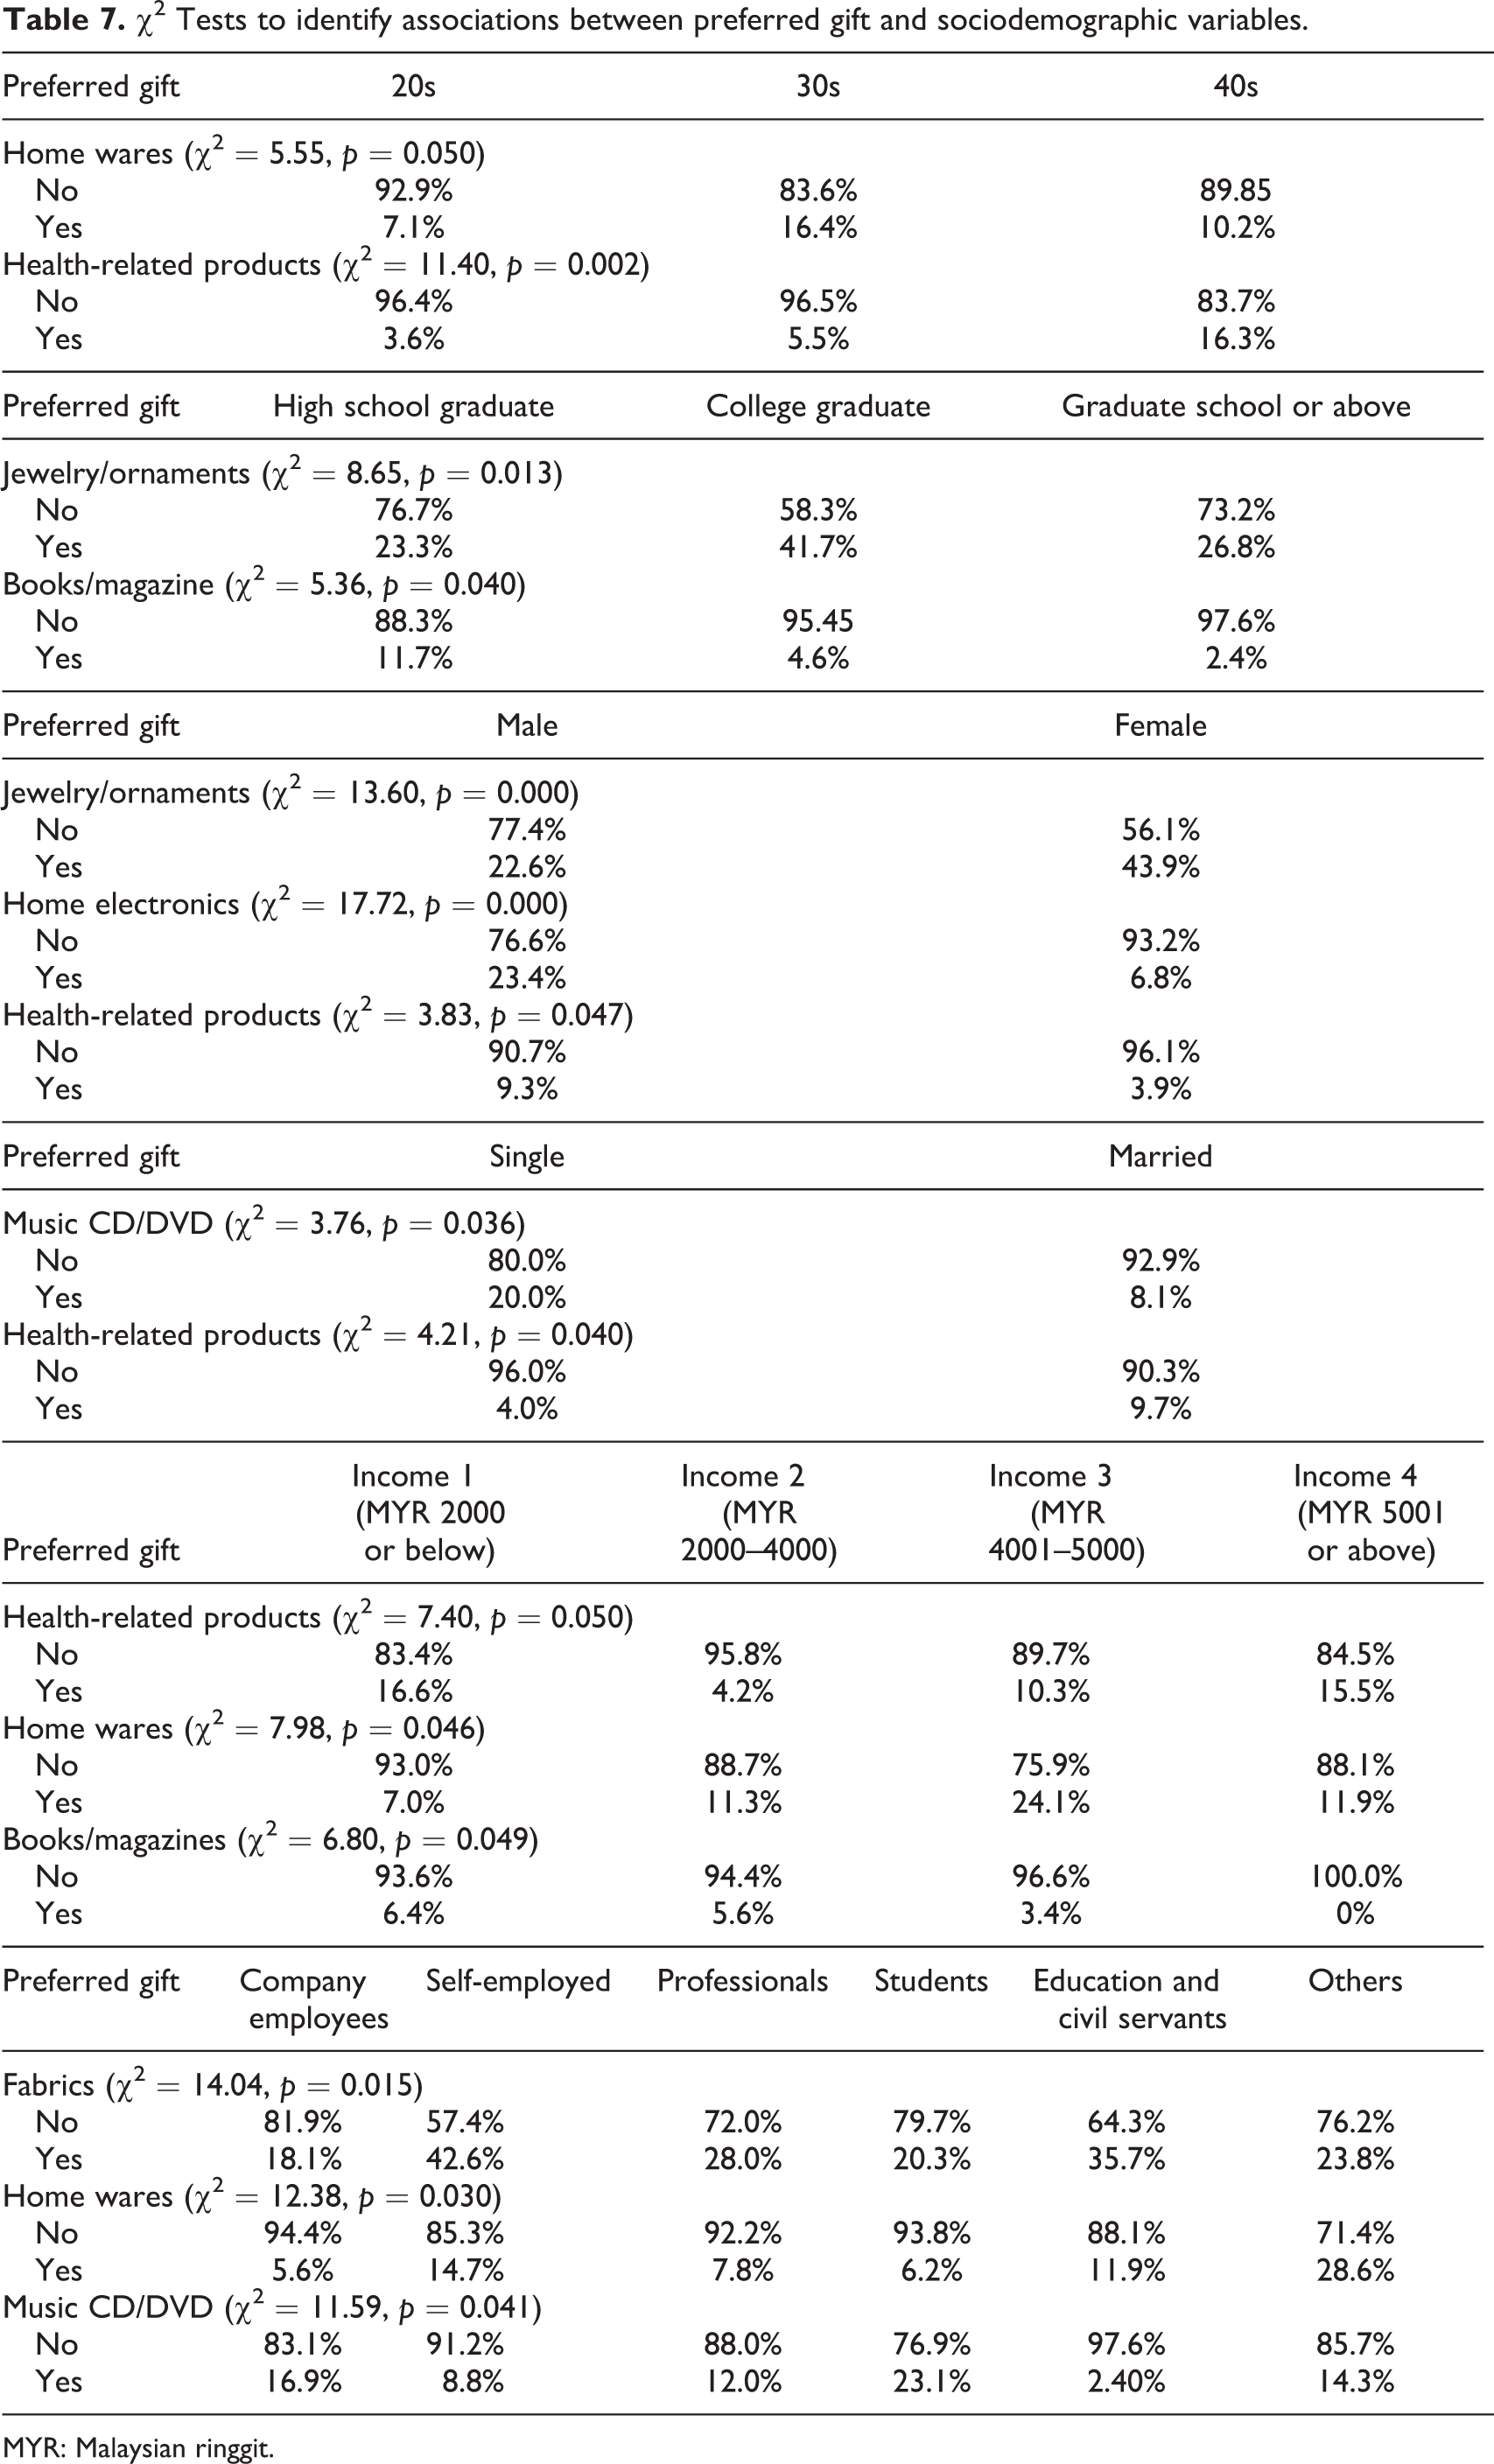
An analysis of the association between preferred gifts and sociodemographic variables is reported in Table 7. The variables used for preferred gifts included clothing, jewelry/ornaments, home electronics, souvenirs, fabrics, home wares, music CDs/DVDs, books, and health-related products. The variables used for sociodemographic characteristics included age, gender, marital status, educational level, income level, and occupation. The χ2 tests that were used to identify the association between preferred gifts and age yielded significance at the 0.05 level in the case of home wares (χ2 = 5.55, p = 0.050) and health-related products (χ2 = 11.40, p = 0.002). Older respondents were more strongly inclined to buy home wares or health-related products.
χ2 Tests to identify associations between preferred gift and sociodemographic variables.
MYR: Malaysian ringgit.
When analyzing the relationship between preferred gifts and educational levels, significance was found at the 0.05 level for jewelry/ornaments (χ2 = 8.65, p = 0.013) and books/magazines (χ2 = 5.36, p = 0.040). College graduate respondents showed a stronger intention to buy jewelry/ornaments than other educational groups. This indicates that the higher the educational level, the stronger the intention to buy books/magazines. While testing the association between preferred gifts and gender, significance was observed at the 0.05 or 0.001 level for jewelry/ornaments (χ2 = 13.60, p = 0.000), home electronics (χ2 = 17.72, p = 0.000), and health-related products (χ2 = 3.83, p = 0.047). Females showed a greater willingness to buy jewelry/ornaments than males. However, males indicated a stronger intention to purchase home electronics and health-related products.
An analysis of the association between marital status and music CDs/DVDs (χ2 = 3.76, p = 0.036) and between marital status and health-related products (χ2 = 4.21, p = 0.040) yielded significance at the 0.05 level. Single respondents were more favorably disposed to buying music CDs/DVDs than married people, while married respondents indicated a higher level of intention to purchase health-related products. The χ2 tests to assess the association between preferred gifts and income levels indicated significance at the 0.05 level for health-related products (χ2 = 7.40, p = 0.050), home wares (χ2 = 7.98, p = 0.046), and books/magazines (χ2 = 6.80, p = 0.049). Low- and high-income respondents reported stronger intentions to purchase health-related products, whereas the low-income respondents showed a higher intention to buy books/magazines. Significance was found at the 0.05 level when analyzing the association between occupation and fabrics (χ2 = 14.04, p = 0.015), home wares (χ2 = 12.38, p = 0.030), and music CDs/DVDs (χ2 = 11.59, p = 0.041). Respondents who were self-employed, educated, and classified as civil servants showed a higher intention to buy fabrics than those in other occupation groups. Company employees reported relatively low intentions to buy home wares, while students showed the highest intention to purchase music CDs/DVDs.
Conclusion and discussion
The two main objectives of the study were to explore emerging destination brand positioning typologies and to assess the competitiveness of Japan, Korea, and China in accommodating the preferences of Malaysian Muslim tourists. A number of scholarly and practice implications are now presented. First, the paired t tests investigating competitiveness on the basis of brand image showed that destination brand positioning is meaningful. Korea was perceived as having a superior destination brand to China, except in the case of ‘access to Muslim culture’, whereas Japan was perceived as having a better destination brand than China, except in the case of ‘access to Muslim culture’. When comparing Korea and Japan, respondents perceived Japan as having a higher brand positioning value than Korea.
Second, the results were consistent with the analyses of the three countries for the purposes of brand awareness, association, and loyalty. Overall, Malaysian Muslims perceived Japan as having the most favorable destination brand positioning, followed by Korea and China. The results were consistent, except in the case of the destination image question, which referred to ‘access to Muslim culture’. Interestingly, China was found to be more advantageous than Korea or Japan for opportunities to experience Muslim culture. It was apparent that respondents anticipate finding more opportunities to experience Muslim culture in China than the other two countries. Their perceptions may arise from awareness about the presence of approximately 8 million Muslim China residents. Most live in Xinjiang Province, though there are others in the coastal city of Sanya in southern China, and even in Beijing, Mongolia, and Ningxia. The slowly growing Muslim community has formed a niche market for both domestic and international tourists, primarily in food services. Third, when comparing the respondent emotional feelings toward the three countries, there was a stronger perception of Korea as peaceful and exciting than China. Japan was also perceived to be more peaceful and exciting than China. In a similar vein, respondents perceived that Japan was more favorable than Korea in terms of being emotional, familiar, peaceful, and exciting. Based on these findings, Malaysian Muslims expressed a greater sense of proximity with Japan than with the two other nations. Nevertheless, Korea was perceived slightly more positive than China.
Fourth, when comparing the three nations in the domains of destination brand positioning typology and emotions, it was found that Japan was the country that most respondents wanted to visit, followed by Korea and China. The results were similar to those from the analysis of four other domains of destination brand positioning and emotions. However, ‘access to Muslim culture’ was perceived to be the second most influential factor when potential Muslim tourists select an overseas destination. This finding differs from previous studies in which tourists were motivated to seek novelty when choosing to visit a destination (Assaker et al., 2011; Snepenger, 1987). This is an intriguing point because few tourism destinations consider the cultural needs of Muslim tourists such as halal food, Muslim restaurants, or prayer rooms. Such tourism destinations appear to expect tourists to experience their native or traditional culture. In accordance with the saying ‘When in Rome, do as the Romans do’, tourists may abide by the culture or social norms of the host society. By contrast, it may be argued that the host community should not force tourists to follow its traditions, religious activities, and other customs. Thus, the results of this study imply that destination marketers should be aware of the high tendency of Muslims to seek Islamic-related cultural features in overseas destinations. Furthermore, when Muslim tourists are selected as a target market, a destination should attach greater significance to considering Muslim cultural elements along with the issues of service quality, tourism facilities, and entertainment.
Fifth, regarding the preferred type of tour, respondents in their 20s showed a higher preference for ‘independent tours’ than people in their 30s or in older age-groups. It is understandable that younger people tend to travel independently without the assistance of a tour guide. This finding is in tune with previous studies, which showed that relative to senior generations, younger generations prefer more adventurous and challenging destinations (Huang and Tsai, 2003; Hughes and Deutsch, 2010; Jang and Ham, 2009). Sixth, female respondents were more disposed to ‘package tours’ than males do, while the latter showed a relatively higher preference for ‘independent tours’. This is understandable because females tend to choose safer, more developed, or urban destinations rather than wild, isolated, or adventure-filled settings. The results correspond with the findings of previous studies (Carr, 2001; McGehee et al., 2007; Westwood et al., 2000). Interestingly, female respondents indicated a stronger desire to eat halal food when overseas than males do. This suggests that travel agencies should consider gender differences when programming tour itineraries or developing tour products.
Seventh, single respondents preferred to stay longer, whereas married respondents preferred briefer stays. Relative to the unmarried, a higher percentage of married respondents preferred deluxe accommodation. Married respondents also preferred spacious or more luxurious hotel rooms, whether as couples or with other family members. The literature supports the finding that marital status influences preferences for tour products (Agrusa et al., 2011; Bronner and de Hoog, 2008; Kang and Hsu, 2005). Eighth, wealthier respondents indicated a preference for staying longer in a deluxe hotel, whereas low-income respondents indicated a preference for shorter stays in a condominium or house. This reflects different preferences while choosing a tour product or facilities/services and supports the findings of previous studies, which indicated different preferences for types of tour according to income level (Chang et al., 2013; Jang et al., 2004; Lim et al., 2008).
Ninth, regarding their intention to purchase gifts, senior respondents showed a higher preference than their younger counterparts for home wares or health-related products. High school graduates indicated a higher preference for books/magazines than respondents with higher educational levels. Interestingly, low-income respondents had a preference for books/magazines compared to senior respondents. This finding challenges the conventional wisdom, because book purchasing is generally associated with higher educational level. In our survey, some of the high school graduates or low-income respondents included college students or people in their late 20s, and young people tend to show an interest in Korean pop culture, including K-pop, Korean TV dramas, movies, food, and the Korean language. This is understandable because Malaysia and Korea have developed a closer relationship through the entry of numerous Korean construction, information technology, and retail companies into the Malaysian market as well as through the popularity of K-pop among the younger generation (Park, 2012).
Female respondents were more disposed to jewelry/ornaments, whereas males indicated a higher preference for home electronics and health-related products. This finding is consistent with other studies in which females are keenly interested in jewelry, accessories, or fashion as well as in tourism shopping (Reisinger and Turner, 2002; Rosenbaum and Spears, 2005; Timothy, 2005; Timothy and Butler, 1995). Single Muslims revealed a higher preference for music CDs/DVDs than do married respondents, whereas the latter indicated a higher preference for health-related products. The results reflect social features associated with a preference among the younger generation for music and health consciousness on the part of married and older people.
There are a number of limitations associated with this study. Consideration has been limited to three Asian countries, though Malaysian tourists travel to a variety of southern Asian destinations, including Hong Kong, Thailand, and Singapore. Future research about destination competitiveness should also consider these and related destinations. In the case of the present study, responses were gathered at a travel EXPO that was held in Kuala Lumpur. It is suggested that future researchers should compare the findings of this study with the data gathered in different places within Malaysia.
This study offers insights from both academic and practice perspectives. The investigation differs from previous scholarly research on destination positioning because of its consideration of competitiveness. Most destination positioning studies have compared competitive destinations in terms of image attributes, motivations, benefits sought, preferred activities in a destination, constraints, personal value, personality, and satisfaction. The results of destination competitiveness analysis could vary according to the standards or criteria used to compare the destinations. This study has adopted the concept of brand destination positioning typology consisting of domains such as brand image, brand awareness, brand association, and brand loyalty.
The examination of Muslim tourist preferences fills a knowledge gap around the characteristics of Muslim-oriented tourism. The results should benefit tourism businesses or national tourism organizations by providing insights into the competitive conditions prevailing in three East Asian countries and the preferences of Malaysian Muslim tourists. Future studies should make active use of the domains of destination brand positioning typology to assess destination brand positioning. Though the population of Muslim tourists is increasing, it has been noted that few studies have been conducted on Muslim tourism. Future studies should identify the attitudinal or behavioral characteristics of potential or actual tourists from other Muslim countries, given that culture and customs vary by country of residence.
Footnotes
Funding
This research received no specific grant from any funding agency in the public, commercial, or not-for-profit sectors.