



Abstract
In this retrospective cohort study using data from an integrated primary care and subspecialty network, we examined medical records of children seen in primary care at eligible autism spectrum disorder (ASD) screening ages and followed through at least 4 years of age. We examined the prevalence of ASD; age of first documented ASD diagnosis; and whether the prevalence and age of documented diagnosis varied by race, ethnicity, socio-economic status (SES) and site of care (urban versus suburban/rural). The prevalence of ASD across the cohort was 3.2%, with a median age of diagnosis of 3.93 years. ASD prevalence was unexpectedly higher among Asian children, non-Hispanic Black children, children with higher Social Vulnerability Index scores (a neighborhood-level proxy of socio-economic risk), and children who received care in urban primary care sites. There were no statistically significant differences in age at which ASD diagnosis was documented across socio-demographic groups. Receiving primary care at an urban site accounted for most other socio-demographic differences in ASD prevalence rates, except among Asian children, who were found to have higher adjusted odds of ASD diagnosis compared to White children (aOR = 1.82, p < .001). Determining what clinical-, individual- or systems-level factors contribute to ASD diagnosis remains important to improve equity.
Lay Abstract
Historically, children from non-Hispanic Black and Hispanic backgrounds, those from lower-income families, and girls are less likely to be diagnosed with autism spectrum disorder. Under-identification among these historically and contemporaneously marginalized groups can limit their access to early, autism spectrum disorder-specific interventions, which can have long-term negative impacts. Recent data suggest that some of these trends may be narrowing, or even reversing. Using electronic health record data, we calculated autism spectrum disorder prevalence rates and age of first documented diagnosis across socio-demographic groups. Our cohort included children seen at young ages (when eligible for screening in early childhood) and again at least after 4 years of age in a large primary care network. We found that autism spectrum disorder prevalence was unexpectedly higher among Asian children, non-Hispanic Black children, children with higher Social Vulnerability Index scores (a measure of socio-economic risk at the neighborhood level), and children who received care in urban primary care sites. We did not find differences in the age at which autism spectrum disorder diagnoses were documented in children’s records across these groups. Receiving primary care at an urban site (regardless of location of specialty care) appeared to account for most other socio-demographic differences in autism spectrum disorder prevalence rates, except among Asian children, who remained more likely to be diagnosed with autism spectrum disorder after controlling for other factors. We must continue to better understand the process by which children with autism spectrum disorder from traditionally under-identified and under-served backgrounds come to be recognized, to continue to improve the equity of care.
Background
Socio-demographic inequities in autism spectrum disorder (ASD) diagnosis have been documented for two decades (Mandell et al., 2002). Missed diagnoses can result in delayed or no access to ASD-specific services, with negative long-term consequences. Most previous studies, including large cohort studies with rigorous case definitions, have found that Non-Hispanic White children (hereafter referred to as “White”) are diagnosed at higher rates and earlier ages than Non-Hispanic Black (hereafter referred to as “Black”) and Hispanic children, and that children from families with higher socio-economic status (SES) are diagnosed at higher rates and earlier ages than children from lower-SES families (Baio et al., 2018).
Race and ethnicity are socio-political constructs. Thus, differences in rates or ages of diagnoses are more likely due to differences in service systems (Tregnago & Cheak-Zamora, 2012), biases (Broder-Fingert et al., 2020), and imperfect screening and diagnostic tools (Guthrie et al., 2019). Examining prevalence differences within a system where children theoretically have more similar access to screening and diagnostics can help elucidate the pathways for inequities that may exist.
Recent data paint a different picture of diagnoses. Surveillance data among 4-year-old children in the United States from the Autism and Developmental Disabilities Monitoring (ADDM) Network found that White children had lower prevalence than Black, Hispanic, and Asian/Pacific Islander children; children with the lowest median household income had a higher prevalence than children with the highest (Shaw et al., 2021). Survey data using parent-reported ASD diagnoses found a prevalence rate of 3.14, with no statistically significant differences by race or ethnicity (Li et al., 2022). Also, a recent cohort study in England found higher prevalence among Black students than any other racial or ethnic group, and among children who received free meals at school (Roman-Urrestarazu et al., 2021). Similarly, a recent large population-based study found that the prevalence of ASD was higher among publicly versus privately insured children (Straub et al., 2022).
Using data from an integrated primary care and subspecialty network, we examined medical records of children seen in primary care at eligible ASD screening ages and followed through at least 4 years of age to examine the prevalence of ASD; age of first documented ASD diagnosis; and whether the prevalence and age of documented diagnosis varied by race, ethnicity, and SES.
Methods
This study retrospectively analyzed a cohort of children who received primary healthcare within the Children’s Hospital of Philadelphia (CHOP) Care Network, a large pediatric health system that provides primary and subspecialty services, including ASD diagnostics by developmental–behavioral pediatricians, neurologists, psychiatrists, or psychologists. The Care Network includes 29 pediatric primary care sites in Pennsylvania and New Jersey, which have conducted universal ASD screening since 2014 and have achieved high screening rates, with 91% of eligible children screened at least once (Guthrie et al., 2019). Children identified as at risk can be internally referred for ASD assessment or can access evaluations in the community.
This same cohort was previously used to assess the accuracy of universal autism screening (Guthrie et al., 2019) and includes 23,015 children who presented at least once for a well-child visit between 16 and 26 months of age at a CHOP primary care site between 2011 and 2015 and again after 4 years of age (to assess diagnostic outcome). The present sample includes additional diagnostic outcome data available after our previous study was published in 2019. Children for this study were median 9.51 years (interquartile range, IQR 8.97–10.42 years) when data were extracted.
A child was considered to have ASD if this diagnosis appeared in the electronic health record (EHR) more than once (in the problem list or as a visit diagnosis) or was provided by an ASD specialist (Guthrie et al., 2019). The date at which the ASD diagnosis first appeared in the EHR was used as a proxy measure for age of diagnosis. A diagnosis could appear because a child was diagnosed by a CHOP subspecialist in developmental and behavioral pediatrics, neonatal follow-up, neurology, psychiatry, and psychology (62.6% of diagnoses), or because a diagnosis was recorded twice by a CHOP clinician (37.4% of diagnoses). All available data at the time of electronic data extraction (December 2021) were used to determine diagnostic outcome (Guthrie et al., 2019). Manual review of 10% of charts with a first ASD diagnosis recorded after our original data extraction confirmed accuracy of newly documented diagnoses.
Socio-demographic variables were digitally extracted from the EHR and categorized to identify possible disparities in care: sex (Male/Female), parent-reported race and ethnicity (Asian, Black, Hispanic, White, and Multiple/Other races), preferred language (English, Spanish, or Other language), insurance type (Public/Medicaid or Private), site of care at the screening visit (urban, suburban/rural), and Social Vulnerability Index (SVI) at the census tract level. The SVI uses percentile rankings for 15 census variables from the American Community Survey to compute an overall vulnerability score for each census tract compared to others, based on composite measures of SES, household composition and disability, minority status and language, and housing and transportation (Flanagan et al., 2018). The SVI is based on patient address at the time of screening, with higher percentages indicating higher levels of social vulnerability or relative disadvantage; we present the overall SVI percentage and nationally defined mutually exclusive quartiles (High, Medium high, Medium low, and Low).
Statistical analyses
ASD prevalence rates and age of documented diagnosis were compared for race and ethnicity, SVI, and site of care using chi-square tests, t-tests, and ANOVA as appropriate, with pairwise comparisons for multi-category predictor variables. Reference groups were selected based on groups that historically had the highest rates of ASD diagnosis. Socio-demographic variables with statistically significant univariate associations with ASD diagnosis were included in hierarchical regression models in a step-wise fashion to examine the additive effects of these variables on outcomes of interest. SVI was analyzed separately as a continuous and a categorical variable, with similar results. We did not include insurance type in regression models, as this socio-demographic measure is redundant with SVI, or sex, as sex-based ASD differences are well documented (Shaw et al., 2021). Analyses were conducted in SPSS version 26 (IBM Corp., 2019); assumptions for all parametric tests (which are robust to moderate non-normality) were met. This protocol was approved by CHOP’s Institutional Review Board. There was no community involvement in this project.
Results
Across the entire cohort (N = 23,015), 41.1% identified as White, 36.5% as Black, 11.2% as another race or multiple races, 7.3% as Hispanic, and 3.9% as Asian; 45.4% were publicly insured (see Table 1). These demographics generally reflect the racial composition of Philadelphia and the surrounding region, although Asian children were underrepresented as were uninsured children (“Data USA: Philadelphia, PA,” n.d.). The prevalence of ASD was 3.2% across the entire cohort, with a median age of diagnosis of 3.93 years. The following groups had higher ASD prevalence (Table 2): Asian children (5.4; odds ratio, OR = 2.5, p < 0.001) and Black children (3.5%, OR = 1.3, p = 0.002) compared to White children (2.7%); publicly (3.6%; OR = 1.28, p < 0.001) versus privately insured children (2.8%); those with highest quartile SVI (3.6%, OR = 1.47, p < 0.001), Medium High (3.4%, OR = 1.38, p < 0.003), and Medium Low 3.4%, (p = 1.37, p = 0.006) compared to Lowest quartile SVI (2.5%); and children seen in urban (3.8%, OR = 1.38, p < 0.001) versus suburban/rural primary care sites (2.8%). No statistically significant differences in age of ASD documentation in the EHR were identified for any of the socio-demographic factors, and as such, multivariable models were not run.
Demographics of the total population and cohort with ASD diagnosis.
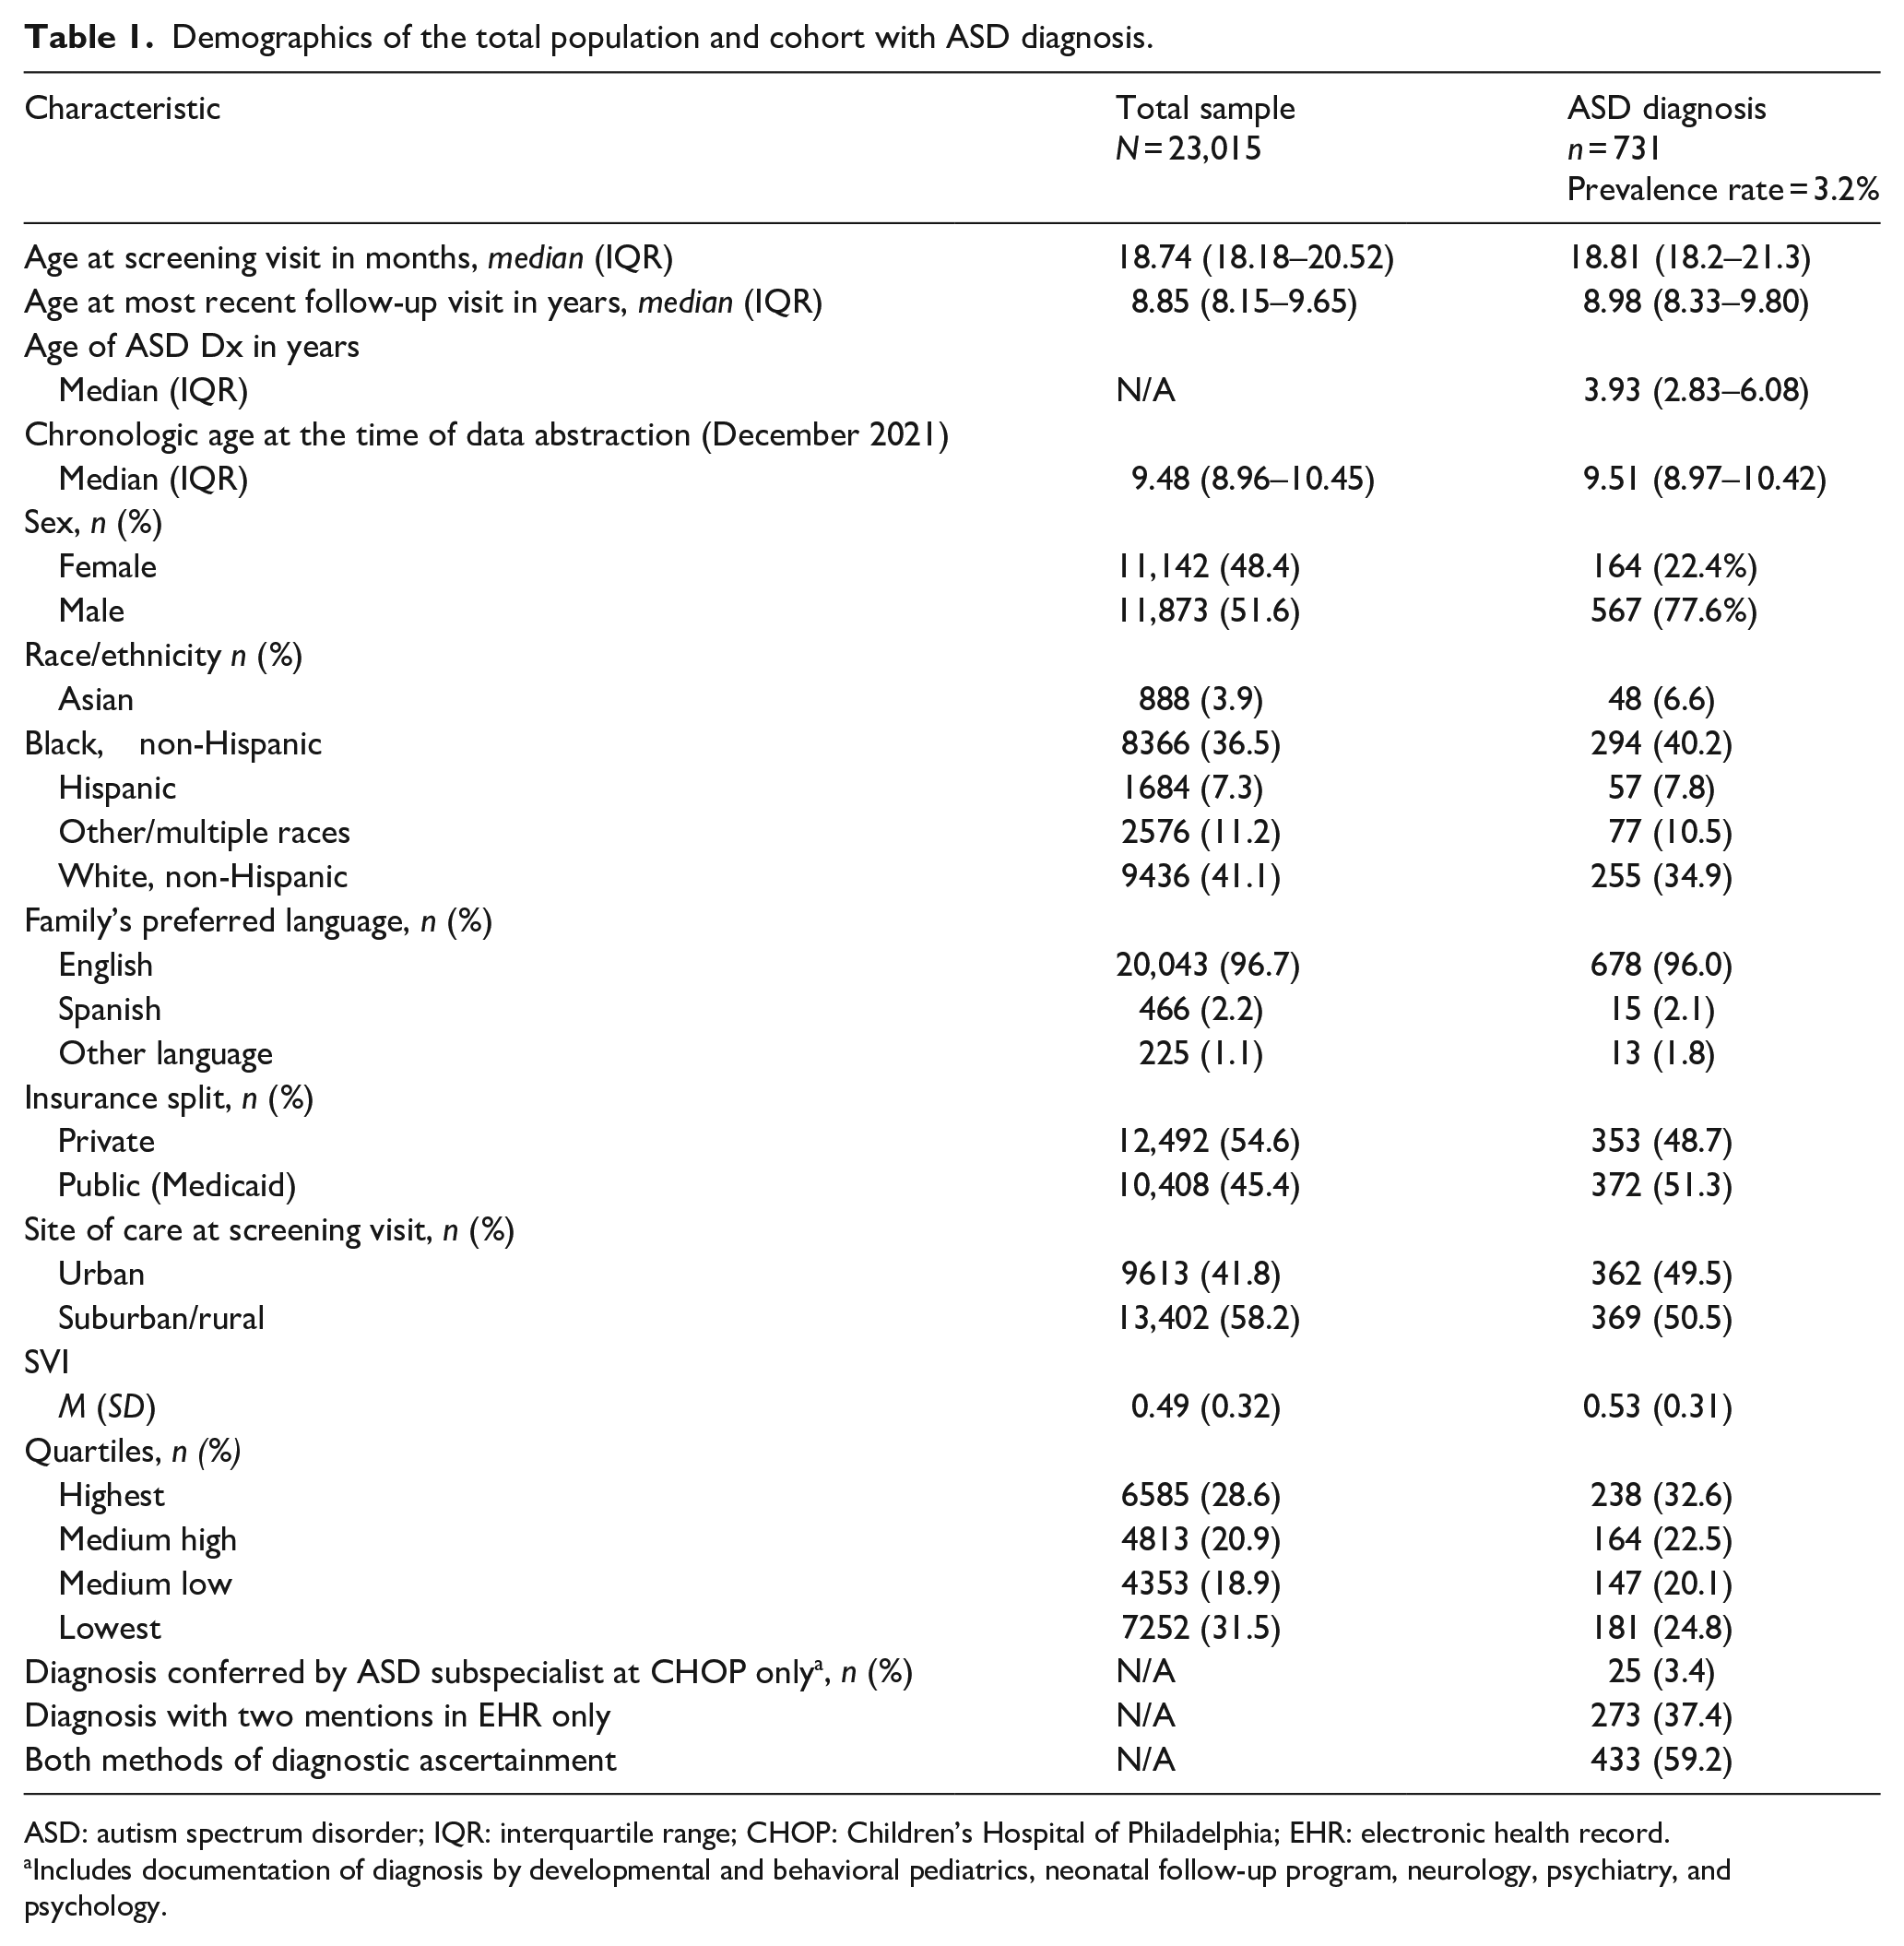
ASD: autism spectrum disorder; IQR: interquartile range; CHOP: Children’s Hospital of Philadelphia; EHR: electronic health record.
Includes documentation of diagnosis by developmental and behavioral pediatrics, neonatal follow-up program, neurology, psychiatry, and psychology.
Prevalence rates and comparisons by socio-demographic group.
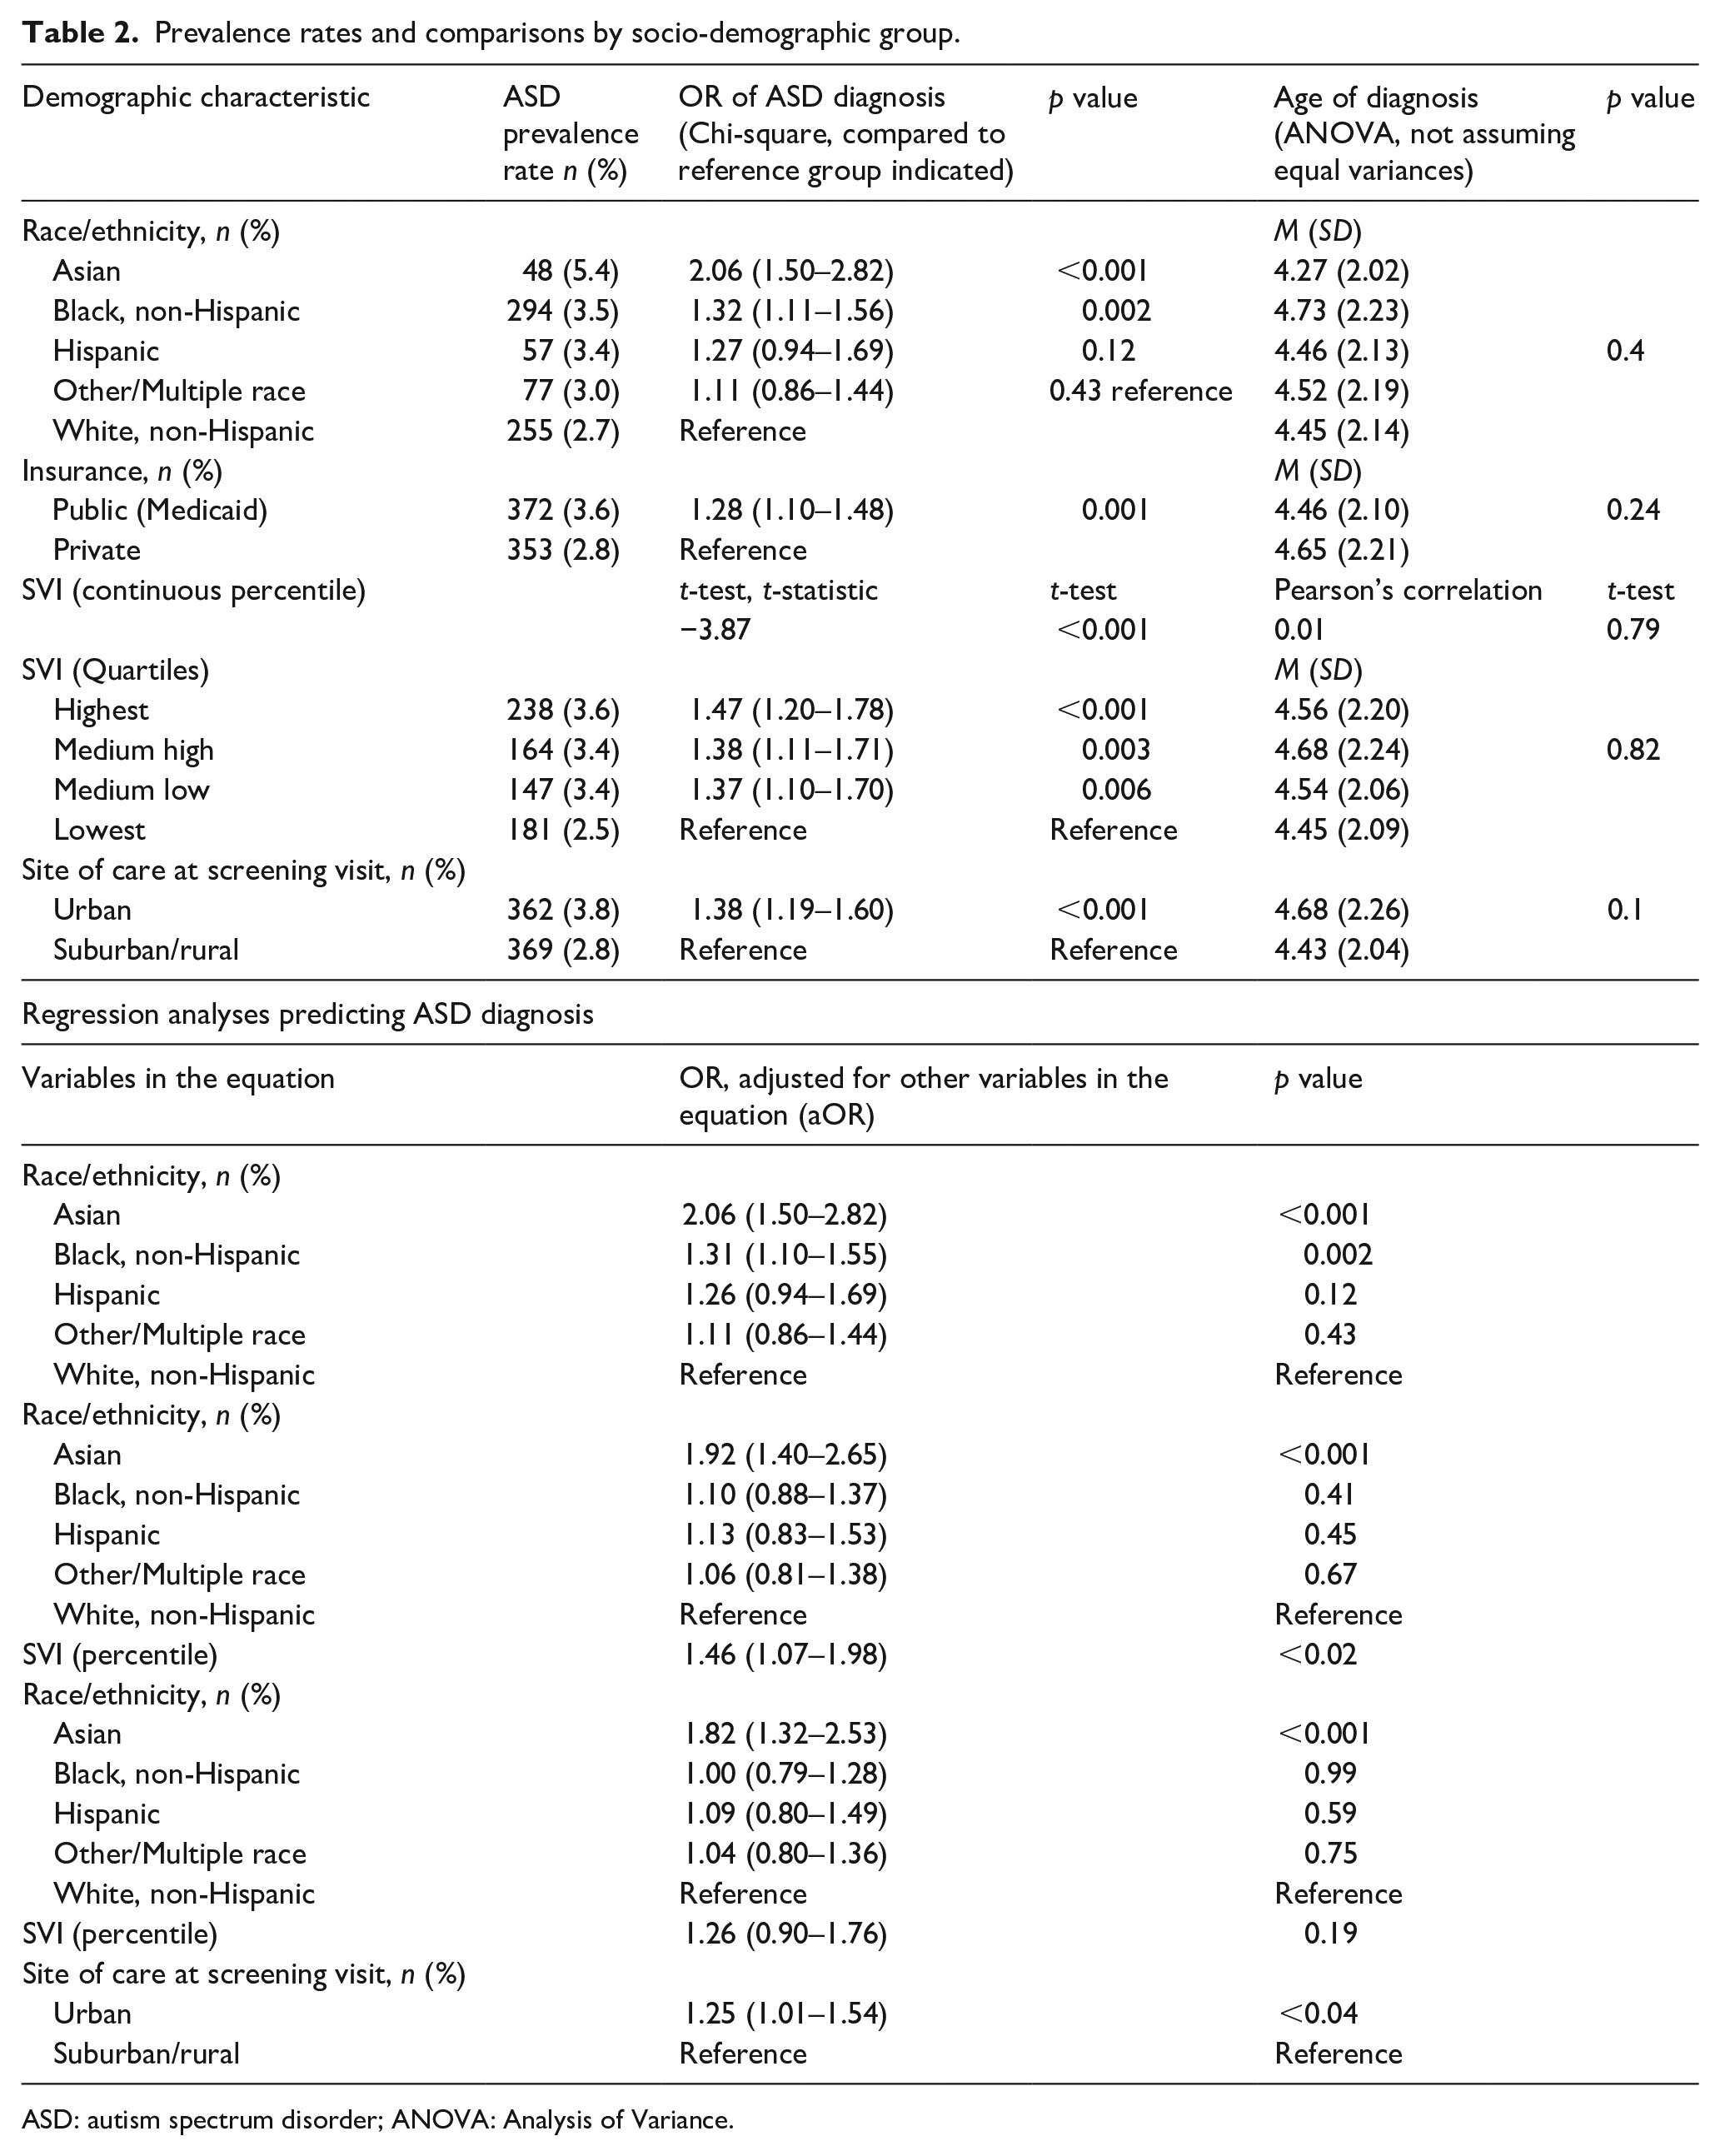
ASD: autism spectrum disorder; ANOVA: Analysis of Variance.
Hierarchical logistic regressions were conducted to identify the individual effects of the socio-demographic variables on ASD rates. Race/ethnicity was added to the model in the first step, demonstrating differences in ASD rates for Asian and Black compared to White children. This difference for Asian children remained significant (p < 0.001) when SVI (p < 0.02) was added to the model in the second step, but the difference for Black children did not. When site (aOR = 1.25, p < 0.04) was added to the model in the third step, the difference for Asian children remained significant (aOR = 1.82, p < 0.001), but the effect of SVI did not.
Discussion
Across this cohort, ASD prevalence (3.2%) was higher than in previously described samples, but similar to recent estimates from 2019 to 2020 (3.14%) (Li et al., 2022). The median age of first diagnosis was just below 4 years of age.
These analyses were exploratory in nature and meant to be hypothesis-generating. We posit several explanations for our high overall prevalence rate, noting some that may be unique to our healthcare system. First, our prevalence rate might be accurate and timely, matching data from 2019 to 2020 that found an estimated prevalence of 2.79%–3.49% (Li et al., 2022). Alternatively, families of children with ASD might be more likely to continue to seek primary care at an academic children’s network compared to community sites (e.g. selection bias), and thus may be over-represented in a cohort followed by CHOP primary care. Another alternative is that our high prevalence rate might reflect diagnostic substitution, as the linking of effective ASD therapies may encourage diagnosis of ASD rather than language or developmental disorders alone, or the imprecision that can be associated with ASD diagnosis (Mottron, 2021). Finally, we represent lifetime prevalence, while the possibility exists that some children have documented diagnoses that later are removed as a result of earlier inaccuracy or changes in core features. Each of these potential explanations warrants additional study to determine what clinical-, individual- or system-level factors contribute to ASD prevalence and inequities therein.
Contrary to our hypothesis, ASD prevalence differed by socio-demographic variables. Although effect sizes were generally small (Chen et al., 2010), there was an even higher prevalence among minoritized children than recent trends would suggest. Socio-demographic differences in median age of diagnosis were not found. The rate among Asian children in this cohort was particularly high (5.4%).
Our data came from children seen for primary care at urban and suburban practices across several counties with different services. Being seen at an urban (Philadelphia) primary care site was an important predictor of ASD diagnosis and appeared to account for most other socio-demographic differences. The urban sites have closer proximity to the academic medical center and more academic clinicians and trainees who might have additional training in ASD recognition. Children in Philadelphia live closer to specialty diagnostic care, either at CHOP or in the community. Finally, publicly funded Early Intervention services in Philadelphia are strong, including for ASD, which may increase attention to the need for diagnosis to access these services.
There are multiple points along the screening, diagnostic, and therapeutic process that may contribute to diagnostic differences (Wallis, 2021). These findings suggest that systemic factors (such as geographic access to a diagnostic clinic) play a large role in determining diagnosis. More work is needed to better understand the complexity of these processes, and the ways that systems may contribute to inequities (Broder-Fingert et al., 2020).
There are several limitations to the current study. We used a retrospective clinical cohort. Thus, we were unable to confirm the accuracy of ASD diagnoses. However, the stringent criteria used for ASD diagnosis have previously been validated as highly accurate in other large health systems using EHR/claims data (Coleman et al., 2015), and our manual chart review provided sufficient documentation to justify diagnosis for the majority of children. However, some children might have been missed and some inappropriately classified as having ASD. Children in our cohort had varying lengths of follow-up (i.e. 4–11 years), such that some younger children may not have been diagnosed yet, which may have downwardly biased age of first diagnosis estimates.
In addition, there is heterogeneity among our racial and ethnic groups that could not be studied using EHR data (e.g. differences exist between and within Chinese and Indian cultures, but all might be classified as Asian). Important components of SES, such as parental education and maternal nativity are not available in the EHR. Furthermore, the finding of such a high prevalence rate in Asian children warrants further investigation, which we are examining separately. Findings may not generalize to other settings where screening and diagnostic evaluations are not as easily accessible, or among different patient populations and clinical settings, or among populations that are un- or under-insured. We also did not examine service use; additional disparities in service access are possible and perhaps likely. Other sociocultural and historical factors (e.g. stigma, institutional racism, etc.) undoubtedly also play a role in ASD diagnosis and service utilization. The reasons behind our reported higher and varied diagnostic rates should be explored further.
Conclusion
Systemic factors appear to contribute to socio-demographic differences in ASD diagnosis. Future work should aim to understand the ASD diagnostic process to ensure that the promise of early identification and intervention is realized for all children.
Footnotes
Acknowledgements
The authors thank the network of primary care clinicians, their patients, and families for their contribution to this project and clinical research facilitated through the Pediatric Research Consortium (PeRC) at the Children’s Hospital of Philadelphia. They thank the University of Pennsylvania Program in Public Health for support for this project. They also thank Jesse Dudley at the Center for Biomedical and Health Informatics for her assistance with querying the electronic health record.
Clinical Trial Registry
Not applicable
Community involvement
There was no community involvement in the reported study.
Declaration of conflicting interests
The author(s) declared no potential conflicts of interest with respect to the research, authorship, and/or publication of this article.
Funding
The author(s) disclosed receipt of the following financial support for the research, authorship, and/or publication of this article: This project was supported in part by Projects T77MC00012 from the Maternal Child Health Bureau (Public Health Service Act, Section 399BB(e)(1)(A), as amended by the Combating Autism Act of 2006), Health Resources and Services Administration, Department of Health and Human Services, and by the National Institute of Mental Health (R03MH116356).
Publication
A version of these analyses was presented as a poster for the Society of Developmental and Behavioral Pediatrics virtual conference, 10/2020.
