
Abstract
Aims and objectives:
The purpose of this study was to gain a better understanding of speech development across successive generations of heritage language users, examining how cross-linguistic, developmental and socio-cultural factors affect stop consonant production.
Design:
To this end, we recorded Sylheti and English stop productions of two sets of Bangladeshi heritage families: (1) first-generation adult migrants from Bangladesh and their (second-generation) UK-born children, and (2) second-generation UK-born adult heritage language users and their (third-generation) UK-born children.
Data and analysis:
The data were analysed auditorily, using whole-word transcription, and acoustically, examining voice onset time. Comparisons were then made in both languages across the four groups of participants, and cross-linguistically.
Findings:
The results revealed non-native productions of English stops by the first-generation migrants but largely target-like patterns by the remaining sets of participants. The Sylheti stops exhibited incremental changes across successive generations of speakers, with the third-generation children’s productions showing the greatest influence from English.
Originality:
This is one of few studies to examine both the host and heritage language in an ethnic minority setting, and the first to demonstrate substantial differences in heritage language accent between age-matched second- and third-generation children. The study shows that current theories of bilingual speech learning do not go far enough in explaining how speech develops in heritage language settings.
Implications:
These findings have important implications for the maintenance, transmission and long-term survival of heritage languages, and show that investigations need to go beyond second-generation speakers, in particular in communities that do not see a steady influx of new migrants.
Keywords
Introduction
A growing body of research has shown that individuals raised in an ethnic minority setting develop different pronunciation patterns from the generation of their foreign-born parents (e.g. Evans, Mistry, & Moreiras, 2007; McCarthy, Evans, & Mahon, 2011, 2013; Nagy, 2015; Nagy & Kochetov, 2013; Sharma & Sankaran, 2011). Accordingly, second-generation heritage speakers commonly exhibit non-native features in the heritage language, and therefore tend to be perceived as foreign-accented in it (Kupisch et al., 2014; Lein, Kupisch, & van de Weijer, 2016; Nagy, 2015; Nagy & Kochetov, 2013). At the same time, they usually behave much like their monolingual peers in the host language (Evans et al., 2007; Khattab, 2002; McCarthy et al., 2011; McCarthy, Mahon, Rosen, & Evans, 2014), although this is not always the case (Stangen, Kupisch, Ergün, & Zielke, 2015), and heritage language markers, such as retroflex realisations of English /t/ (Alam & Stuart-Smith, 2011; Heselwood & McChrystal, 1999, 2000; Kirkham, 2011; Sharma & Sankaran, 2011), may be retained to fulfil socio-indexical functions. In contrast, first-generation migrants, in particular those who arrived in the host country as adults, tend to have a distinct foreign accent in their L2 (Abrahamsson & Hyltenstam, 2009; Flege, Munro, & McKay, 1995; Flege, Schirru, & McKay, 2003; McCarthy et al., 2011; Piske, MacKay, & Flege, 2001), while retaining a relatively authentic accent in their native language (Khattab, 2002; McCarthy et al., 2013).
Little is known, however, about the speech development of subsequent generations of heritage language users (but see Hrycyna, Lapinskaya, Kochetov, & Nagy, 2011, and Nagy & Kochetov, 2013). Do second- and third-generation children in language minority settings differ from each other in their pronunciation of the heritage language and the host language? If so, how do the differences manifest, and can they be explained on the basis of their parents’ production patterns? The present study aims to address these questions by investigating the stop consonant productions of two sets of Bangladeshi heritage families: (1) first-generation female migrants from the Sylhet area of Bangladesh and their UK-born children, and (2) second-generation UK-born female Sylheti heritage language users and their (third-generation) children. In so doing, it aims to disentangle the effects of cross-linguistic, developmental and socio-cultural factors.
Background
There is a general consensus that the earlier one starts to learn a second language, the less foreign-accented it will be (Au, Knightly, Jun, & Oh, 2002; Flege et al., 1995, 2003; Flege, Yeni-Komshian, & Liu, 1999; Yeni-Komshian, Flege, & Liu, 2000). Accordingly, individuals acquiring an L2 in adolescence or adulthood virtually always end up with some degree of foreign accent (see Hansen Edwards & Zampini (2008) for an overview), while this is much less likely in those with early exposure to the language (Kupisch et al., 2014; MacLeod, Stoel-Gammon, & Wassink, 2009). A number of explanations have been given for these findings. Some have argued for a maturationally defined critical period (Lenneberg, 1967; Long, 1990; Scovel, 1988, 2000). However, contrary to these claims, there is evidence that native-like proficiency, while rare, is not impossible for late L2 learners (Birdsong, 2007; Bongaerts, Mennen, & Slik, 2000; Mennen, 2004). Moreover, the correlation between age of onset of learning and degree of foreign accent is linear without any marked discontinuities (Flege, 1995, 1999; Flege et al., 1995). This has led many to abandon maturation-based accounts, and instead to explain age effects on the basis of extra-linguistic factors, such as L1 and L2 usage patterns (Flege, Frieda, & Nozawa, 1997; Flege, MacKay, & Piske, 2002; Piske et al., 2001; Yeni-Komshian, Flege, & Liu, 2000).
Generally, heritage language users are at an advantage over L2 learners in terms of the accuracy of their pronunciation patterns (Au et al., 2002; Chang, Yao, Haynes, & Rhodes, 2011; Kupisch et al., 2014; Oh, Jun, Knightly, & Au, 2003). Chang et al. (2011), for example, showed that Mandarin heritage speakers in the United States consistently produced greater contrastivity in cross-linguistically similar back vowels, stops and fricatives than native American L2 learners of Mandarin. Similarly, Kupisch et al. (2014) demonstrated that heritage language speakers were perceived to be significantly less foreign-accented in their minority language than L2 learners, although their accent in the majority language was more native-like than in the minority language.
These patterns have been explained on the basis of differences in linguistic experience. While the L1 sound system of late L2 learners is fully in place when L2 learning starts, heritage language children usually have experience with the minority language from birth, or shortly thereafter, and the majority language by the time they start compulsory education. They are often initially dominant in the minority language, in particular if the language is also widely used in the community. However, with the onset of mainstream education in the majority language, there is typically a shift in dominance, with the use of the minority language frequently becoming more restricted (de Houwer, 2009). McCarthy (2015) and McCarthy et al. (2014), for example, showed that Bangladeshi heritage children’s perception and production of English /p b k g/ was heavily influenced by Sylheti during their first year in an English-speaking nursery, but was much more like that of their monolingual peers a year later.
Nevertheless, early language exposure does not guarantee native-like accents in the heritage language (Kupisch et al., 2014; McCarthy et al., 2013; Oh et al., 2003). For example, Oh et al. (2003) showed that childhood speakers of Korean who had stopped using the heritage language upon school entry were foreign-accented in it. Similarly, Kupisch et al. (2014) reported that heritage language users in Germany, France and Italy with exposure to both languages from birth were rated as foreign-accented in the minority language. These patterns are also reflected in studies examining speech production. McCarthy et al. (2013), for example, showed that second-generation London Bengalis produced non-native voice onset time (VOT) patterns in their minority language, and Nagy and Kochetov (2013) revealed incremental changes in the heritage language VOT patterns of successive generations of Russian and Ukrainian speakers in Toronto in the direction of English (see also Hrycyna et al., 2011 and Nagy, 2015). Interestingly, Italian heritage speakers in the study did not show this pattern. The authors speculate that these differences may be a result of the greater community support offered to ethnic Italians than Russians and Ukrainians in Toronto, including dedicated language classes.
In contrast to the minority language, heritage language users are usually native-like in the host language. For example, Kupisch et al. (2014) found no difference in an accentedness rating between their monolingual speakers and the heritage language speakers in the host language. Likewise, the Gujurati heritage speakers in Evans et al. (2007) produced their English vowels much like their monolingual English peers, and the second-generation Bengali heritage speakers in McCarthy et al. (2013) did not differ from monolingual controls in their production of English vowels and VOT. Nevertheless, the host language is not always immune to non-native patterns. For example, in Darcy and Krüger’s (2012) study, 10-year-old Turkish heritage children living in Germany whose first exposure to German was between 2 and 4 years of age were less accurate in the perception of some German vowel contrasts than monolingual German-speaking children. Similarly, Stangen et al. (2015) found highly variable patterns in their study on global foreign accent in Turkish-German heritage language users from Germany: the majority were perceived to have a foreign accent in either the host language or the heritage language (n=13), while some were foreign-accented in neither language (n=3), and others in both (n=5).
Where non-native forms occur in heritage language speakers, they may be a result of inadvertent cross-linguistic interactions. According to the Speech Learning Model (SLM) (Flege, 1995; Flege et al., 2003), this happens when cross-linguistically similar L1 and L2 sounds are perceptually equated with each other, a phenomenon termed equivalence classification. One of the best-known examples of this phenomenon is the difficulty that Japanese learners face with the perception and production of English /l/ and /r/, which they tend to assimilate to their single Japanese category /r/ (e.g. Aoyama, Flege, Guion, Akahane-Yamada & Yamada, 2004). Alternatively, where bilinguals are able to perceive a difference between L1 and L2 categories, they may strive to increase cross-linguistic distinctiveness. For example, the early Italian-English bilinguals in Flege et al.’s (2003) study produced English /eɪ/ with exaggerated vowel-inherent spectral change to keep it maximally distinct from monophthongal Italian /e/. Both mechanisms may lead to patterns that differ from those produced by monolingual speakers. According to the SLM, the likelihood that cross-linguistically similar sounds are distinguished is greater in early than late bilinguals since the L1 sound system is less established in younger learners, and hence more amenable to reorganisation. This may explain why heritage language speakers tend to outperform L2 learners. Similar explanations are offered by other theories of L2 speech learning. The Perceptual Assimilation Model (PAM, Best, 1995, PAM-L2, Best & Tyler, 2007), for instance, predicts difficulties in L2 perception on the basis of the assimilability of non-native contrasts to native categories.
In addition to cross-linguistic interactions, non-native forms in heritage language settings may arise from socio-cultural factors and form part of contact varieties (Alam & Stuart-Smith, 2007; Heselwood & McChrystal, 1999, 2000; Hirson & Sohail, 2007; Kirkham, 2011; Kirkham & Wormald, 2015; Lambert, Alam, & Stuart-Smith, 2007; Sharma & Sankaran, 2011). Kirkham (2011), for example, argued that British Asians from Sheffield used retroflex realisations of English /t/ to signal their Asian identity, rather than inadvertently as a result of cross-linguistic interactions, since the use of these forms could not be predicted on the basis of their language use patterns, with even monolingual English speakers from the community using them. Sharma and Sankaran (2011), in turn, examined the acquisition of a native feature, /t/ glottaling, and a non-native feature, /t/ retroflexion, in British Asians from London. They found that younger second-generation speakers used /t/ retroflexion in English to signal their Asian identity, while older second-generation speakers followed first-generation speakers’ non-native use of /t/ retroflexion, but unlike them, used /t/ glottaling natively. The authors argue that these patterns are consistent with a socially oriented model that allows for incremental changes to take place, rather than a cognitively oriented one which claims that non-native forms are either innately blocked by an accent filter (Chambers, 2002), or reused by native speakers to mark their identity.
The present study
This study investigated stop consonant production in Sylheti–English bilingual children and adults from Bangladeshi heritage backgrounds in Cardiff, South Wales, and as such is the first to examine the speech of ethnic minorities in Wales. Compared with the London Bengali communities in Tower Hamlets, where 30% of the population are of Bangladeshi origin, and Camden, where they constitute the largest minority ethnic group (cf. McCarthy et al., 2013, 2014 for details), the Bengali community in Cardiff is relatively small. In the 2011 Census, some 0.3% of the population of Wales (or 10,687 individuals) considered themselves British Bangladeshis, with 5207 individuals indicating Sylheti as their main home language (Office for National Statistics, 2011). About half of these live in Cardiff, in particular in the areas of Riverside and Grangetown. These communities have a close-knit social structure, including shops, restaurants and community centres, but, unlike those in Tower Hamlets and Camden, do not witness a steady influx of new arrivals from Bangladesh.
Of the approximately 500,000 British Bengalis, some 95% originate from the rural area of Sylhet in north-eastern Bangladesh (Chalmers & Miah, 1996), where Sylheti is spoken. Sylheti is typologically related to Standard Bengali (SB), but the two languages are not mutually intelligible (Chalmers & Miah, 1996; Rasinger, 2007). While native speakers of Sylheti, including first-generation migrants, are largely competent in SB, the language of education, this is not the case for most UK-born heritage speakers (Chalmers & Miah, 1996).
On the whole, Sylheti has a less complex phonological system than SB, with fewer consonant and vowel categories (Chalmers & Miah, 1996; Gope & Mahanta, 2015; Khan, 2010). Hence, while SB contains 16 stop categories that systematically contrast in voicing and breathiness, 1 Sylheti only contains nine (Gope & Mahanta, 2015; McCarthy et al., 2013, 2014). These include the voiced breathy stops / bʱ/ and /gʱ/, the voiced non-breathy stops /b d̪ ɖ g/ and the voiceless stops /t̪ ʈ k/.
A small number of acoustic studies have been carried out on Sylheti stops. Gope and Mahanta (2015) examined voiced stop productions with and without underlying breathiness by adult native speakers of Sylheti from India. They found no differences in VOT as a function of breathiness, with all categories realised with a voicing lead. McCarthy et al. (2013) revealed similar patterns for first-generation Bangladeshis who arrived in the UK in their late teens or in adulthood, and for their native Sylheti control speakers; in contrast, early arrivals (i.e. arrival in the UK < 16;0) and second-generation heritage speakers produced Sylheti voiced stops with significantly longer VOT values and less prevoicing, and hence more English-like. Voiceless stops, in turn, were produced within the short-lag range by all speaker groups (native control mean: /t̪/: 26 ms, /ʈ/: 14 ms, /k/: 16 ms). This contrasts with other varieties, such as Dhaka Bengali, where /ʈʰ/ and /t̪ʰ/ are realised with long-lag VOT values, with mean values between 50 and 100 ms (Maxwell, Baker, Bundgaard-Nielson, & Fletcher, 2015).
No previous work on children’s acquisition of Sylheti stops is available. Studies from other languages suggest that monolingual children acquire the stop voicing contrast earlier in languages that distinguish short-lag and long-lag VOT categories, like English, than in languages with a distinction between lead voice and short-lag VOTs, like Sylheti (Allen, 1985; Bortolini, Zmarich, Fior, & Bonifacio, 1995; Gandour, Petty, Dardarananda, Dechongkit, & Munkgoen, 1986; Khattab, 2000; Macken & Barton, 1979, 1980). Indeed, the acquisition of lead voicing seems to be a particularly protracted process, perhaps due to its aerodynamic challenges (Cho & Ladefoged, 1999; Van Alphen & Smits, 2004), with children as old as 7;0 struggling to use it consistently (Khattab, 2000). Studies on bilingual and multilingual children, in turn, have shown cross-linguistic interactions (Deuchar & Clark, 1996; Fabiano-Smith & Bunta, 2012; Heselwood & McChrystal, 2000; Khattab, 2000; Kehoe, Lleó, & Rakow, 2004; Mayr & Montanari, 2015; Simon, 2010). For example, the Dutch-English bilingual child studied by Simon (2010) realised Dutch /p/ and /t/ with long-lag VOT values, instead of target short-lag ones, after extensive exposure to English. Similarly, Heselwood and McChrystal’s (2000) study revealed greater use of prevoicing in English voiced stops produced by Punjabi-English bilingual children than by their monolingual English peers. The only study to examine stop consonants in Bangladeshi heritage children from a Sylheti-speaking community is McCarthy et al. (2014; see also McCarthy, 2015). This study revealed changes during the first year of school in the children’s production and perception of English /p b k g/ in the direction of their monolingual peers’ patterns. No data on the children’s Sylheti stops were collected, however.
The purpose of the present study was to extend existing work on the speech of Bangladeshi heritage speakers in the UK by investigating the production of stop consonants in Sylheti and English by second- and third-generation children and their mothers.
Method
Participants
Two sets of Bangladeshi heritage families participated in the study. All demographic data were established using a parental questionnaire. The first family consisted of first-generation female immigrants from the Sylhet area of Bangladesh (GEN 1 MUMS: N=5) and their children (GEN 2 CHILDREN: N=10). The GEN 1 MUMS had a mean age of 35 years (SD: 7.65) at the time of data collection and had been residing in the UK for an average of 12.2 years (SD: 7.29), having arrived in the UK in their late teens or in early adulthood. Sylheti was their predominant home and community language, and they reported mainly consuming Sylheti-language media (see Table 1 for details). Their children, in contrast, ranged in age between 3;7 and 5;0 (mean age: 4;5) and were all born in the UK. Their use of Sylheti and English in the home was approximately equal, while they only spoke Sylheti in the community 23% of the time, and never consumed Sylheti-language media. These families live in the Riverside and Grangetown areas of Cardiff, which have a large concentration of Bangladeshi heritage speakers, and spend an average of one week per year in Bangladesh to visit relatives.
Participant information.

Estimated language use patterns; mothers reported for their children.
The second set of Bangladeshi heritage families encompassed second-generation female heritage speakers of Sylheti (GEN 2 MUMS: N=6) and their children (GEN 3 CHILDREN: N=10). The GEN 2 MUMS had all been born in the UK to first-generation migrants from Bangladesh. They had a mean age of 31 years (SD: 3.08) at the time of data collection and did not differ significantly in age from the GEN 1 MUMS (t(5.078)=1.189, p=.287). They reported using Sylheti in the home 23% of the time and in the community 13% of the time. Their children (GEN 3 CHILDREN) were also all born in the UK, and were the same age as the GEN 2 CHILDREN (Mean: 4;3; range: 3;8–4;11; t(18)=.831, p=.417). This group exhibited the lowest Sylheti usage patterns, with only 5% of conversations in the home and 9% in the community carried out in the minority language. In contrast to the first-generation mothers and their children, these families do not live in communities with a large concentration of Bangladeshi heritage speakers, and virtually never travel to Bangladesh to visit relatives. None of the participants reported any speech, language and communication difficulties. All had normal hearing.
Materials
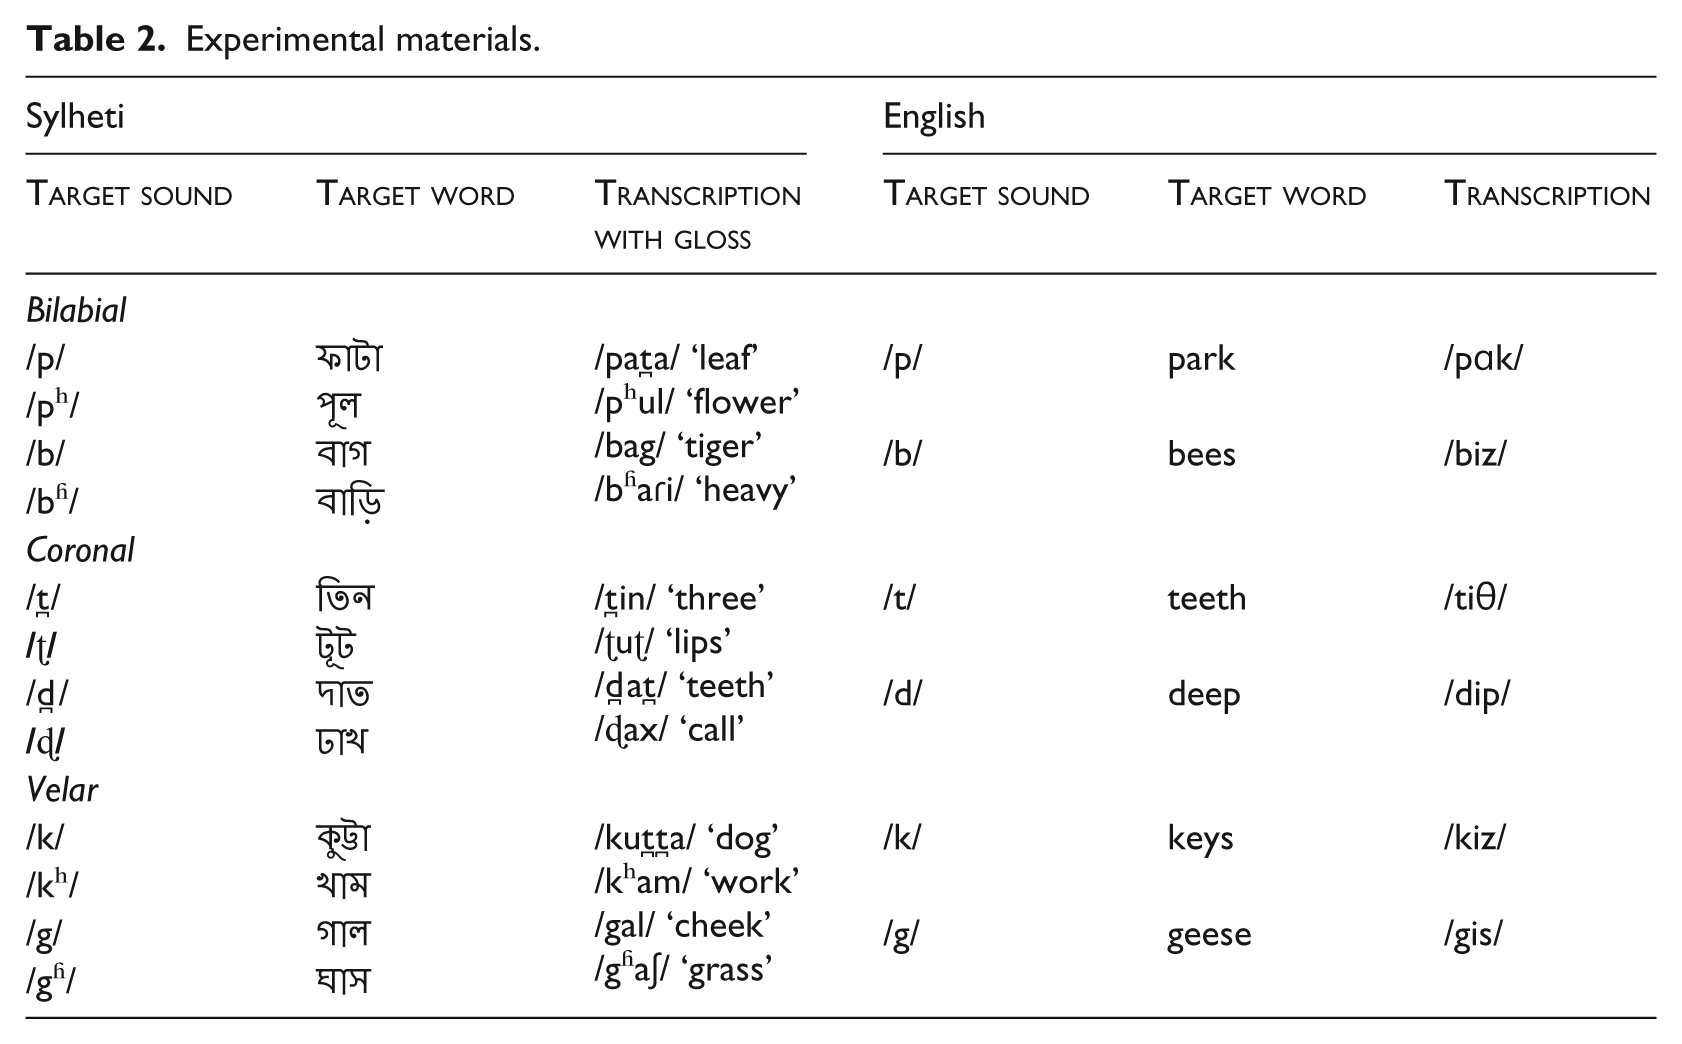
This study aimed to assess all stop consonant categories that occur word-initially in Sylheti and English. Table 2 depicts the materials used in the study. They include monosyllabic and bisyllabic words starting with a singleton bilabial, coronal or velar stop in the onset. Words were chosen with which young children and adults were expected to be familiar, and which could be elicited via pictorial representation. The English dataset comprised the categories /p b t d k g/, the Sylheti dataset the categories /p pʰ b bʱ t̪ ʈ d̪ ɖ k kʰ g gʱ/. Note that the latter included three categories that previous research had shown to be realised as fricatives by Sylheti speakers, but that historically constitute stops, i.e. /p/, /pʰ/ and /kʰ/ (Gope & Mahanta, 2015; McCarthy et al., 2013).
Experimental materials.
Procedure
Data collection took place in a quiet room in the participants’ homes. Each participant was recorded twice, once in a Sylheti session, and once in an English one, with the two sessions separated by several days. This procedure was adopted to minimise the likelihood of dual language activation (Grosjean, 2001). Recordings were made using a Zoom H2 Handy Recorder with integrated condenser microphone, which was positioned a few centimetres from the participant’s mouth (sampling rate: 44.1 kHz; 16-bit resolution). Each session commenced with a brief conversation in the target language with the experimenter, a UK-born Sylheti–English bilingual. This was followed by a picture-naming task that aimed to elicit three instances of each target word produced at a natural pace in a carrier phrase (English: X I say; Sylheti: হে খই /heə xɔɪ/ (‘X he says’)). This procedure yielded 3 × 6 = 18 tokens of the English stops and 3 × 12 = 36 tokens of the Sylheti stops from each participant, giving a total of 1674 tokens. No formal assessment of the children’s lexical knowledge was carried out, but almost all items could be elicited spontaneously. In the few instances where this was not possible, semantic prompts were given, and if these were unsuccessful, the target words were modelled by the experimenter. No attempts were made to elicit stop consonants in isolation.
Analysis
Many studies have examined stop consonants acoustically (e.g. Bortolini et al., 1995; Kirkham, 2011; Mayr & Montanari, 2015; Sundara, 2005). While temporal measures, such as VOT, allow for direct comparisons between child and adult participants, this is not the case for spectral measures that aim to assess differences in place of articulation as they vary with vocal tract size. Moreover, the relation between acoustic properties for place of articulation and breathiness, and their articulatory and perceptual correlates is complex. For example, differences in spectral shape may be due, not to differences in place of articulation, but variations in the degree of damping of the active articulator (Sundara, 2005).
For these reasons, we opted for a two-way approach in the present study. First, the materials were analysed auditorily. This involved all target words being transcribed in broad phonetic transcription by a phonetically trained Sylheti-English bilingual, using the symbols of the International Phonetic Association (International Phonetic Association, 2005). This analysis focused on establishing the place of articulation of each stop production. This was particularly critical for coronal stops. In addition, it assessed the presence or absence of breathiness in voiced stops. Only tokens that conformed to the reported adult forms in native Sylheti and English stops (Chalmers & Miah, 1996; Docherty, 1992; Gope & Mahanta, 2015; McCarthy et al. 2013) were classified as target-like 2 . As a measure of reliability, the entire dataset was independently reanalysed by a second phonetically trained researcher with no prior knowledge of Sylheti or related languages. Cohen’s κ was run to determine if there was agreement between the two sets of transcriptions. The results revealed substantial agreement (κ=.682 (95% CI, .629 to .735), p<.0005), based on Landis and Koch’s (1977) classification. Any differences in the two sets of transcriptions were resolved by consensus. Uncertainty remained on one token of English /g/ and one token each of Sylheti /bʱ/, /t̪/, /ɖ/and /g/. These tokens were removed from further analysis.
To assess voicing, we analysed the participants’ VOT patterns acoustically, using PRAAT software (Boersma & Weenink, 2010). Measurements were taken from the release burst of each token, signalled by a sharp peak in waveform energy, to the onset of voicing of the following vowel, as marked by the zero crossing of the first glottal pulse for modal voicing (Figure 1(a), 1(b)). Tokens that displayed more than one transient were measured from the first visible release burst. If voicing occurred during the closure period, VOT was measured from the point at which vocal fold vibration could be discerned in the waveform, together with aperiodic wide-band energy in the spectrograms, up to the first release burst (Figure 1(c)). The onset of lead voicing was established visually. Tokens where this could not be determined clearly were excluded from the VOT analysis, as were tokens without a visible release burst. In total, 28 Sylheti tokens (=2.51%) and 22 English tokens (=3.9%) were excluded.

Waveform and spectrogram of stop realised with long-lag VOT (a), short-lag VOT (b) and lead VOT (c); all 150 ms in duration.
Results
In line with previous studies (Gope & Mahanta, 2015; McCarthy et al., 2013), we found that Sylheti /p/ and /pʰ/ were realised as [f], and Sylheti /kʰ/ as [x] in virtually all instances. As a result, these categories were not analysed further. All other categories in Sylheti and English were realised as stops.
In what follows, the results are organised in three parts according to place of articulation (i.e. bilabial, coronal and velar). Each part is further divided by language, first presenting intra-linguistic comparisons for Sylheti and English stops and then a cross-linguistic comparison. The auditory and acoustic results are integrated within each section.
To determine differences between the groups and stops, linear mixed-effects models were run separately in R (R Core Team, 2016) for the auditory and acoustic data, and for each place of articulation, using all analysed tokens. In each model, stop and group were entered as fixed factors (including interaction) and speaker as a random factor with random slopes for stop. Note that stop and group were coded around zero. This made it possible to interpret the fixed factors as main effects. Using the LmerTest function in R (Bates, Maechler, Bolker, & Walker, 2015), degrees of freedom were obtained via the Satterthwaite approximation with which p-values could be generated.
Bilabial stops
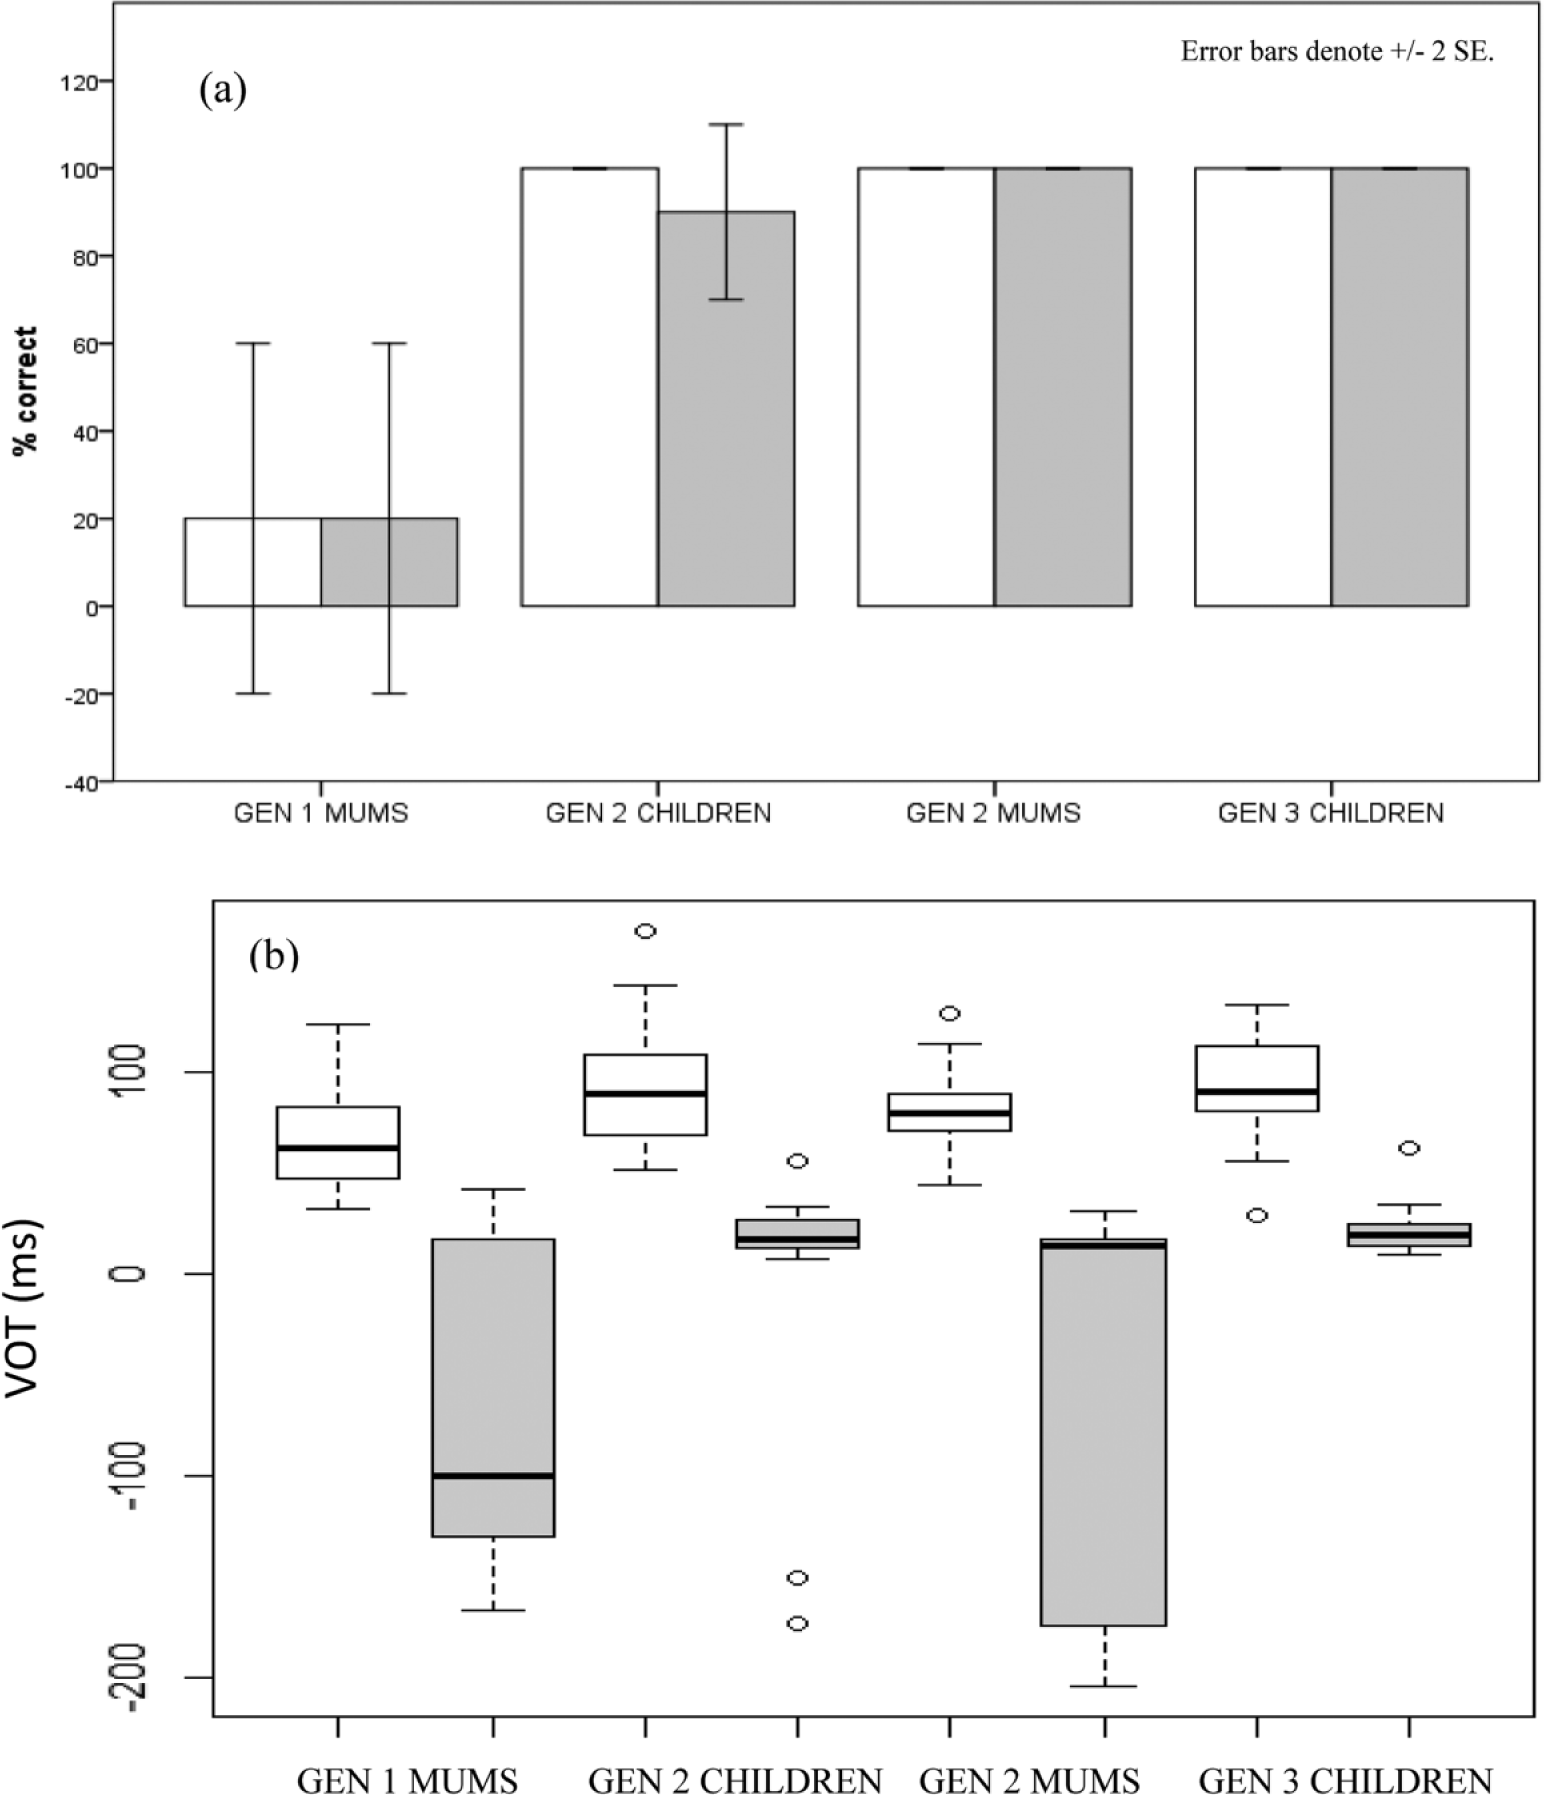
Sylheti
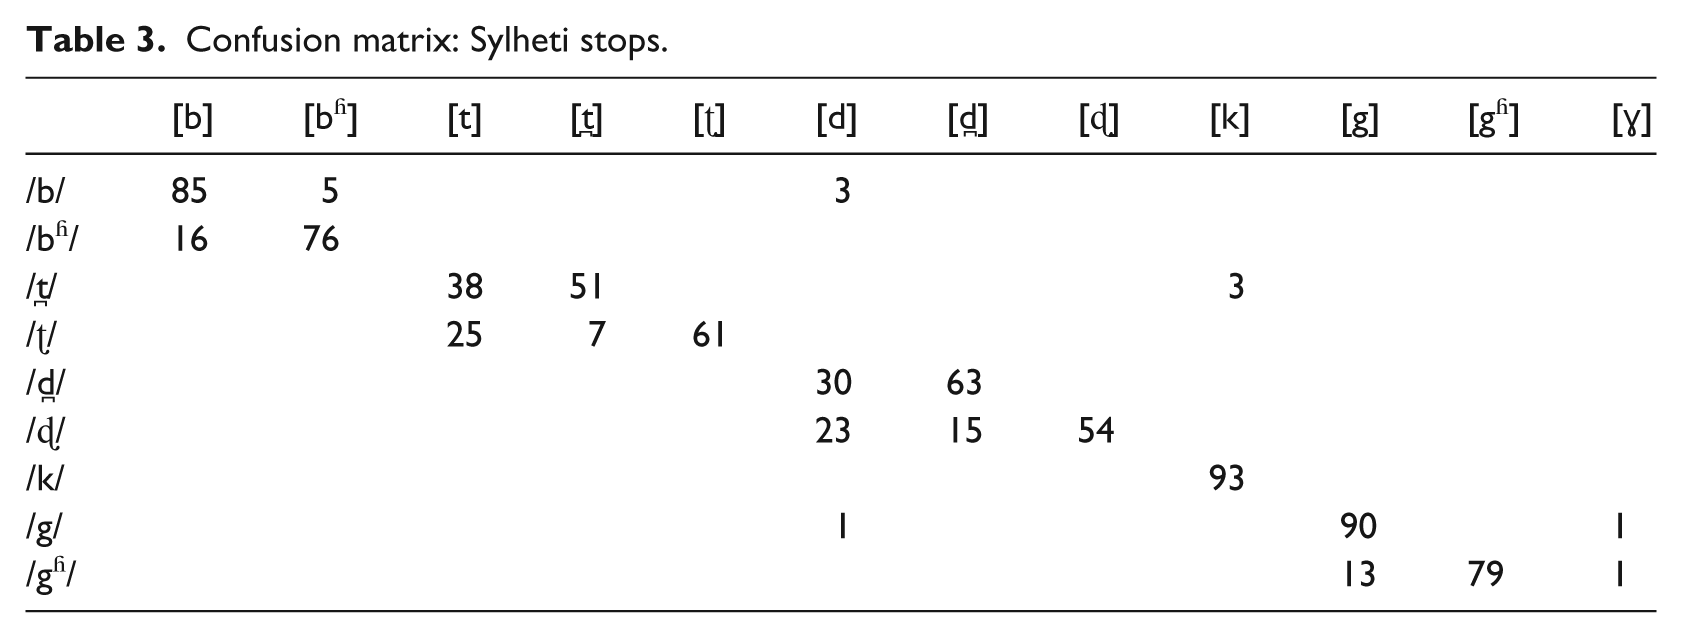
Figure 2(a) depicts the percentage of bilabial Sylheti stops that were produced accurately in terms of place of articulation and breathiness, as assessed in the auditory analysis. The results show that the GEN 1 MUMS managed to produce /b/ and /bʱ/ entirely accurately in terms of these dimensions, while the GEN 3 CHILDREN had the lowest accuracy score overall, with all non-target-like tokens of /bʱ/ realised as [b], lacking breathiness (see Table 3 for a confusion matrix of all Sylheti stops 3 ).

Percent correct productions (a) and VOT distributions (b) for Sylheti /b/ (grey) and /bʱ/(white).
Confusion matrix: Sylheti stops.
To determine whether the between-group differences are significant, a linear mixed-effects model was run with stop (2 levels: /b/; /bʱ/) and group (4 levels: GEN 1 MUMS; GEN 2 CHILDREN; GEN 2 MUMS; GEN 3 CHILDREN) as fixed factors (including interaction) and speaker as a random factor with random slopes for stop. The results, displayed in Table 4, revealed no significant main effect of stop, but a significant main effect of group and a significant group*stop interaction. To examine these results further, we compared each of the groups with each other in separate regression models, run separately for /b/ and /bʱ/, with group as fixed factor and speaker as random factor. The α-level was adjusted to .025, using the Holm-Bonferroni method (Holm, 1979). Only one of the models revealed a significant effect of group, with the GEN 2 CHILDREN outperforming the GEN 3 CHILDREN on /bʱ/ (p=.006).
Results of mixed-effects models for bilabial stops.
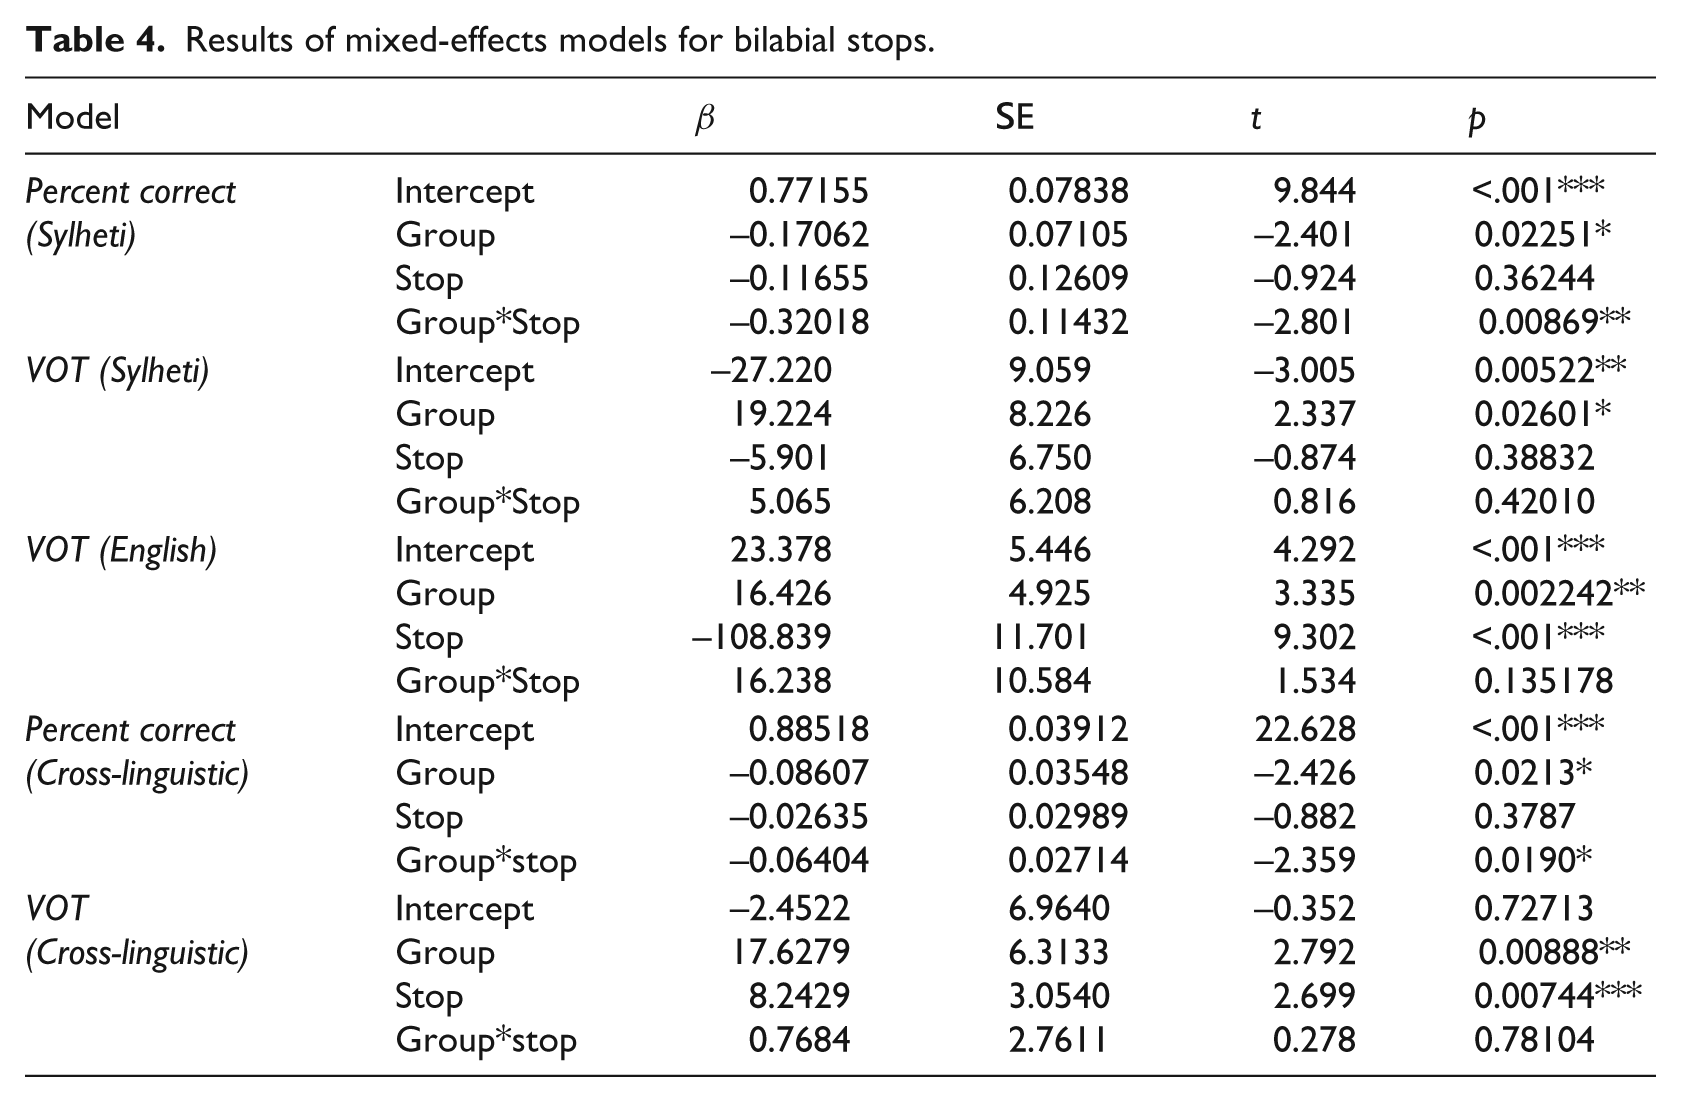
Figure 2(b) shows the results of the VOT analysis for Sylheti /b/ and /bʱ/. In line with previous work (Gope & Mahanta, 2015; McCarthy et al., 2013), the adult participants predominantly exhibited prevoicing (GEN 1 MUMS: 68%, i.e. 19/28 tokens; GEN 2 MUMS: 56%, i.e. 19/34 tokens). In contrast, the GEN 2 CHILDREN only realised 21% of their tokens with a voicing lead (i.e. 12/58 tokens), and the GEN 3 CHILDREN prevoiced none, instead realising all tokens with short-lag VOT values.
To determine whether the between-group differences in VOT are significant, a linear mixed-effects model was run with stop and group as fixed factors (including interaction) and speaker as a random factor with random slopes for stop. The results, displayed in Table 4, revealed no significant main effect of stop, and no significant group*stop interaction. However, it did find a significant main effect of group. To examine this effect further, we compared each of the groups with each other in separate regression models, run separately for /b/ and /bʱ/, with group as fixed factor and speaker as random factor. The α-level was adjusted to .008. The results revealed significantly longer VOT values for the GEN 3 CHILDREN on both Sylheti stops than the GEN 1 MUMS (/b/: p=.003; /bʱ/: p<.001), and the GEN 2 MUMS (/b/: p=.001; /bʱ/: p=.002). No differences were observed between the adult participants and the GEN 2 CHILDREN.
English
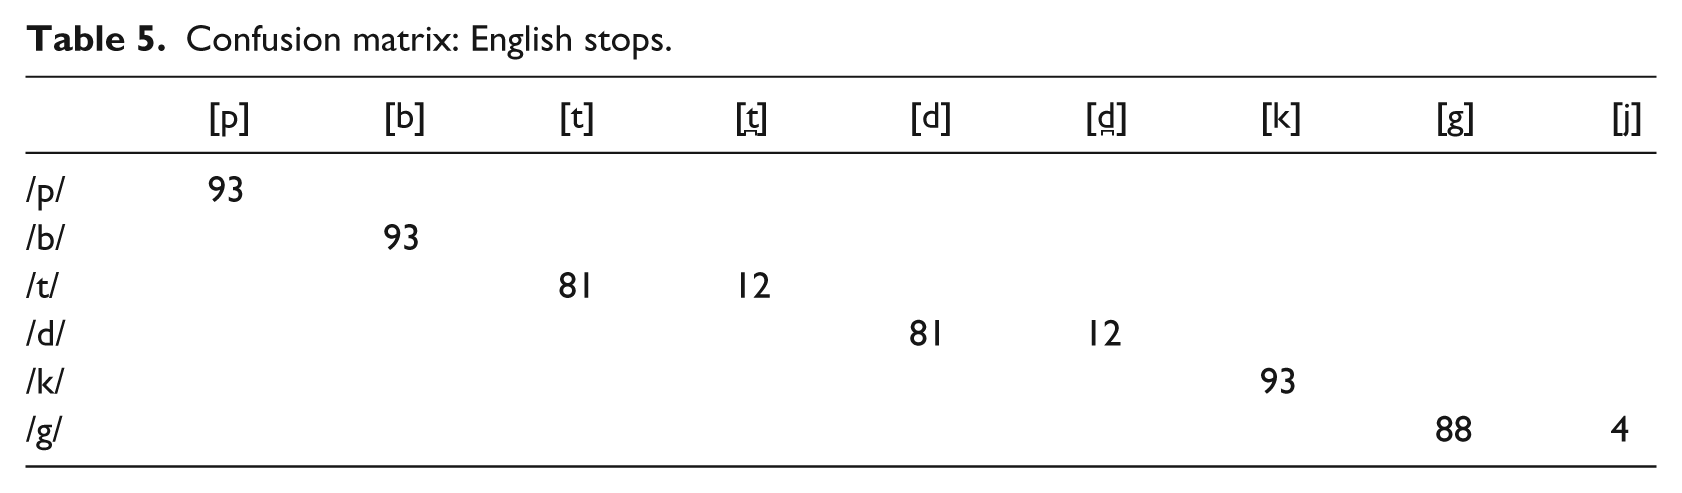
The auditory analysis revealed that English /b/ and /p/ were consistently produced at the correct place of articulation. Moreover, there were no breathy tokens of English /b/ (see Table 5 for a confusion matrix of all English stops). However, an analysis of the participants’ VOT patterns showed differences in voicing across the groups (see Figure 3). Accordingly, the GEN 1 MUMS prevoiced 73% (11/15 tokens) of their English /b/ productions, while the GEN 2 MUMS only prevoiced 35% (6/17 tokens) and the GEN 2 CHILDREN only 18% (5/28 tokens). As in Sylheti, the GEN 3 CHILDREN produced no prevoiced tokens at all, instead realising English /b/ with short-lag VOT values throughout.
Confusion matrix: English stops.
VOT distributions for English /p/ (white) and /b/ (grey).
To determine whether the between-group differences are significant, a linear mixed-effects model was run with stop and group as fixed factors (including interaction) and speaker as a random factor with random slopes for stop. The results, displayed in Table 4, revealed significant main effects of group and stop, but no significant group*stop interaction. To examine this effect further, we compared each of the groups with each other in separate regression models, run separately for /p/ and /b/, with group as fixed factor and speaker as random factor. The α-level was adjusted to .01. The results revealed significantly longer VOT values for the GEN 3 CHILDREN on English /b/ than the GEN 1 MUMS (p<.001). No other between-group differences were significant.
Cross-linguistic comparison
To determine whether the participants produced bilabial stops differently in Sylheti and English, two linear mixed-effects models were run, one on the percent correct scores, and one on VOT. Both models had stop and group as fixed factors (including interaction) and speaker as a random factor with random slopes for stop. The results, displayed in Table 4, revealed significant main effects of group for both models, as well as a significant effect of stop for the VOT model, and a significant group*stop interaction for the percent correct model. To examine these effects further, we compared each combination of stops across the two languages for each group in separate regression models with stop as fixed factor and speaker as random factor. The α-level was adjusted to .017 for the percent correct scores and .006 for VOT. The results on the percent correct scores revealed significantly greater accuracy on English /b/ than Syheti /b/ for the GEN 2 CHILDREN (p=.007), and significantly greater accuracy on English /b/ than Sylheti /bʱ/ for the GEN 3 CHILDREN (p<.001). Moreover, with respect to VOT, all four groups exhibited significantly longer VOT values for English /p/ than Sylheti /b/ and /bʱ/ (all: p<.001). There were no significant differences in VOT between Sylheti /b/ and /bʱ/, and English /b/.
Coronal stops
Sylheti
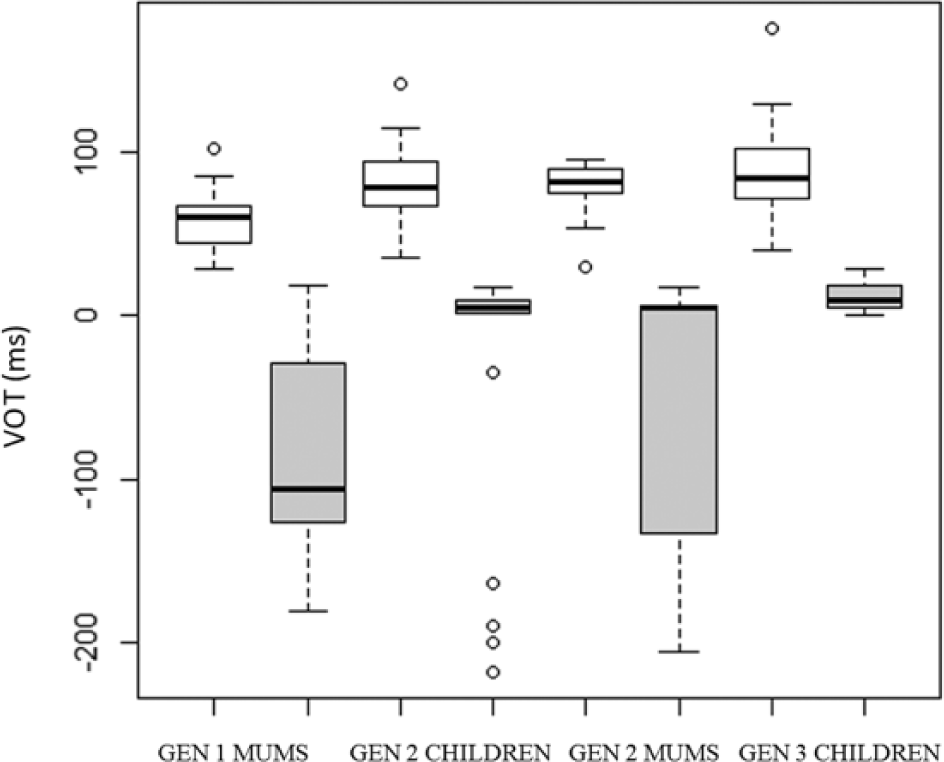
Figure 4(a) shows the percentage with which the Sylheti coronal stops /t̪ ʈ d̪ ɖ/ were produced at the correct place of articulation. The GEN 1 MUMS were the most accurate, while performance by the other groups was variable, resulting in lower accuracy rates, in particular for the GEN 3 CHILDREN. The majority of errors involved realising dental and retroflex stops as alveolars (82%, 116/ 141 tokens). However, confusion between retroflex and dental categories was also common, accounting for 16% of errors overall (22/ 141 tokens). See Table 3 for further details.
Percent correct productions (a) and VOT distributions (b) of Sylheti /t̪/(white),/ʈ/(dark grey), /d̪/(grey), /ɖ/(light grey).
To determine whether the between-group differences on Sylheti coronal stops are significant, a linear mixed-effects model was run with stop (4 levels: /t̪ ʈ d̪ ɖ/) and group (4 levels: GEN 1 MUMS; GEN 2 CHILDREN; GEN 2 MUMS; GEN 3 CHILDREN) as fixed factors (including interaction) and speaker as a random factor with random slopes for stop. The results, displayed in Table 6, revealed a significant main effect of group, but no significant main effect of stop and no significant group*stop interaction. To examine these results further, we compared each of the groups with each other in separate regression models, run separately for each of the stops, with group as fixed factor and speaker as random factor. The α-level was adjusted to .01. The results revealed significantly greater accuracy on /t̪/ for the GEN 1 MUMS than the GEN 3 CHILDREN (p=.005). No other between-group differences reached significance.
Results of mixed-effects models for coronal stops.
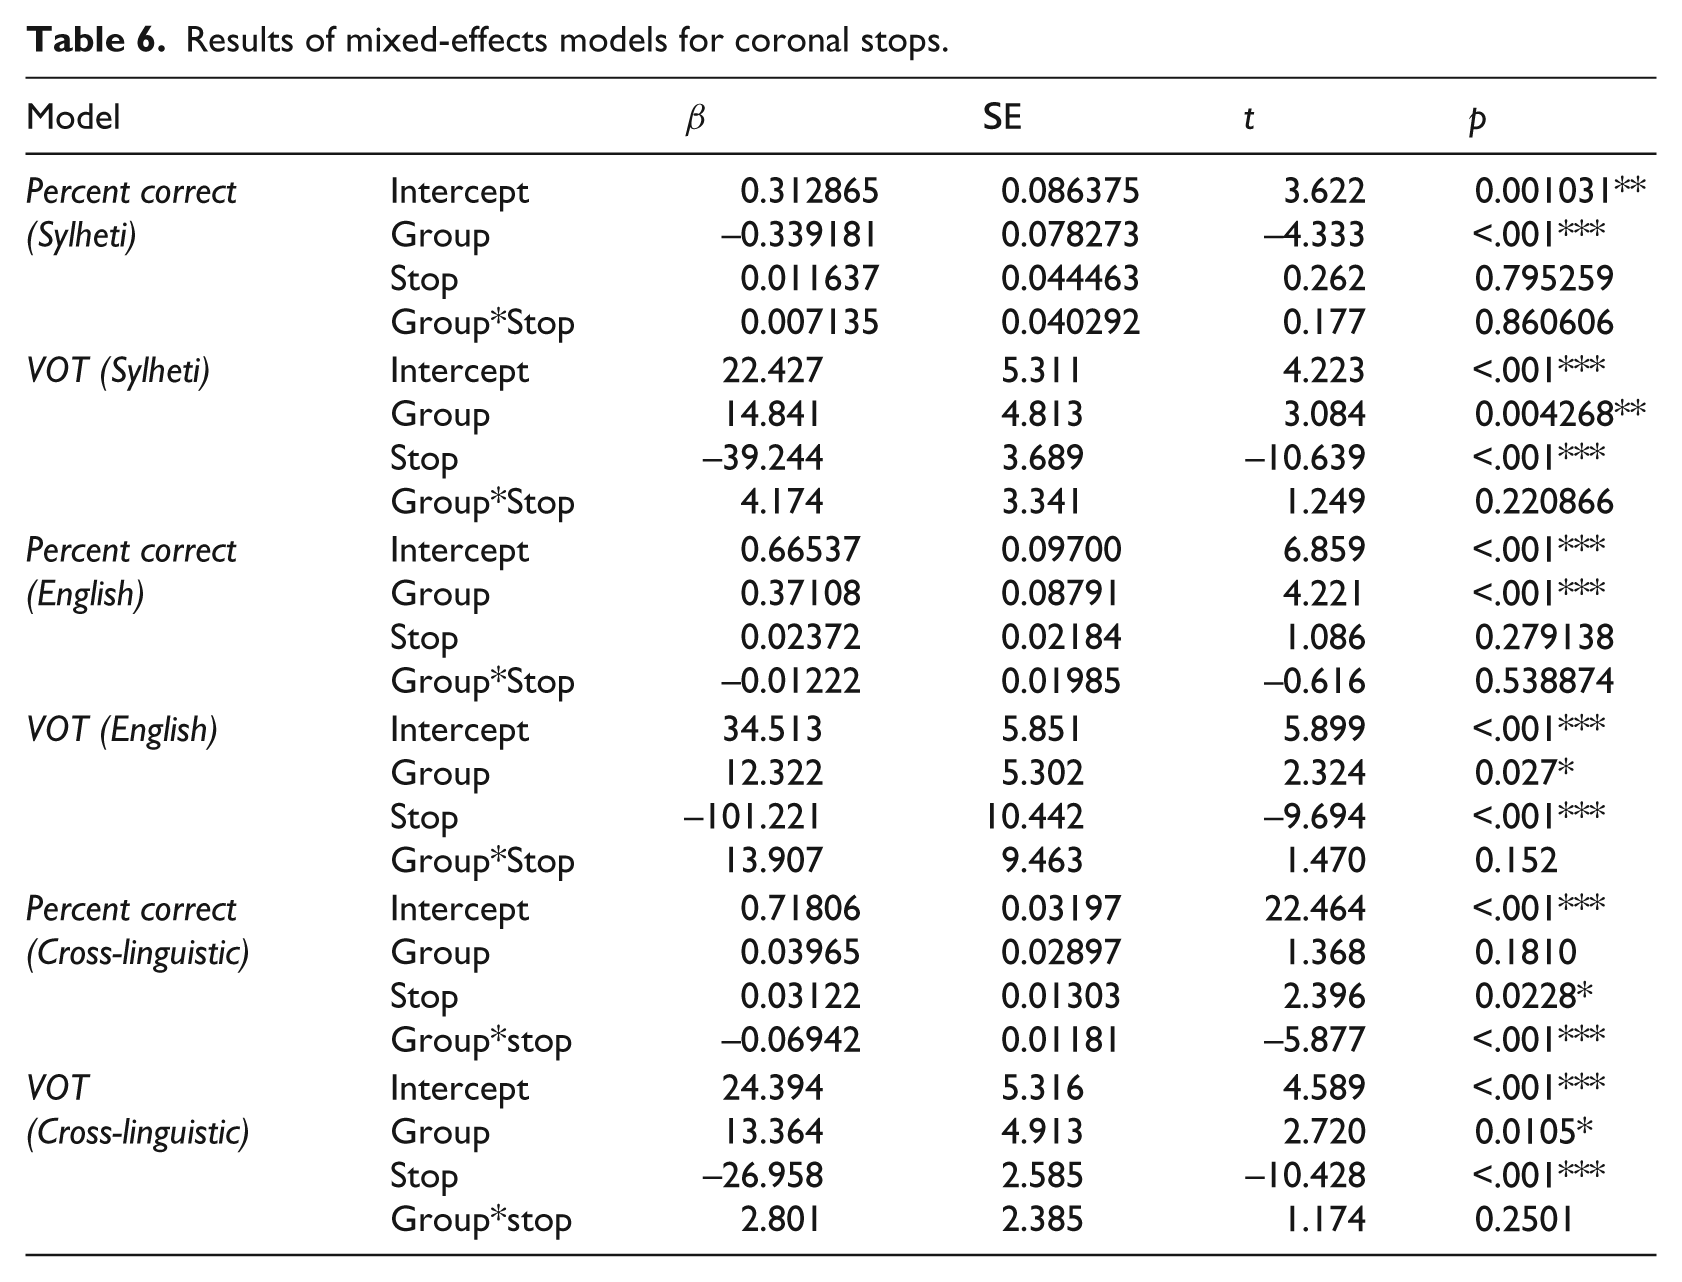
Figure 4(b) presents the VOT values of the Sylheti coronal stops. Previous data from Sylheti speakers in Asia (Gope & Mahanta, 2015) suggest consistent prevoicing in voiced stops. The two groups of adults in the present study broadly followed this pattern, with the GEN 1 MUMS prevoicing 66% (19/29 tokens) of their voiced coronal stops, and the GEN 2 MUMS 61% (22/36 tokens). In contrast, the GEN 2 CHILDREN only prevoiced 16% (9/55 tokens) of their /d̪/ and /ɖ/ productions, and the GEN 3 CHILDREN fewer than 2% (1/60 tokens). The voiceless coronal stops, in turn, were realised within the long-lag VOT range by all groups.
To determine whether the between-group differences in VOT for Sylheti coronal stops are significant, a linear mixed-effects model was run with stop and group as fixed factors (including interaction) and speaker as a random factor with random slopes for stop. The results, displayed in Table 6, revealed significant main effects of group and stop, but no significant group*stop interaction. To examine these results further, we compared each of the groups with each other in separate regression models, run separately for each of the stops, with group as fixed factor and speaker as random factor. The α-level was adjusted to .004. The results showed that the GEN 3 CHILDREN produced /t̪/, /d̪/, and /ɖ/ with significantly longer VOT values than the GEN 1 MUMS (all: p<.001), and /d̪/ with significantly longer VOT values than the GEN 2 MUMS (p<.001). The GEN 2 CHILDREN produced Sylheti /ɖ/ with significantly longer VOT values than the GEN 1 MUMS (p=.003).
English
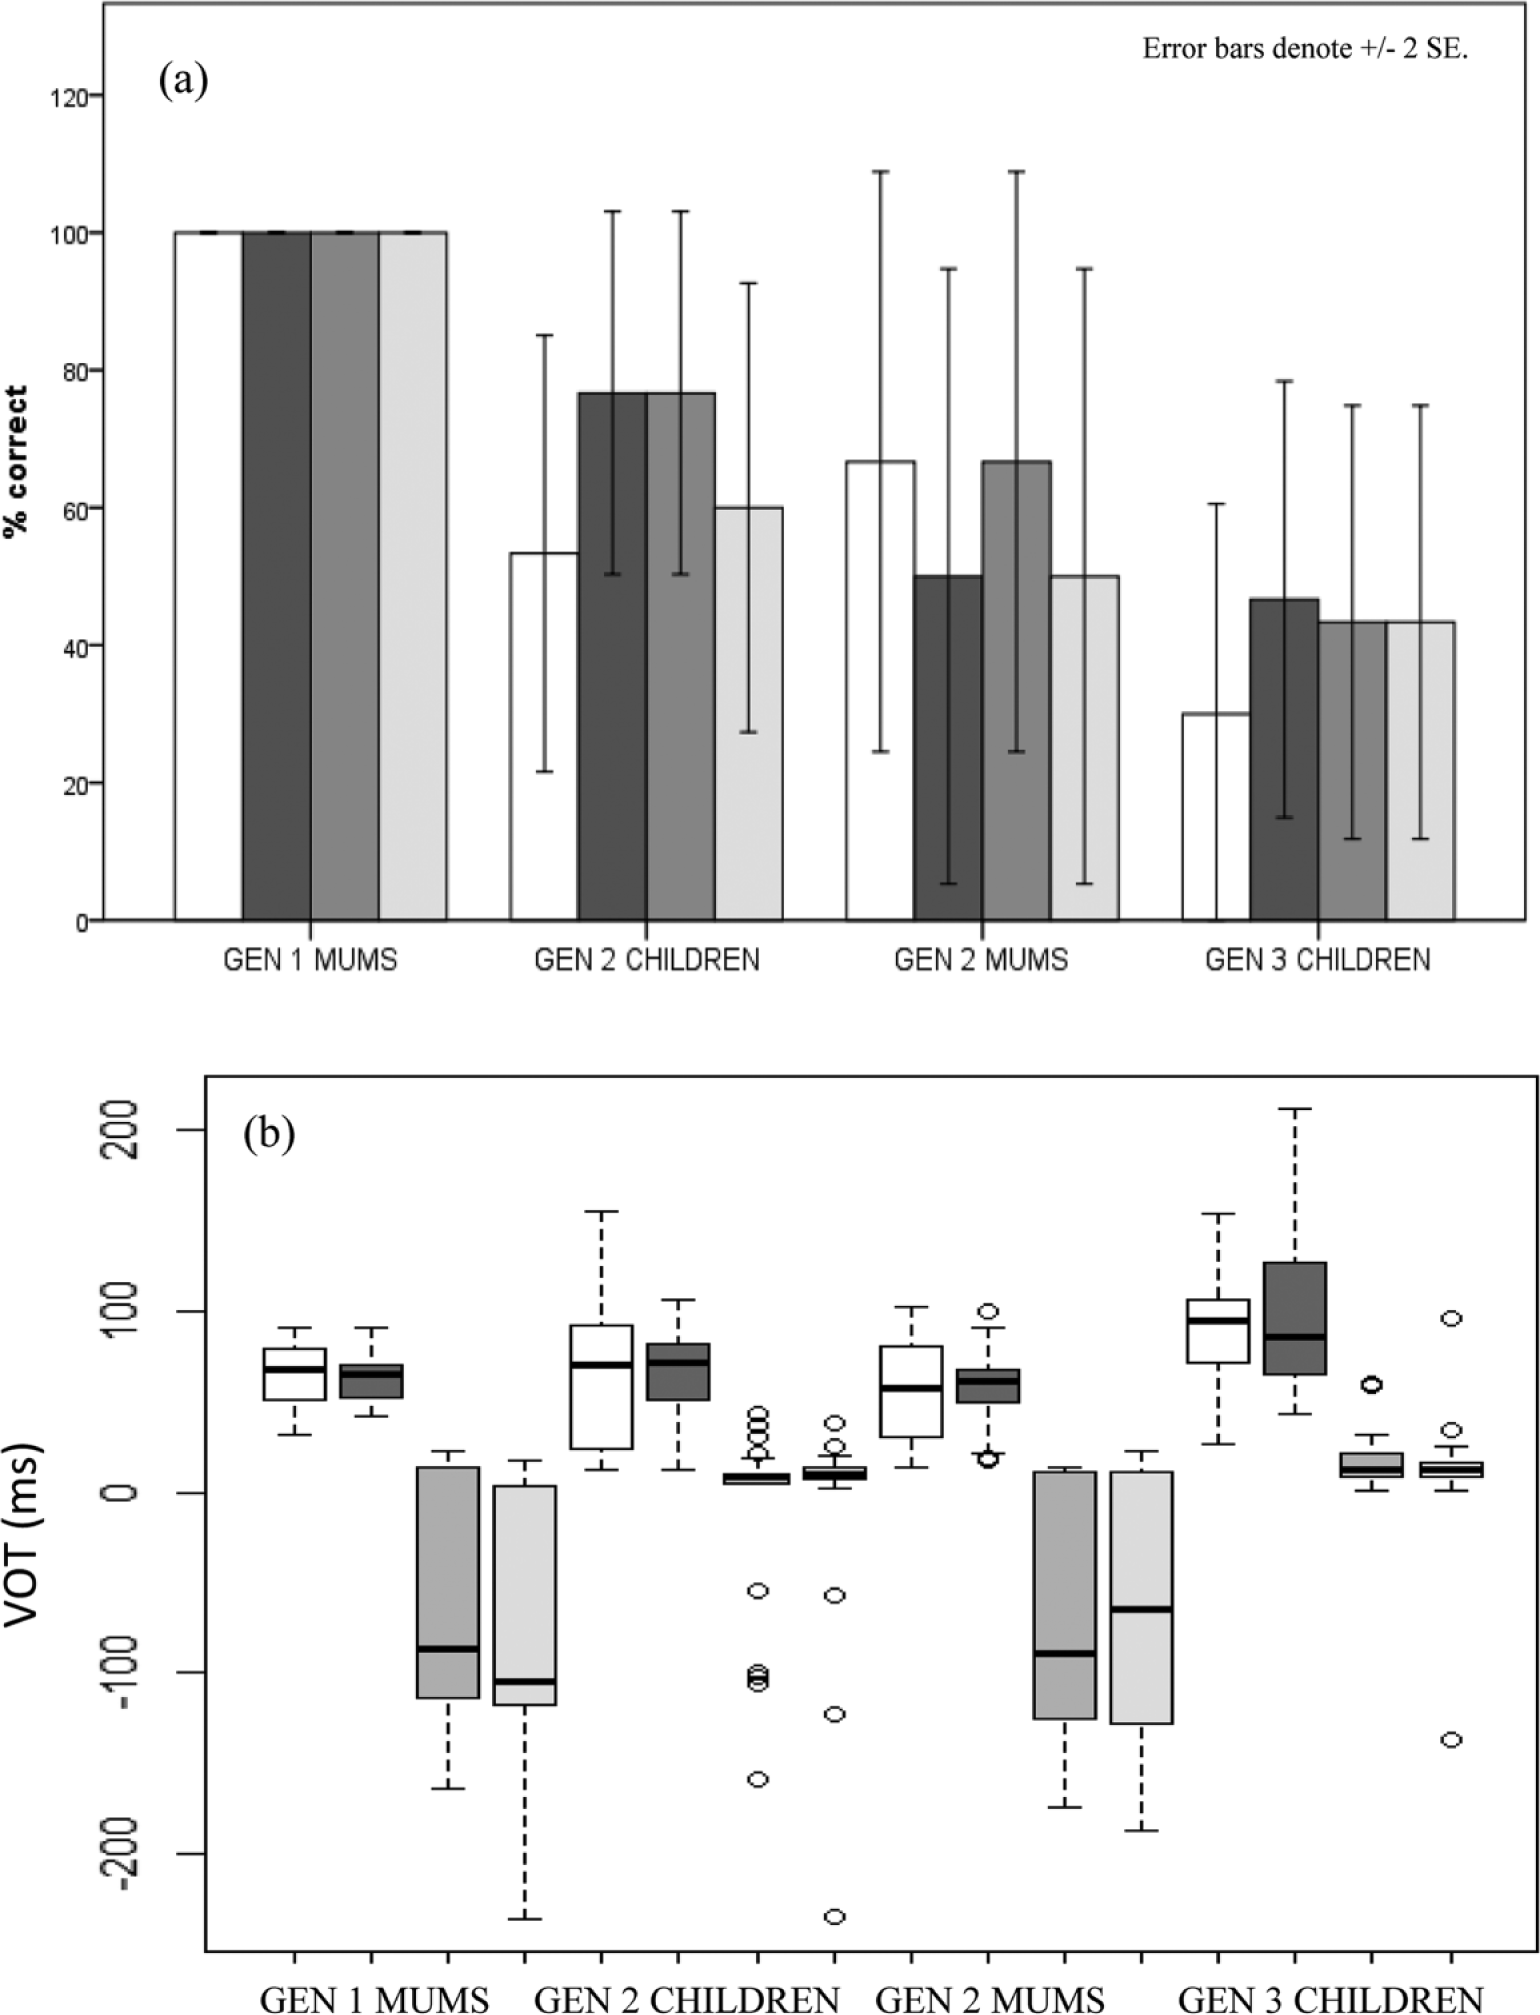
Figure 5(a) shows the percentage of correct productions of English /t/ and /d/. Inspection of the figure shows that the child participants and the GEN 2 MUMS exhibited high degrees of accuracy on these categories. In contrast, the GEN 1 MUMS largely produced them inaccurately. An examination of their error patterns revealed that all non-target-like tokens of /t/ were realised as [t̪] and all non-target-like tokens of /d/ as [d̪] (see Table 4 for details).
Percent correct productions (a) and VOT distributions (b) for English /t/ (white) and /d/ (grey).
These differences were tested in a linear mixed-effects model with stop and group as fixed factors (including interaction) and speaker as a random factor with random slopes for stop. The results, displayed in Table 6, revealed a significant main effect of group, but no significant main effect of stop and no significant group*stop interaction. To examine these results further, we compared each of the groups with each other in separate regression models, run separately for English /t/ and /d/, with group as fixed factor and speaker as random factor. The α-level was adjusted to .004. The results revealed that the GEN 1 MUMS were significantly less accurate on English /t/ and /d/ than the GEN 2 CHILDREN, the GEN 2 MUMS and the GEN 3 CHILDREN (all: p<.001).
Figure 5(b) depicts the VOT patterns for English /t/ and /d/ across the groups. Inspection of the figure shows similar patterns for English /t/, with realisations in the long-lag VOT range throughout. In contrast, the VOT patterns for English /d/ show stark differences across the groups: the GEN 1 MUMS mainly realised this category with a voicing lead (67%, i.e. 10/15 tokens); in contrast, the GEN 2 MUMS only exhibited prevoicing in 35% of instances (6/17 tokens) and the GEN 2 CHILDREN in 7% of instances (2/30 tokens), while the GEN 3 CHILDREN did not prevoice any of their English /d/ tokens.
To determine whether these differences are significant, a linear mixed-effects model was run with stop and group as fixed factors (including interaction) and speaker as a random factor with random slopes for stop. The results, displayed in Table 6, revealed significant main effects of group and stop, but no significant group*stop interaction. To examine these results further, we compared each of the groups with each other in separate regression models, run separately for each of the stops, with group as fixed factor and speaker as random factor. The α-level was adjusted to .01. The results showed that the GEN 3 CHILDREN produced English /d/ with significantly longer VOT values than the GEN 1 MUMS (p<.001) and the GEN 2 MUMS (p=.008). The GEN 2 CHILDREN also produced /d/ with significantly longer VOT values than the GEN 1 MUMS (p=.005). No significant differences were observed for /t/.
Cross-linguistic comparison
To determine whether the participants produced coronal stops differently in Sylheti and English, two linear mixed-effects models were run, one on the percent correct scores, and one on VOT. Both models had stop and group as fixed factors (including interaction) and speaker as a random factor with random slopes for stop. The results, displayed in Table 6, revealed a significant main effect of stop and a significant group*stop interaction for the percent correct model, as well as significant main effects of group and stop for the VOT model. To examine these effects further, we compared each combination of stops across the two languages in separate regression models, run separately for each group, with stop as fixed factor and speaker as random factor. The α-level for the percent correct scores was adjusted to .002, and for VOT to .01. The results showed that the GEN 1 MUMS had significantly higher percent correct scores on Sylheti /t̪/, /ʈ/, /d̪/ and /ɖ/ than English /t/ and /d/, while the GEN 2 CHILDREN, the GEN 2 MUMS, the GEN 3 CHILDREN showed the reverse pattern with significantly higher percent scores for English coronal stops than Sylheti ones (all: p<.001). There were only two exceptions to this pattern: the GEN 2 CHILDREN did not differ significantly in their accuracy of Sylheti /ʈ/ and English /d/ (p=.009), and of Sylheti /d̪/ and English /d/ (p=.009). The results for VOT, in turn, showed that the GEN 2 CHILDREN had significantly longer VOT values on English /t/ than Sylheti /t̪/ (p=.001) and /ʈ/ (p<.001). Similarly, the GEN 2 MUMS had significantly longer VOT values on English /t/ than Sylheti /t̪/ and /ʈ/ (both: p<.001). No other cross-linguistic differences were observed.
Velar stops
Sylheti
Figure 6(a) presents the percentage of correct productions of the Sylheti velar stops /k g gʱ/ in terms of place of articulation and breathiness. The figure shows largely accurate performance overall, with slightly lower accuracy scores for the GEN 2 MUMS and the GEN 3 CHILDREN. All erroneous productions of /gʱ/ were realised as [g], lacking breathiness (see Table 3 for details). To examine if these differences are significant, a linear mixed-effects model was run with stop (3 levels: /k/; /g/; /gʱ/) and group (4 levels: GEN 1 MUMS; GEN 2 CHILDREN; GEN 2 MUMS; GEN 3 CHILDREN) as fixed factors (including interaction) and speaker as a random factor with random slopes for stop. The results, displayed in Table 7, revealed significant main effects of group and stop and a significant group*stop interaction. However, further regression models, run separately for each stop with group as fixed factor and speaker as random factor, and an adjusted α-level of .025, revealed no significant between-group differences.

Percent correct productions (a) and VOT distributions (b) of Sylheti /k/ (white), /g/ (dark grey) and /gʱ/ (light grey).
Results of mixed-effects models for velar stops.
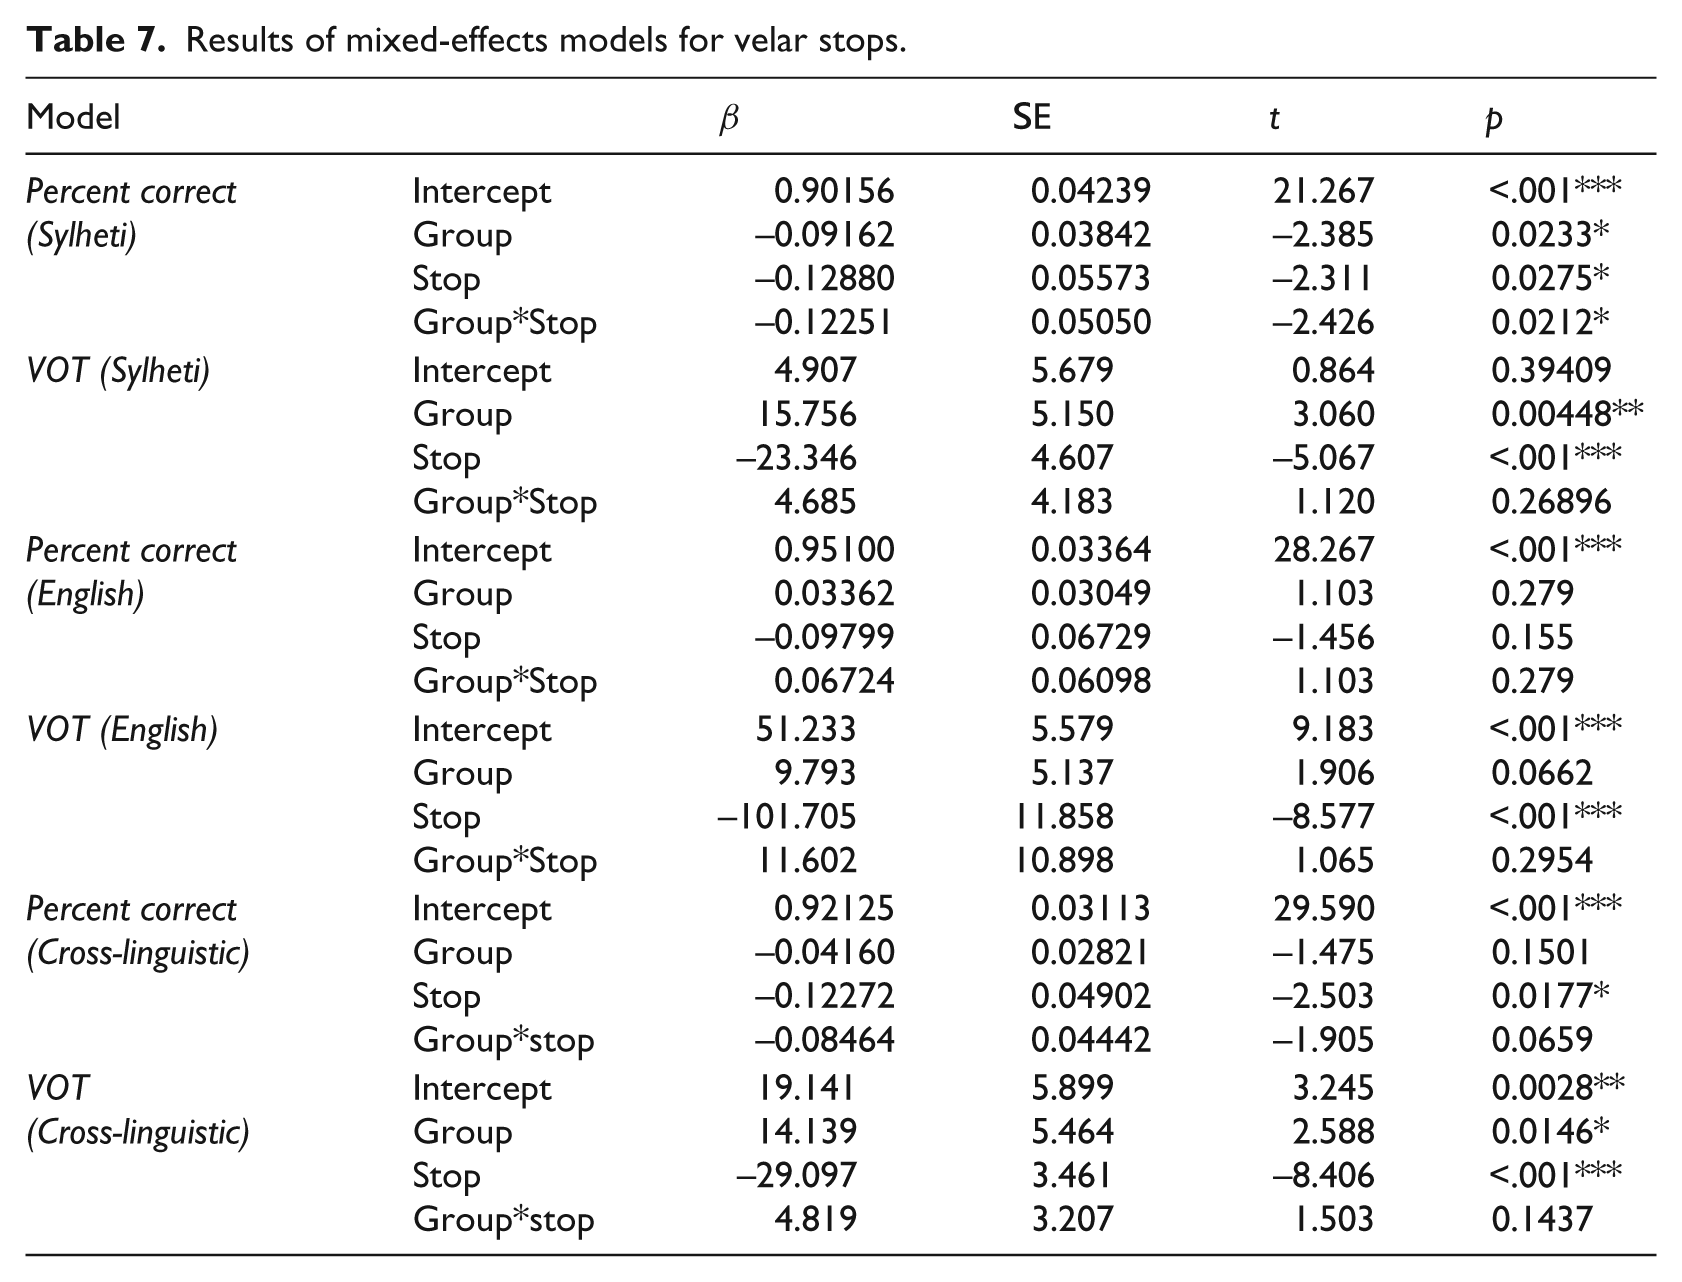
Figure 6(b) depicts the VOT values for the Sylheti velar stops. Inspection of the figure shows similar values for /k/ across the groups, but differences in the degree of prevoicing in /g/ and /gʱ/. The GEN 1 MUMS realised 73% of their voiced velar stops with a voicing lead (22/30 tokens) and the GEN 2 MUMS 52% (17/33 tokens). In contrast, the GEN 2 CHILDREN only prevoiced 18% of their voiced velar stops (11/62 tokens), and the GEN 3 CHILDREN fewer than 2% (1/57 tokens), instead realising Sylheti /g/ and /gʱ/ within the short-lag VOT range.
To determine whether the between-group differences in VOT for Sylheti velar stops are significant, a linear mixed-effects model was run with stop and group as fixed factors (including interaction) and speaker as a random factor with random slopes for stop. The results, displayed in Table 7, revealed significant main effects of group and stop, but no significant group*stop interaction. To examine these results further, we compared each of the groups with each other in separate regression models, run separately for each of the stops, with group as fixed factor and speaker as random factor. The α-level was adjusted to .005. The results showed that the GEN 3 CHILDREN produced Sylheti /g/ and /gʱ/ with significantly longer VOT values than the GEN 1 MUMS (both: p<.001), and the GEN 2 MUMS (/g/: p<.001; /gʱ/: p=.004). The GEN 2 CHILDREN, in turn, produced Sylheti /gʱ/ with significantly longer VOT values than the GEN 1 MUMS (p=.002).
English
All tokens of English /k/ were produced at the correct place of articulation, and only four tokens of English /g/ were not target-like. Moreover, there were no breathy tokens of English /g/ (see Figure 7(a) and Table 5 for details). However, an analysis of the participants’ VOT patterns showed differences in voicing across the groups (see Figure 7(b)). The adult participants exhibited substantial prevoicing of English /g/ (GEN 1 MUMS: 60%, 6/10 tokens; GEN 2 MUMS: 50%, 8/16 tokens), while the child participants produced all their tokens within the short-lag VOT range. English /k/, on the other hand, was consistently produced within the long-lag VOT range by all groups.

Percent correct productions (a) and VOT distributions (b) of English /k/ (white) and /g/ (grey).
To determine whether the VOT differences are significant, a linear mixed-effects model was run with stop and group as fixed factors (including interaction) and speaker as a random factor with random slopes for stop. The results, displayed in Table 7, revealed a significant main effect of stop, but no significant main effect of group and no significant group*stop interaction, suggesting that the English velar stops were produced in much the same way by each of the groups.
Cross-linguistic analysis
To determine whether the participants produced velar stops differently in Sylheti and English, two linear mixed-effects models were run, one on the percent correct scores, and one on VOT. Both models had stop and group as fixed factors (including interaction) and speaker as a random factor with random slopes for stop. The results, displayed in Table 7, revealed a significant main effect of stop for the percent correct and VOT models, and a significant main effect of group for the VOT model. To examine these effects further, we compared each combination of stops across the two languages in separate regression models, run separately for each group, with stop as fixed factor and speaker as random factor. The α-level was adjusted to .025 for the percent correct scores and .007 for VOT. The results for the percent correct model revealed significantly greater accuracy on English /g/ than Syheti /gʱ/ for the GEN 2 MUMS (p=.004) and the GEN 3 CHILDREN (p<.001). With respect to VOT, all four groups produced English /k/ with significantly longer VOT values than Sylheti /k/ (all: p<.001). Moreover, the GEN 2 CHILDREN produced English /g/ with significantly longer VOT values than Sylheti /g/ (p<.001).
Discussion
The purpose of this study was to gain a better understanding of cross-generational transmission in heritage language settings. To this end, we examined the Sylheti and English stop consonant productions of two sets of Bangladeshi heritage families: (1) first-generation migrants from the Sylhet area of Bangladesh who arrived in the UK in adulthood, and their UK-born (second-generation) children, and (2) second-generation UK-born adults and their (third-generation) children. The results revealed significant differences in both the host language and the heritage language across the generations, and between the child and adult participants. In what follows, the adult and child participants’ acquisition patterns will be discussed, followed by an examination of socio-cultural factors. Finally, we will consider the implications of our findings for the maintenance and transmission of heritage languages.
Acquisition patterns: adults
To begin with, an investigation of the GEN 1 MUMS’ L2 English stops revealed a number of non-native patterns. For example, English /d/ was commonly realised as [d̪] and English /t/ as [t̪]. The GEN 1 MUMS also predominantly produced /b d g/ with a voicing lead, rather than with short-lag VOT values. While the use of lead voicing in English is not non-native per se, its occurrence tends to be marginal. In Docherty (1992), for example, it accounted for 7 % of voiced stops. In contrast, the GEN 1 MUMS produced 27/ 40 tokens, i.e. 68% with a voicing lead. These patterns conform to those found in McCarthy et al.’s (2013) study and suggest an influence of the participants’ native language – a finding that is expected in L2 learners (e.g. Colantoni, Steele, & Escudero, 2015; Flege, 1995; Hansen Edwards & Zampini, 2008; Mayr & Escudero, 2010). Note, however, that the GEN 1 MUMS also showed evidence of successful acquisition. For example, they realised English /p t k/ within the long-lag VOT range, and made a clear cross-linguistic distinction between Sylheti and English /k/ (with average VOT values of 40 ms and 91 ms, respectively).
The GEN 1 MUMS’ Sylheti stop productions, in turn, largely conformed to those of native Sylheti speakers in Asia (Gope & Mahanta, 2015) and recent arrivals in the UK (McCarthy et al., 2013). Accordingly, their /bʱ/ and /gʱ/ were consistently realised as voiced breathy stops, and their coronal stops appropriately as dentals and retroflexes. Moreover, they produced the majority of their voiced stops with a target-like voicing lead. Interestingly, however, there are some indications that their Sylheti stop productions may not be entirely native-like. For example, unlike McCarthy et al.’s (2013) study, in which first-generation Sylheti speakers and native controls produced Sylheti voiceless stops with short-lag VOT values, the GEN 1 MUMS’ productions were much longer. To some extent, methodological differences between the two studies can explain these patterns: in McCarthy et al. (2013) the target words were embedded in the middle of a carrier sentence, while they occurred at the beginning of a carrier sentence in the present study. This may have made it more likely for participants to treat them like items in citation form, resulting in longer VOT values (Auzou et al., 2000). However, their mean values for Sylheti /t̪/ and /ʈ/ (both 63 ms) are much too long for this to be the only credible explanation. Moreover, despite predominantly prevoiced realisations of Sylheti voiced stops, the GEN 1 MUMS produced a fair amount of tokens within the short-lag VOT range (27/ 87 tokens, i.e. 31%), and hence differently from native control speakers (Gope & Mahanta, 2015; McCarthy et al., 2013). These patterns indicate that not only their L2 stops were non-native, but also some of their L1 categories, suggesting bi-directional interactions. While current theories of bilingual speech learning, such as the SLM (Flege, 1995; Flege et al., 2003), take account of these effects, they cannot explain why L2-to-L1 transfer only affected the first-generation migrants in the present study, but not in McCarthy et al. (2013). A possible explanation might be differences in social structure across the two communities studied: first-generation migrants in Tower Hamlets are regularly exposed to native Sylheti speech by new arrivals, reinforcing homeland norms, while there is virtually no influx of new arrivals from Bangladesh in the Cardiff community. However, social variables of this kind do not currently form part of formal bilingual speech learning models.
The GEN 2 MUMS, in turn, produced all English stops at the correct place of articulation, including the coronals, and were hence more accurate than the GEN 1 MUMS. Note, however, that they realised 40% (i.e. 20/50 tokens) of their voiced stops with a voicing lead, which suggests a subtle influence of their heritage language. As such, the findings obtained here add to the few existing studies that have shown non-native patterns in the host language of second-generation speakers (Darcy & Krüger, 2012; Stangen et al., 2015). In these studies, non-native speech was associated with continued high use of the heritage language. In contrast, the GEN 2 MUMS had relatively low use of Sylheti in the home and community, and clearly considered themselves dominant in English. This suggests that high L1 use may not be an absolute prerequisite for non-native patterns in the host language, in particular in subtle areas of pronunciation, such as prevoicing, which has limited perceptual salience (Van Alphen & Smits, 2004) and can occur in native English speech, albeit in smaller proportions.
The GEN 2 MUMS’ Sylheti stop productions also showed evidence of successful acquisition. For example, they exhibited similar mean prevoicing values for their voiced stops as the GEN 1 MUMS. On the other hand, in contrast to the latter, they commonly realised Sylheti coronals as alveolars, and produced some tokens of /gʱ/ as [g]. Differences of this kind between first-generation migrants and second-generation heritage language users are well attested (e.g. Evans et al., 2007; McCarthy et al., 2011, 2013; Nagy & Kochetov, 2013; Sharma & Sankaran, 2011), and have been explained in a number of ways. Chambers (2002) claimed that second-generation speakers have an innate accent filter that blocks non-native features in the host language. However, this claim is undermined by evidence that non-native features do occur in the host language (Darcy & Krüger, 2012; Stangen et al., 2015), and has been largely discredited by Sharma and Sankaran’s (2011) work. A more plausible explanation is a socially oriented approach according to which an individual’s speech patterns are the result of “network, demographic and intergroup forces” (Sharma & Sankaran, 2011, p. 403). While these factors have not been investigated in a detailed ethnographic study here, there are clear differences in linguistic experience and language use across the generations. Accordingly, the GEN 1 MUMS spent their formative years in Bangladesh, live in close-knit communities with many other Sylheti speakers, and use Sylheti as the main language in the home on a daily basis. In contrast, the GEN 2 MUMS have either never been to Bangladesh, or only spent short periods of time there to visit family members. They live in areas of Cardiff that are ethnically heterogeneous with few opportunities to use Sylheti, and they predominantly use English in the home.
Acquisition patterns: children
Both sets of children produced the English stops accurately, with /t/ and /d/ consistently realised at the alveolar place of articulation, and voiceless stops with long-lag VOT values (cf. Whiteside, Henry, & Dobbin, 2004). Interestingly, the GEN 2 CHILDREN prevoiced some of their English /b/ and /d/ productions (7/58, i.e. 12%), while the GEN 3 CHILDREN produced all their English voiced stops within the short-lag VOT range. Since the extent of prevoicing conforms closely to that reported in previous work on English monolinguals (e.g. Docherty, 1992; Lisker & Abramson, 1964), the GEN 2 CHILDREN’s patterns do not suggest cross-linguistic interactions.
Their Sylheti stop productions, in contrast, showed substantial differences. For example, the GEN 2 CHILDREN were entirely accurate in their production of /bʱ/ and /gʱ/, while the GEN 3 CHILDREN commonly produced these categories without breathiness. The GEN 2 CHILDREN also produced more target-like coronal stops than the GEN 3 CHILDREN. Finally, the two sets of children differed in their voicing patterns. Specifically, although both groups predominantly realised Sylheti voiced stops with short-lag VOT values, the GEN 2 CHILDREN exhibited a moderate level of prevoicing (32/176 tokens, i.e. 18%), while it was virtually absent in the GEN 3 CHILDREN (3/170 tokens, i.e. <1%). How can these patterns be explained?
To begin with, developmental factors could be at work. Indeed, it has been shown that prevoicing is acquired late in monolingual and bilingual development (Bortolini et al., 1995; Fabiano-Smith, & Bunta, 2012; Gandour et al., 1986; Kehoe et al., 2004; Khattab, 2000; Macken & Barton, 1979, 1980) since it has limited perceptual salience (Van Alphen & Smits, 2004) and is articulatorily complex (Ohala, 1997). Hence the children’s lesser degree of prevoicing compared with that of the adults points to a developmental explanation. However, the prevoicing patterns observed cannot solely be explained in this way. After all, if that was the case, the two sets of children should have exhibited similar patterns, considering they were matched in age. The GEN 3 CHILDREN’s virtual absence of prevoicing coupled with a number of other English-like patterns in their Sylheti stops suggest that other factors are at work, as well.
The most likely factor is linguistic experience. Specifically, the GEN 2 CHILDREN are growing up in a home where Sylheti is the dominant language and they live in an area that is densely populated with other Sylheti speakers. In contrast, the GEN 3 CHILDREN mainly hear English in their homes and there is substantially less Sylheti spoken in their immediate environment as they live in an ethnically more heterogeneous area. Finally, the differences between the two sets of children may be related to the input they receive. While input was not assessed directly in this study, based on an analysis of the children’s mothers’ productions, the GEN 2 CHILDREN may largely hear target-like productions from their mothers, while the input that the GEN 3 CHILDREN receive is likely to include a number of non-native features. The latter may not be significant in contexts where there is sufficient native-like input from other speakers. However, in contexts of reduced input, as in the present case, non-native patterns may be influential for the next generation of speakers. Mayr and Montanari (2015), for instance, showed that multilingual children who only receive input in one of their languages from a single speaker are highly responsive to their patterns and home in on speaker-specific phonetic information. Hence, since the GEN 3 CHILDREN have restricted exposure to Sylheti, their mothers’ non-native productions may be partly responsible for their own non-native realisations in the heritage language.
It is important to note that the differences between the two sets of children cannot be explained on the basis of current models of bilingual speech learning. The PAM-L2 (Best & Tyler, 2007) does not take any social variables into account, and the only one that is formalised in the SLM (Flege, 1995; Flege et al., 2003) is age of learning 4 . However, the GEN 2 CHILDREN and the GEN 3 CHILDREN did not differ on this variable as they had both been exposed to Sylheti from birth.
Socio-cultural factors
As reviewed in the introduction, a growing body of research has shown that heritage language features may occur in the host language to fulfil socio-indexical functions (Alam & Stuart-Smith, 2011; Heselwood & McChrystal, 2000; Hirson & Sohail, 2007; Kirkham, 2011; Kirkham & Wormald, 2015; Lambert et al., 2007; Sharma & Sankaran, 2011). For example, Kirkham (2011) showed that British Asians used retroflex realisations of /t/ in English to signal their Asian identity. In the present study, only the GEN 1 MUMS used clearly non-native forms in their English. It is uncertain whether they have only arisen from inadvertent interaction between the L1 and L2 sound systems, in line with previous research on L2 learners (Flege, 1995; Flege et al., 2003), or whether they have also been mediated by social factors.
But what about the other participant groups? How can the absence of heritage language features in their productions be explained? To begin with, they have been shown to emerge for the first time in adolescence and young adulthood, the most critical developmental periods for identity formation (see Steinberg & Morris, 2001, for an overview). The absence of heritage language features in the speech of the 3–5-year-old children is hence not surprising. It is less obvious, however, why the GEN 2 MUMS showed no evidence of heritage language forms in their English. One possibility is that they do use them, but only in informal contexts. Since the present study only assessed their productions in a formal experimental setting, this possibility cannot be addressed by the data gathered here. Alternatively, the use of these forms may be related to socio-economic status (SES). Hence, anecdotal evidence from members of the community suggests that heritage language forms, in particular retroflex realisations of /t/ and /d/, may be associated with low levels of education and SES. The GEN 2 MUMS, however, were all well educated with the majority holding university degrees and employed in professional posts. Nevertheless, in the absence of detailed ethnographic data, this explanation remains speculative, and requires systematic investigation in future research.
Language maintenance and transmission
In the present study, only first-generation migrants were identified as clearly non-native in the host language. In contrast, the heritage language showed incremental changes across successive generations: the GEN 1 MUMS’ Sylheti stop productions, while not identical, were close to those of Sylheti speakers in Asia, those of the second-generation participants showed an increase in non-native forms, while the GEN 3 CHILDREN’s productions were the least target-like. These patterns are in line with those observed in the Russian and Ukrainian heritage speakers described by Nagy and her associates (Hrycyna et al., 2011; Nagy, 2015; Nagy & Kochetov, 2013). As in the present study, they found a cross-generational trend away from homeland norms and towards those of the host language.
These patterns could suggest the emergence of a new contact variety, as has been argued for other British Asian communities (e.g. Heselwood & McChrystal, 1999). However, considering the changes observed across successive generations, Cardiff Sylheti would be a highly unstable variety with unclear norms. Moreover, its long-term survival is uncertain. Accordingly, English is the GEN 3 CHILDREN’s predominant home language and there are few opportunities to use Sylheti in the neighbourhood. In addition, unlike the close-knit communities described elsewhere (McCarthy et al., 2011, 2013, 2014), there are virtually no new first-generation migrants joining the community that could help maintain the heritage language, and (re)introduce homeland norms.
On the other hand, the GEN 3 CHILDREN were able to converse in Sylheti and carry out a picture-naming task, suggesting reasonable linguistic abilities in the language overall, although this would need to be confirmed in a systematic study of their lexical and grammatical proficiency. They also showed clear evidence of speech learning despite converging patterns. For example, some of their /bʱ/ and /gʱ/ tokens were produced with target-like breathiness, and some of their coronal stop tokens were produced at the correct place of articulation. It remains to be seen whether these factors are sufficient to ensure the long-term survival of Sylheti in the community.
Conclusion
This study is one of the few to investigate the speech patterns of heritage language speakers in both the heritage language and the host language. It showed differences in the production of Sylheti and English stops across generations, and between child and adult participants. As such, it constitutes an extension of previous work on the speech of Bangladeshi heritage children and adults in the UK (McCarthy, 2015; McCarthy et al., 2011, 2013, 2014), and is the first to examine the Sylheti stop productions of UK-born children. It also demonstrates that non-target-like stop productions are not only manifest in voicing patterns, but also other areas of pronunciation, most notably the place of articulation of coronal stops, and breathiness in voiced categories. In the present study, these areas were assessed auditorily. Future work could complement the findings obtained here with additional acoustic measures, e.g. spectral analyses of stop bursts, and measures of intensity. These will require normalisation procedures to adjust for differences in vocal tract size (see Johnson, 2005, for an overview), and need to include native control groups.
This study is also the first to reveal substantial differences between second- and third-generation children in heritage language settings, with the latter exhibiting an increasing drift towards the patterns of the host language. These findings have important implications for the maintenance, transmission and long-term survival of heritage languages, and show that investigations need to go beyond second-generation speakers, in particular in communities that do not see a steady influx of new migrants. Future work is needed that builds on this research and examines systematically what factors contribute to successful transmission and maintenance of speech patterns in heritage language settings.
Finally, this study has important implications for theory and demonstrates that current models of bilingual speech learning cannot fully account for the speech patterns found in heritage language settings. Future work will need to extend these from their current focus on psycholinguistic processes and incorporate the social variables that mediate them.
Footnotes
Acknowledgements
We would like to thank the audience at the 8th International Conference on Second Language Speech (New Sounds 2016, Aarhus University, Denmark, 10–12 June 2016) as well as Daniel Williams, Jonathan Morris and Helen Pandeli for valuable comments and discussions. We are also grateful to the anonymous reviewers of this paper for insightful comments, which helped us improve the manuscript. Finally, thanks go to the children and adults who participated in this research.
Declaration of Conflicting Interests
The author(s) declared no potential conflicts of interest with respect to the research, authorship, and/or publication of this article.
Funding
The author(s) received no financial support for the research, authorship, and/or publication of this article.