
Abstract
Generations of researchers have studied the extent to which the content and consistency of stereotypes about Black people have changed over time. At best, the evidence is mixed with some findings suggesting changes in stereotypes and other evidence suggesting that, though belief in stereotypes changed for some people, stereotypes remain negative. Our study adds to the literature by evaluating participants’ stereotype knowledge and personal beliefs about Black people, aligning with recommended practices by Devine and Elliot. Our data reveal a shift in stereotype content overall and greater heterogeneity in trait selections among participants with egalitarian values. However, stereotypes regarding Black people are, if anything, more negative in the present study than in prior research. The stubbornness of valence to change is concerning and reaffirms the need to focus research efforts on improving individuals’ ability to regulate their expression of stereotypes to prevent them from affecting their treatment of others.
There has been ongoing scholarly interest in documenting the content of cultural stereotypes, or individuals’ cognitive representations of social groups. Stereotypes are often considered alongside other indicators of prejudice (Aronson et al., 2019). Specifically, many researchers endorse the tripartite model of prejudice, in which prejudicial attitudes are comprised of cognitive, affective, and behavioral components (Eagly & Chaiken, 1993). According to this model, stereotypes are cognitive representations regarding the traits possessed by members of particular social groups. These traits are often valenced and can come to influence an individual’s feelings and discriminatory behaviors toward different social groups (Choi et al., 2017; Czopp & Monteith, 2006; Stangor et al., 1991). The interconnected and mutually influential nature of each component of prejudice suggests that a shift toward more favorable stereotypes may signify more positive relationships between social groups (Winiewski & Bulska, 2019). Therefore, researchers have evaluated change and stability in stereotypes to inform their understanding of collective social perception and intergroup relations.
Measuring Stereotypes: The Adjective Checklist Procedure
In an early attempt to assess the content of social stereotypes, Katz and Braly (1933) developed the adjective checklist procedure, whereby participants selected traits that they believed to be most typical of different racial groups. The traits most frequently selected represented the content of racial stereotypes and participants’ agreement in trait selections reflected stereotype consistency. In their original study, Katz and Braly (1933) found evidence of highly consensual and largely negative stereotypes of Black people. In subsequent studies, however, researchers found less agreement and more positivity in the traits participants selected to represent Black people (i.e., Gilbert, 1951; Karlins et al., 1969). Collectively, these studies—called the Princeton Trilogy—documented change in the content and consistency of the stereotypes across three generations of Princeton students, both before and after the height of the Civil Rights Movement. The pattern of findings from the Princeton Trilogy studies prompted some to conclude that negative racial stereotypes were fading (e.g., Dovidio & Gaertner, 1991). These findings implied that U.S. citizens’ perceptions of Black people were becoming increasingly more positive and less consistent over time, which afforded optimism about the future of intergroup relations.
Devine and Elliot (1995) cautioned, however, that methodological shortcomings common to all three Princeton Trilogy studies constrained the inferences that could be drawn regarding persistence or change in racial stereotypes. First, the Princeton Trilogy studies used the same list of traits without updating the list to include potentially newly emerging stereotypes, limiting the opportunity to assess changes that could involve new stereotype content. Second, none of the Princeton Trilogy studies considered the role of individual differences, which arguably could be important in identifying for whom change was likely (e.g., those who renounce prejudice may be especially likely to reject stereotypic thinking). Finally, Devine and Elliot (1995) noted that the instructions given to participants were ambiguous regarding whether they should report the content of cultural stereotypes as generally known or their personal beliefs about a social group (henceforth referred to as “personal beliefs”).
The difference between stereotypes and personal beliefs is important given that knowledge of stereotypes and personal beliefs about a social group are distinct constructs, and each represents part of people’s knowledge base of social groups. Indeed, research has shown that although most people are aware of cultural stereotypes about Black people, only high-prejudice people actually endorse these stereotypes as a component of their personal beliefs (Devine, 1989). To address these methodological shortcomings, Devine and Elliot (1995) presented high- and low-prejudice participants with an updated list of adjectives twice, once with explicit instructions to select traits that were consistent with the cultural stereotype of Black people, and a second time with instructions to select the traits that they personally believed characterized Black people.
With their modified procedure, Devine and Elliot’s (1995) findings challenged the conclusion that negative racial stereotypes were fading. Their results suggested that although the content had changed, the consistency and negativity of traits selected during the stereotype knowledge task did not differ from the original Katz and Braly (1933) study; moreover, the content of the cultural stereotype reported by participants did not vary as a function of participants’ prejudice level. Devine and Elliot also found that, relative to high-prejudice people, low-prejudice participants selected more positive traits to characterize Black people during the personal belief assessment than those selected during the stereotype knowledge assessment. There was, however, considerable correspondence in the reports of the cultural stereotype and personal beliefs for participants high in prejudice. In short, although personal beliefs regarding Black people had become more positive for some people (i.e., those who renounce prejudice), the cultural stereotype of Black people was consistent across participants and negative in nature. Taken together, these findings suggested that previous conjectures (e.g., Dovidio & Gaertner, 1991) on the fading of negative stereotypes about Black people were tenuous at best.
Over the last 25 years, several researchers have implemented the Katz and Braly (1933) adjective checklist procedure in efforts to track changes or stability in cultural stereotypes about Black people as a function of time (e.g., Bergsieker et al., 2012; Madon et al., 2001), to compare this stereotype to those of other racial groups (e.g., Erhart & Hall, 2019; Hall et al., 2015; Skinner et al., 2020), and to see how this stereotype may change when targets are described as members of other social groups (i.e., gay Black men, Petsko & Bodenhausen, 2019; Black politicians, Schneider & Bos, 2011). Drawing conclusions regarding stability or change in the content of the cultural stereotype of Black people from these studies, however, is hindered by the methodological limitations that plagued the original Princeton Trilogy studies. For example, some researchers did not update their list of traits with new traits generated by an independent sample of participants (e.g., Erhart & Hall, 2019; Petsko & Bodenhausen, 2019; Petsko & Rosette, 2023). Other researchers were not explicit in their instructions to participants during the adjective checklist procedure, which creates ambiguity about whether trait selections reflected participants’ knowledge of the cultural stereotype or their personal beliefs (e.g., Bergsieker et al., 2012; Hall et al., 2015; Madon et al., 2001).
The Present Study
In the present study, we continued the tradition of the Princeton Trilogy studies while taking seriously the methodological and theoretical considerations outlined by Devine and Elliot (1995). Specifically, we updated the list of traits to reflect a more recent understanding of the cultural stereotype of Black people. This step was important given that recent studies using the adjective checklist failed to do so (e.g., Galinsky et al., 2013; Petsko & Bodenhausen, 2019; Petsko & Rosette, 2023; Wages et al., 2022), and prior research revealed that updating the adjective checklist with participant-generated suggestions was important to capture new stereotype content (Devine & Elliot, 1995). After obtaining updates to the list of traits, we administered the stereotype knowledge and personal beliefs assessments separately to a new sample of participants whose responses on an individual difference measure suggest variation in their values regarding the acceptability of prejudice. In so doing, our study provides a more direct replication of Devine and Elliot (1995) than previous studies, which affords the ability to evaluate the extent to which participants’ representations of Black people have changed over time. We then examined whether the content, consistency, and valence of the cultural stereotype and personal beliefs about Black people changed in the last quarter century.
There are a variety of reasons to believe that stereotype content, valence, and consistency may have changed since 1995. On the one hand, some studies suggest that racial attitudes have become more positive (Charlesworth & Banaji, 2019) and, increasingly, social movements aimed at achieving greater equity have become highly salient (Sawyer & Gampa, 2018). Such societal reform may provide an opportunity for individuals to challenge and revise stereotypical representations and beliefs about social groups to become more favorable. On the other hand, reactions to social movements, such as Black Lives Matter, likely vary significantly as a function of one’s values and beliefs regarding prejudice. For example, among individuals who believe that racial inequality is no longer a concern, public outcry for equality may be viewed as misguided, illegitimate, and disruptive to the development of more positive racial beliefs (Leach & Teixeira, 2022).
In addition, diversifying demographics (Pew Research Center, 2019) and media representations (Tukachinsky et al., 2015) may enable the development of more varied representations of different racial groups. Such direct and vicarious intergroup contact may lead to a more diffuse stereotype regarding the traits that are typical for Black people as a group (Paluck et al., 2019). However, exposure to population diversification can also induce perceived threat among White individuals and lead to more negative attitudes towards members of racially minoritized groups (Craig & Richeson, 2014; Craig et al., 2018). As such, interaction with individuals from diverse backgrounds may provoke the defensive clinging to negative racial stereotypes and beliefs among individuals who value a social hierarchy and seek to remain in positions of social power (Rasmussen et al., 2022). Despite increased opportunities for intergroup contact, research also suggests that everyday spaces and social interactions remain persistently segregated (McKeown & Dixon, 2017), which may hinder the opportunity to update stereotype knowledge and personal beliefs.
Hypotheses
In considering the implications of this work for the cultural stereotype of Black people, we formulated the following hypotheses for the stereotype knowledge assessment. First, we predicted a change in stereotype content over time; specifically, we hypothesized that participants would select different traits to represent the cultural stereotype of Black people relative to prior research. Given that stereotype consistency is proposed to measure the strength of cultural stereotypes, we also predicted that stereotypes would show equal or less consensus than in Devine and Elliot (1995). This hypothesis is guided by research that suggests that increased public attention to racial issues and increasingly diverse communities may result in a dilution of the strength of stereotypes; however, this dilution may vary as a function of egalitarian values. As such, our research design enabled us to evaluate whether stereotype consensus was moderated by individual differences in values that prohibit the expression of prejudice. We did not advance any predictions about the valence of contemporary stereotypes relative to Devine and Elliot (1995). Second, we hypothesized that participants with values that reject prejudice would select more positive traits to represent the cultural stereotype of Black people, relative to participants without such values.
Regarding the personal belief assessment, we advanced two additional expectations. Consistent with prior research (Devine & Elliot, 1995), we anticipated that some participants may refuse to complete the personal belief assessment because the task is inconsistent with their values that renounce prejudice. Therefore, we predicted that, on the aggregate, participants would select fewer traits during the personal belief assessment, relative to the stereotype knowledge assessment. We also predicted that participants’ personal beliefs about Black people would vary as a function of individual differences in egalitarian values. Specifically, we hypothesized that the traits selected for personal beliefs would be more positive overall than the traits selected for stereotype content; however, we believed this effect would be driven by those with egalitarian values. This hypothesis is consistent with Devine and Elliot (1995), who found that all individuals were knowledgeable about the cultural stereotype of Black people, but those who were more likely to renounce prejudice were less inclined to endorse negative stereotypical traits as part of their personal beliefs.
Instead of focusing on prejudice (i.e., attitudes toward Black people) like Devine and Elliot (1995), however, we used participants’ internal motivation to respond without prejudice (IMS; Plant & Devine, 1998) as our individual difference measure. Although IMS and attitudes toward Black people share variance, IMS is a more proximal measure of individuals’ values about the appropriateness of prejudiced thoughts, feelings, and behaviors (Plant & Devine, 1998). Because people higher (compared to lower) in IMS actively renounce stereotypic beliefs despite awareness of racial stereotypes, we hypothesized that as people increased in IMS, they would more frequently select positive traits and less frequently select negative traits to characterize their personal beliefs regarding Black people. For our final hypothesis, we predicted that participants higher in IMS would select fewer stereotypical traits as representing their personal beliefs regarding Black people.
Method
This study was preregistered, and all data, materials, and supplemental analyses are available on the Open Science Framework (OSF; https://osf.io/vker5/?view_only=6214dab06a264b36a209919cc5f51e51). We report all manipulations, measures, and exclusions in these studies.
Preliminary Studies
Updating the list of traits: Free response assessment of stereotype content
To create an updated list of traits relevant to the cultural stereotype of Black people, we first asked an independent group of participants in a free response question to “List all traits that represent the cultural stereotype of Black people.” To be explicit about the nature of the task, we included the sentence: “We are not interested in your personal beliefs, but rather your knowledge of the content of the cultural stereotype of Black people.” This procedure was modeled after an existing study in the literature (Devine, 1989). We collected responses from 353 participants via Amazon’s Mechanical Turk in February of 2020. We excluded 46 participants for indicating that they were not paying attention (i.e., selecting “I did not complete this survey carefully and accurately. Please exclude my responses from your analyses”) and for failing the attention check questions (e.g., “Please select 1 to indicate that you are paying attention”). Because we were interested in outgroup stereotypes, we further excluded 34 participants who identified as Black. Our final sample included 273 participants (55.21% male, 44.69% female, 0.07% prefer not to say; 85.25% White, 0.07% American Indian or Alaska Native, 5.86% Asian or Pacific Islander, 3.66% Hispanic/Latino/Latina, 5.13% other), who were an average age of 36.57 years (SD = 12.27 years). Participants responded with 1,558 traits (an average of 5.71 traits per participant).
Two sets of independent coders categorized the data using a coding scheme developed by the first author to extract overlapping traits from participants’ free responses (coding materials are available on OSF). Coders were trained using the first 10% of the data as practice, and two sets of coders each separately categorized the remaining 40% of the data. Sets of coders then discussed and came to agreement regarding disparate codes during the process of consensus coding. During this process, coders identified 226 unique trait words.
After the data were coded, the first, second, and third authors reviewed the data with the goal of reducing the number of traits. The authors began by omitting responses that were not traits, but rather referred to physical appearances, historical stereotypes (e.g., Uncle Tom or Sambo), or food preferences (18.04% of the responses). We, however, decided to include traits that referred the conditions stereotypically associated with Black people (i.e., ghetto, unemployed, financially dependent), given that some have suggested the importance of considering how contextual manifestations of structural racism may be incorporated into cultural stereotypes applied to racial groups (Bonam et al., 2017).
Next, the authors combined traits into overarching categories that were consistent with the meaning and connotation of the words; for example, the category of “lazy” encompassed the responses “unmotivated,” “undisciplined,” and “unproductive.” Then, the authors discarded responses that only appeared in the data once and did not fall into a broader category; these were determined to be too idiosyncratic to represent the cultural stereotype of Black people (e.g., disillusioned, territorial, indistinguishable). The final list consisted of 81 unique traits.
The authors then compared the list of traits compiled from participants’ free responses to the list used by Devine and Elliot (1995). In comparing our list of contemporary participant-generated stereotypes, we sought to update the Katz and Braly (1933) list with more modern synonyms to determine which traits were new additions. Then, we eliminated synonyms for 31 traits to reduce the burden on participants without reducing the sensitivity of the assessment tool. In doing so, we updated traits like “grasping” and “jovial” in the Katz and Braly (1933) list with synonyms such as “greedy” and “happy,” respectively, that were identified and would be better understood by a contemporary audience. Our final list included 100 traits, including 62 traits from the Devine and Elliot (1995) and Katz and Braly (1933) lists and 38 unique traits that did not overlap in meaning with traits from previous lists. See Table 1 for the traits included in the present study.
Updated trait list and origins.
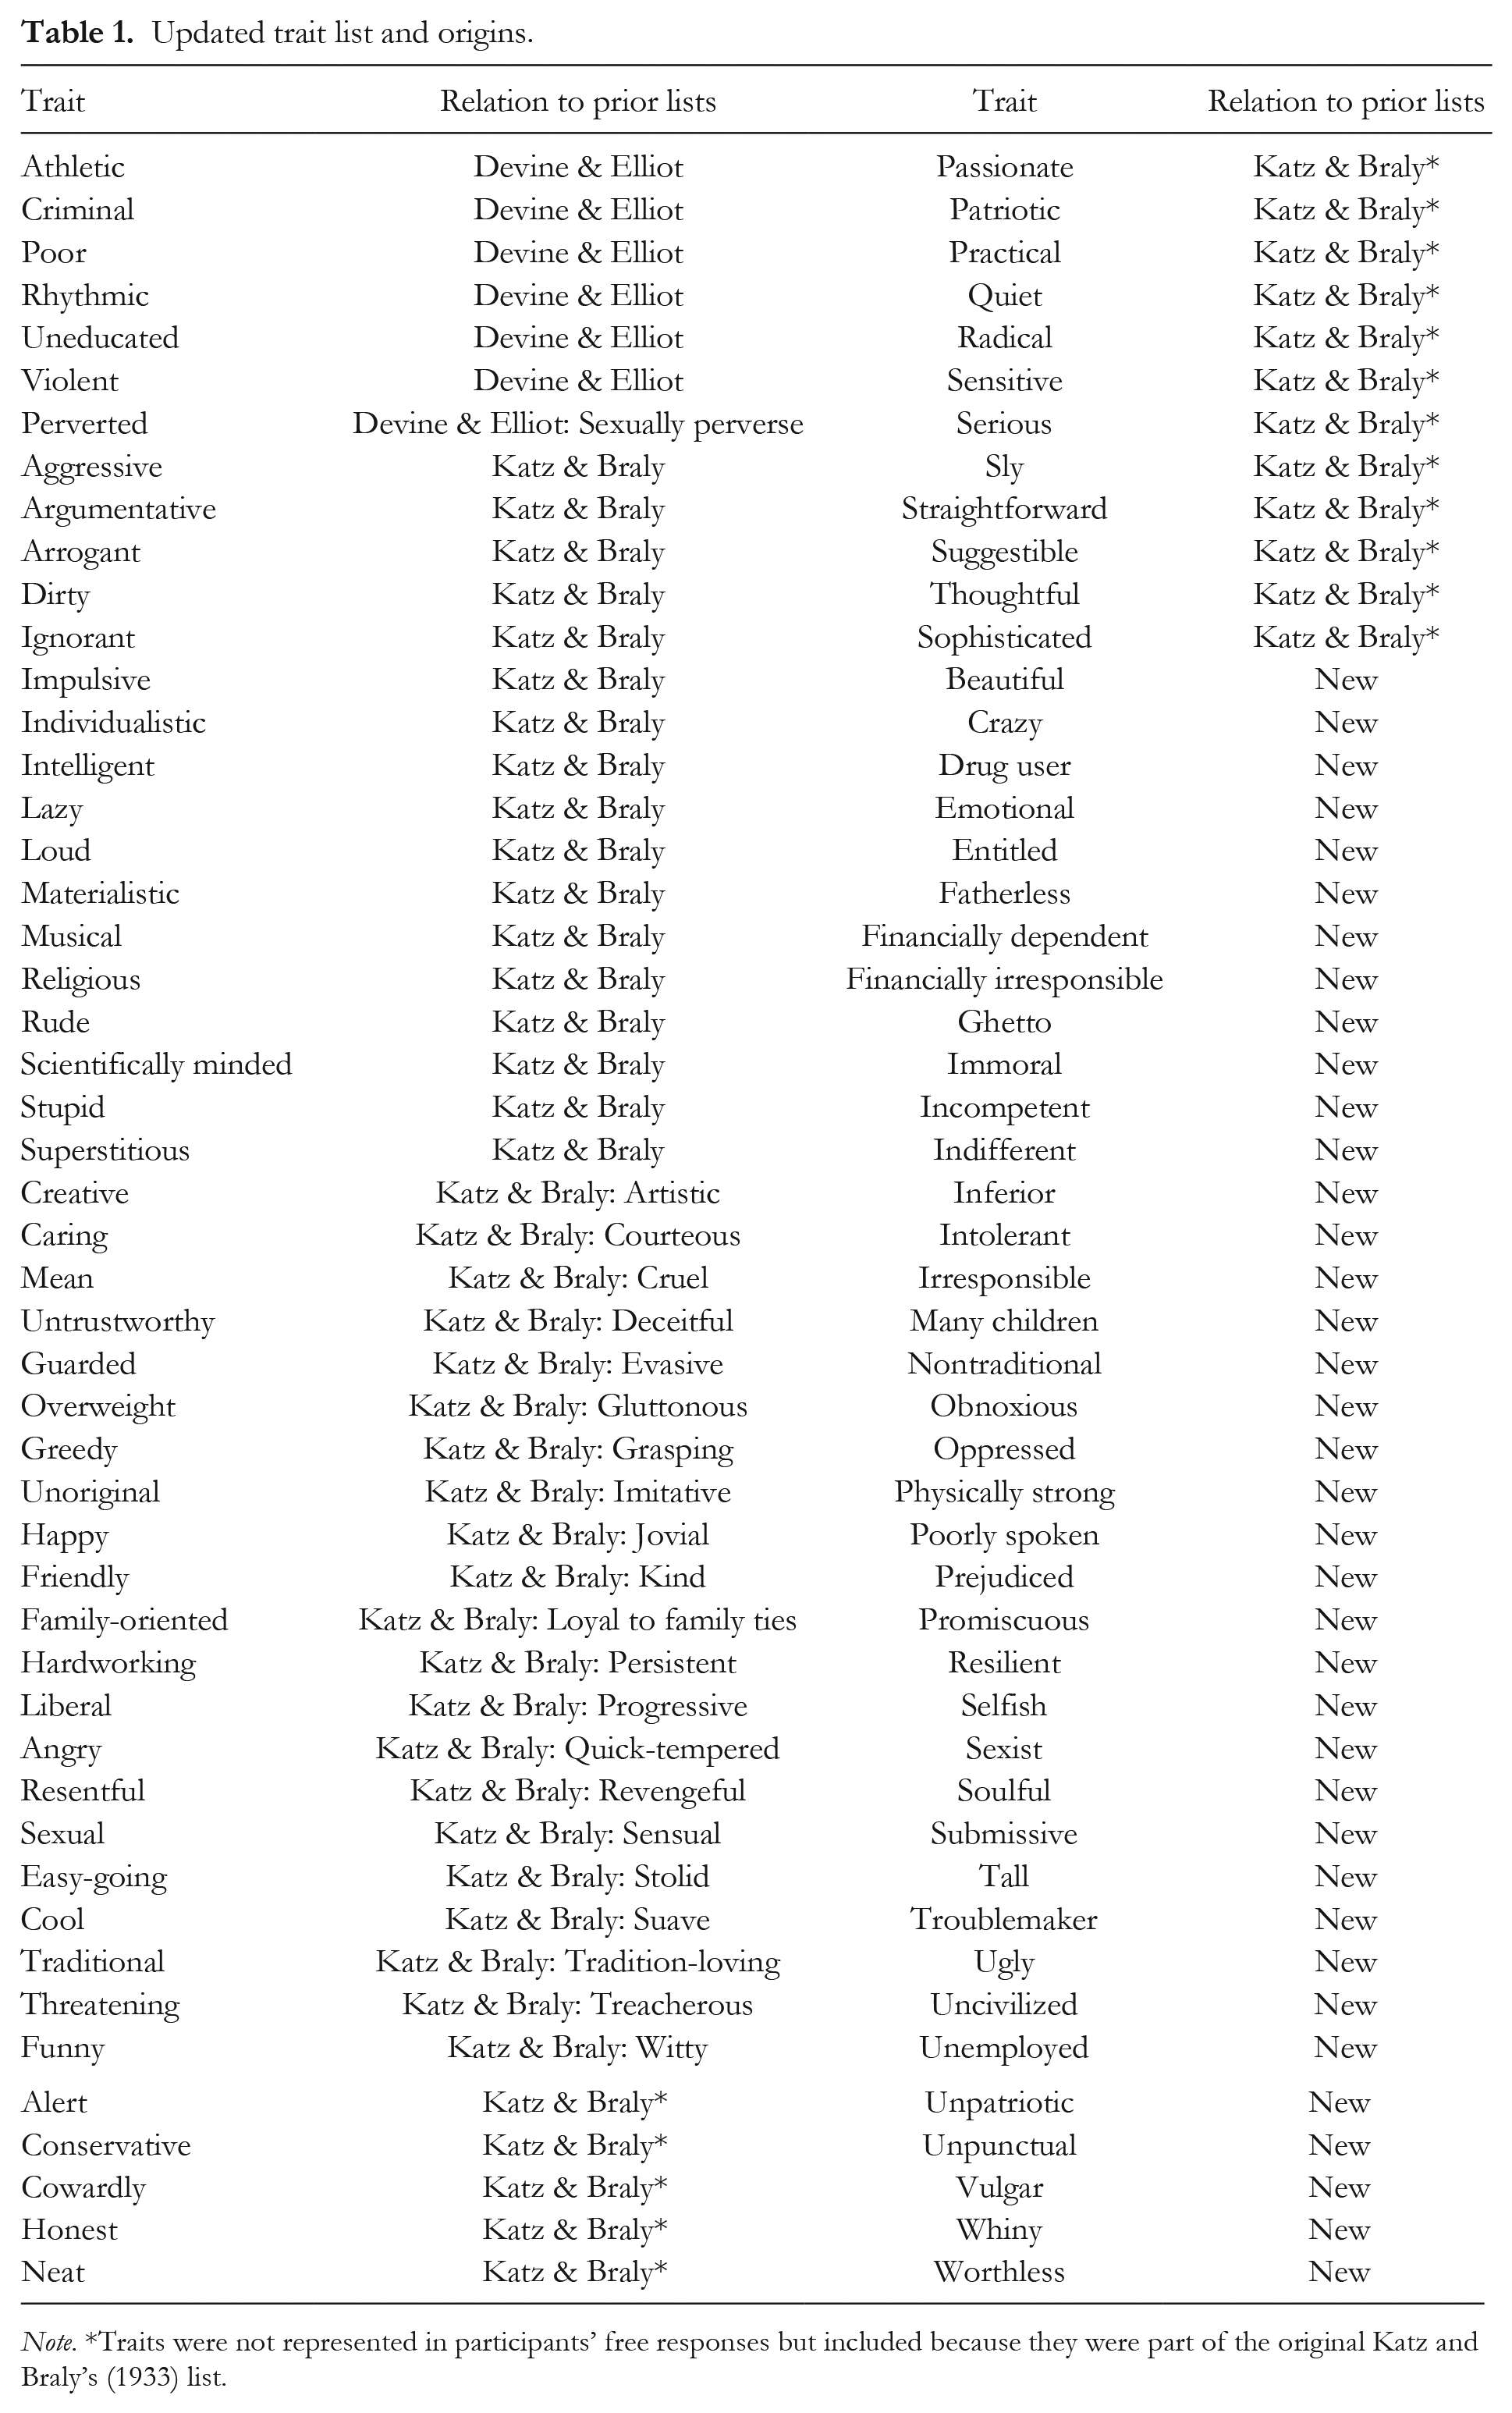
Note. *Traits were not represented in participants’ free responses but included because they were part of the original Katz and Braly’s (1933) list.
Assessment of trait valence
To assess the valence of the traits, a separate sample of 136 Amazon Mechanical Turk workers provided valence ratings for each trait in April of 2020. Use of an independent sample to provide valence trait ratings is a common and accepted method to secure valence ratings that are then used in subsequent research (see Rothbart & Park, 1986); it is also consistent with prior research (e.g., assessing the valence of stereotype content; Devine & Elliot, 1995). The original sample included responses from 155 participants; we excluded 19 participants for failing attention check questions. Participants (50.74% male, 49.25% female, 0.01% nonbinary; 74.26% White, 5.88% Black, 2.20% American Indian or Alaska Native, 8.82% Asian or Pacific Islander, 4.41% Hispanic/Latino/Latina, 4.43% other) were an average age of 36.70 years (SD = 11.04 years).
Participants read a list of trait words and indicated how positive or negative they thought each word was using a slider (0 = extremely negative, 100 = extremely positive). Averages for the valence of each trait were then computed from participants’ responses and utilized in data analysis (see supplemental material on OSF for full set of valence ratings).
Main Study
Participants
To ensure that we had sufficient power to test our hypotheses, we ran a power analysis assuming a small effect (ΔR2 = .02) and three predictors (two main effects and an interaction), and determined we would need a sample size of 529 to detect a small effect. We assumed a small effect because we did not have an effect size estimate from prior research. We overrecruited participants to account for exclusions. We collected responses in March of 2020 from 567 participants via Amazon’s Mechanical Turk in exchange for $1.00 compensation; we also collected data from 206 undergraduate participants in exchange for extra credit in their introductory psychology course during the spring semester of 2020. We first recruited participants from MTurk; upon reflection, we decided to also include undergraduate students for our sample to more closely resemble that of Devine and Elliot (1995). We posted our study for introductory psychology students and collected responses from as many students as we could before the end of the semester.
In our analyses, we statistically account for sample differences. Because of our interest in outgroup stereotypes about Black people, we collected data from 873 participants who did not identify as Black. 1 We excluded a total of 100 participants for reporting they were not paying attention, or for failing the attention check question. Overall, participants (N = 773; 51.88% male, 47.87% female, 0.13% nonbinary; 86.03% White, 0.91% American Indian or Alaska Native, 7.89% Asian or Pacific Islander, 4.40% Hispanic/Latino/Latina, 0.78% other) were an average age of 32.35 years (SD = 12.96 years). Participants from our MTurk sample (N = 567; 56.97% male, 43.03% female; 87.65% White, 1.06% American Indian or Alaska Native, 5.64% Asian or Pacific Islander, 5.29% Hispanic/Latino/Latina, 0.35% other) were an average age of 37.17 years (SD = 11.88 years). Participants from our undergraduate sample (N = 206; 37.86% male, 61.65% female, 0.49% nonbinary; 82.04% White, 0.49% American Indian or Alaska Native, 14.08% Asian or Pacific Islander, 1.94% Hispanic/Latino/Latina, 1.46% other) were an average age of 19.08 years (SD = 1.47years).
Overview of procedure
After providing informed consent, participants completed the stereotype assessment and personal beliefs assessment in counterbalanced order. Participants then completed individual difference measures described below.
Stereotype knowledge assessment
Directly replicating the procedures of Devine and Elliot (1995), participants read through a list of adjectives and selected as many or as few of the traits that they believed made up the cultural stereotype of Black people. The instructions explicitly stated that participants were to select traits that represented the cultural stereotype of Black people, whether or not they believed the stereotype to be true. In addition, space was provided for participants to add traits if they felt that the list was incomplete. After making trait selections, participants selected the top five traits that seemed most typical of the cultural stereotype of Black people; these trait selections were used to create a uniformity index to assess stereotype consistency.
Personal belief assessment
Participants read the same list of adjectives but were instructed to select adjectives that they personally believed characterized Black people. The instructions stated that participants could select as many or as few traits as they needed and could add additional traits if they believed that the list was incomplete. In a departure from the procedures of Devine and Elliot (1995), we included instructions that stated that participants could leave the question blank if they did not believe any of the adjectives characterized Black people. We included this instruction to encourage participants to refuse to complete the personal beliefs task if they found it unacceptable to endorse stereotypes at all. After being prompted to select traits, participants were asked to select the top five traits that were most representative of their personal beliefs of Black people, if applicable.
Motivation to respond without prejudice
Participants then completed Plant and Devine’s (1998) Internal Motivation to Respond Without Prejudice Scale (IMS). This five-item (overall sample: α = .83; MTurk sample: α = .80; undergraduate sample: α = .85) scale assesses the degree to which participants endorse egalitarian beliefs because of their personal values. Items included “Because of my personal values, I believe that using stereotypes about Black people is wrong.” Participants indicated their agreement with each statement on a 9-point Likert scale (1 = strongly disagree, 9 = strongly agree). Given that the two scales were validated together, participants also responded to five items related to their external motivation to respond without prejudice (EMS). However, given our research questions, we did not preregister or evaluate questions related to EMS. 2
Data Analysis Approach
All analyses were conducted in R and utilized the following packages: “tidyverse” Version 1.3.2 ((Wickham et al., 2019); “lme4” Version 1.1-30 (Bates et al., 2015); “car” Version 3.1-1 (Fox & Weisberg, 2019); “data.table” Version 1.14.6 (Dowle & Srinivasan, 2023); “sjstats” (Lüdecke, 2022); and “psych” Version 2.2.9 (Revelle, 2024). To analyze our data, we utilized integrative data analysis (Curran & Hussong, 2009). With this approach, we pooled the data from both samples and conducted a multilevel analysis, which statistically accounted for sample differences. Variables representing the sample source (MTurk vs. undergraduate) and whether participants identified as White or not (participant race) 3 were centered and included as predictors in all regression models or reported independently for descriptive statistics.
Results
Stereotype Knowledge Assessment
Stereotype content
In examining stereotype content, we compared the top nine most frequently selected traits during the stereotype knowledge assessment to those selected in Devine and Elliot (1995). Consistent with our first hypothesis, we found a change in stereotype content over time. In the present study, six (i.e., ghetto, fatherless, uneducated, drug user, violent, aggressive) of the top nine most selected traits were different than those selected in Devine and Elliot. However, we also found evidence for some stability in stereotype content, as three (i.e., athletic, poor, criminal) of the most selected traits in the present study were also frequently selected in Devine and Elliot. See Table 2 for the most frequently selected traits during the stereotype knowledge assessment across the two studies. The top selected traits for the undergraduate sample, the MTurk sample, the White sample, and the non-White sample also reflect a similar pattern of stereotype content change and stability. Also reported in Table 2 are the valence ratings for each trait, as rated by an independent sample during a preliminary study.
Valence and consistency of the top nine traits selected across samples.
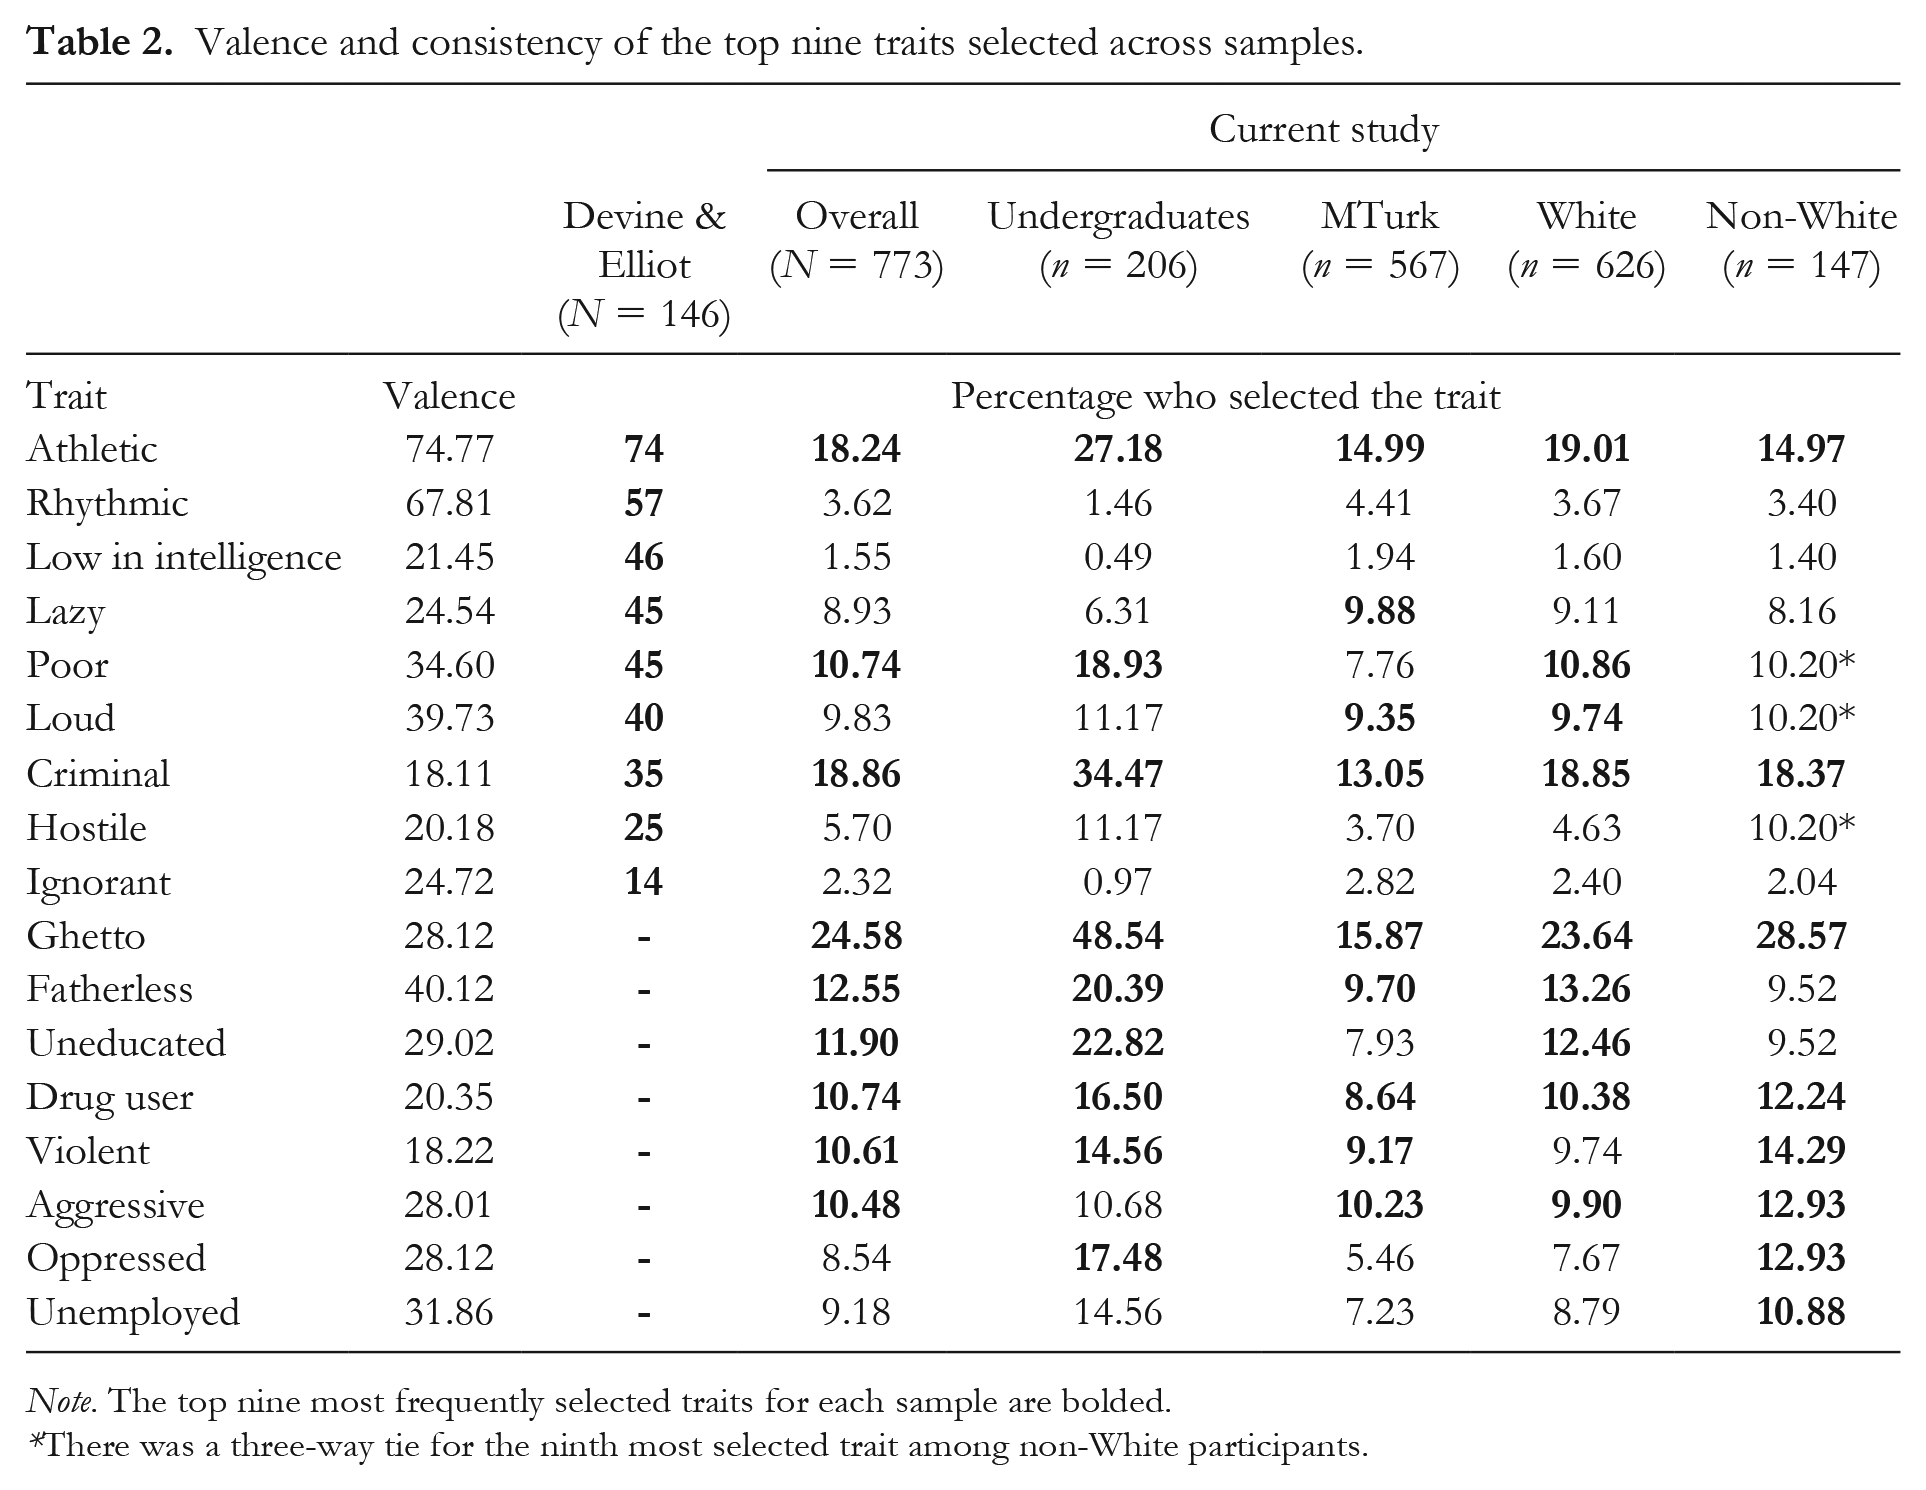
Note. The top nine most frequently selected traits for each sample are bolded.
There was a three-way tie for the ninth most selected trait among non-White participants.
Stereotype consistency
Following the procedure from Devine and Elliot (1995), we created a uniformity index for stereotype knowledge to represent stereotype consistency. The uniformity index was created by ordering traits by how often they were selected as one of the top five traits representing the cultural stereotype of Black people. Then, we summed the frequencies until the cumulative frequency equaled half the number of total endorsements by the entire sample. Therefore, the uniformity index is indicated by the smallest number of traits needed to account for 50% of total frequencies of the sample. Lower scores on the uniformity index represent greater stereotype consensus, and higher scores indicate less uniformity (i.e., selection of more stereotypes) of stereotypes. We then compared the uniformity index for the stereotype knowledge assessment in the present study to the uniformity index in Devine and Elliot. The uniformity index for Devine and Elliot was 4.5; the uniformity index in the present study was considerably higher, 15.04, suggesting that, overall, there is less agreement on the content of the cultural stereotype of Black people. The uniformity indices in the present study for undergraduate participants and MTurk participants independently were 9.50 and 18.78, respectively. The uniformity indices for White and participants of color independently were 15.14 and 14.00, respectively. See Table 3 for the uniformity indices across prior stereotype knowledge assessment studies.
Uniformity indices for the stereotype of Black people across prior stereotype assessment studies.

Note. Lower scores indicate more uniformity; higher scores indicate less uniformity.
The uniformity index does not provide an estimate of variability and thus precludes the use of inferential statistics. To evaluate statistical significance, we followed the procedure from Madon et al. (2001). Specifically, we measured consensus using the percentages corresponding to the top nine most frequently endorsed attributes—we focused on the top nine rather than the top 10 attributes because of a tie between attributes in Devine and Elliot (1995). Then, we conducted a nonparametric Mann–Whitney U test comparing the percentages from Devine and Elliot to those in the present study. We conducted these tests using the “weighted_mannwhitney” function in the “sjstats” package in R to weight the test by sample size given the large variation in sample size between studies.
Consistent with our hypothesis, the distributions between the studies differed significantly, such that there was less uniformity in the present study relative to Devine and Elliot’s (1995), χ2(16) = −4.92, p < .001, r = .78. Mann–Whitney U tests cannot control for additional variables; however, we conducted post hoc analyses within subsets of our sample, correcting for false discovery rate using the Benjamini and Hochberg (1995) method. The distributions between the present study and Devine and Elliot’s remained significantly different when evaluating undergraduate participants, χ2(16) = −2.36, p = .030, r = .49; MTurk participants, χ2(16) = −5.42, p < .001, r = .80; White participants, χ2(16) = −4.99, p < .001, r = .78; and participants of color independently, χ2(16) = −4.84, p < .001, r = .74.
Stereotype valence
Participants in an independent preliminary study provided valence ratings. We conducted a paired samples t test to evaluate the valence ratings of the traits during the stereotype knowledge assessment compared to those selected in Devine and Elliot (1995). We found that the top nine traits selected to represent the cultural stereotype of Black people in the present study (M = 32.37, SD = 17.22) were more negative than those selected in Devine and Elliot (M = 36.21, SD = 15.99), t(136) = 7.62, p < .001, 95% CI [2.84, 4.83]. Valence ratings are included in Table 2.
Personal Belief Assessment
Rate of refusal
Although no participants refused to complete the stereotype knowledge assessment, some participants declined to select any traits as consistent with their personal beliefs about Black people. Specifically, 11.00% of our overall sample (9.70% of MTurk participants and 14.56% of undergraduate participants) were deemed “refusniks” because they refused to answer the question (Devine & Elliot, 1995). We ran a binomial logistic regression predicting the log-odds of refusing to select any traits as reflecting personal beliefs. We regressed refusal on IMS, controlling for the sample (MTurk vs. undergraduates) and participant race (White vs. non-White). Participants who were higher in IMS were more likely to select no traits as representing their personal beliefs about Black people than participants who were lower in IMS. Specifically, the odds of selecting no traits increased by a factor of 1.30 for every one unit increase in IMS, χ2 = 9.81, p = .002, 95% CI [0.10, 0.44].
Personal belief consistency
Participants’ trait selections for the personal belief assessment yielded a uniformity index of 14.79 in the present study. When comparing the uniformity index for the personal belief assessment to prior research (4.6 in Devine & Elliot, 1995), participants’ trait selections demonstrate greater heterogeneity. In the present study, participants’ personal beliefs about Black people demonstrated similar consistency to their knowledge of the cultural stereotype.
Personal belief valence
In addition, the valence ratings of participants’ trait selections for the personal belief assessment were considerably more positive (M = 72.56, SD = 11.45) than those selected during the stereotype knowledge assessment task (M = 32.37, SD = 17.22).
Moderation by IMS on Stereotype Knowledge Versus Personal Beliefs
Internal motivation to respond without prejudice
Participants indicated relatively high levels of IMS on average (M = 7.13, SD = 1.61). IMS also varied as a function of whether participants were recruited from Amazon’s Mechanical Turk (M = 6.78, SD = 1.63) or the undergraduate research participation pool (M = 8.11, SD = 1.09), t(771) = 10.86, p < .001, 95% CI [1.09, 1.57].
Frequency of trait selections
We predicted that participants would select more traits when reporting their knowledge of the cultural stereotype of Black people compared to their personal beliefs regarding Black people. We conducted a linear mixed effects model regressing the number of traits selected on IMS, assessment type (personal beliefs vs. stereotype knowledge), the interaction between IMS and assessment type, participant race, and sample. We included a by-subject random intercept for assessment type (Barr, 2013; Barr et al., 2013).
As predicted, participants selected more traits as representative of the content of stereotypes of Black people than of their personal beliefs about Black people, B = 7.73, F(1, 771) = 216.91, p < .001, 95% CI [6.70, 8.75]. Supporting our hypothesis, the effect of assessment type on the frequency of trait selections was moderated by IMS, B = 2.45, F(1, 771) = 56.79, p < .001, 95% CI [1.81, 3.091]; see Figure 1. Simple effects analyses revealed that the frequency of traits selected on the personal beliefs task decreased as IMS increased, B = −0.55, F(1, 1370.10) = 3.80, p = .052, 95% CI [−1.11, 0.00]; and increased as IMS increased on reports of stereotype knowledge, B = 1.89, F(1, 1370.10) = 44.08, p < .001, 95% CI [1.34, 2.45]. See Table 4 for the most frequently selected traits for the stereotype knowledge and personal beliefs assessments as a function of IMS.
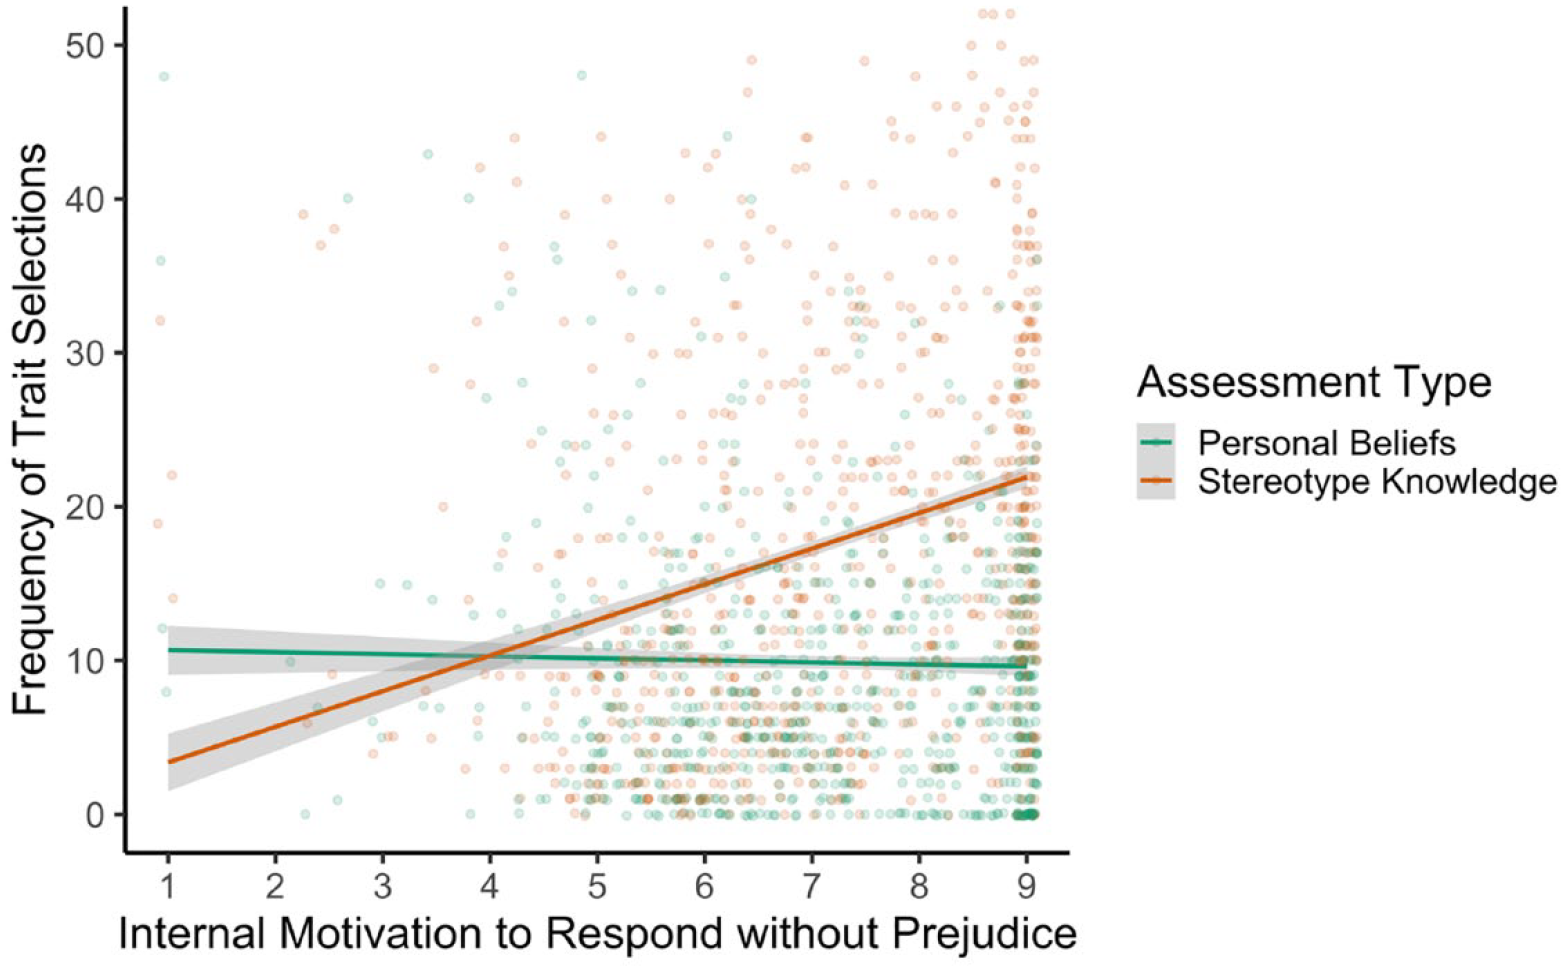
Interaction between internal motivation to respond without prejudice and assessment type on frequency of trait selections.
Percentage of participants who selected each of the top 40 traits for the stereotype and personal beliefs assessment as a function of internal motivation to respond without prejudice.
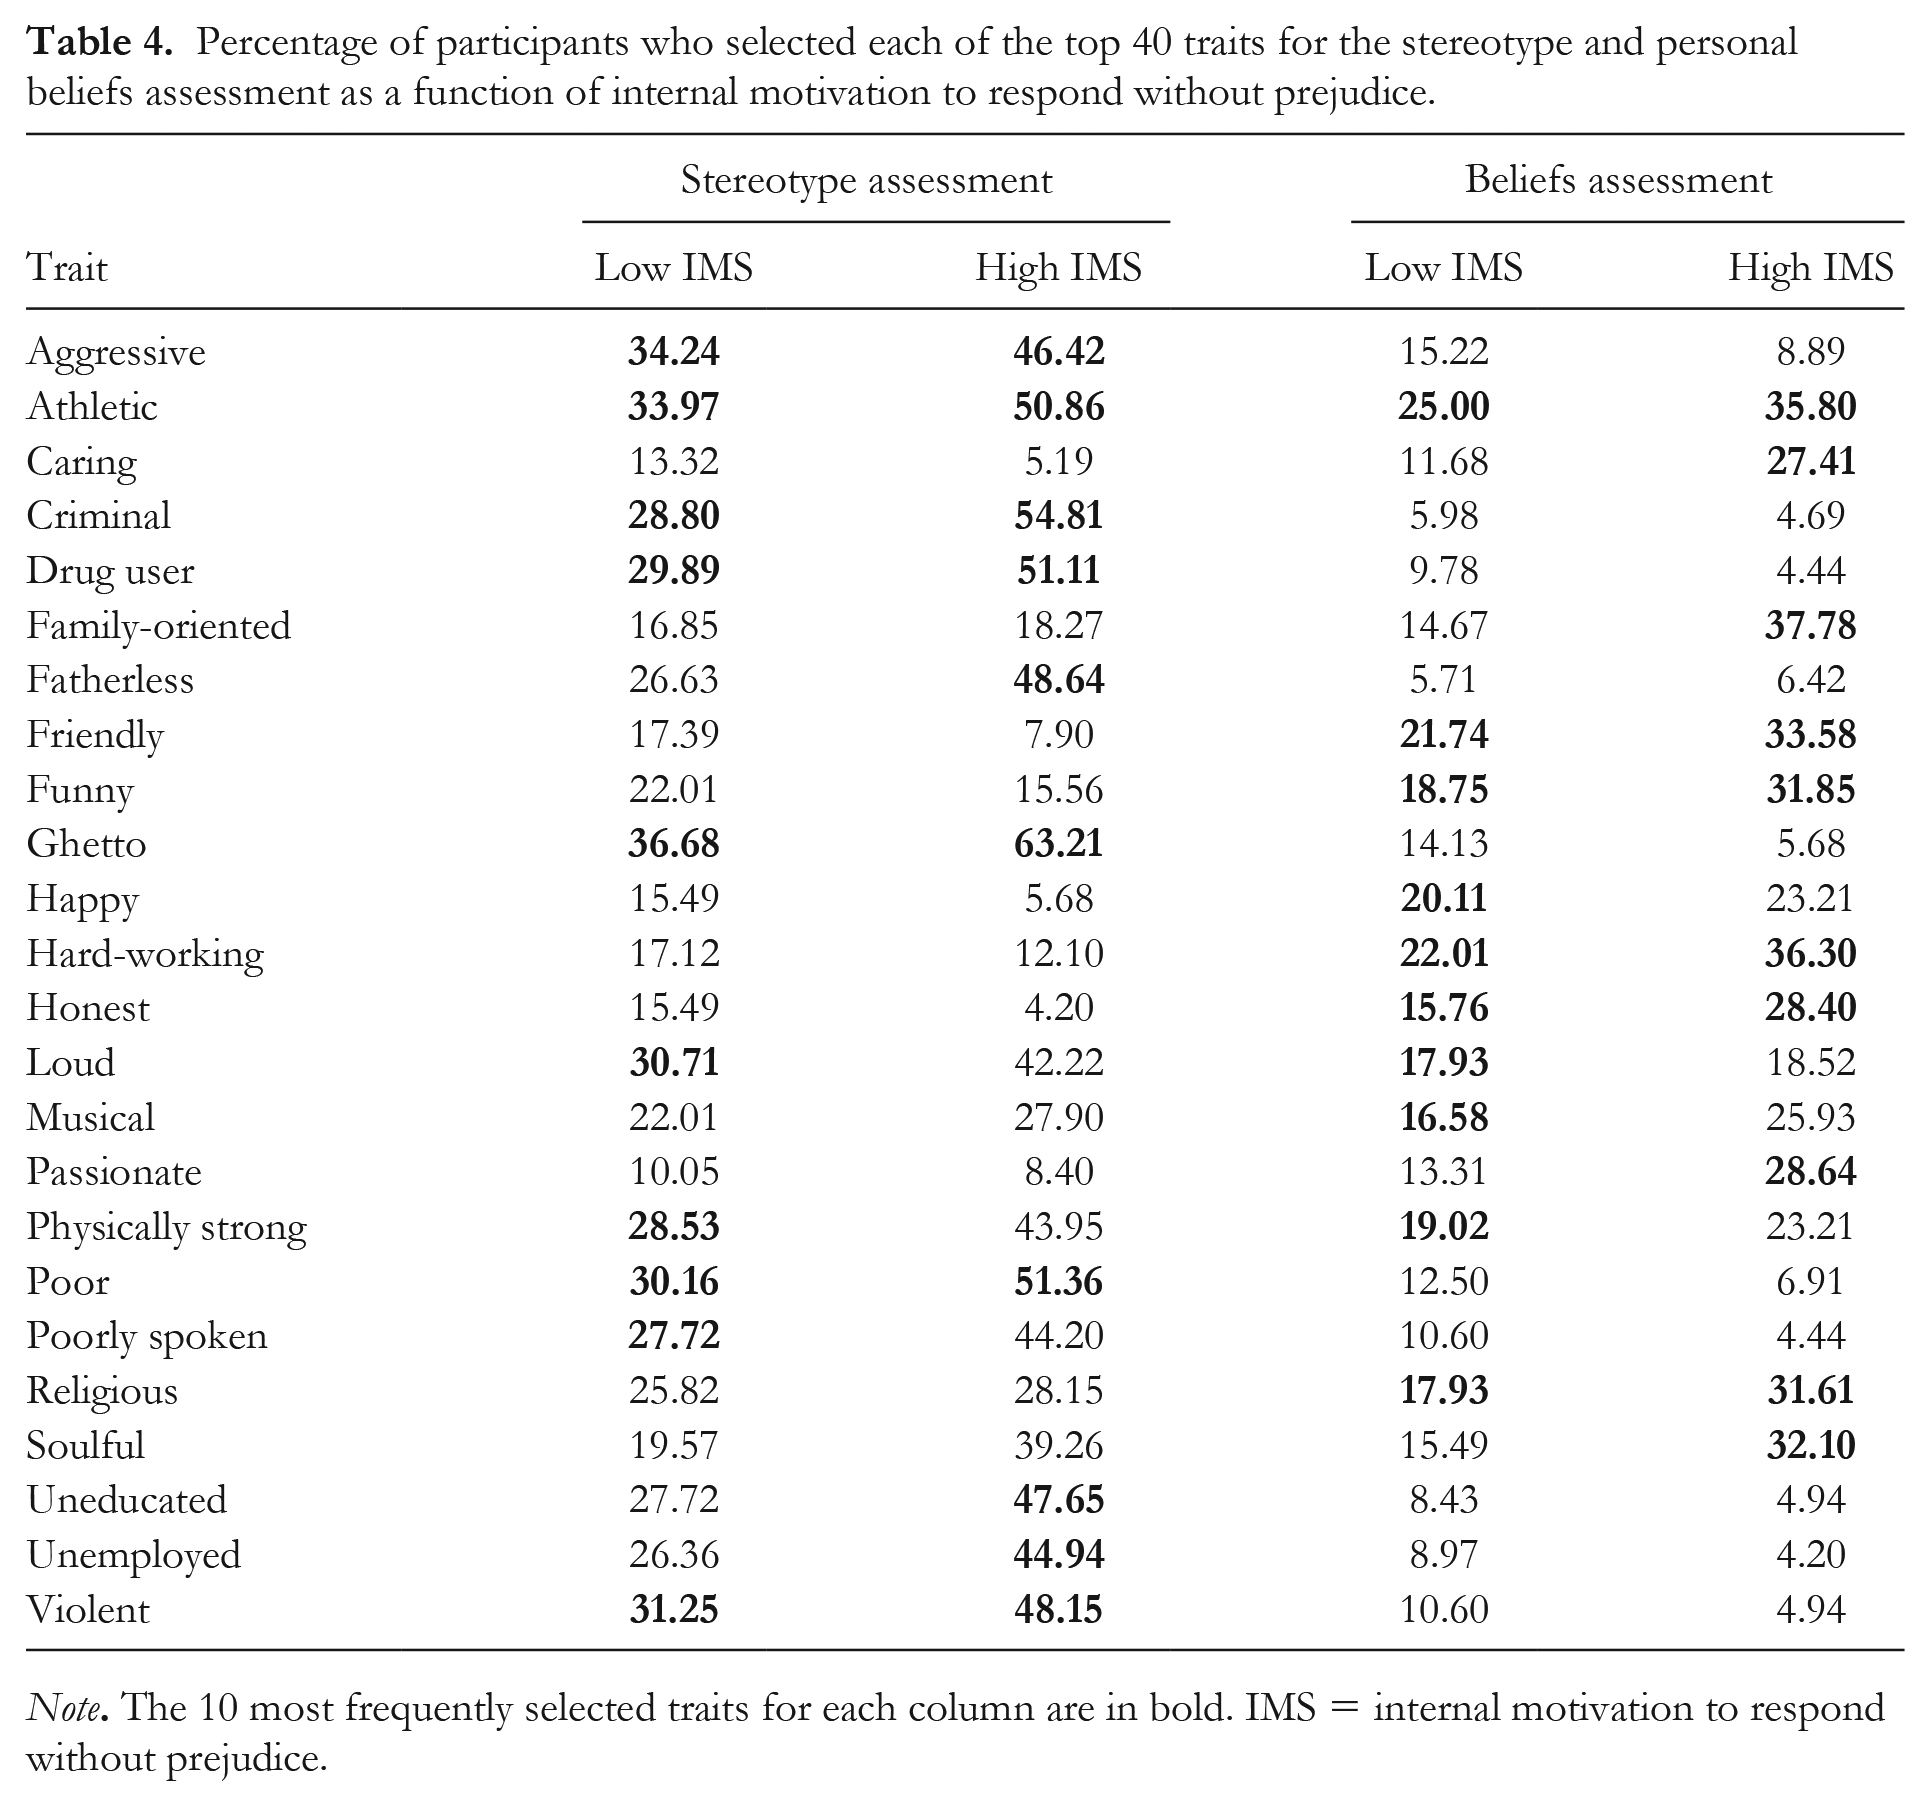
Note. The 10 most frequently selected traits for each column are in bold. IMS = internal motivation to respond without prejudice.
Content and consistency of trait selections for personal beliefs
We predicted that as people increased in IMS, the traits selected for their personal beliefs assessment would diverge more in content from those selected as representing participants’ knowledge of the cultural stereotype of Black people. To evaluate this hypothesis, we fit a generalized linear mixed effects model in which we regressed whether or not participants selected each trait on assessment type (personal beliefs or stereotypical knowledge), IMS, and the interaction between assessment type and IMS. As in previous models, we controlled for participant race and sample source. Finally, to account for the nonindependence at both the participant and trait level, we included random intercepts for participant and trait. There was a main effect of IMS such that participants higher in IMS selected more traits than those lower in IMS, χ2 = 16.82, p < .001, 95% CI [0.05, 0.14]. There was a main effect of sample, such that participants in the undergraduate student sample selected more traits than those in the MTurk sample, χ2 = 21.42, p < .001, 95% CI [0.22, 0.55]. There was no effect of participant race, χ2 = 0.34, p = .561, 95% CI [−0.12, 0.23]. Consistent with hypothesis, there was a significant main effect of assessment type, such that participants selected more traits for stereotype content than for personal beliefs, χ2 = 1377.71, p < .001, 95% CI [0.60, 0.67].
In addition to main effects, our model revealed the hypothesized interaction between assessment type and IMS. Consistent with hypothesis, we found that as people increased in IMS, their selections of traits for personal beliefs and the cultural stereotype of Black people were more likely to diverge, χ2 = 229.22, p < .001, 95% CI [0.13, 0.17].
Valence of trait selections
Consistent with Devine and Elliot (1995), we predicted no effect of IMS on the valence of traits selected for the stereotype knowledge assessment. In contrast, we predicted that when focusing on personal beliefs, as people increased in IMS, they would select more positive traits and fewer negative traits. To test this hypothesis, we regressed trait valence ratings on assessment type, IMS, the interaction of assessment type and IMS, participant race, and sample. We included a by-subject random intercept for assessment type.
The analysis revealed an interaction between internal motivation to respond without prejudice and assessment type on the valence of trait selections, B = 6.16, F(1, 730.86) = 208.59, p < .001, 95% CI [5.32, 6.99]; see Figure 2. We evaluated simple slopes to decompose this interaction. The findings provided partial support for our hypothesis. Contrary to expectation, as participants increased in IMS, they selected traits that were more negative, on average, to represent the cultural stereotype of Black people, B = −1.61, F(1, 1354.61) = 22.47, p < .001, 95% CI [−2.27, −0.94]. However, supporting expectations, when considering the personal belief assessment, the opposite pattern emerged. Specifically, as participants increased in IMS, they selected traits that were more positive, on average, to represent their personal beliefs about Black people, B = 4.54, F(1, 1375.68) = 164.80, p < .001, 95% CI [3.85, 5.24]. Finally, there was no effect of sample on the valence of trait selections, B = 0.55, F(1, 754.23) = 0.30, p = .585, 95% CI [−1.42, 2.52].
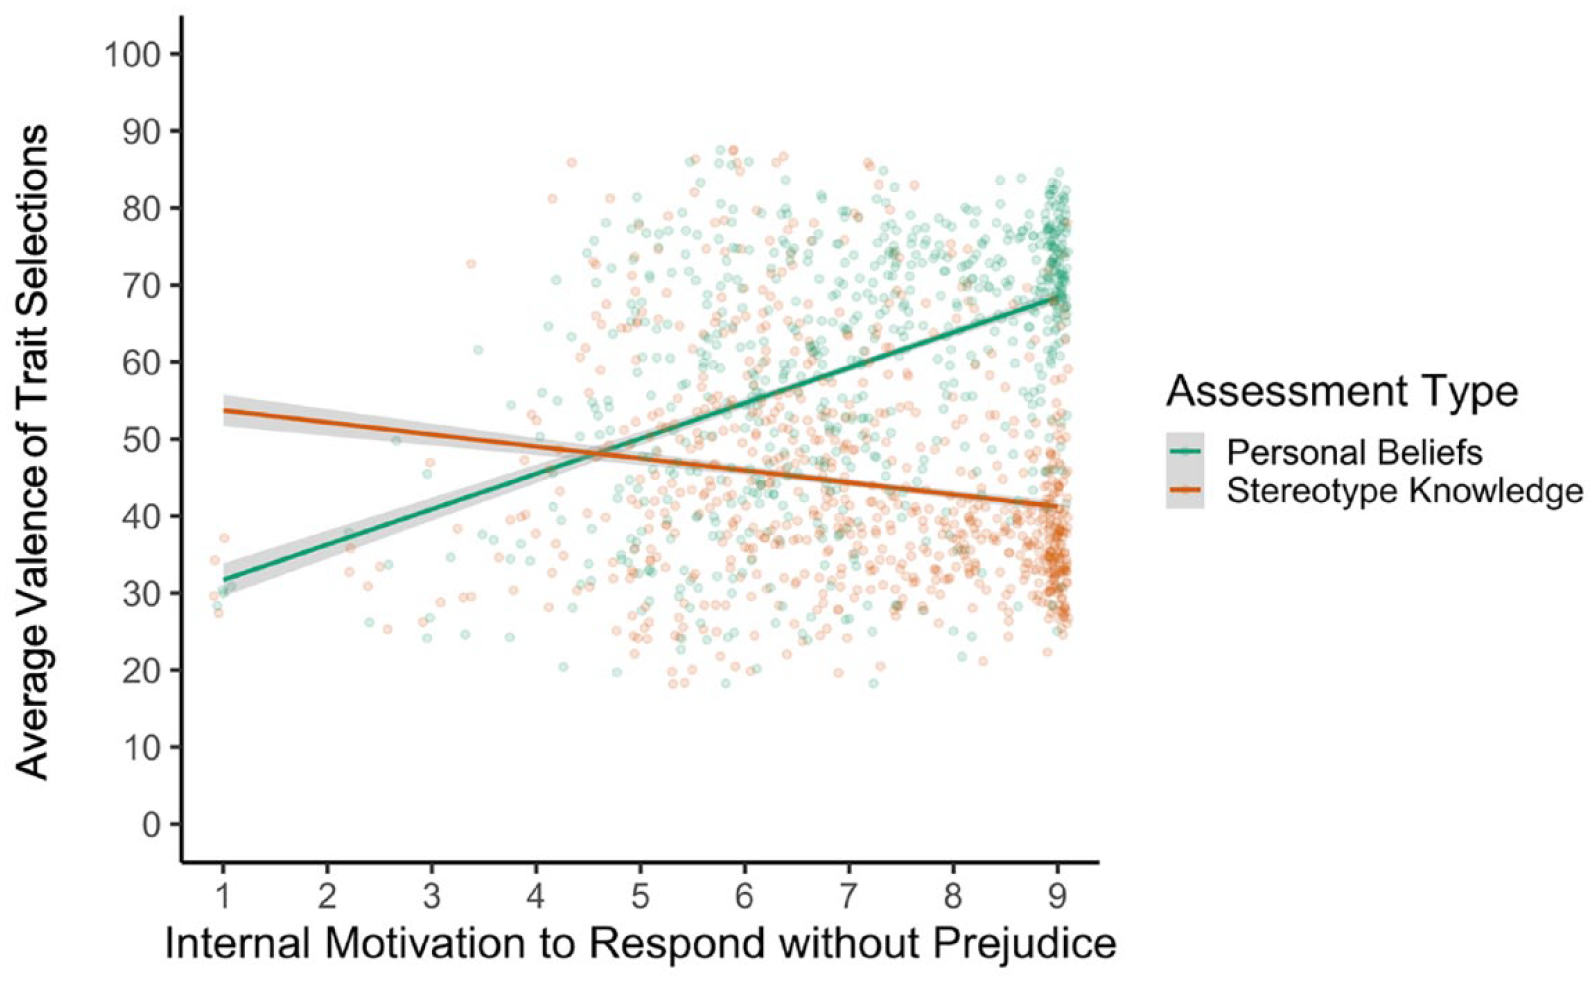
Interaction between internal motivation to respond without prejudice and assessment type on average valence of trait selection.
Discussion
Whereas previous studies using the adjective checklist procedure concluded that negative stereotypes were fading (e.g., Dovidio & Gaertner, 1991), the present study refutes that conclusion, reaffirming the importance of following the methodological recommendations of Devine and Elliot (1995). Following the suggestions by Devine and Elliot (1995), we updated the list of traits and found a shift in stereotype content, or the traits selected to represent the cultural stereotype of Black people. Similarly, utilizing stereotype knowledge and personal belief assessments in tandem provided important information about the extent to which participants’ personal beliefs diverge meaningfully from their knowledge of the cultural stereotype of Black people. Our findings suggest similar uniformity, but greater positivity, in trait selections for participants’ personal beliefs versus stereotype knowledge. Further, assessing nuances in participants’ egalitarian values proved important given meaningful differences in stereotype knowledge and personal beliefs about Black people. Although our study revealed a broadening of the content of the cultural stereotype of Black people among individuals with egalitarian beliefs, the content of the stereotype remained negative and is, if anything, even more negative than in prior research. Conversely, we found evidence of more positive personal beliefs about Black people among individuals who endorsed egalitarian values. Future research should continue to implement all steps of the revised adjective checklist procedure to better illuminate societal and personal changes and stability in perceptions of different social groups.
Despite some overlap, participants in the present study selected different traits to represent the cultural stereotype of Black people relative to those in Devine and Elliot (1995). The traits added to reflect the contemporary cultural stereotype of Black people (e.g., ghetto, unemployed, uneducated) suggest a broadening of stereotype content among the present sample that may reflect greater awareness of systemic inequities related to housing, employment, and education. The data also suggest that during the stereotype knowledge task, individuals high in IMS selected traits related to societal inequities at a higher rate than participants lower in IMS, who may be unaware of, or reluctant to acknowledge, long-standing disparities (Callaghan et al., 2021; Kraus et al., 2019). Because these newly emerging traits were negatively valenced, these traits may explain why participants who were higher in IMS selected more negative traits, on average, during the stereotype content assessment than those who were lower in IMS.
These findings are consistent with theory that those with values that prohibit discrimination may be more aware of, and concerned about, bias, which serves to motivate self-regulatory efforts (Devine et al., 2012). Similarly, participants who were higher in IMS may be more aware of bias in the social environment and, therefore, reported a more negative cultural stereotype of Black people than those who were lower in IMS. Although somewhat speculative, this pattern of results may suggest that individuals with egalitarian values incorporate the influence of systemic injustices in their cognitive representations of Black people as a social category. In considering the implications of this finding, recognizing the systematic disadvantage faced by members of social groups is typically considered desirable in the literature because it can serve to motivate steps aimed at bias reduction (Devine et al., 2012; Onyeador et al., 2021). However, the negative valence of these newly emerging stereotypical traits may have unintended consequences for prejudice reduction more broadly, which warrants future research.
One of our most striking findings is that stereotype content was less consistent in the present sample than it was in 1995; participants demonstrated less agreement in trait selections regarding the cultural stereotype of Black people. This pattern of results appears to be mostly restricted to participants with egalitarian values, such that participants higher in IMS demonstrated a more diversified stereotype of Black people, relative to both prior research and their lower IMS counterparts in the present study. Within the legacy of Princeton Trilogy research, consensual stereotypes are generally thought of as undesirable, as it indicates the strength of racial stereotypes within society (Karlins et al., 1969). In addition, greater perceived heterogeneity of social groups is related to both reduced explicit (Brauer & Er-rafiy, 2011; Er-rafiy & Brauer, 2013) and implicit prejudice (Brauer et al., 2012). Therefore, more diversity in social perceptions of Black people may invite an accompanied reduction in prejudice.
However, despite changes in stereotype content and consistency, the negative valence of stereotypes about Black people remained stubborn and pervasive in the present study. Although participants selected different traits to represent the cultural stereotype of Black people, these traits were more negative than the traits selected in prior research. This pattern of results is consistent with recent research on word embeddings from English-language books (Charlesworth et al., 2022), which finds that although the traits used in racial stereotypes have changed from 1800 to 1999, the negativity of those traits has remained stable.
These results are troubling given that cultural stereotypes are more than cognitive representations at the individual level: stereotypes are shared across the social systems in which they were developed and continue to operate (Winiewski & Bulska, 2019). In the US, stereotypes about Black people were established to legitimize the practice of slavery and maintained to justify discrimination (Devine & Sherman, 1992; Duckitt, 1992; Kendi, 2017). Consistent with the function of stereotypes in society, the stubborn and persistent negativity of contemporary stereotypes may serve to systematically disadvantage Black people. As such, we warn that progress made regarding stereotype content and consistency may be illusory without an accompanied shift toward more positive collective representations. However, we do not advocate simply trading negative stereotypes for positive ones, as such a strategy is likely counterproductive for improving intergroup relations (Czopp et al., 2015). Stereotypes are damaging to group members, regardless of their valence (Czopp, 2010). Therefore, research suggests the importance of reducing group-based generalizations or revealing the true heterogeneity of characteristics of outgroup members rather than solely conveying the positivity of traits possessed by them (Brauer et al., 2012; Er-rafiy & Brauer, 2013).
Despite evidence of an enduring and negative cultural stereotype of Black people, participants with values prohibiting prejudice were unwilling to endorse negative stereotypic generalizations about Black people. Among participants lower in IMS, the traits selected during the stereotype knowledge and personal beliefs tasks overlap considerably. However, participants who were high in IMS selected more positive traits as representing their personal beliefs, compared to those who were low in IMS.
In addition to selecting more positive traits, we found that participants selected fewer traits during the personal beliefs assessment compared to the stereotype knowledge assessment, and that this effect was associated with increases in IMS. This result can be explained, in part, by a group of participants who refused to select any traits as representative of their personal beliefs about Black people. These participants, called the refusniks, were more likely to be high in IMS. Specifically, 11% of our sample determined that it was inappropriate to assign traits to groups of people, and instead left the personal beliefs assessment blank. Thus, despite differing in strategy, these participants held egalitarian values that prohibited the attribution of negative stereotypes to their personal beliefs (Devine & Elliot, 1995; Gilbert, 1951; Karlins et al., 1969). They offered statements such as “there is no set of traits that reliably characterize Black people” and “everyone, regardless of race, is an individual” in explaining their refusal to complete the personal belief assessment task. We propose that the refusniks present a promising avenue for future research. Future research should determine how we might intervene to eliminate personal beliefs that rely on generalizations and encourage greater numbers of participants to resist ascribing traits to groups, in the refusnik fashion.
Despite the presence of more positive personal beliefs, the automatic and efficient ways in which cultural stereotypes are developed, activated, and maintained make it unlikely that stereotypes will disappear any time soon (Cox et al., 2022; Devine & Sherman, 1992; Monteith et al., 2016). Even though our participants endorsed more positive traits to represent their personal beliefs about Black people, knowledge of a negative stereotype of Black people continued. Our results suggest that changes in stereotype content and improvements in stereotype heterogeneity within the present sample were not sufficient to reduce the stubborn and persistent nature of negative cultural stereotypes.
Instead, our findings reaffirm the need to focus research and intervention efforts on improving individuals’ ability to regulate their application of stereotypes and recognize that making group-based assumptions is both inaccurate and harmful (Devine, 1989). In addressing this call to action, intervention research (e.g., Devine et al., 2012; Forscher et al., 2017) has found that with effort and training, individuals with egalitarian values can implement strategies to reduce bias over time and prevent the influence of stereotype knowledge from impacting their personal beliefs and treatment of others.
In considering potential strengths, limitations, and future directions of the present study, previous studies included in the Princeton Trilogy legacy (e.g., Devine & Elliot, 1995; Gilbert, 1951; Karlins et al., 1969; Katz & Braly, 1933) relied exclusively on undergraduate samples to determine changes in stereotype content and consistency across time in the US. Use of samples that are younger, more educated, more progressive, and wealthier than the general population may limit the generalizability of their conclusions (Rad et al., 2018). In an effort to recruit a sample more representative of the U.S. population, our study recruited participants from Amazon’s Mechanical Turk in addition to undergraduate students. Given that stereotypes are socially constructed and shared (Winiewski & Bulska, 2019), future researchers may evaluate the extent to which stereotypes may vary as a function of variability in sample characteristics. For example, we found that undergraduates held a more uniform cultural stereotype of Black people than participants recruited from MTurk, which may suggest that stereotypes are more consistent among those from similar social groups or those inhabiting shared spaces.
Given our sampling procedures, our sample demographics likely meaningfully diverged from prior research, which could partially explain differences in our results. However, prior researchers using the adjective checklist procedure have found similar results when controlling for participant demographics and have concluded that shifts in stereotypes were not attributable to college demographic shifts (Bergsieker et al., 2012). In the present study, overall conclusions did not differ when controlling for participant race and when considering each sample in turn, suggesting that our conclusions were robust to sample differences.
We found that participants selected more variable traits to represent the cultural stereotype in the present study than in prior research, suggesting less consensus across participants regarding the cultural stereotype of Black people. However, this result may be an artifact of the increased number of traits included in our updated list. Specifically, we included 100 traits on the present list, whereas Devine and Elliot (1995) included 93; offering more traits to participants could have resulted in greater variability in trait selections. However, our findings regarding stereotype consensus are similar to other more recent studies using the adjective checklist procedure, which included fewer traits than the present study (i.e., 84 traits, Bergsieker et al., 2012; 99 traits, Galinsky et al., 2013). Studies using the adjective checklist procedure have used lists ranging from 12 to 300 traits, with little consensus regarding the effects of list length on participant trait selections, which warrants future research (Gallagher, 2021).
In accounting for historical trends in intergroup relations, it is important to note the broader context during which our study was conducted. Specifically, most of our participants completed the study during the height of restrictions imposed in the US as a result of the COVID-19 pandemic (i.e., March and April of 2020); the unprecedented nature of the rapid and significant changes experienced during this time could have influenced our results in unanticipated ways. For example, research suggests that some individuals have experienced increases in racial discrimination since the onset of the pandemic, which has been attributed to increased stress (Fuller-Rowell et al., 2022). Such changes may present implications for the robustness of our findings over time.
In a similar vein, it is also important to note that participants completed our study prior to civil unrest that occurred in the aftermath of George Floyd’s murder at the hands of Minneapolis police on May 25, 2020. Research suggests that racial attitudes have become more egalitarian following involvement in social justice movements like Black Lives Matter (Sawyer & Gampa, 2018). Therefore, future research is needed to determine the extent to which the racial climate—including stereotyping—in the US has changed in recent years.
Conclusion
Given that stereotypes are often implicated as one component of prejudice (Aronson et al., 2019), research concerning contemporary racial stereotypes can inform our understanding of intergroup relations. Since 1995, stereotypes have become less uniform, indicating less public agreement regarding how to characterize Black people as a social group. However, the enduring negativity of contemporary racial stereotypes suggests that increased stereotype heterogeneity may not be enough to improve collective societal perceptions. There appears to be an uphill battle to shift the negativity of contemporary racial stereotypes and, instead, our findings underscore the importance of intervening to reduce the application of stubborn and negative stereotypes to prevent group-based generalizations.
Footnotes
Acknowledgements
We thank members of the Prejudice and Intergroup Relations Laboratory for their assistance on the project. In particular, we would like to acknowledge Kierin Barnett for her helpful feedback on earlier versions of this manuscript.
Author contributions
T. L. Ash conceptualized the study and created study materials with feedback from all other authors. T. L. Ash, K. E. Scott, and M. Bruun collected data for the study. K. E. Scott analyzed the data. T. L. Ash, K. E. Scott, and P. G. Devine wrote the manuscript. All authors provided feedback on the manuscript and approved the final submission.
Funding
The author(s) disclosed receipt of the following financial support for the research, authorship, and/or publication of this article: Preparation of this article was supported by a Wisconsin Alumni Research Foundation Professorship and Maximizing Investigators’ Research Award No. R35 GM127043-01, awarded to P. G. Devine. The research reported here was also supported by the Institute of Education Sciences, U.S. Department of Education, through Award No. R305B200026 to the University of Wisconsin – Madison. The opinions expressed are those of the authors and do not represent views of the U.S. Department of Education