
Abstract
The connection is one of the most important members in the structural frame, and its behaviour greatly influences structural collapse patterns and anti-collapse ability. According to the concept of the component method, a semi-rigid beam-to-column connection can be defined as an assembly of a series of equivalent T-stubs and relevant components. In order to actualise the large deformation simulation of the connections, both axially and rotationally, a new multi-spring component model to evaluate properties of T-stub connections has been proposed in this article. The nonlinear property of a T-stub is described by a multi-spring system, which is used to trace the entire T-stub post-yield behaviour. A series of experiments with T-stub connections has been performed to calibrate the proposed model. The load curves and failure mode of the experiments, three-dimensional finite element method and multi-spring component modelling fit well with each other. A case study of beam-to-column semi-rigid connections has also been performed to further illustrate the usage of the T-stub component model in beam-to-column semi-rigid connections.
Keywords
Introduction
The practical design of steel structures normally assumes that the beam-to-column connections are either fully rigid or hinged although it is known that the actual connection behaviour can be semi-rigid (Cabrero and Bayo, 2005; Nethercot, 1995). Studies on the performance of semi-rigid connections (SRCs) showed that SRC can optimise the moment distribution in a steel frame and improve the behaviour of the beams (Bayo et al., 2006; Wang and Li, 2008). The European design code EC3 (EN 1993-1-8, 2005) provides a method to calculate the connection’s stiffness, known as the component method (Eurocode 3). Employing the component method of EC3, the SRC behaviour can be predicted with an appropriate level of accuracy (Akbar et al., 2009; Mohamadi-Shoore and Mofid, 2011; Xing et al., 2006), and this method has been widely employed by many researchers (Alfonsas and Kàstutis, 2008; Jaspart, 2000; Keulena et al., 2003; Rafiq et al., 1998).
In recent years, many disasters such as earthquakes, landslides and floods have occurred, causing building collapses (Meera and Abbie, 2013; Tiago and Júlio, 2010). Due to the extreme loadings, such as impact and blast loads (Pekau and Cui, 2006), the affected building structures usually suffered serious damages and the connections of the structures usually deformed significantly. In order to prevent structural collapse, the connections must possess sufficient ductility to accommodate the significant deformation demand, in which case considerable research studies on large-scale deformation and failure of connections (Dong, 2001), local failures of frames (Luigi and Vincenzo, 2009) and progressive collapse of semi-rigid framed buildings (Liu, 2011) are required.Simões da Silva et al. (2002) conducted a nonlinear analysis to evaluate the ductility of a number of steel connections within the scope of the component method, which allows an accurate prediction of the yield sequence of various components in an SRC. Wang and Li (2008) provided a practical design method for semi-rigid frames under normal loading conditions, which was verified by a series of full-scale semi-rigid frame tests. James and Roberto (2000) performed a series of T-stub connection tests under axial cyclic load histories and developed a large database to calibrate simplified models developed for design.James and Roberto (2001), Faella et al. (2000) and Al-Khatab and Bouchaïr (2007) determined the stiffness of bolted T-stub connections using the spring model that was developed based on the component method.Fu (2009) and Izzuddin et al. (2008) employed progressive collapse analysis to investigate the structural behaviour of multi-storey buildings suffering from sudden column removal, and Vlassis et al. (2008, 2009) examined the progressive collapse of multi-storey buildings caused by failure and impact of its floors. Using the component method, Fang et al. (2012, 2013a, 2013b) further examined the connection behaviour of multi-storey frames subjected to fire scenarios. These research studies treated the SRCs as key structural components and attempted to accurately evaluate their ductile behaviour.
More specifically, when an interior column becomes ineffective, the steel beams and the structural floor system previously supported by this column would deform significantly such that catenary action may develop in the beams and slabs to resist the applied loads. In order to maintain the catenary action in the structural members, the connections joining the members must be able to sustain significant deformations (Yang and Tan, 2012). The connection ductility is governed by various factors such as the ductility of steel material and geometric configurations and types of the connection. Because of the large deformation to the connections, both axially and rotationally, the conventional component method in the current EC3 may not be suitable for assessing the response of the connection, noting that in EC3, the component method is only applicable to the case where the axial force of the connected member does not exceed 5% of the axial design resistance of the beam section. Thus, it is beneficial to develop a modified or new method which can take into account the nonlinear behaviour of the SRCs under large deformations.
According to the basic concept of the component method, a beam-to-column SRC can be defined as an assembly of a series of T-stubs and some other components (Agerskov, 1976; Shi et al., 1996; Yee and Melchers, 1986). The T-stub, which is a very important component assembly, is generally composed of several components such as bolts, beam and column tee-sections, and welds. The components can exhibit significant nonlinear behaviour after yielding, which shows the importance of nonlinear presentations of the component assembly (Amin and Mark, 2008; Ana et al., 2006). And the influence of the bolt on the post-yield behaviour of the T-stub connection needs to be further clarified. To this goal, Wang et al. (2010) investigated the behaviour of a blind-bolt when used in T-stubs and revealed that the blind-bolt would reduce the initial stiffness of a T-stub. Charis and Minas (2003) evaluated the influence of bolt length on the T-stub performance.James and Roberto (2000) analysed the T-stub failure mode and completed a parametric study through conducting several T-stub experiments.
It can be seen from the above discussion that although experimental studies have been conducted to investigate the structural behaviour of T-stubs, the post-yielding nonlinear behaviour was not sufficiently addressed. In this article, a new multi-spring component (MSC) model is proposed to evaluate the nonlinear behaviour of T-stubs under tension. The nonlinear property of a T-stub is described by a multi-spring system, which is used to trace the entire T-stub post-yield behaviour. The accuracy of the proposed model is verified by a series of T-stub tension tests. In addition, numerical models have also been built and further discussions are made through comparing the finite element (FE) predictions against the test and analytical results. Finally, an entire beam-to-column connection is tested to demonstrate the validity of the MSC model which can be used in structural analysis.
MSC modelling approach
Component modelling strategy
Typically, T-stubs may fail in three modes, that is, combined failure, failure of flanges and failure of bolts. Based on the three failure modes shown in Figure 1, the structural components within the T-stub can be identified, namely, ‘web in tension’, ‘flange in bending’ and ‘bolts in tension’. The stiffness of each component is named as kwt, kfb and kbt, respectively. The flange can be divided into two segments, AB and BC, and the corresponding stiffness of part AB is kfb1.

Failure modes of conventional T-stub: (a) unloaded T-stub, (b) failure of bolt, (c) failure of flange and (d) combined failure.
Thus, the tensile T-stub component model, illustrated in Figure 2, consists of springs which are used to represent each component. Spring Swt is used to represent the web component under tension; spring Sbt represents the bolt under tension; spring Sfb1 is the flange component of section AB in bending and shearing; spring Sft represents the flange in tension. If the stiffness of the two spring system in Figure 2(a) is kftAB, then it can be evenly divided into two equivalent springs, SAB, as can be seen in Figure 2(b). Spring SAB takes account of the axial component of the resistance of flange AB when its deformation is significant at catenary stage.

Elastic spring component model of T-stub in tension: Spring Swt is used to represent the web component under tension; Spring Sbt represents the bolt under tension; Spring Sfb1is the flange component of section AB in bending and shearing; Spring Sft represents the flange in tension; Spring SAB is the equivalent spring. And Stiffness of the two spring system in Figure 2(a) can be evenly divided into two equivalent spring SAB, seen in Figure 2(b).
For the location of those springs, the web in tension component spring Swt is placed at the top as this is where the web itself is located. Spring Sfb1 is located right below the web spring Swt at point A. In a similar way, spring Sbt is fixed ‘to the ground’. Finally, the spring SAB, which represents the tension components of the flange in tension, is located in parallel with spring Sfb1.
Nonlinear behaviour of the multi-spring system
In the traditional component method, the structural components are simulated using linear springs. In order to simulate the nonlinear behaviour of the T-stub and relevant components, a multi-spring system is proposed for component modelling in this article. The multi-spring system is shown in Figure 3, in which a linear spring and a linear pretension spring are connected in series. The pretension spring Sp has a stiffness kp, and the pretension force is FT. The elastic spring Se has a stiffness ke, and all other parts in Figure 3 are assumed to be fully rigid. The degree-of-freedoms are defined as follows: Q1 represents the total displacement and Q2 represents the displacement of the pretension spring. The pretension force applied to the spring would delay the participation of the spring in the multi-spring system until the applied load reaches the pretension force. When the imposed load is larger than the pretension force, both the linear tension spring and the pretension spring will act in series.

Multi-spring system in tension.
Assuming a positive tensile load F, when F is smaller than FT, Q2 = 0 due to the pretension condition. Thus, the response of the spring system is shown below

When the applied force F is larger than the pretension force FT, the displacement of the pretension spring, Q2, would occur. A solution can be found as below

Since elastic spring Se and pretension spring Sp were connected in series, the stiffness of the two spring systems would be smaller than the stiffness of either individual spring (ke or kp). Thus, the load–deformation characteristic of the two spring systems would be bilinear, as shown in Figure 4. When more pretension springs are added in series to the system, a multi-linear load–deformation relation will be achieved, which provides a more accurate and effective way to simulate the nonlinear behaviour of the T-stub and relevant components.

Bilinear force–displacement diagram for T-stub component.
Tensile T-stub MSC model
Based on the above discussion, it can be seen that the nonlinear behaviour of the T-stub can be simulated by a combination of the multi-spring systems as shown in Figure 5. Each multi-spring system in the T-stub MSC model is a series connection as shown in Figure 3 with the corresponding load–deformation behaviour as shown in Figure 4.

MSC model for T-stub in tension.
As for the tensile stiffness of the T-stub, it is a combination of each component’s stiffness, which can be calculated by equation (3) (Wang et al., 2012) as follows

where lBC is the distance between B and C; lAC is the distance between A and C. In the expression above, kbt represents the stiffness of the bolt in tension, which can be obtained by equation (4)

where Ab is the sectional area of the bolt; lb is the effective length of the bolt. Based on the principle of virtual work and the unit load method, for the deformation of AB, δfb1 is the small deformation of the flange within AB, shown in Figure 6, which can be calculated by equation (5)

where M, N and V represent the moment, tensile force and shear force distributions applied on the AB flange, while M1, N1 and V1 are counter-force distributions when the flange is applied with a unit force.

Deformation of the flange within AB: Spring Swt is used to represent the web component under tension; Spring Sbt represents the bolt under tension; Spring Sfb1 is the flange component of section AB in bending and shearing; Spring Sft represents the flange in tension; Spring SAB is the equivalent spring.
Since the tensile force on the flange within AB will be considered in another spring, equation (5) can be approximated as

It should be noted that the prying load FQ at point C leads to an increased bolt load FB at point B. The relationship between MA and MB could be described by equation (7) (Thornton, 1985)

Here, δ can be obtained by following equation (8) (Thornton, 1985)

and the relationship between the prying load FQ and the shear force V at site A can be described by equation (9) (Thornton, 1985) as follows

In addition, α represents the ratio of the moment per unit width at B over the flange moment at A. When α = 0, it corresponds to the case of no prying action, and α = 1 corresponds to the case of maximum prying action. For conservative design, the maximum prying action condition (i.e. α = 1) was proposed. Thus, kfb1, the stiffness of the AB flange, can be determined as follows

where E is the material Young’s modulus; I is the section moment of inertia; G is the material shear modulus; lAB is the distance between A and B and Avf is the area of the flange plate cross section. N represents the applied tensile force at the web top of T-stub and V represents the shear force on the cross section of flange at point A in Figure 5.
Taking µ = 0.3 and G = 0.5E/(1 + µ), k = 6/5, equation (11) can be re-expressed as follows

where tf is the thickness of the flange plate. Then, kwt, the stiffness of the web component in tension, can be given by equation (12) as follows

Within the expression above, Aw is the cross area of web and hw is the web height taken into account. In the flange component of AB in tension, the stiffness of spring SAB can be expressed by equation (13)

where φ is the rotation of the flange in AB section.
Based on equations (3)–(13), the elastic stiffness of all the activated components and the T-stub can be calculated. However, as for the post-yield characteristic of the T-stub, by replacing all E (i.e. Young’s modulus) with the Est (i.e. strain hardening modulus), all the formulas can still be used in post-yield stage.
Experimental investigations into T-stub connections
Test rigs and process
In order to investigate the nonlinear performance of T-stub under tension and to calibrate the tensile MSC model, a series of T-stub specimens were tested. The basic configuration of the test specimens comprised of two T-stub members and two high-strength bolts. The bolts were tightened either according to the Eurocode 3 procedure or a snug tight condition was adopted. Grade Q345 and Q235 steel materials (GB50017-2003) were used to fabricate the specimens. A schematic is shown in Figure 7 and the details are given in Table 1. All the specimens were tested in tension under displacement control in a computer-controlled electro-hydraulic servo universal tester. Displacement control was employed at a rate of 0.1 mm/min. The elongation of the T-stub specimens and bolt elongation were measured by linear variable differential transformer (LVDT) as shown in Figure 8. The data concerning the T-stub elongation, the bolt elongation and the applied load were recorded by a data acquisition system.

T-stub specimen’s general appearance.
Test specimens’ description.

T-stub specimen No. 8 was designed for parametric study and has not been included in the test arrangement.
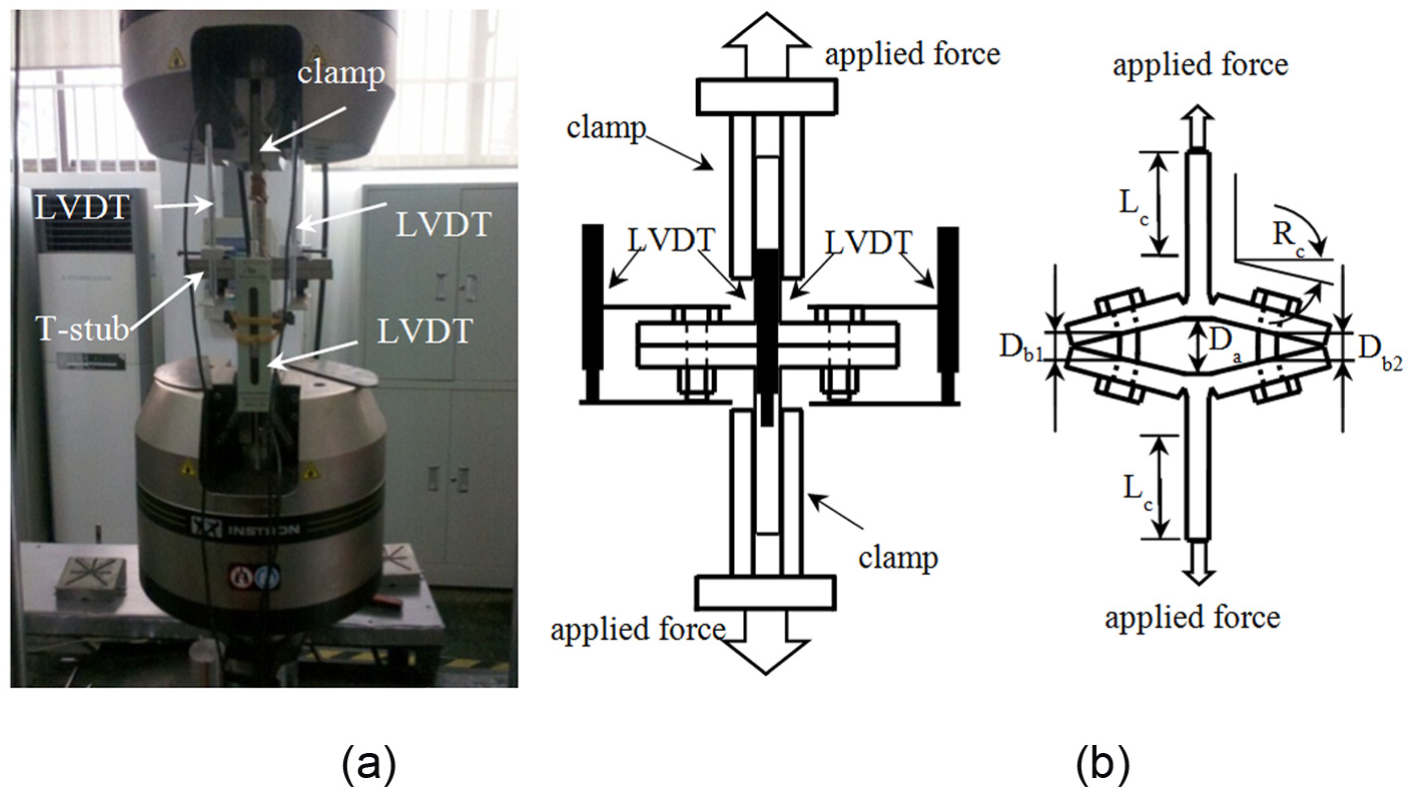
Tests of the T-stub specimens: (a) total view and (b) schematic of the test specimen.
Test results
The test results of the specimens are shown in Table 2. The load–deformation curves of test specimens are given in Figure 9. The observed failure modes include bolt failure, web failure and flange failure. Provided that no failure occurred on the flange, bolt failure became the primary failure mode (see test results of specimens No. 2, No. 3, No. 6 and No. 7).
Result of test specimens.

Da = axial displacement of T-stub; Db = displacement at bolt site; Rc = rotation at the corner of the T-shaped steel member; Lc = clamping length. Symbols can be seen in Figure 8(b).

Load–deformation curves of the MSC model, test and FEM results: (a) No. 1 test specimen result, (b) No. 2 test specimen result, (c) No. 3 test specimen result, (d) No. 4 test specimen result, (e) No. 5 test specimen result, (f) No. 6 test specimen result and (g) No. 7 test specimen result.
Verification of models for T-stub connections
MSC model for T-stub connections
Based on the discussion above, the following process can be employed to predict the nonlinear behaviour of T-stubs. First, the T-stub was analysed and divided into several components as mentioned before. Second, the mechanical properties of each component were calculated. Using springs with those mechanical properties, an MSC model of the T-stub could be established. Finally, the MSC model was analysed to obtain a suitable description of T-stub behaviour. The steps mentioned above are shown in Figure 10, and the load–deformation curve of the T-stub could be properly achieved.

Analysis flowchart of the T-stub multi-spring model.
Three-dimensional FE model by ABAQUS
The three-dimensional (3D) FE model can be built using the FE analysis software package, ABAQUS. In the 3D FE model, the tensile T-stub connections were generated using the eight-node brick, reduced integration and hourglass control elements (element C3D8R in ABAQUS) (HKS, 2005). Interactions between members were also introduced. The normal behaviours of those interactions were set to the hard contact, allowing separation after contact. As the steel members were prepared by shot blasting, the tangential behaviours of those interactions were used by the penalty friction formulation with a slip coefficient of 0.25. The steel is grade Q345 and Q235 with the nominal yielding stress fy = 345 MPa and 235 MPa, respectively. The stress–strain relationship for the steel was taken as elastically perfect plastic with a Poisson’s ratio of 0.3. The stress–strain relationship of the grade 10.9 high-strength bolts was taken as trilinear, with the points being given in Table 3.
Material properties of high-strength bolts.

Validation of the MSC model
In order to verify the proposed MSC model, the analytical results are compared with those from the FE analysis and experiments. The initial stiffness and ultimate load are listed in Table 4. The initial stiffness of the MSC model and the FE method (FEM) results are slightly larger than the test results, which may be due to the initial slippage of the specimens. In addition, the difference in the initial stiffness may also be due to the lack of transverse interactions between springs. Nevertheless, the load–deformation curves of the proposed MSC model fit well with the test and FEM curves according to Figures 9 and 11. It can also be found that first yield occurred at location A of the T-stub flange in almost all specimen tests. These performances are captured well by the MSC model, and good agreements are observed between the experimental, numerical and analytical predictions.
Test results and predicted results of finite element and component method.


Actual test specimen and FEM modelling: (a) No. 1 test specimen, (b) No. 4 test specimen, (c) No. 5 test specimen and (d) No. 6 test specimen.
Parametric studies of the T-stub MSC model
Following the validation study, in order to show the applicability of the proposed model, more T-stub models with extensive parameters are discussed. Taking test specimen No. 6 and No. 8 as control specimens, the flange thickness was changed to see whether the MSC model was correct and fit well with the 3D FEM. Figures 12 and 13 illustrate the load–deformation curves with various flange thicknesses. It is shown that the load bearing capacity of the T-stub is sensitive to the flange thickness, where a decrease in flange thickness leads to a decrease in flange capacity. If the flange is thick enough, the catenary action will not occur and the T-stub will be less deformable. The parametric studies show that the MSC model results fit well with the 3D FEM results and the proposed model is suitable for various T-stubs.

Influence of the flange thickness on the No. 6 specimen T-stub load–deformation curve.

Influence of the flange thickness on the No. 8 specimen T-stub load–deformation curve.
Application of the proposed MSC model in a beam-to-column connection
A beam-to-column SRC can be defined as an assembly of a series of T-stubs and relevant components. Each T-stub can be represented by the equivalent bilinear spring with the same nonlinear behaviour, and then the beam-to-column connection can be modelled using MSC model, as shown in Figure 14. In order to verify the model analysis result, a further test was performed and a 3D FEM of the beam-to-column connection was built using ABAQUS software.

Illustration of MSC model for beam-to-column connection.
Test specimen and test setup
The test specimen in this case study is an extended stiffened end-plate steel connection with four rows of high-strength M12 bolts. The schematic of the test specimen can be seen in Figure 15(a). The connection was installed on a patand which was connected to the ground with two rows of long bolts, as shown in Figure 15(b). In order to apply the pulling load to the connection, a pair of corbels was installed at top end of the connection specimen. The pulling load was provided by a 2000 kN jack placed on the reaction frame and was delivered to the corbel through a steel device. This device was made up with a steel slab connected to two steel beams through four high-strength steel rods, as can be seen in Figure 15(b). The load data were collected by a force sensor located at the top of the jack and the displacement was measured by a pair of displacement meters. The deformations of the test connection during the loading process were collected by a series of strain gauges.

Test arrangement: (a) specimen and (b) test setup.
Grade Q345 steel was used for both the end-plates and the H-shaped steel for the column and beam (the stiffeners were cut from the same H-shaped steel plates as for the steel columns). Coupon tests, based on the American Society for Testing and Material (ASTM) specification (ASTM A370, 2002), were conducted to obtain the actual material properties of the specimens. The average measured material properties are given in Table 5. The test load–deformation curve can be seen in Figure 16.
Material properties of beam-to-column connection specimen.


The load–deformation curves of the MSC model, test and FEM for the beam-to-column connection.
Discussion of results
The 3D FEM of beam-to-column connection is shown in Figure 17. As the test specimen is symmetric and has four rows of high-strength bolts, two types of equivalent T-stubs, side T-stub and middle T-stub, with different sizes can be identified. The load–deformation curves of both the side and middle T-stubs can be obtained by the proposed MSC modelling and 3D FE analysis, as shown in Figure 18(a) and (b). Then, an MSC model of the beam-to-column connection can be built. The load–deformation curves of the proposed MSC model, as well as the test and the FEM results, are given in Figure 16. The initial stiffness of the MSC model result tends to be larger than the FEM and the test results, because in the proposed model the beam’s cross section is a rigid body which remains flat when bearing a load. The fact is that the cross section of the beam is not always flat as shear lag occurs and leads to uneven distribution of the stress. Also, the transverse interactions among springs are rarely taken into account in the proposed model of both T-stub and beam-to-column SRC cases. However, the curves in Figures 16 and 18 can still be considered as fitting well with each other and the difference is acceptable.

Three-dimensional nonlinear FE modelling of the beam-to-column connection.

Comparison of equivalent T-stub load–deformation curves of the MSC model and FEM results: (a) side T-stub and (b) middle T-stub.
Conclusion
The connection and its ductility are often considered as critical factors of a steel-framed structure under extreme loads and large deformations. Analytical model development and experimental investigation along with FE analysis have been presented in this article, and the following conclusions can be drawn:
A multi-spring system, in which a linear spring and a linear pretension spring are connected in series, is proposed for component modelling. The spring’s co-work is delayed by applying pre-load on the spring, and a multi-linear load–deformation relation can be achieved, which provides a more accurate and effective way to simulate the nonlinear behaviour of the T-stub and relevant components.
Based on the multi-spring system and component modelling strategy, an MSC model is proposed for evaluating the SRC behaviour in this article. A series of experiments on the T-stub connections were performed to verify and calibrate the proposed model. Results, including load curves and failure modes, of the experiments, 3D FEM and MSC model fit well with each other, giving a good prediction of the post-yield response of the T-stub connections.
A column-to-beam SRC test has also been conducted to further demonstrate the usage of the MSC model in structural analysis. The analysis results show that the MSC model is capable of predicting the nonlinear behaviour of a tensile beam-to-column SRC, which is a useful improvement to the connection design.
Footnotes
Declaration of conflicting interests
The author(s) declared no potential conflicts of interest with respect to the research, authorship and/or publication of this article.
Funding
The author(s) disclosed receipt of the following financial support for the research, authorship and/or publication of this article: The authors gratefully acknowledge the financial support from the National Nature Science Foundation of China (Nos. 51279180, 51179171 and 51079127), Science Technology Department of Zhejiang Province (Grant No. 2013C33043) and The Hong Kong Polytechnic University Central Research Grant (G-YL86).