
Abstract
Cable–strut tensile structure is composed of tensile cables and compressive struts; its prestressed forming state is obviously influenced by cable length and tension force, so the key control objects of construction are active forces of tensioned cables, lengths of passively tensioned cables, and outer node coordinates. Error effect analysis is required to obtain rational control indexes. The method of multiple random-error effect analysis including errors of the above three control objects is proposed and described in the text: (1) outer node coordinate errors along the linked cables are regarded as additional length errors of outer linked cables; (2) random cable length errors and tension errors based on probability distribution are introduced into error analysis cases by modifying initial strains of cables; and (3) for avoiding the interaction between passive cable length errors and active cable tension errors, elastic modulus of active cables is modified to small values. According to the statistics of measured cable lengths, cable length errors may not be complied with normal distribution. Therefore, the M-shaped probability distribution is proposed, and derivations of probability density function, cumulative distribution function, and its inverse function are carried out, by which calculated random cable length error distribution is comparatively consistent with measured errors. Taking Yueqing Stadium, a wheel-spoke cable truss with crescent shape, as an example, multiple error analysis including passive cable length errors of M-shaped probability distribution, outer node coordinate errors, and active tension errors of normal distribution is carried out. Some useful conclusions and construction control indexes are obtained.
Keywords
Introduction
Cable–strut tensile structures (CSTSs) are prestressed structures consisting of cables and struts or just cables, mainly including cable domes, cable trusses, cable nets, and so on. One of the most typical characters of CSTSs is that these have no rigidity to bear loads before pretensioning. Fuller and Applewhite (1975) and Geiger (1988), who were pioneers of CSTSs, respectively, conceived the tensegrity system and first proposed the cable domes. Due to their special structural configurations and long-span capabilities, CSTSs have been applied in many real projects around the world. Cable dome for 1988 Seoul Olympics, the canopy of Poland Warsaw National Stadium (Figure 1) used in the 2012 European Football Championship, the canopy of the Kuala Lumpur Outdoor Stadium in Malaysia, and so on are representative projects of CSTSs (Feng et al., 2003; Geiger et al., 1986). Especially, large-span CSTSs are developing fast in China, and many projects are under construction or to be built, such as Foshan Century Lotus Stadium (Figure 2) and Shenzhen Baoan Stadium in Guangdong Province, Suzhou Stadium and Natatorium in Jiangsu Province, Zaozhuang Stadium in Shandong Province, and so on.

Canopy of Poland Warsaw National Stadium.

Century Lotus Stadium in Foshan.
Since CSTSs are one kind of prestressed structures, the preloads in cables have fundamental influence on the whole structure. When all the permanent actions are applied, the structure should attain the required geometric profile and stress distribution. As a result, studies on CSTSs focus mainly on the analysis of geometrical configuration and stability, initial prestress states, and structural optimization (Calladine and Pellegrino, 1991; Kawaguchi et al., 1999; Pellegrino and Calladine, 1986, 1992; Yuan and Dong, 2003). However, difficulties still exist in guaranteeing the accuracy of prestress distribution in CSTSs which has an important impact on their configurations. What is more, CSTSs, which are unable to equilibrate loads in their original configuration, rely on prestress to keep stable and stiff formation. Excessive prestress errors (recorded as EP) will change their mechanical properties fundamentally. Therefore, prestress errors are to be discussed in this article.
The factors leading to prestress errors are diverse and inevitable. Due to the limited construction technology and manufacturing level, errors of cable lengths, nodal coordinates of outer substructure, and active tensile forces are common to CSTSs. In this article, they are recorded as EL, EC, and ET, respectively. European codes (Eurocode 3, 1993), Chinese codes (JGJ 257-2012, 2012), and other criteria all have provisions to reduce the adverse effects brought by EL, EC, and ET, as the maximum values of EL, EC, and ET should be limited. The total length of the cable and all measuring points for the attachment of saddles and clamps should be marked under a defined preload. The provisions of additional control markings allow for later checks of the exact length after all the parts have been installed. In addition, the fabrication tolerances should be taken into account after pre-stretching, cyclic loading, and cyclic unloading. When structures are sensitive to deviations from nominal geometrical values (e.g. by creep), facilities for adjustments should be provided (Eurocode 3, 1993). But to some error-sensitive CSTSs, apart from measures mentioned above, error effect analysis is extremely necessary to determine more stringent and specific control standards.
Although there are some literatures focusing on error sensitivity analysis, the deficiencies remain obvious. For example, Deng and Song (2012) took Zhejiang University Zijingang Campus Stadium as a case, and different active cables were selected to carry out error comparison analysis, and the results proved the rationality of the actual tension program. Zhang et al. (2006, 2008) analyzed the influence of cable length errors on the initial prestress of cable dome, and according to the results, cable production requirements were drafted. Guo et al. (2009) studied the sensitivity of Baoan Stadium to random errors. However, the existed researches above focused merely on the effects of EL and assumed that EL obeyed normal distribution. According to the statistic data of EL in some projects, normal distribution assumption may not be reasonable. As a result, it is necessary to find a more reasonable probability distribution and carry out error effect analysis considering more factors.
In this article, error combination analysis of CSTSs is discussed by considering EL, EC, and ET. Random-error analytical methods are taken into consideration, and reasonable distribution functions for each kind of errors are set up. By analyzing the cable length errors of several specific projects, a new distribution model named M-shaped probability distribution is proposed, which is more consistent with the real EL distribution of CSTSs. One of the real projects, a nonclosed cable-truss structure with crescent shape, named Yueqing Stadium in Zhejiang Province of China, is taken as an example to verify the accuracy and validity of the method.
Multiple random-error analytical method of EL, EC, and ET
Overview of EL, EC, and ET
According to construction program, cables of CSTSs can be divided into active cables and passive cables. Active cables are the ones tensioned directly by jacks, and their lengths are changed by adjustments at the same time, while other cables tensioned passively are called passive cables. Therefore, EL and ET are introduced to passive cables and active cables, respectively. Some cables of CSTSs are directly anchored at nodes of outer substructure, so EC have effects on stress distribution as well. According to the relationship with outer substructure, cables can be divided into outer cables and inner cables. Outer cables, the cables directly connect with outer substructure, have both EL and EC. Table 1 shows the relationships between errors and cables in detail.
Relationships between errors and cables.

In order to reduce EP, many cable structure standards have clauses to limit the maximum values of EL and ET. The tolerances of EL in ASCE Standard (ASCE/SEI Standard 19-10, 2010) and China specification (JGJ 257-2012, 2012) are listed in Table 2.
Tolerances of EL in ASCE Standard and China specification.
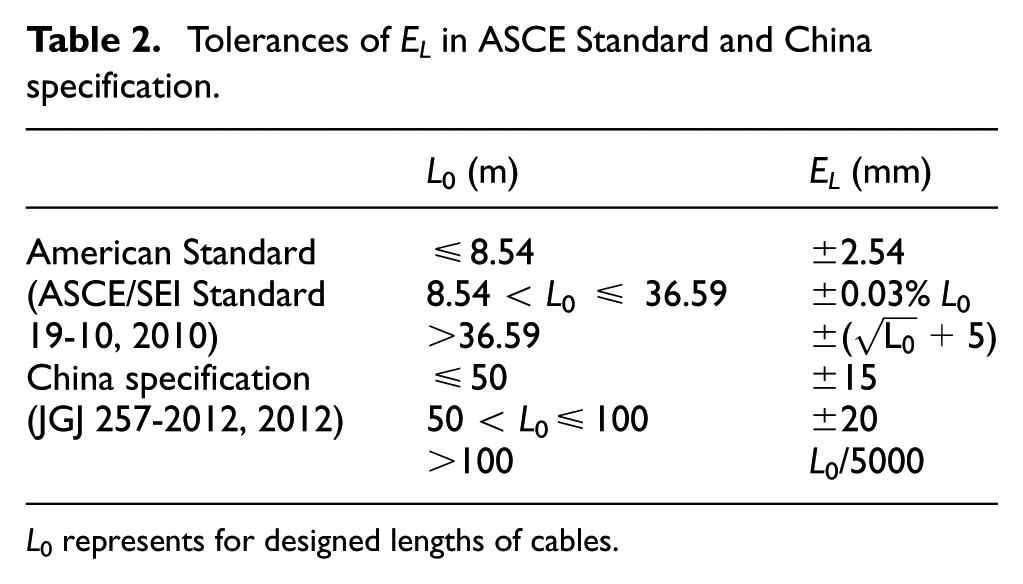
L 0 represents for designed lengths of cables.
As shown in Table 2, American Standard has stricter requirements on EL than those of China specification. According to China specification, when the structure is built up after tensioned, EP should be within the range of ±10% (JGJ 257-2012, 2012). In general, EL, EC, or ET can lead to EP, and the purpose of limiting EL, EC, and ET is to make sure EP meet the standard.
Probability distribution model of EL, EC, and ET
Characteristics of EL, EC, and ET
EL is determined by cable length, anchorage, production method, and so on. EC is concerned with fabrication of peripheral support structure and joints connected with outer cables. ET is decided by tensioning method and equipment, and so on. EL, EC, and ET can be expressed as equations (1) to (3)


where L is the exact cable length; T is the exact tension; C is the exact nodal coordinate along the outer cable; L0 is the designed cable length; C0 is the designed nodal coordinates along the outer cable; and T0 is the designed tension.
The same characteristics of EL, EC, and ET are (1) their values and signs are not fixed; (2) with the increase in the number of samples, the mean of errors will gradually tend to be 0; (3) although there is no regular pattern for the random error of a single cable, a sufficient number of cables obey the law of statistics in general.
By learning enough numbers of EL, EC, and ET, the distribution model can be obtained. Then, samples of EL, EC, and ET can be generated from the distribution model. As long as the samples are more than enough, and the worst case of the samples meets the construction requirements, the conclusion can be drawn that EL, EC, and ET would not affect the quality of the project.
Probability distribution functions of EL, EC, and ET
EL are determined by cable manufacture method, EC are decided by installation accuracy of surrounding substructure, and ET are caused by tensioning jacks. So, the three errors are produced by different factors and have no relationship with each other. In other word, they are independent on each other, and they should have different distributions.
Normal distribution is normally applied in random errors, and its probability density function is shown as equation (4) (Figure 3). The normal distribution is completely determined by the parameters µ and σ. It turns out that µ is the mean of the normal distribution and σ is the standard deviation. We use the abbreviation N(µ, σ2) to refer to a normal distribution with mean µ and standard deviation σ. Thus, when a random variable X is distributed normally with mean µ and variance σ2, we write X ∼ N(µ, σ2) (Degroot and Schervish, 2012). In this case, x in equation (4) can be replaced by EL, EC, or ET, µ is generally 0, and σ is generally one-third of the allowed maximum error
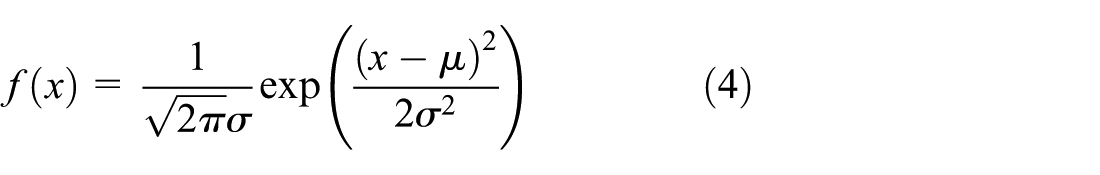
Probability density function of normal distribution.
The CSTSs with short cables are often sensitive to EL. What is more, according to the measurement results of several real projects, the probability distribution of EL does not necessarily comply with normal distribution. This article proposes a new distribution named M-shaped probability distribution which is more in line with the mentioned projects, and the details can be seen in section “M-shaped probability distribution of EL.”
Multiple error analysis with EL, EC, and ET
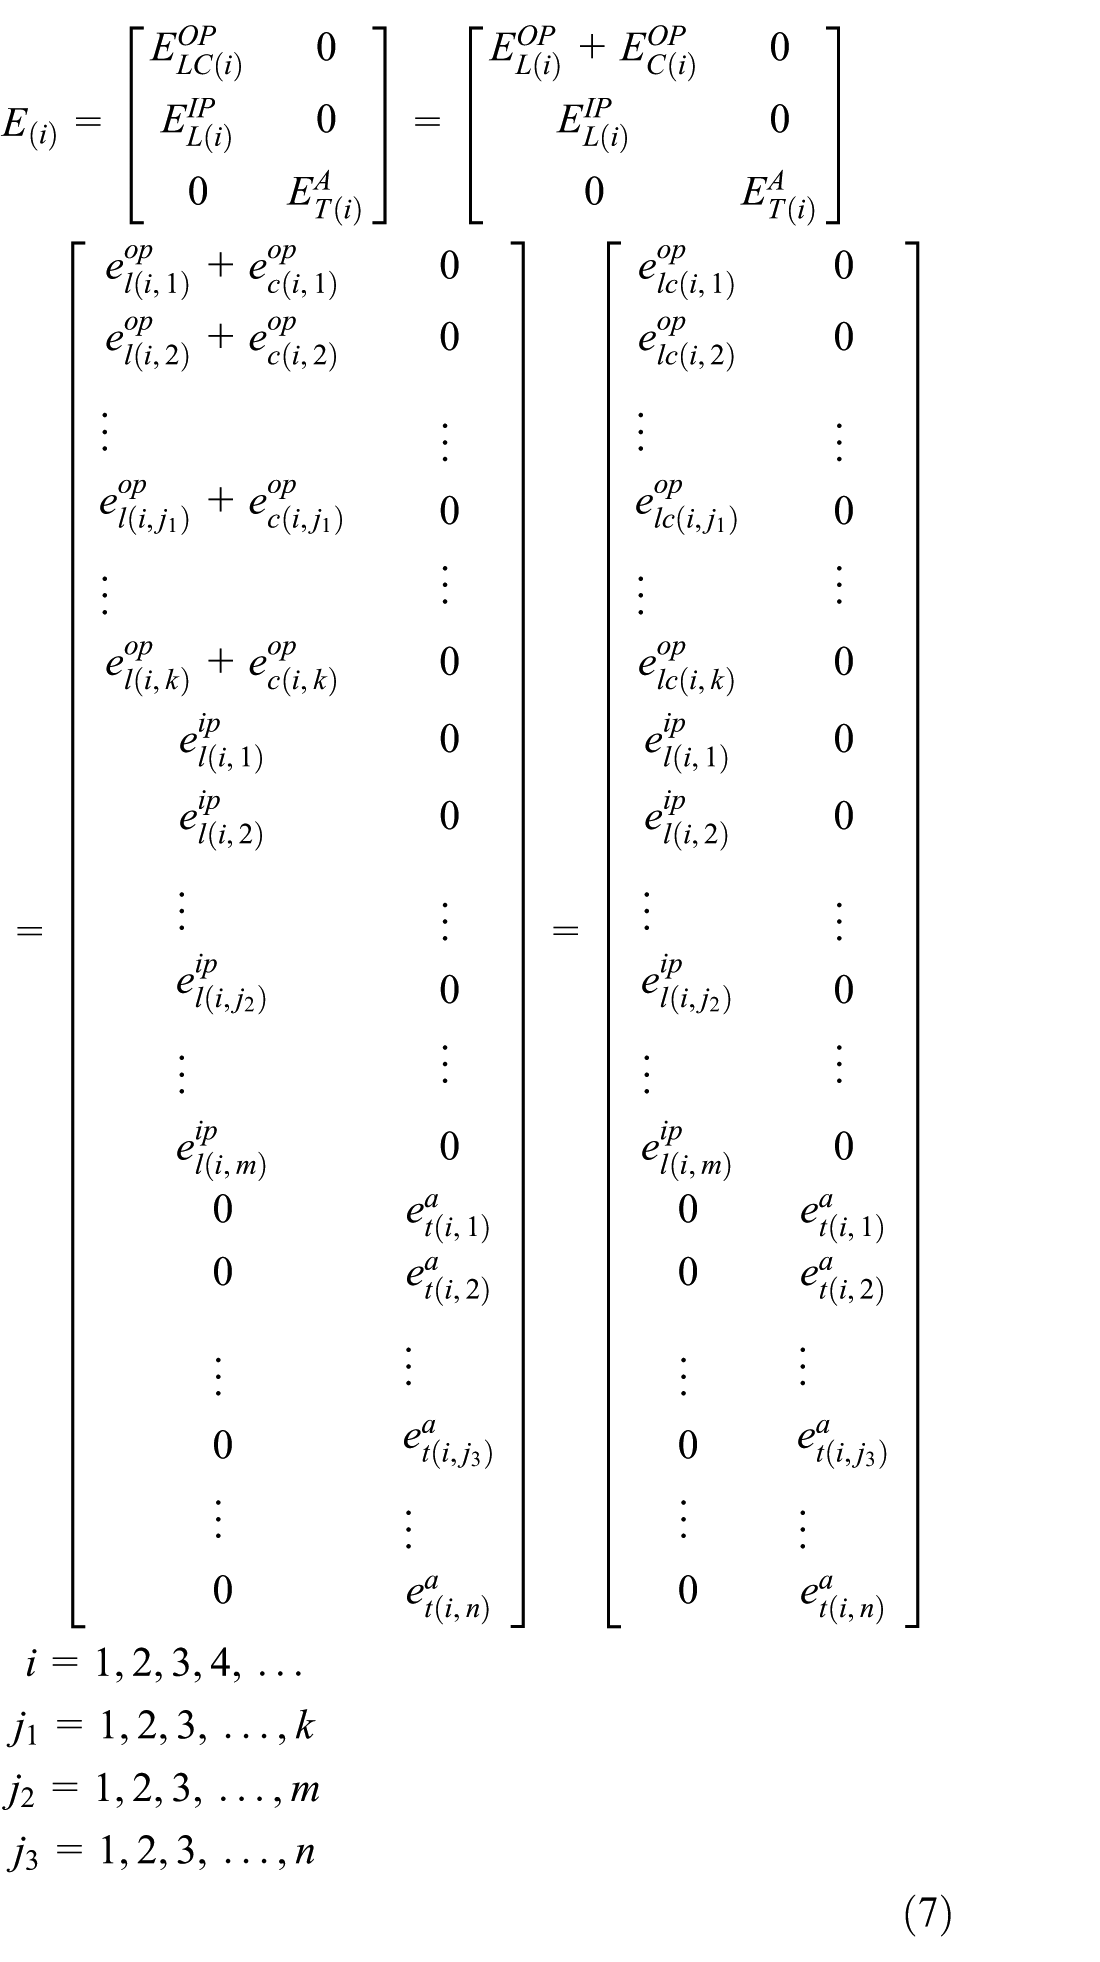
Errors that affect CSTSs are closely related with structural characteristics. According to cable–strut configuration and construction plan, cables of CSTSs can be divided into active cables, outer passive cables, and inner passive cables and to which different errors are introduced. These have been elaborated in section “Overview of EL, EC, and ET” in detail. The errors can be expressed in the form of a matrix as in equation (5)
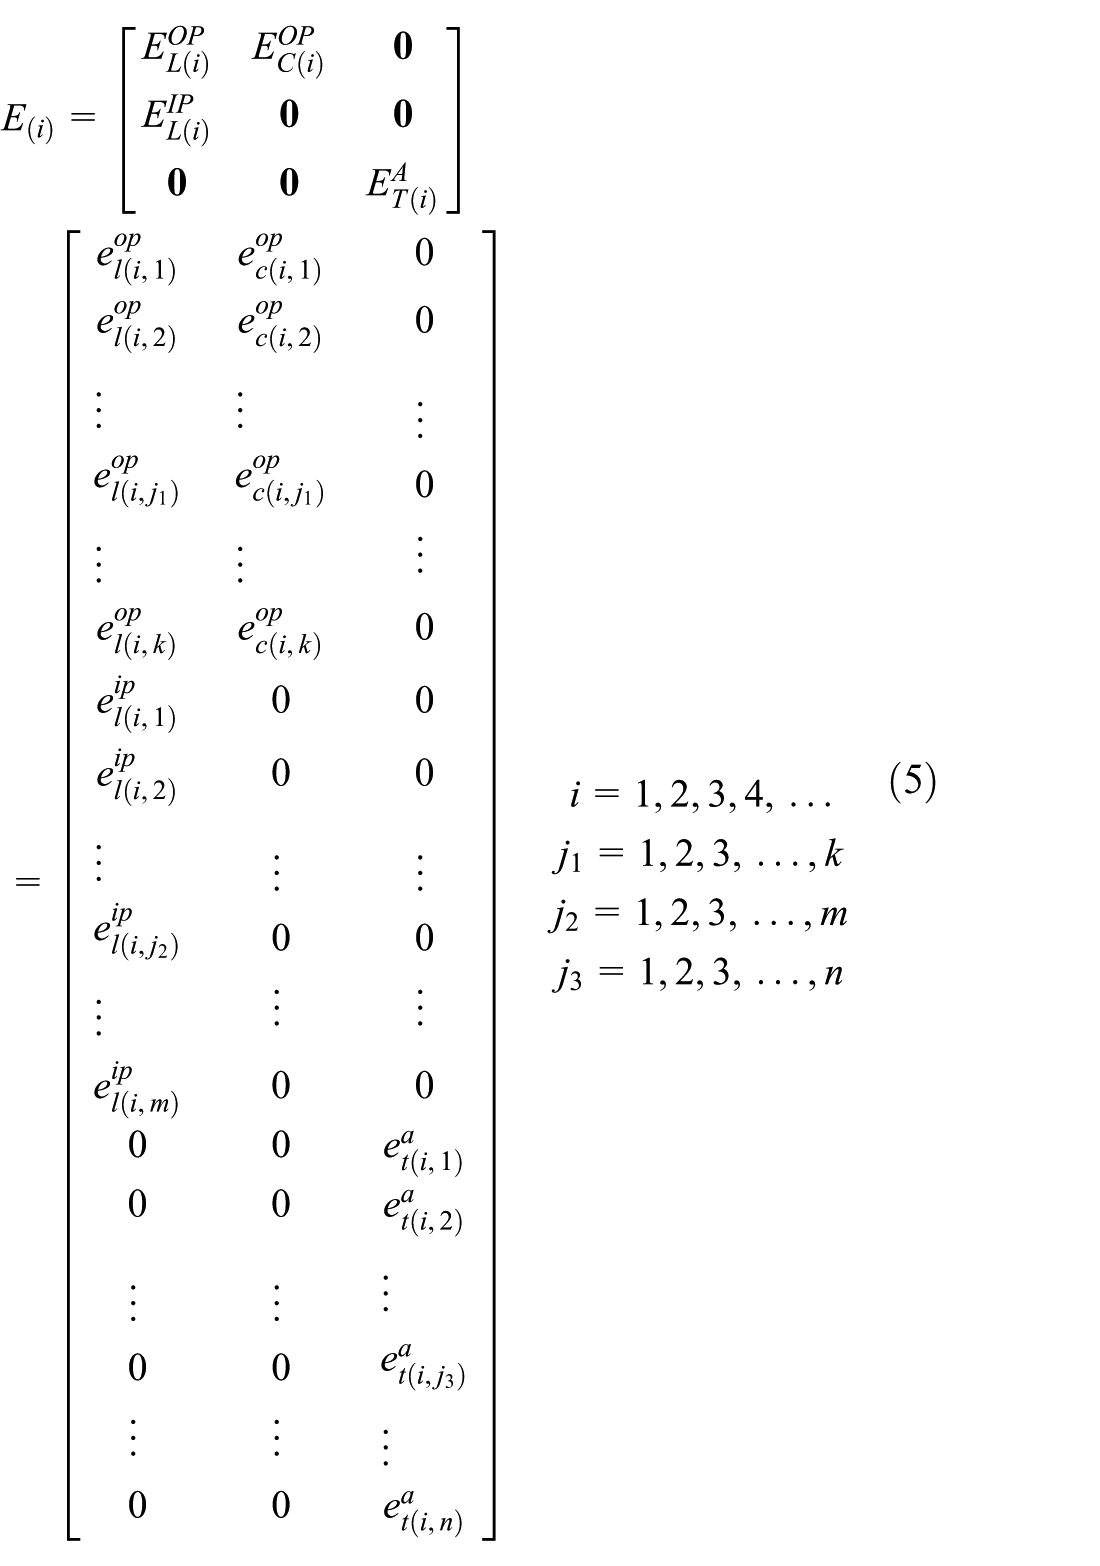
where i is the serial number of error samples; k, m, and n are numbers of outer passive cables, inner passive cables, and active cables;
According to distribution functions of EL, EC, and ET, the error samples can be generated. The more the samples, the more accurate the results. In general, the steps of EL, EC, and ET combination effect analysis are as follows: (1) determine distribution models and parameters of EL, EC, and ET, respectively; (2) generate enough quantity of error samples to meet the requirements of statistics (each sample is an error case of the structure); (3) introduce the error samples into CSTSs and generate error cases of defective structure; (4) analyze defective structure to get cable stresses of each case; (5) compare cable stresses of defect structures with those of perfect structures and calculate the maximum EP; and (6) if the maximum EP is less than what the standard requires, the distribution parameters of EL, EC, and ET are suitable; otherwise, parameters subjected to stricter regulations should be applied to reduce the errors.
From the view of error analysis, EC along the direction of the outer cables is equivalent to additional EL of outer cables. As a result, the total length errors of outer passive cables can be defined as equation (6). And equation (5) can be redefined as a (k+m+n) × 2 matrix, as seen in equation (7)

where
In the error analysis cases, passive cable lengths and active cable tension forces can be determined as


where initial strain can be modified and the formulas are

where
In common error analysis with length errors, each cable prestress is affected by


where
M-shaped probability distribution of EL
Statistics of actual length errors of cables
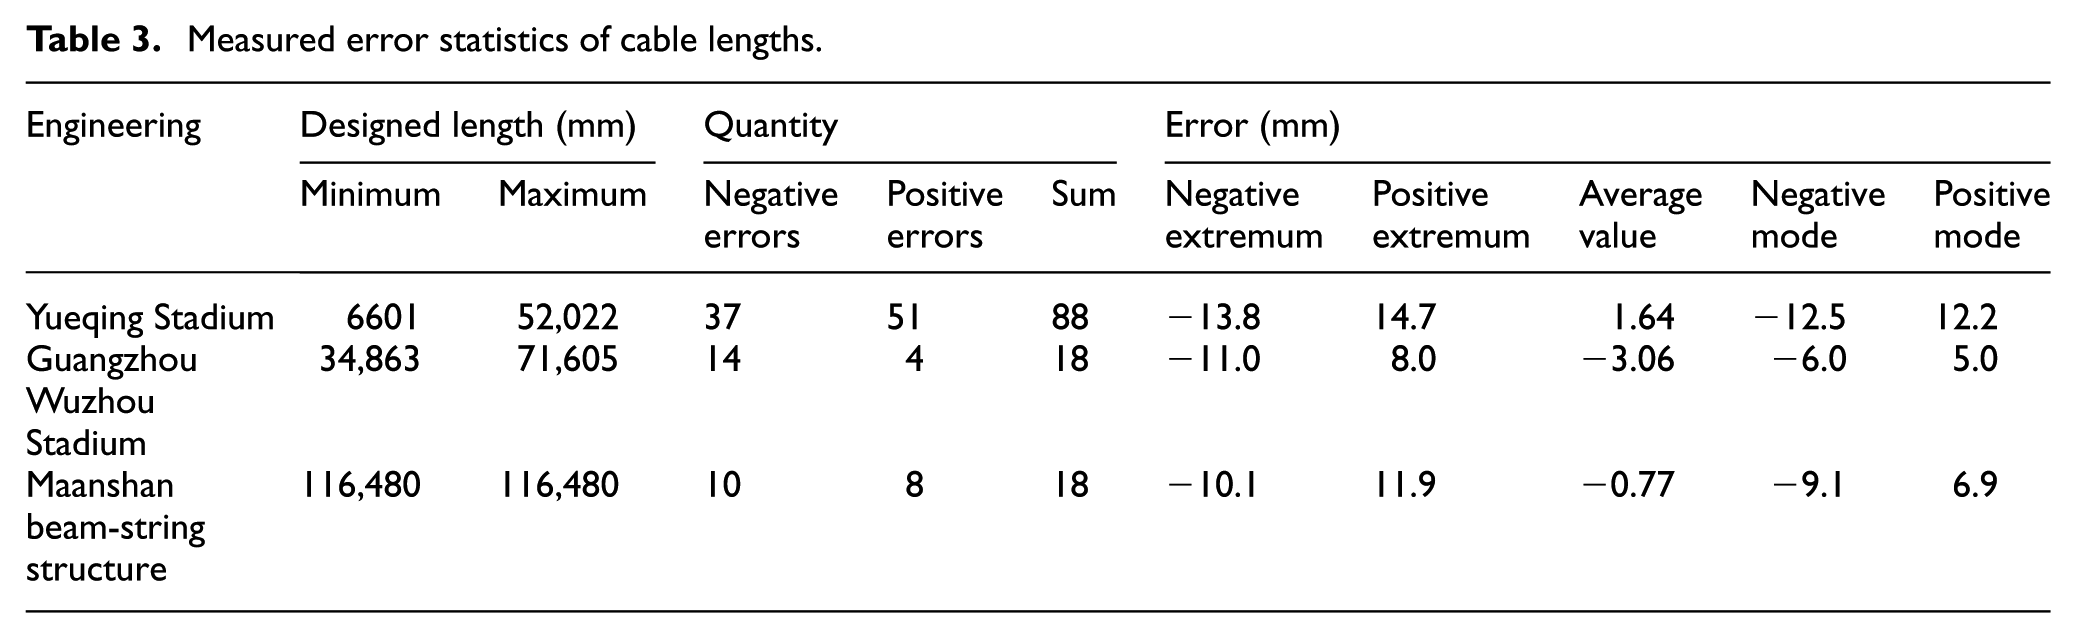
EL of three projects in China including Yueqing Stadium, Guangzhou Wuzhou Stadium and Maanshan beam-string structure are counted. There are totally 124 cables, and all the EL can meet the requirements of technical specification for cable structures (JGJ 257-2012, 2012; Table 2). The EL distributions are shown in Figures 4 to 6, and the statistic data are shown in Table 3. The EL distributions of the three projects are similar to each other, and the common characteristics are (1) the average values are close to 0; (2) the shapes are high at two sides and low in the middle; and (3) the modes are far from 0. Compared to normal distribution, the differences are apparent. Therefore, EL may not comply with normal distribution. If normal distribution is still chosen for EL, the estimated errors would be smaller. As a result, we tried to assume a reasonable error distribution model of cable lengths in error analysis.
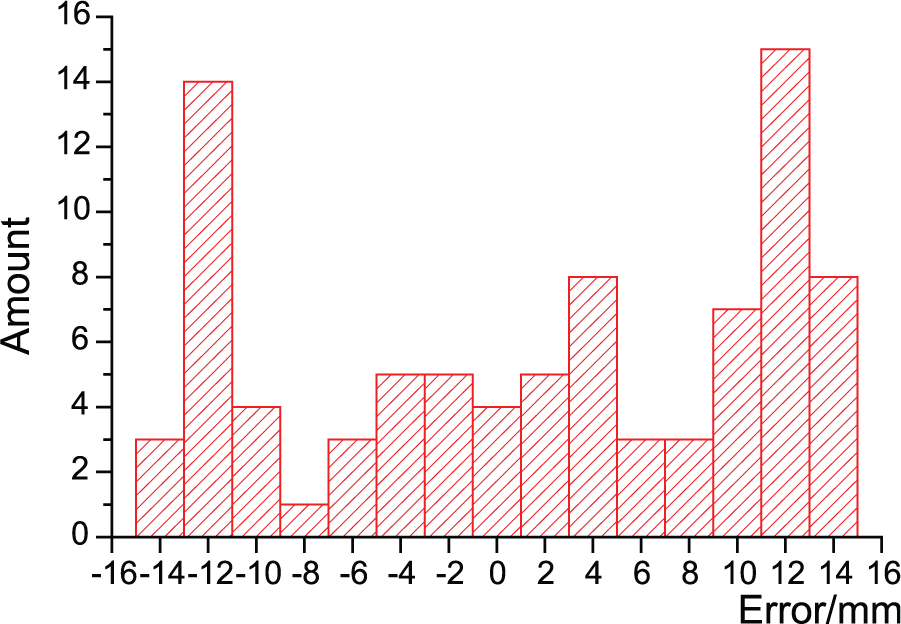
Measured EL distribution of Yueqing Stadium.
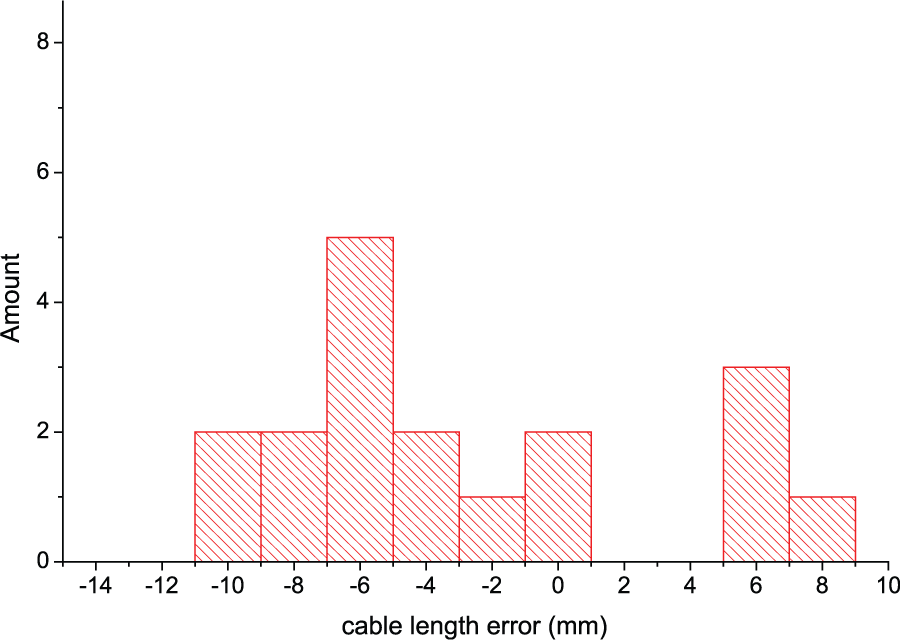
Measured EL distribution of Guangzhou Wuzhou Stadium.
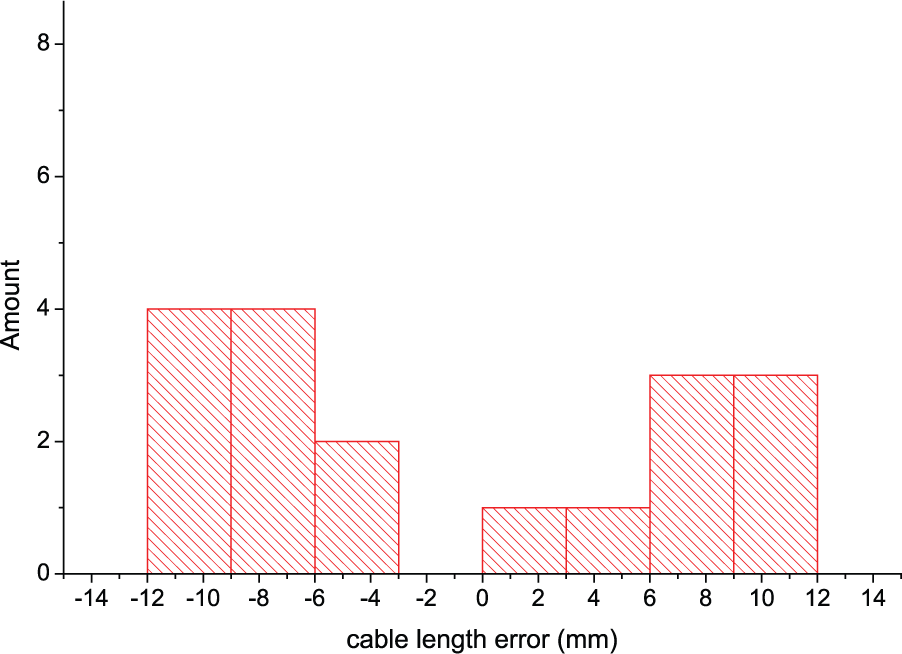
Measured EL distribution of Maanshan beam-string structure.
Measured error statistics of cable lengths.
M-shaped distribution model
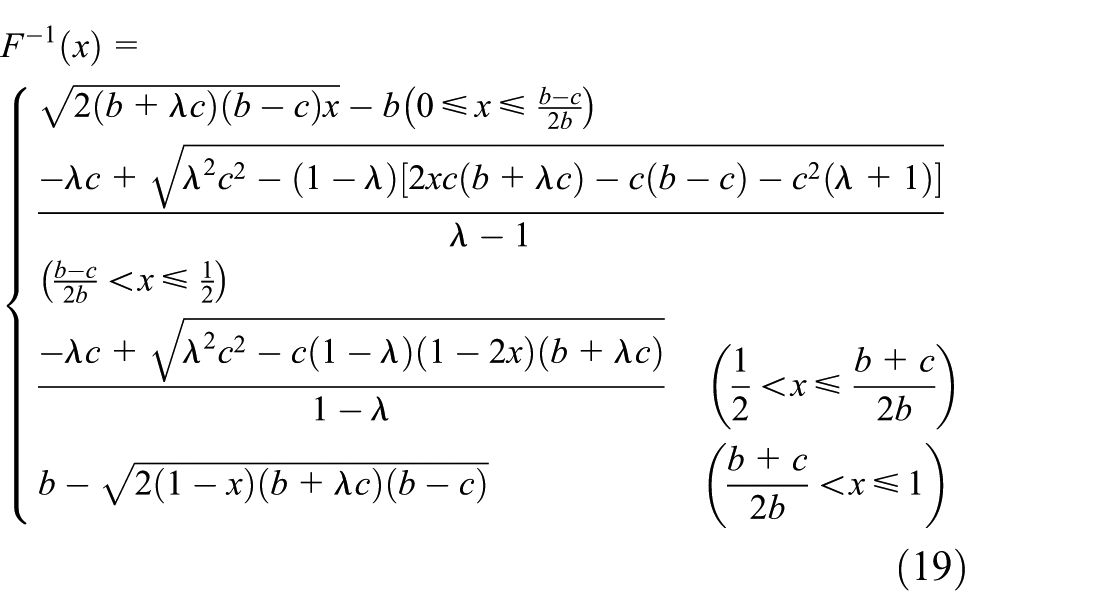
According to the statistic characteristics of measured EL, this article proposes an M-shaped distribution model (Figure 7), which has the same characteristics with measured EL. Its probability density function is given by equation (17), while the upper limit is b, the lower limit is −b, the expectation E is 0, and the mode M is ±c.
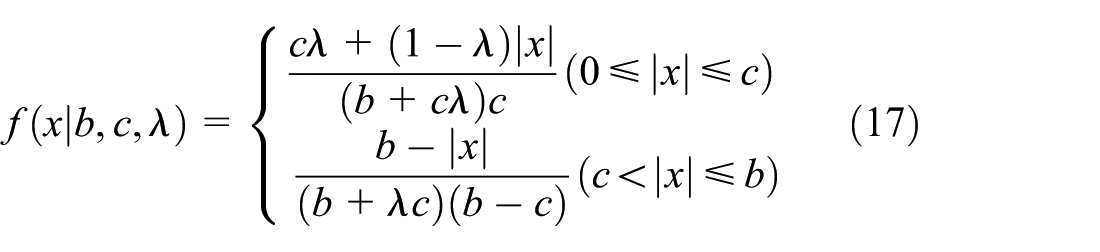
M-shaped distribution model.
The random numbers of M-shaped distribution are generated by utilizing the inverse function (Evans et al., 2000). The steps are as follows: deduce the inverse function of the M-shaped distribution in equation (19) and substitute random number x which obeys 0–1 evenly distribution into the equation and obtain the random numbers following the M-shaped probability density function
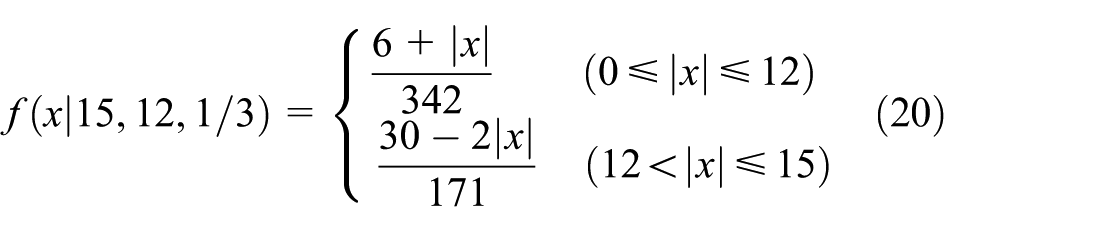
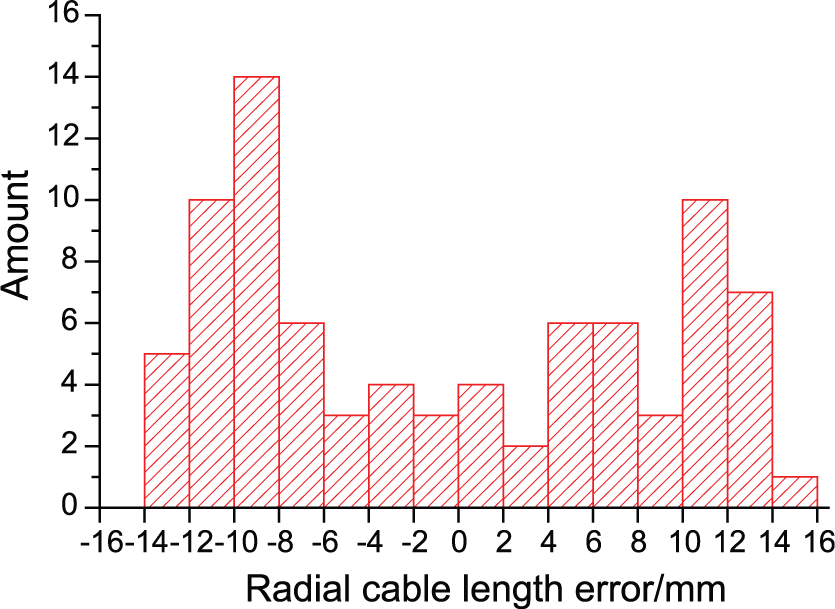
Based on the statistic results of measured EL, it is assumed that b = 15 mm, c = 12 mm, and λ = 1/3. Then substitute the above parameters into equation (17) to obtain probability density function equation (20). The EL of 84 cables have been calculated randomly on the basis of the formula. The sample number for EL of each cable is 500, which means 500 analysis cases of defective structures have been built. The statistic results for EL of one cable are as follows: the minimum value Min is −14.517 mm, the maximum value Max is 14.326 mm, the mean A equals 0.096 mm, and the standard deviation S equals 7.872 mm. By comparing Figure 8 with Figure 7, we could see that EL conform to the M-shaped distribution. We use the abbreviation M(b, c, λ) to refer to an M-shaped distribution with upper limit b, mode c, and reduction coefficient λ.
Length error distribution of one radial cable in 500 cases.
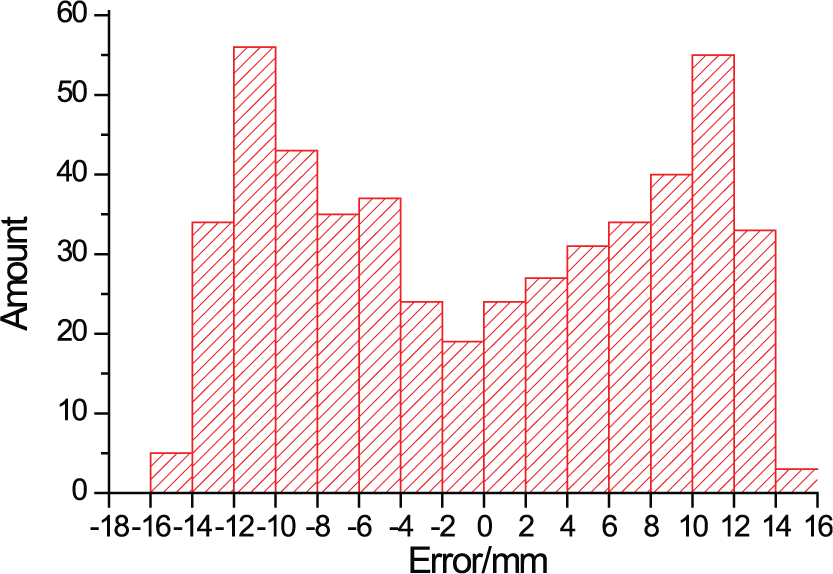
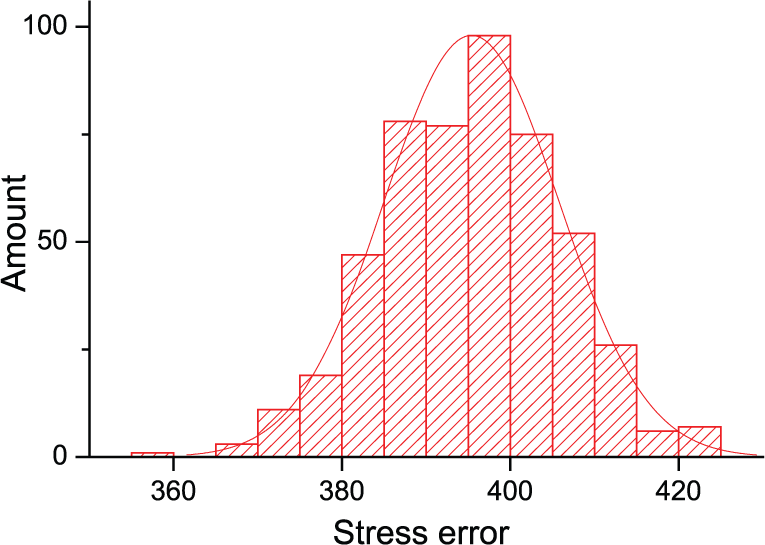
In one case of analysis, statistic results of all cable length errors are as follows: Min = −13.443 mm, Max = 14.087 mm, A = −0.489 mm, and S = 9.072 mm, as shown in Figure 9. Compared with Figure 7, the distributions are in a good agreement. In this case, we write EL = M(15, 12, 1/3)
Length error distribution of all radial cables in one case.
Project example
Project overview
Yueqing Stadium in Zhejiang Province of China is a wheel-spoke cable truss with crescent shape (Figure 10). It is about 229 m long from south to north and 211 m wide from east to west.

Three-dimensional graph and axis label of crescent nonclosed cable-truss structure.
As a typical bilayer cable structure, the cable truss is composed by upper chord cables, lower chord cables, suspension cables, ring cables, and struts. There are a total number of 38 cantilever cable trusses arranged radially. The ends of the trusses are connected by ring cables. The largest length of the cantilever part is 57 m, with the maximum elevation of +26.590 m and the edge length of about 440 m. The upper and lower chord cables between the 1st and 4th axes in the middle are intersected with each other, connected by suspension cables and compressive struts, as shown in Figure 11(a). Only suspension cables exist between upper and lower chord cables which are situated between the 5th and 16th axes at two sides, as shown in Figure 11(b). There is no connection in the cables between the 17th and 19th corner axes, as shown in Figure 11(c). (Note: The serial number 1–19 is from the middle to the sides. Two symmetrical trusses existed at every axis.)
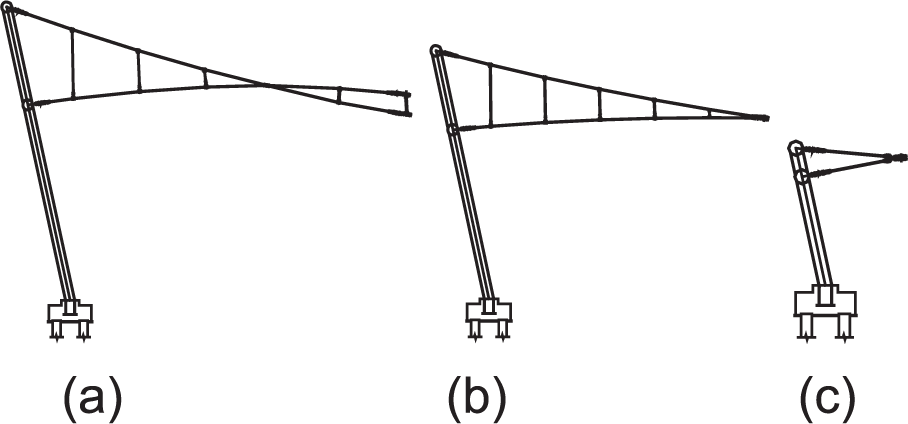
Section of cable–strut: (a) middle, (b) side, and (c) corner.
The roof’s substructure, covered by Polytetrafluo rethylene (PTFE membrane), is composed of two-hinged steel arch and tie cables for balancing horizontal pushing of the arch. The surrounding substructures include a cone mesh structure consisted of inclined columns (∅1300 × 40), as well as upper and lower ring steel beams (∅1500 × 50) filled with C50 concrete. The maximum elevation of inclined columns is+42.000 m. Cross cables are set between partial inclined columns.
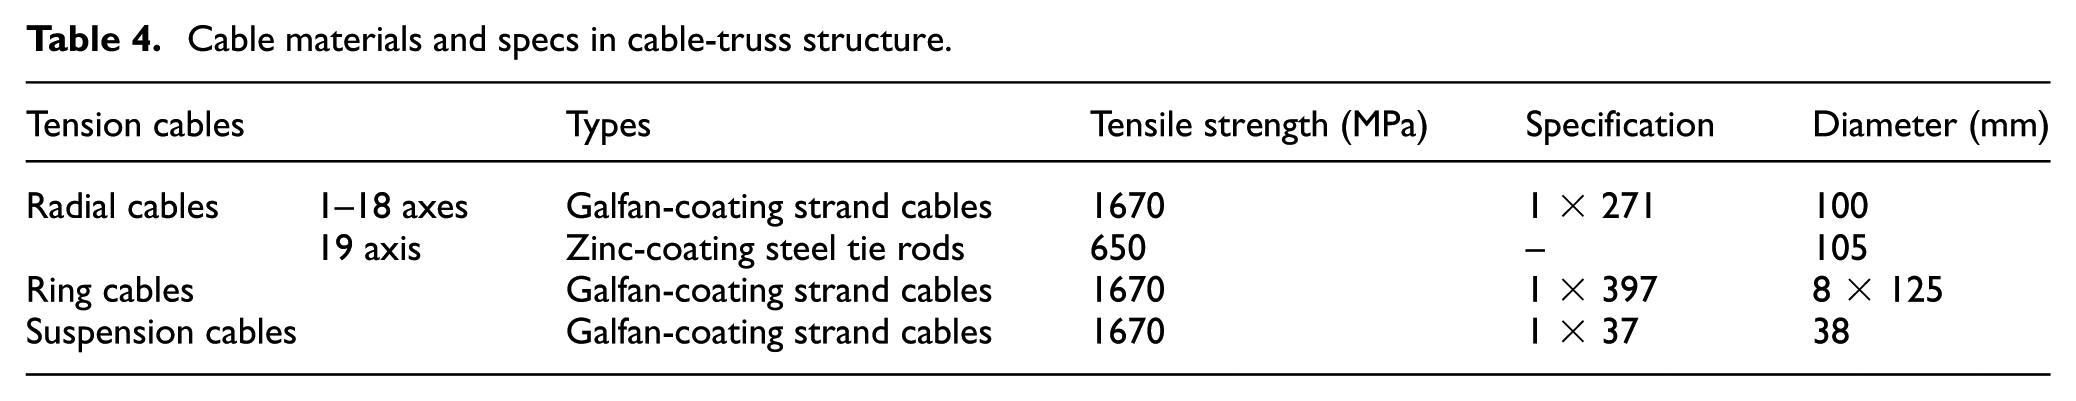
Cable materials and specs of the project are listed in Table 4. Compressive struts are ∅152 × 10 round pipes. Galfan-coating strand cables are produced by twisting high-strength steel wires of circular cross section, and surfaces of the cables are coated by 95% zinc–5% aluminum-mixed rare earth alloy (Galfan). Ring cables are consisted of eight ∅125 mm Galfan-coating strand cables. At 1st–4th axes in the middle, the total eight cables are evenly divided into upper and lower ring cables.
Cable materials and specs in cable-truss structure.
Construction method of Yueqing Stadium
Nonbracket integral lifting construction technology with fixed jacks on cable-truss includes assembling at a low altitude, tow-lifting at a moderate altitude, and tensioning to form at a high altitude (Ding et al., 2015). The key steps are that (1) the outer compressive ring is first installed in the designed position; (2) then the cable–strut system (including upper chord cables, lower chord cables, suspension cables, struts, and ring cables) is assembled near the ground for lifting; (3) when the lifting jacks are fixed to the temporary anchoring plate on the outer compressed ring, tow the fringe fork sockets of upper chord slantly with tooling cables until the cable–strut system is lifted to the position, and the upper chord cables and outer compressive ring are connected; and (4) finally, lower chord cables should be tensioned synchronously until the structure is in the formation state (Figure 12). In this process, lower chord cables are actively tensioned, and the others are passively tensioned.
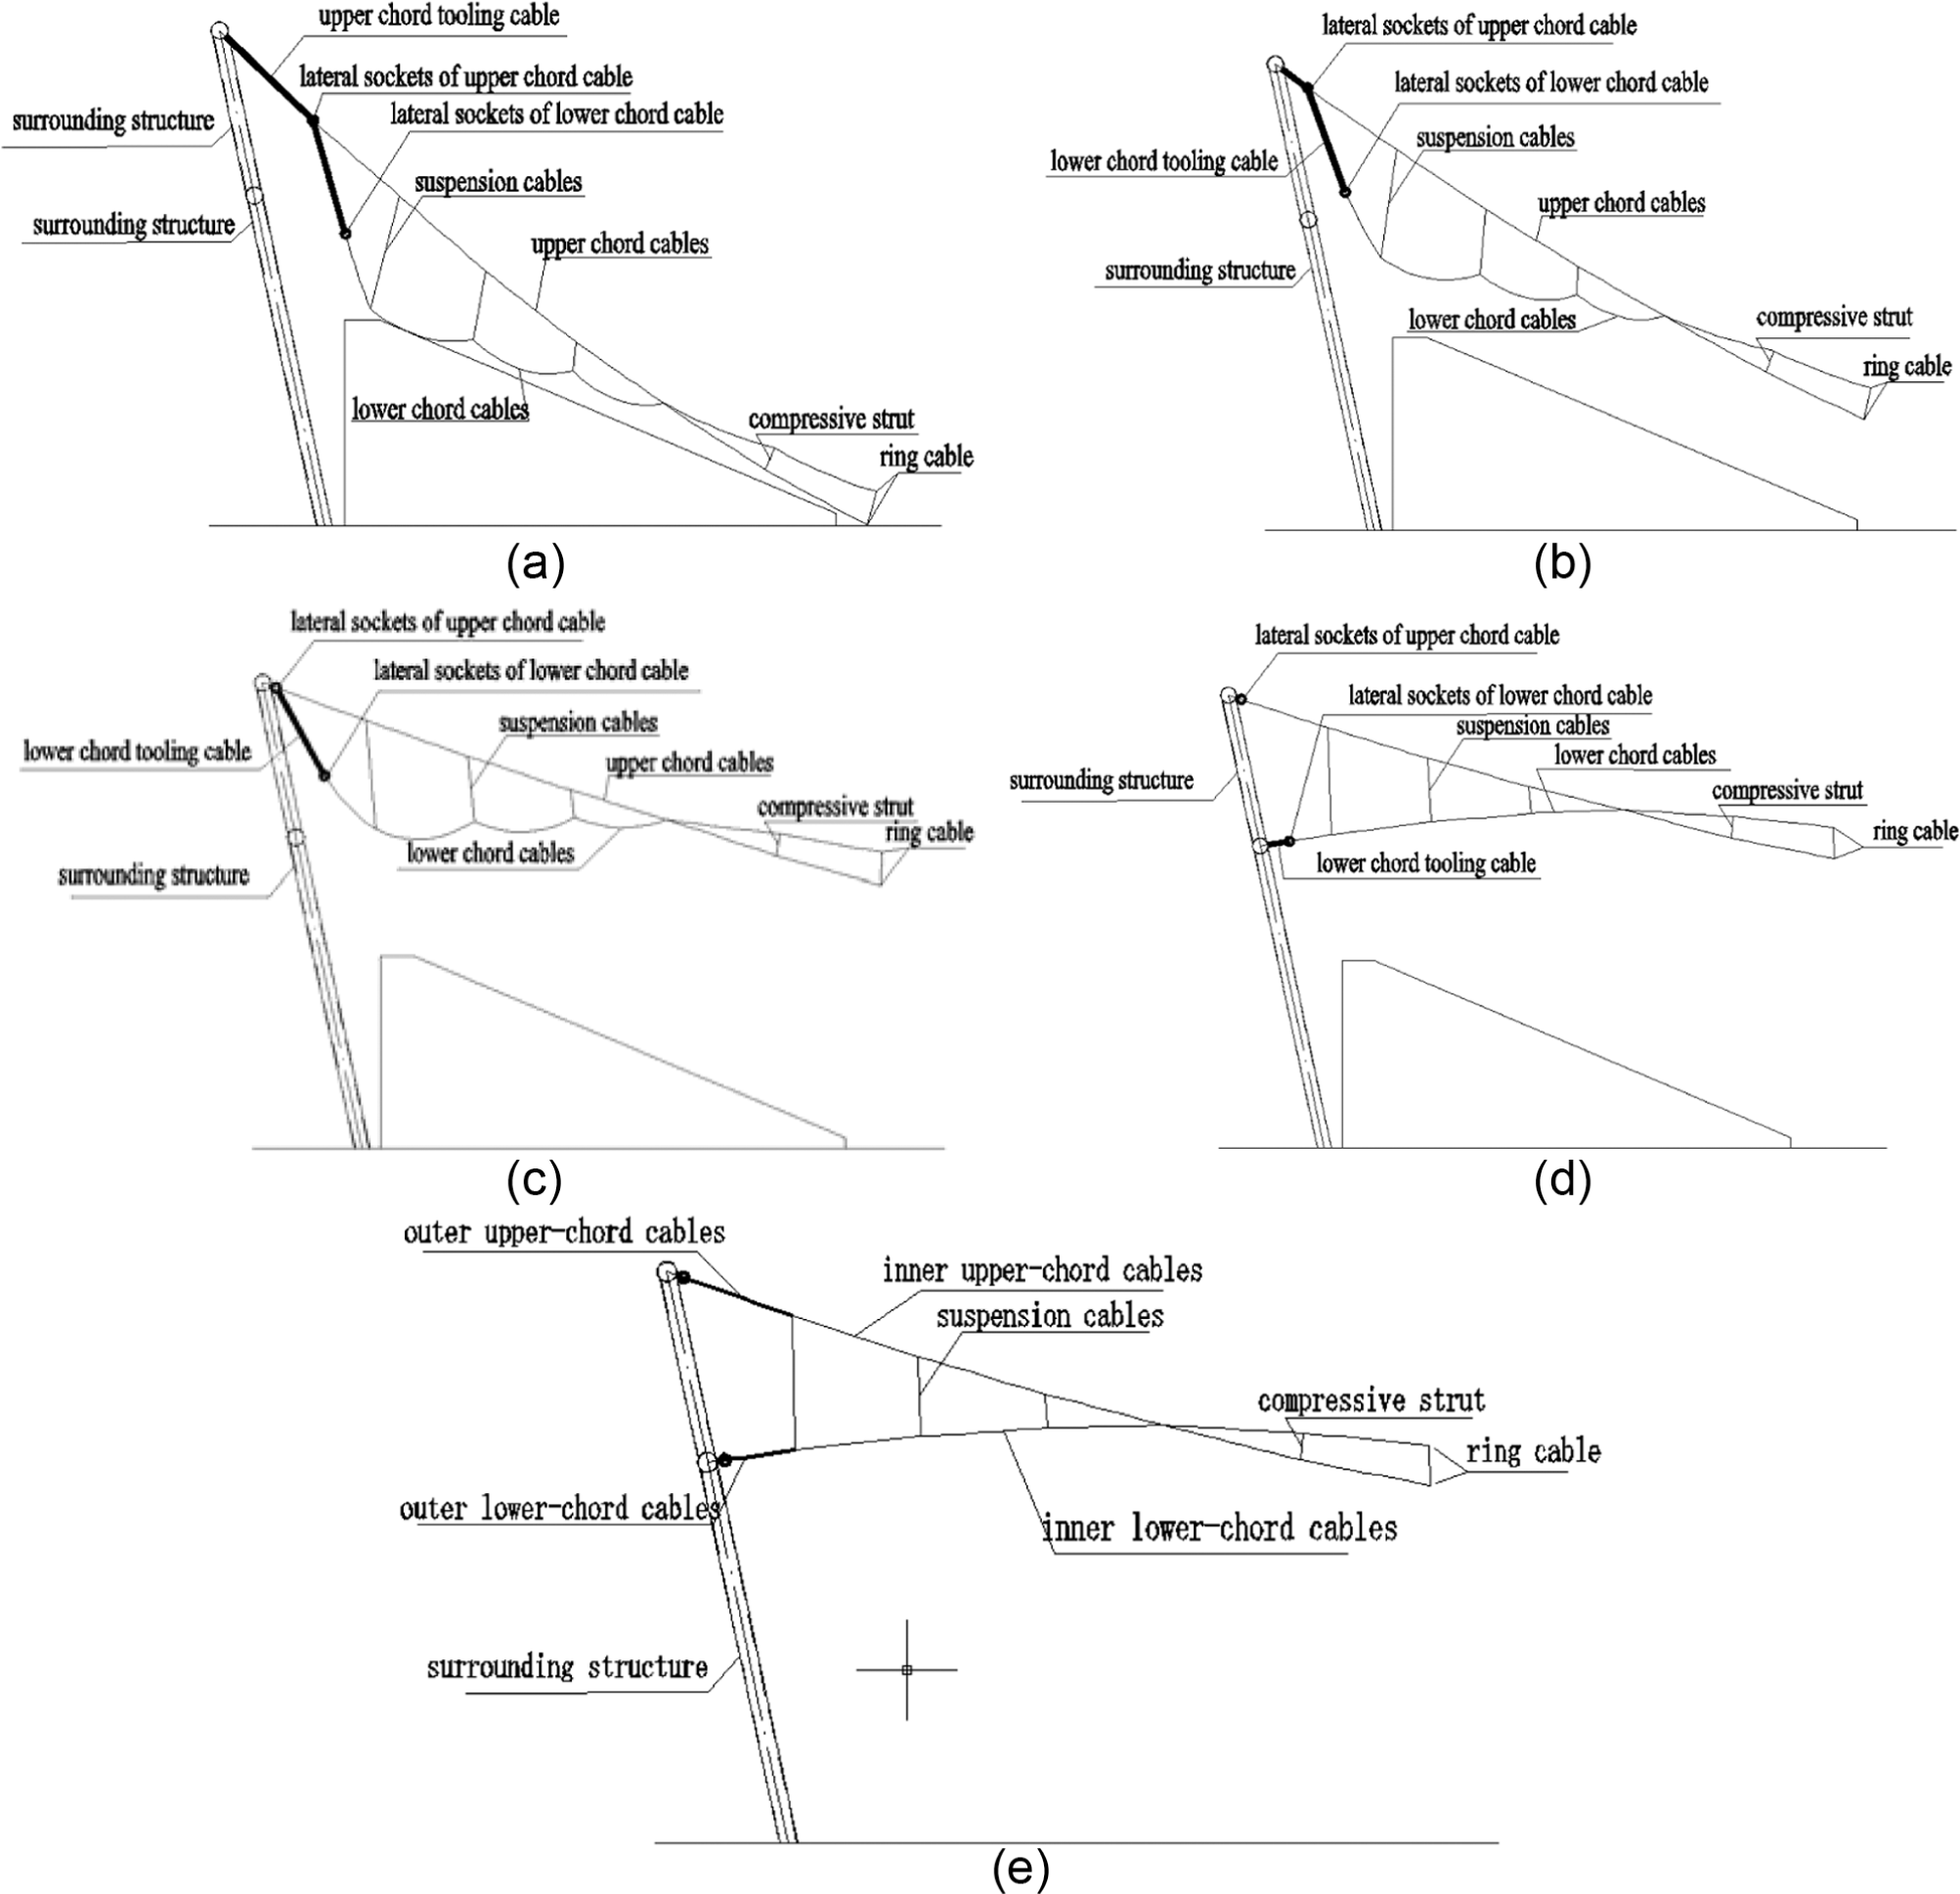
Construction process of cable truss: (a) assembling at a low altitude, (b) integral lifting of the whole structure, (c) upper chord cables anchored, (d) lower chord cables connected and preloaded, and (e) lower chord cables tensioned and the structure formed.
Error combinations and probability density functions of cable length and tension
The cables of the stadium include radial cables, ring cables and suspension cables. According to construction plan, outer lower chord cables, with a total number of 38, are active cables, while the others are passive cables. It is easy to adjust the lengths of ring cables because of their connection mode, and suspension cables have little influence on the mechanical properties of the structure. Therefore, in the multiple error analysis, EL of ring cables and suspension cables are not considered, so passive cables include outer upper chord cables, inner upper chord cables, and inner lower chord cables, with a total number of 54.
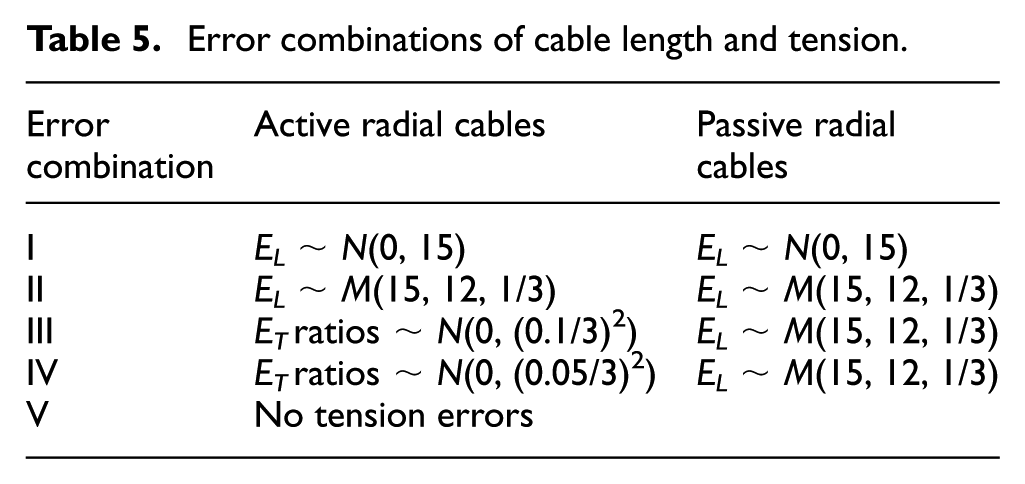
In this project, ET are assumed to be complied with normal distribution. And in order to compare the effects of normal distribution and M-shaped distribution, EL are assumed to follow normal distribution and M-shaped distribution, respectively. As a result, five error combinations are set in Table 5, and each combination contains 500 random error cases. In combination I, EL ∼ N(0, 15); in combinations II, III, IV, and V, EL ∼ M(15, 12, 1/3); in combination III, ratios of ET correspond to N(0, (0.1/3)2); and in combination IV, ratios of ET correspond to N(0, (0.05/3)2). The reduction coefficient of elastic modulus of active cables was set as η = 0.0001 in combinations III, IV, and V.
Error combinations of cable length and tension.
Statistics of cable stresses
EL and ET adopt different forms of distributions, and the stresses are calculated by finite element model (FEM) software ANSYS. Under the condition of combination III, EP ratio distribution of one passive cable is shown in Figure 13. It can be seen that Ep ratios generally comply with normal distribution. As a result, the maximum value of Ep ratios can be set as 3σ.
Stress-error distribution of one passive cable.
Ep ratio statistical results of radial cables and ring cables in each combination are listed in Table 6. The conclusion can be drawn that (1) in combinations I and II, Ep ratios are much larger than allowed value (10%), so measures are needed to adjust cable lengths; (2) Ep ratios resulting from EL of normal distribution are smaller than those of M-shaped distribution; (3) the radial cable length errors have little influence on ring cable stress; (4) in combination III, adjustments are set for active radial cables to limit the ET ratios within ±10%, and the Ep ratios of passive radial cables are within ±10%; and (5) comparing combination III to combination IV, with the improvement of the active tension force accuracy, Ep ratios of passive radial cables decline within the range of ±6%.
Ep ratios of radial cables and ring cables.

Figures 14 and 15 reflect the distribution of the absolute Ep ratios of radial cables at each axis. It can be seen that (1) although the maximum Ep ratio in combination I is large, the Ep of upper cables at the 1st–8th axes and lower chord cables at the 1st–5th axes are still within the range of ±10%; and (2) if the radial cables at the middle axes are longer, the Ep ratios would be significantly lower, so the EL limits of the radial cables at the middle axes can be less rigorous. Under the condition of only considering EL and ET, the error control criteria should be that ET ratio tolerance of active radial cables is ±10% and EL tolerance of passive radial cables is ±15 mm.
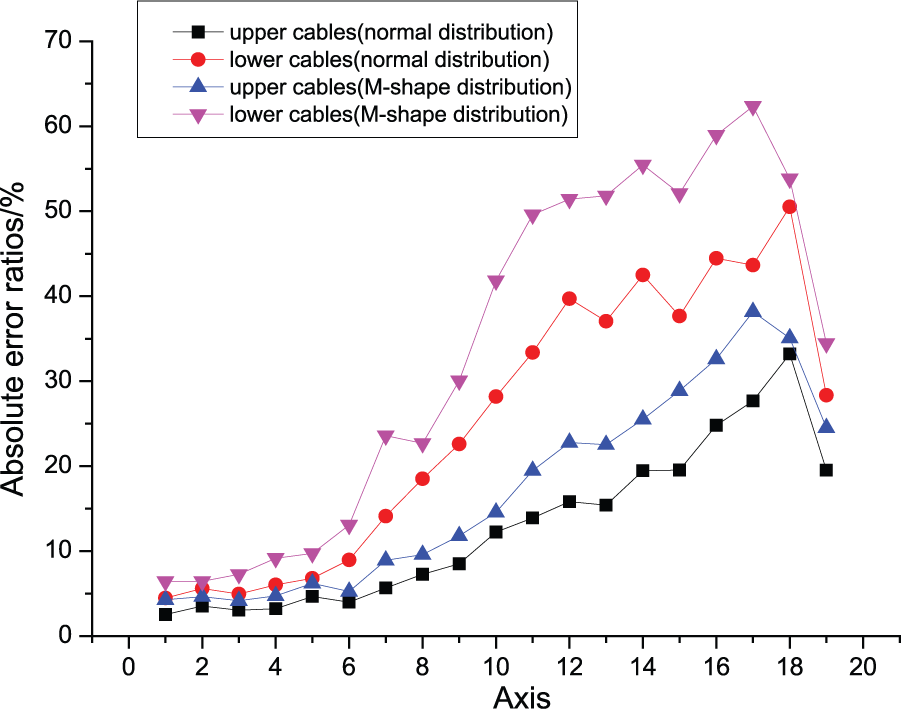
Absolute Ep ratio of upper and lower cables in error combinations I and II.

Absolute Ep ratio of upper chord cables in error combinations III, IV, and V.
Tolerance of EC along outer passive cables
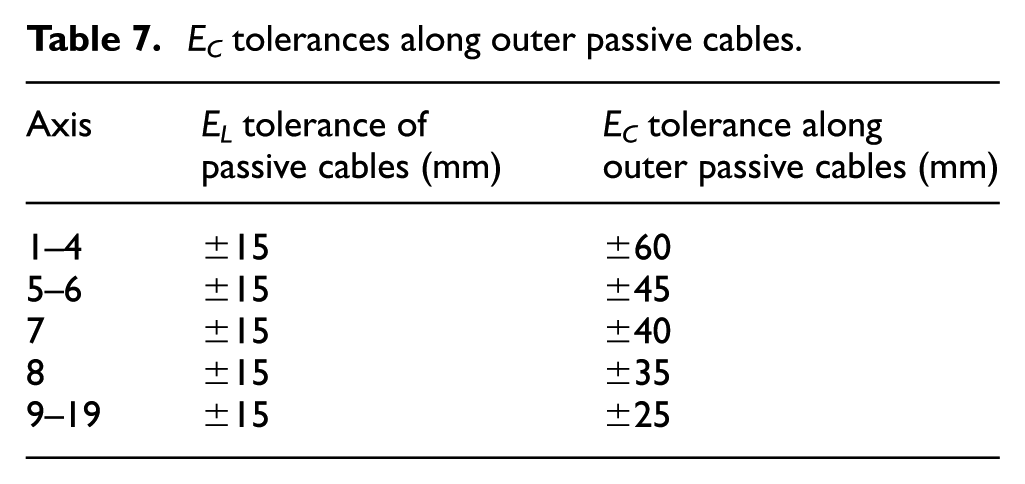
EC along the outer passive cables also have a significant influence on the structure, and it can be assumed that EC ∼ N(0, σ2) with an error tolerance of 3σ. Under the condition that the ET ratios of the active cables are within ±10% and the inner passive cable EL are within ±15 mm, the maximum EC of the outer passive cables increase gradually with the increment of 5 mm at each axis until the Ep ratios of all radial cables reached the tolerance of ±10%. As shown in Table 7, from long cables at the middle axes to short cables at the lateral axes, the EC tolerances declined gradually from ±60 to ±25 mm, which means the demand for improvement of the installation accuracy of the outer linked nodes.
EC tolerances along outer passive cables.
Adjustments and EC tolerances of active cables
During tensioning process, the tension force was the key controlling object for active lower chord cables. Therefore, enough adjustments might be needed to ensure accurate tension forces under the influence of other errors. Under the condition of EL and EC of passive cables and no ET of active cables, the multiple error analysis adopts the small elastic modulus method and records the active cable length variations in each case. Set three times of standard deviation (3σ) as the largest cable length variation of active cables (


In above formulas,
As mentioned earlier, it is assumed that EL of the passive cable are complied with the M-shaped distribution, and the factors are set as follows: b = 15 mm, c = 12 mm, and λ = 1/3. EC of the passive cables are complied to normal distribution with expectation E of 0 and maximum absolute value of 3σ following the tolerance in Table 7, and there are no tension force error ET in active cables. A total of 500 error cases are built randomly. Through multiple random-error analysis, the largest cable length variation of active cables
Maximum length variations and EC tolerances of active cables.

Conclusion
Multiple random-error effect analysis method of CSTSs including EL, EC, and ET is proposed. The key measures include (1) EC are regarded as additional EL of outer cables, namely,
The statistics of measured EL do not comply with normal distribution. Therefore, the M-shaped probability distribution is proposed, and derivations of probability density function, cumulative distribution function, and its inverse function are carried out, by which random cable length error distribution is comparatively consistent with measured errors. Compared with normal distribution, the M-shaped distribution has more large error samples, which makes a more unfavorable influence on cable stresses.
Taking cable truss of Yueqing Stadium as an example, multiple error analysis including EL based on the M-shaped probability distribution and EC and ET based on normal distribution is carried out, and some useful conclusions and construction control indexes are obtained. Ep ratios resulting from EL of the M-shaped distribution have similar characters with those of normal distribution but larger values. As a result, it tends to be safe and reasonable to employ the M-shaped distribution. EP decrease with the decrease in ET, EC, and EL. Compared with long cables, the forces of short cables are more sensitive to the errors.
For those complicated CSTSs, reasonable probability distribution models should be applied to carry out multiple random-error effect analysis and determine error control indexes, including cable length errors, nodal coordinate errors of outer substructure, and active tensile force errors and adjustments of cable heads.
Footnotes
Declaration of Conflicting Interests
The author(s) declared no potential conflicts of interest with respect to the research, authorship, and/or publication of this article.
Funding
The author(s) disclosed receipt of the following financial support for the research, authorship, and/or publication of this article: This article is a project supported by the Twelfth Five Year National Science and Technology Support Program under grant from the China Academy of Building Research (no. 2012BAJ03B06), the National Natural Science Foundation of China (no. 51308105), a Project Funded by the Priority Academic Program Development of Jiangsu Higher Education Institutions (PAPD), and the Fundamental Research Funds for the Southeast University (nos KYLX_0152, SJLX_0084, and KYLX_0149).