



Abstract
The hangers of long-span suspension bridges are significantly prone to wind-induced vibrations due to their light mass, low frequency, and small structural damping. However, the underlying mechanism of the hanger vibration is not clearly clarified yet. To study the aerodynamic interference between the cables of the hanger, which is a possible mechanism for the hanger vibration, a series of wind tunnel tests were carried out to measure the mean aerodynamic drag and lift coefficients of a leeward cylinder. Then, the motion equations governing the vibration of leeward cable were derived based on the quasi-steady assumption. The numerical results show that large-amplitude vibrations of the leeward cable will occur in the region of 1 ≤ |Y| ≤ 3, where Y is a non-dimensional vertical coordinate normalized with the diameter of the cylinder. It appears that the stable trajectory of the leeward cable is ellipse, and trajectory is clockwise above the center line of the wake, whereas anti-clockwise below the center line of the wake. An important finding is that the frequency of the stable vibration of the leeward cable is slightly smaller than its natural frequency, which implies that a negative aerodynamic stiffness might arise. The time histories of the aerodynamic stiffness and damping forces on the leeward cable were identified from the numerical results. It seems that there is always a positive work done within a period by the aerodynamic stiffness force, whereas a negative work by the aerodynamic damping force. The response characteristics of the leeward cable of the hanger of suspension bridge obtained in this study are identical with those of the wake-induced flutter widely discussed for the power transmission line. This implies that wake-induced flutter theory could well illustrate the underlying mechanism of the aerodynamic interference effects on the hangers of a suspension bridge.
Keywords
Introduction
The long-span suspension bridge hanger that generally consists of several (e.g. 2, 4, or 6) cables is prone to wind-induced vibrations due to its light mass, low frequency, and small structural damping. Large-amplitude vibrations of the hangers were observed on several suspension bridges all over the world, for example, the Akashi Kaikyo Bridge in Japan (Fujino et al., 2012), the Great Belt East Bridge in Denmark (Laursen et al., 2005), and the Xihoumen Bridge in China (Chen et al., 2016). The effective countermeasures to mitigate the vibrations of the hangers are completely different for the abovementioned three bridges. This indicates that the hanger vibration for various bridges may present diverse mechanism. Laursen et al. (2005) speculated that the ice accretions might lead to the vibration of the hanger based on a field observation on the Great Belt East Bridge. Actually, this type of vibration has been confirmed for the stay cable of cable-stayed bridges (Demartino and Ricciardelli, 2015; Li et al., 2016). Zhang et al. (2016) proposed that the vibration of the main cable could result in large-amplitude vibration of the hangers near the pylon based on a numerical analysis for the Xihoumen Bridge. Chen et al. (2018) found that the wake of the pylon could lead to large-amplitude vibration of the hangers. One of the authors observed that three out of four cables of the hanger on the Xihoumen Bridge oscillated violently at the wind speed of 8–10 m/s, whereas there was no vibration for the rest cable that was located at the upwind. This indicates that the aerodynamic interference between the cables of the hanger might play an important role for the hanger vibration (Alhadidi et al., 2016; Park et al., 2013; Silva-Ortega and Assi, 2017; Tamimi et al., 2017).
The effects of aerodynamic interference were often observed on the power transmission lines (Liberman, 1974; Rissone et al., 1968). For power transmission lines, the reduced wind velocity (U/fD; where U is the wind velocity, f is the natural frequency, and D is the diameter) easily reaches over 10, where the quasi-steady theory could be reasonably used to determine the wind forces (Blevins, 1977; Fung, 1955). Hence, a large number of wind tunnel tests were carried out to measure the mean lift and drag coefficients for the leeward transmission lines (Cooper, 1974; Ko, 1973; Price, 1975; Wardlaw et al., 1975). Using the quasi-steady assumption, Simpson (1971b) established a theoretical model for the aerodynamic interference between the power transmission lines to qualitatively estimate the instability condition for the leeward transmission lines, which agreed well with the results obtained from wind tunnel tests (Price, 1975). Furthermore, some researchers established theoretical models to numerically study the amplitude of aerodynamic interference between the power transmission lines by considering the nonlinear components of aerodynamic forces on the leeward transmission line (Allnutt et al., 1980; Oliveira and Mansour, 1983; Simpson, 1971a). Hardy and Van Dyke (1995) built a test line consisting of five spans with a total length of 1.5 km in Canada to study the responses of aerodynamic interference between the power transmission lines.
Païdoussis and Price (1988) proposed two kinds of mechanisms to explain the wake-induced vibration of the leeward cylinder. One is the damping-controlled mechanism, which is similar to the mechanism of classic galloping, and the other is the stiffness-controlled mechanism, which is named as wake-induced flutter. It should be noted that some researchers used the terminology “wake-induced galloping” to describe the latter mechanism (Simiu and Scanlan, 1996). Price and Piperni (1988) found that the critical wind velocity of the aerodynamic interference could not be effectively reduced by increasing the structural damping based on the numerical simulations. Several experimental results also proved that increasing structural damping has little effects on mitigating the wake-induced vibration of the power transmission lines (Claren et al., 1974; Hardy and Bourdon, 1979; Païdoussis et al., 2011). This implies that wake-induced flutter, characterized by the negative aerodynamic stiffness, may be the right mechanism for the wake-induced vibration of the power transmission line. There are obvious structural differences between the hanger of suspension bridge and the power transmission line. More specifically, the diameter, the mass per unit length, and the natural frequency of the cable of the suspension bridge hanger are generally larger than those of the transmission line, whereas the relative distance between the cable (about 3D∼ 10D) is slightly smaller than that of the power transmission line (about 10D∼ 20D). Actually, aerodynamic interference effects were also observed on offshore risers (Overvik et al., 1983; Sagatun et al., 2002) and heat exchanger arrays (Païdoussis et al., 1988). However, the size of offshore risers is far larger than that of the cables of the hanger, and the viscosity coefficient of the water is much larger than that of the air. As for the heat exchanger arrays, their relative distance is much smaller than that of the cables of the hanger.
In this study, a series of wind tunnel tests were carried out to obtain the spatial distribution of the mean aerodynamic lift ant drag coefficients of the leeward cable. Then, a theoretical model considering the aerodynamic interference effects on the cables of the hanger was established using the quasi-steady assumption with the aerodynamic force coefficients obtained from the tests. The Runge–Kutta method was adopted to numerically solve the motion equations of the leeward cable to obtain its response, from which the mechanism of the aerodynamic interference between the cables of the hanger was comprehensively investigated.
Outline of wind tunnel test setup
Wind tunnel tests were carried out in the high-speed closed-circuit test section of HD-2 Boundary Layer Wind Tunnel (HD-2BLWT) in Hunan University. This test section has a size of 3.0 m in width by 2.5 m in height by 17.0 m in length with a maximum wind velocity of 58 m/s. HD-2BLWT is a hybrid wind tunnel with two closed-circuit test sections and one open-circuit test section. The other closed-circuit test section is 5.5 m in width by 4.4 m in height by 15.0 m in length with a maximum wind velocity of 15 m/s, and the open-circuit test section is 8.5 m in width by 2.0 m in height by 15.0 m in length with a maximum wind velocity of 18 m/s. Two force balances incorporated in a force vibration system, which is originally developed to identify aerodynamic derivatives of bridge decks, were utilized to measure the aerodynamic forces on the cable of the hanger. A pitot tube and an electric pressure scanner system produced by PSI Corporation in USA were used to measure the wind velocity in the test section.
Two smooth cylinders, which are made of polyvinyl chloride (PVC) tubes, are used to simulate the two-cable hanger of suspension bridge. The length and diameter of the test model are, respectively, 1.33 and 0.088 m. Two steel bars are installed at the ends of the cylinder, by which the test models could be connected with the two force balances on the force vibration system. The test model is shown in Figure 1. In order to conveniently change the relative position of the two cylinders during wind tunnel tests, a 2-degree-of-freedom (DOF) shifting frame is specially designed and manufactured, as shown in Figure 2. This shifting frame could move in the horizontal and vertical directions with a high precision of 10−2 mm. A fairing device was installed around the force vibration system to make sure a uniform flow near the test models. The test system installed in wind tunnel is shown in Figure 3.

Photo of the test model.
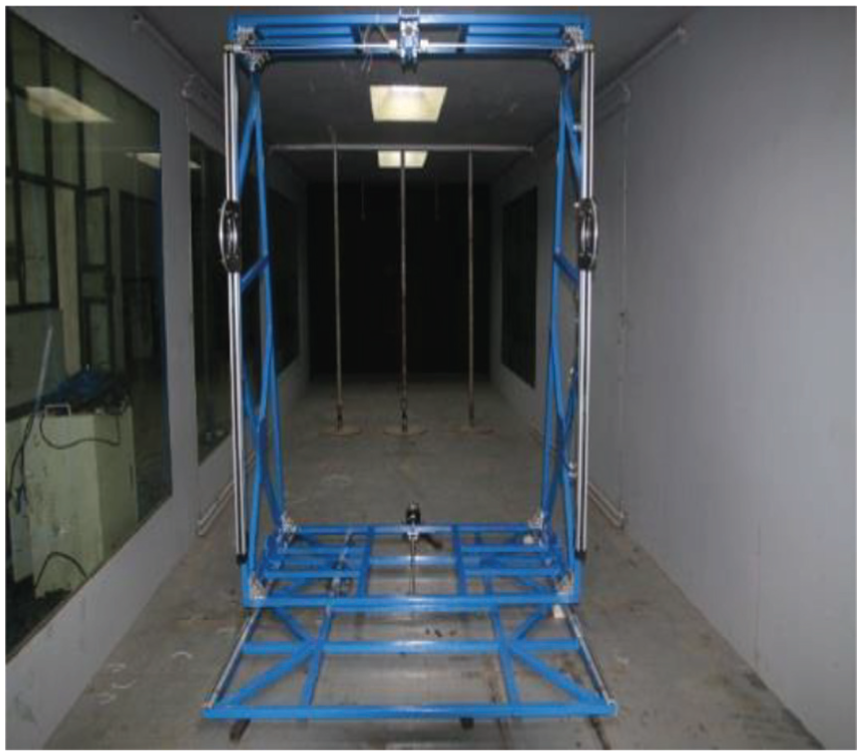
Photo of the 2-degree-of-freedom shifting frame.
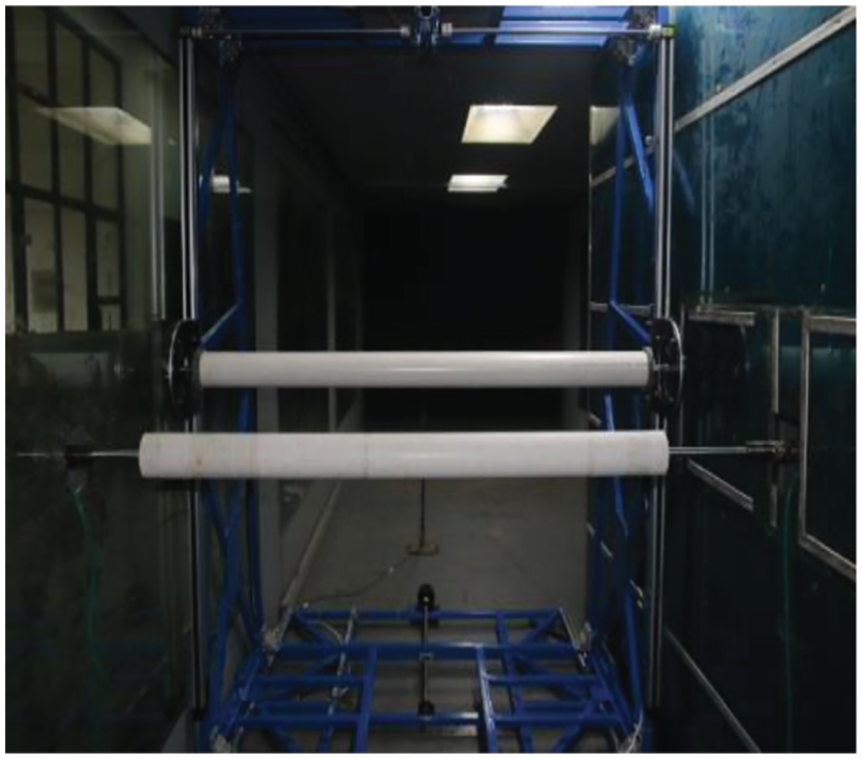
Photo of test model installed in wind tunnel.
The relative position of the two cylinders, together with the wind direction, is described in Figure 4. A coordinate system oxy is defined with the origin at the center of the windward cylinder and the x axis parallel to the wind direction. Assuming that the leeward cylinder locates at (x, y), two non-dimensional parameters, X and Y, can be defined as
where D is the diameter of the cylinder.
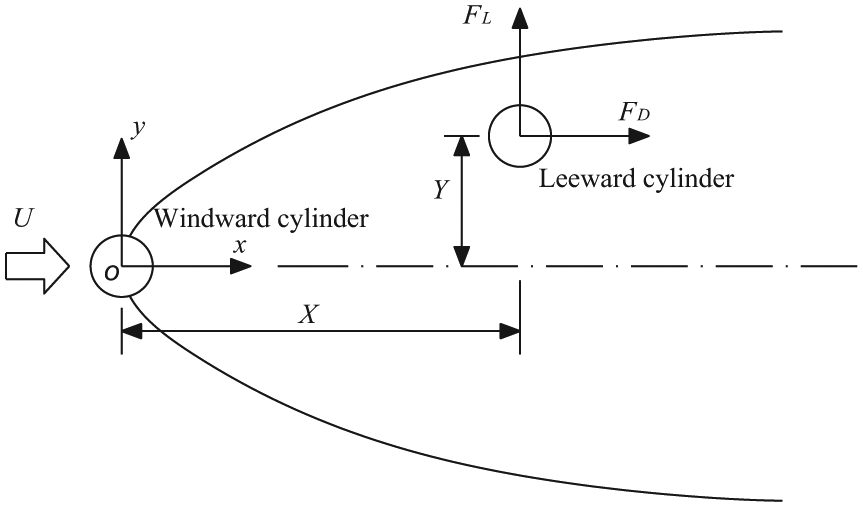
Relative position of the two cylinders.
In the wind tunnel tests, the leeward cylinder was fixed on the force vibration system and the windward cylinder was fixed on the shifting frame. The relative position between the two cylinders was adjusted by the shifting frame. According to the structural parameters of the hangers of suspension bridges, the range of X was chosen to be [1, 11] with a uniform interval of ΔX = 0.25 and Y to be [–4, 4] with an identical uniform interval of ΔY = 0.25. There are a total of 1353 points where the drag and lift forces, FD and FL, as shown in Figure 4, on the leeward cylinder are measured.
Wind velocity might have significant effects on the aerodynamic interference between the cables of the suspension bridge hanger. Large-amplitude vibrations of the hangers on the Xihoumen Bridge have been observed when the wind velocity is approximately 10 m/s. It is not the purpose of this study to investigate the effects of wind velocity. Therefore, wind tunnel tests were carried out in a uniform flow with a velocity of 10 m/s, which corresponds to a Reynolds number of 6.14 × 10⁴.
Experimental results
The mean drag and lift coefficients of the leeward cylinder, CD and CL, can be obtained from
where FD and FL are the drag and lift forces of the leeward cylinder, respectively, which are measured in the wind tunnel tests; ρ is the density of the air; and U is the approaching wind velocity. Since the wind velocity in the wake of the windward cylinder is not easy to identify, the wind velocity upstream the windward cylinder U = 10 m/s is adopted here as the approaching wind velocity for the leeward cylinder.
Figure 5 presents the variation of the mean drag coefficient of the leeward cylinder CD with respect to Y for the cross sections of X = 1, 1.5, 1.75, 2, 2.5, 3, 5, 7, 9, and 11. It could be found from Figure 5 that the mean drag coefficient of the leeward cylinder is symmetrical about the center line of the wake, and its minimum value appears at the center line. Within the region of 1 ≤X≤ 1.75, the values of the mean drag coefficient of the leeward cylinder at the center line are negative (CD = −0.25 for X = 1, Y = 0), which presents a suction wind force. This is due to the small clear distance between the windward and leeward cylinders. With the increase in the distance between the two cylinders, the mean drag coefficient at the center line increases, and it tends to be a constant, approximately 0.65, for 8 ≤X≤ 11. For the across-wind direction, the mean drag coefficient increases with the increase in the distance from the center line, and it changes significantly within −2 ≤Y≤ 2. It should be noted that the mean drag coefficient of the leeward cylinder is around 1.2 when Y = 4 and Y = −4, which is identical with the value of a single cylinder. This implies that is the location of Y = 4 and Y = −4 are out of the wake of the windward cylinder.
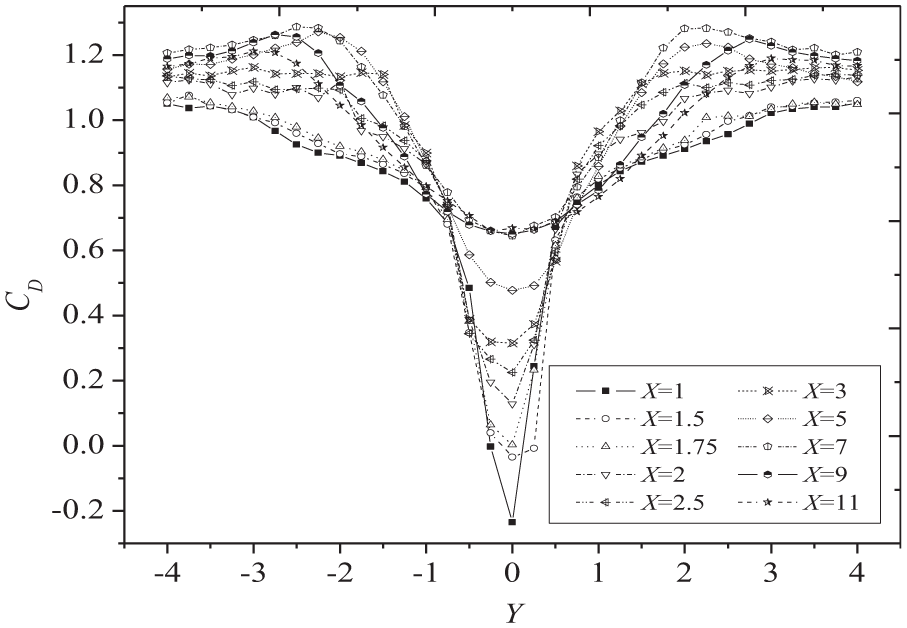
Mean drag coefficient of the leeward cylinder.
Figure 6 shows the variation of the mean lift coefficient of the leeward cylinder CL with respect to Y for the cross sections of X = 1, 1.5, 1.75, 2, 2.5, 3, 5, 7, 9, and 11. It could be found from Figure 6 that the mean lift coefficient CL of the leeward cylinder is asymmetrical about the center line of the wake, which is contrary to the mean drag coefficient, and its value at the center line is about zero. In the cross-wind direction, the mean lift coefficient of the leeward cylinder has its maximum value, up to 0.8 for 1.5 ≤X≤ 3, at approximately Y =−0.75. In general, the mean lift coefficient of the leeward cylinder changes sharply within the region of −2 ≤Y≤ 2 and tends to be zero within the region of −4 ≤Y≤−2 and 2 ≤Y≤ 4.
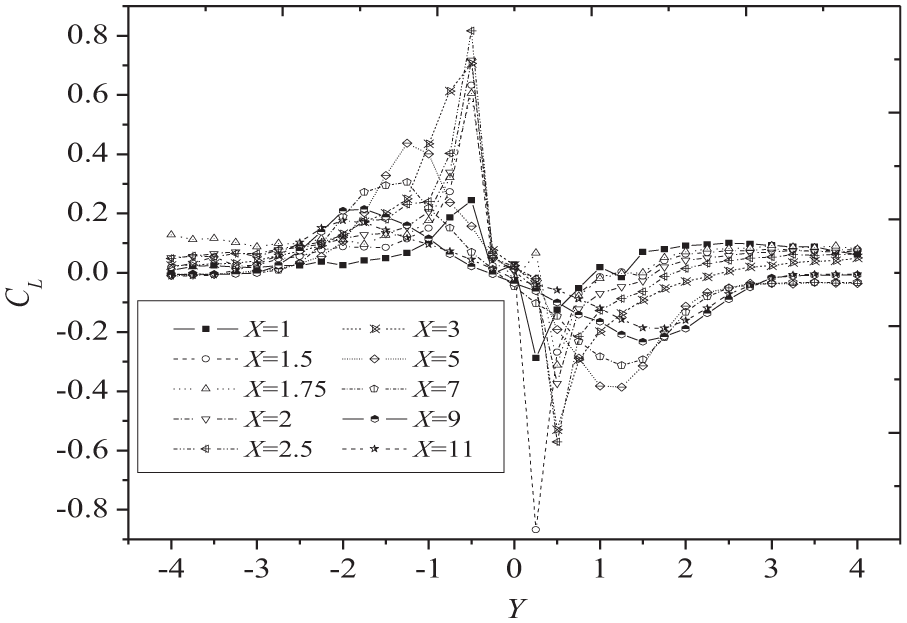
Mean lift coefficient of the leeward cylinder.
Figure 7(a) and (b) presents the three-dimensional (3D) spatial distribution of the mean drag and lift coefficients of the leeward cylinder, respectively. It could be found from Figure 7 that the 3D spatial distribution of the aerodynamic force coefficients of the leeward cylinder demonstrates good smoothness. With the increase in the X, the wake width of the windward cylinder increases and the change of aerodynamic force coefficient decreases.
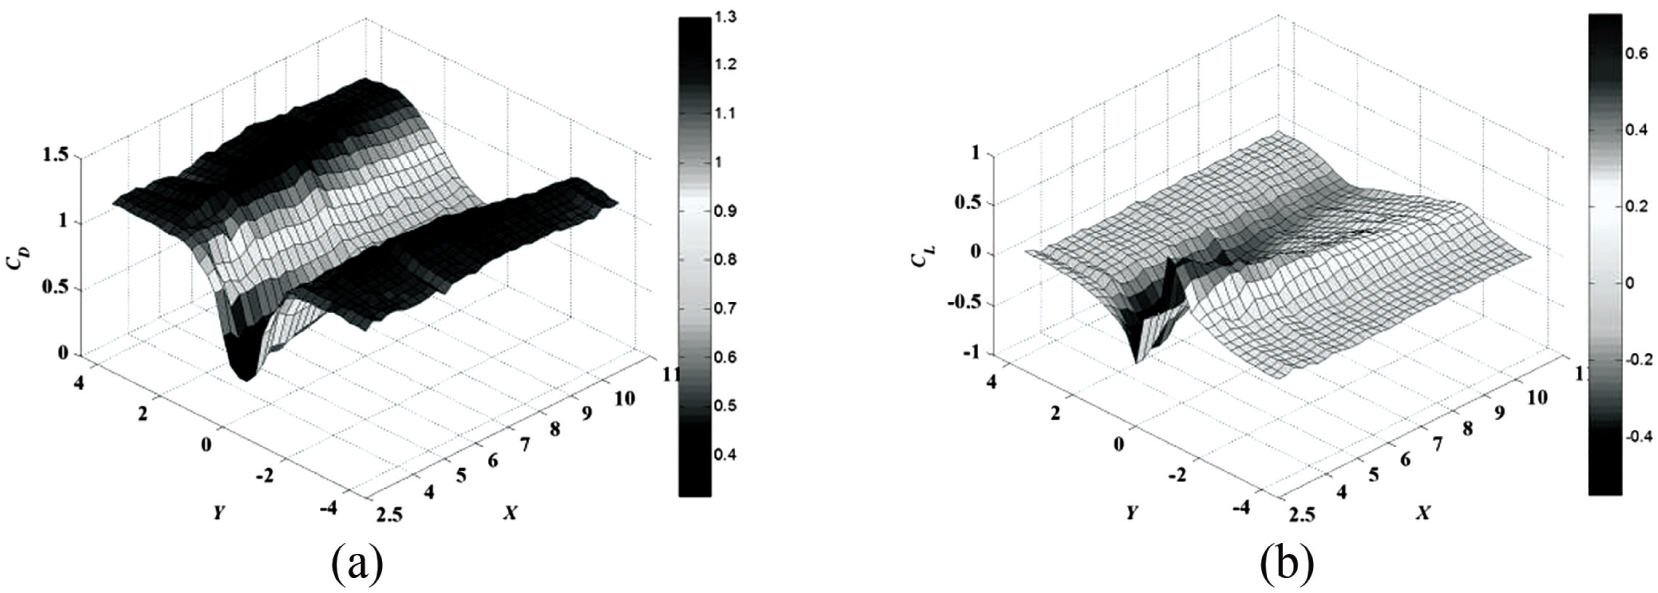
Spatial distribution of the mean drag and lift coefficients of the leeward cylinder: (a) mean lift coefficient and (b) mean drag coefficient.
Motion equations governing the leeward cable
To simplify the over complicated problem, the windward and leeward cables of the hanger of suspension bridge are considered as two isolated oscillators. The windward cable remains still, while the leeward cable has two DOFs, respectively, in the along-wind and cross-wind directions, as indicated in Figure 8. A coordinate system is established with the origin at the center of the windward cable, and the x and y axes are parallel to the along-wind and cross-wind directions, respectively, similar to the coordinate system defined in Figure 4. The initial equilibrium position of the center of the leeward cable is defined by X and Y, as shown in Figure 4. The displacement of the leeward cable deviated from the initial equilibrium position is defined by u(t) and v(t), corresponding to the along-wind and cross-wind directions, respectively.
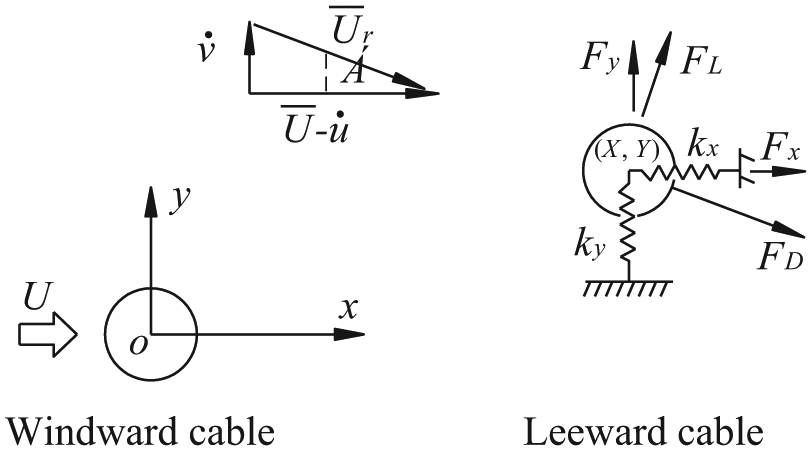
The 2-degree-of-freedom theoretical model for the leeward cylinder.
Due to the vibration of the leeward cable, the relative wind attack angle between the wind flow and the leeward cable, α, can be expressed as
where
Quasi-steady theory is utilized to determine the wind forces on the leeward cable based on the experimental data given in section “Experimental results.” Wind forces acting on the leeward cable in the along-wind and cross-wind directions, Fx and Fy, could be given by
where
Note that
Defining a parameter, b, as
Substituting equation (12) into equation (10), one has
By utilizing equations (5) to (13), the aerodynamic forces on the leeward cable could be rewritten as
It could be found from equations (14) and (15) that the aerodynamic forces on the leeward cable are related to its oscillation velocity, which is similar to classic galloping vibrations and may result in negative aerodynamic damping. Furthermore, the aerodynamic forces on the leeward cable are also related to its instantaneous space position since the parameters CD, CL, and b are the functions of x and y. This might lead to negative aerodynamic stiffness, which will be discussed in section “Aerodynamic interference responses” and “Mechanism discussion.”
Forces acting on the leeward cable include the restoring force, damping force, inertial force, and wind force. The motion equations governing the leeward cable in 2 DOFs could be expressed as
The Runge–Kutta method is adopted to numerically solve equations (16) and (17), and the responses of the leeward cable could be obtained.
Aerodynamic interference responses
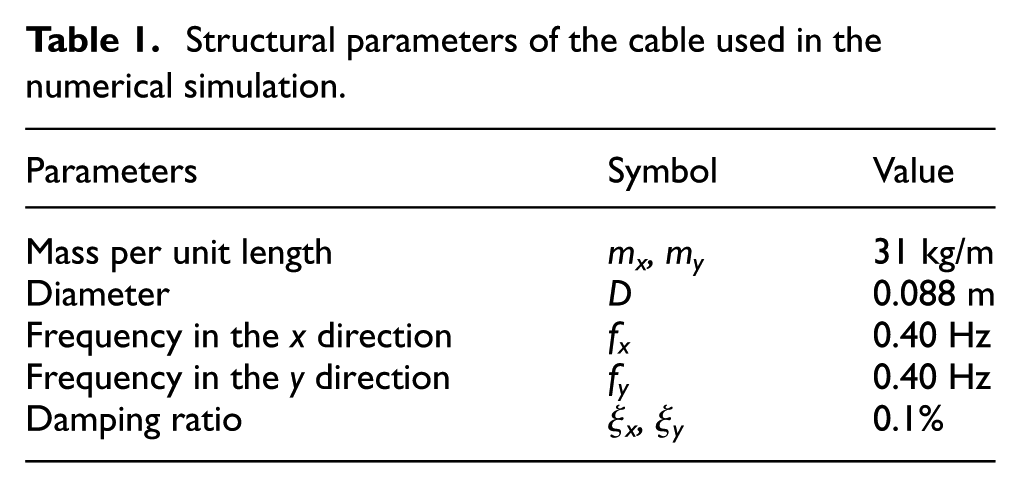
The structural parameters of a hanger on the Xihoumen Bridge near the tower, as shown in Table 1, are used in the numerical simulations. The mass per unit length is mx = my = 31 kg/m; the diameter of the cable is D = 0.088 m; the first natural frequencies in the x and y directions are fx = fy = 0.40 Hz; and the structural damping ratio is ξx = ξy = 0.1%. The air density is ρ = 1.225 kg/m3 and the wind velocity is U = 10 m/s.
Structural parameters of the cable used in the numerical simulation.
The leeward cable is considered to remain still at the initial time, that is,
Figure 9 presents the space distribution of the one-side vibration amplitude of the leeward cable obtained from numerical simulations, including the along-wind, cross-wind, and resultant amplitudes. It could be found from Figure 9 that the maximum one-side resultant amplitude of the leeward cable is about 0.1 m. The maximum amplitude values in the along-wind and cross-wind directions are not at the same space position, which indicates that the shape of the stable limit cycle of the leeward cable changes with different initial equilibrium positions. It seems that large-amplitude vibrations of the leeward cable take place in the region of 1 ≤ |Y| ≤ 3, and no large-amplitude vibrations are found when the leeward cable locates near the center line of the wake (|Y| = 0).
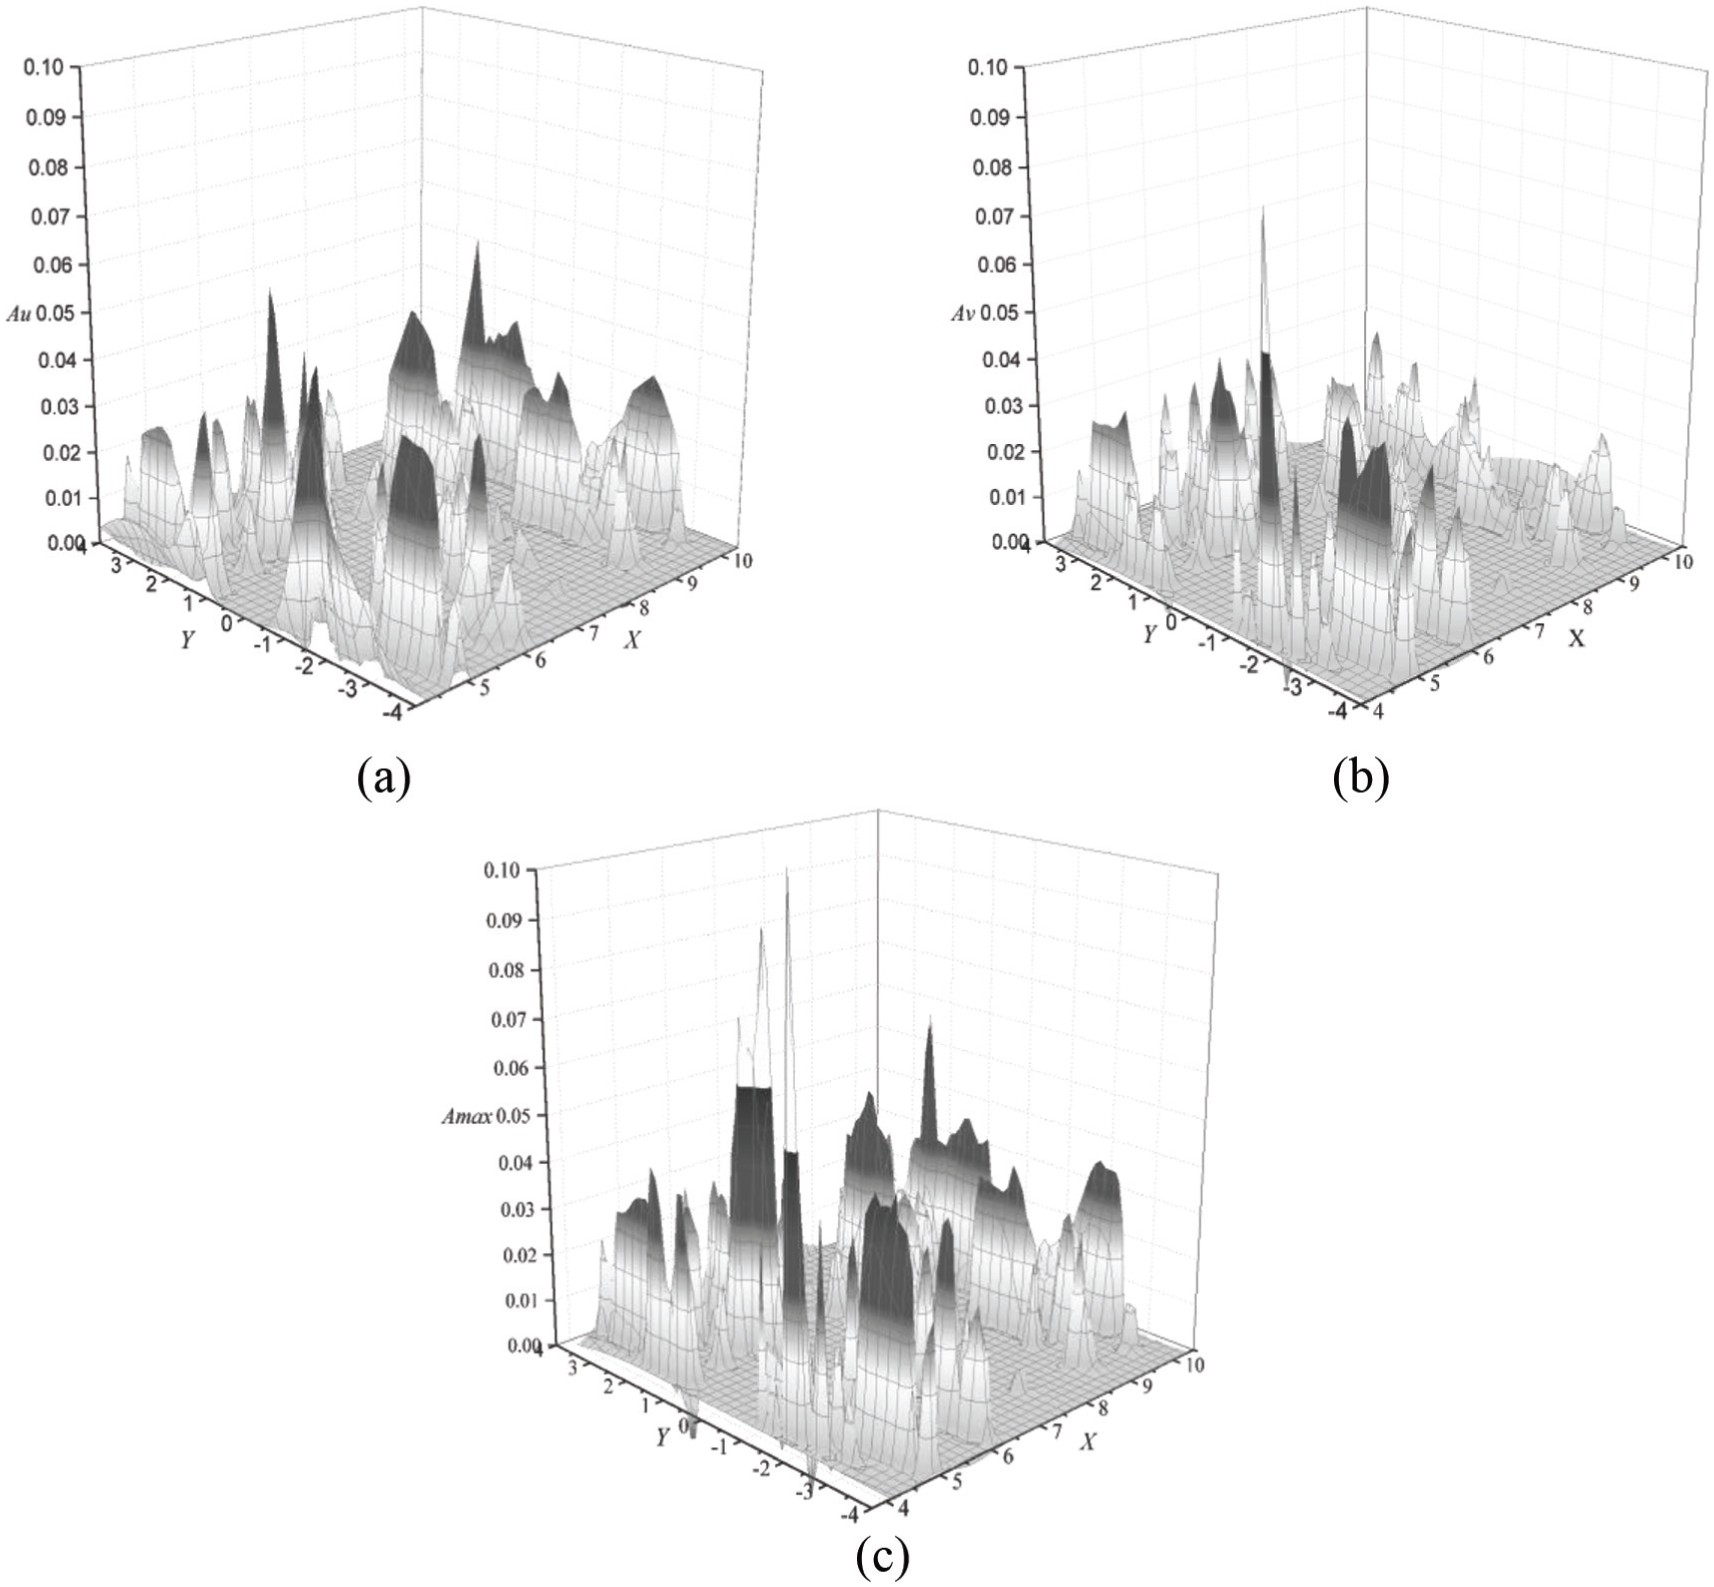
Space distribution of the vibration amplitude of the leeward cable: (a) along-wind amplitude Au, (b) cross-wind amplitude Av, and (c) resultant amplitude Amax.
For the sake of brevity, the results at six initial equilibrium positions, that is, X = 5.5, Y = 1.2, 1.3, 1.5, 1.7, 1.9, and 2.0, are selected as the typical cases to investigate the response characteristics of the leeward cable. Figure 10 gives the time histories of the along-wind and cross-wind displacements of the leeward cable. It could be found from Figure 10 that there is a positive mean displacement in the along-wind direction and a negative mean displacement in the cross-wind direction, which is due to the mean aerodynamic forces in the x and y directions. The six typical positions are located at the upside of the center line of the wake. It is noted that the mean displacements in the along-wind and cross-wind directions are both positive values for the initial equilibrium positions at the underside of the center line of the wake. For the initial equilibrium positions near the center line of the wake, for example, Y = 1.2 and 1.3, the amplitude in the along-wind direction of the leeward cable is much larger than that in the cross-wind direction. As the distance between the initial equilibrium position and the center line increases, for example, Y = 1.9 and 2.0, no obvious difference could be found for the amplitudes of the leeward cable in the along-wind and cross-wind directions.

Time histories of the along-wind and cross-wind displacements of the leeward cable: (a) X = 5.5, Y = 1.2; (b) X = 5.5, Y = 1.3; (c) X = 5.5, Y = 1.5; (d) X = 5.5, Y = 1.7; (e) X = 5.5, Y = 1.9; and (f) X = 5.5, Y = 2.0.
Figure 11 presents the trajectories of the leeward cable for the six selected initial equilibrium positions. The horizontal and vertical coordinates in Figure 11 represent the displacement in the along-wind and cross-wind directions, respectively. For each initial equilibrium position, the first figure is the trajectory within t = 0 ∼ 600 s, and the second figure is the trajectory when the stable movement of the leeward cable is achieved. It could be found from Figure 11 that the stable trajectory of the leeward cable seems to be ellipse, and an obvious long axis could be found. The direction of motion is clockwise, as indicated in Figure 11. These features are similar to the results of power transmission line, which is called “wake-induced flutter.” Furthermore, it appears that the angle between the long axis and the center line of the wake increases with the distance between the equilibrium position and the center line. For example, the angles between the long axis and the center line are about 9.7°, 12.6°, 23.4°, 38.8°, 48.9°, and 54° for Y = 1.2, 1.3, 1.5, 1.7, 1.9, and 2.0, respectively.

Trajectories of the leeward cable: (a) X = 5.5, Y = 1.2; (b) X = 5.5, Y = 1.3; (c) X = 5.5, Y = 1.5; (d) X = 5.5, Y = 1.7; (e) X = 5.5, Y = 1.9; and (f) X = 5.5, Y = 2.0.
Figure 12 presents the power spectral density of the stable vibration of the leeward cable for the six typical cases. It could be found from Figure 12 that the frequency of the stable vibration of the leeward cable is 0.397 and 0.385 Hz, which are both slightly smaller than the natural frequency of the structure, that is, 0.40 Hz. This indicates that negative aerodynamic stiffness might play an important role in the wake-induced response of the leeward cable.

Power spectral density of the stable vibration of the leeward cable: (a) X = 5.5, Y = 1.2; (b) X = 5.5, Y = 1.3; (c) X = 5.5, Y = 1.5; (d) X = 5.5, Y = 1.7; (e) X = 5.5, Y = 1.9; and (f) X = 5.5, Y = 2.0.
Mechanism discussion
Assume the leeward cable is initially located at the equilibrium point O1 for the numerical simulation and then it moves along an ellipse trajectory under a specific wind velocity. It should be noted that the center position of the ellipse trajectory, O2, heavily depends on the mean wind force acting on the leeward cable. The leeward cable might be located at the point O3 at a specific time, as indicated in Figure 13.

Sketch map of the trajectory of the leeward cable.
The aerodynamic mass attached to the leeward cable could be ignored because the air density is very small compared with that of the cable. It is reasonable to assume that the wind forces acting on the oscillating leeward cable are composed of the aerodynamic mean, stiffness and damping forces. The steady-state wind forces acting on the leeward cable at the initial equilibrium point O1 could be regarded as the mean aerodynamic forces, Fmx and Fmy, in the along-wind and cross-wind directions, respectively. The aerodynamic stiffness forces, Fsx and Fsy, depend on the displacement related to the initial equilibrium point and could be obtained from
where Fmx(y)(O1) and Fmx(y)(O3) are the mean aerodynamic forces in along-wind (or cross-wind) direction at the points O1 and O3, respectively. The aerodynamic damping forces, Fdx and Fdy, could be obtained from
The time histories of the total wind forces acting on the leeward cable, Fx and Fy, could be computed from equations (14) and (15), respectively. The mean aerodynamic force and the aerodynamic stiffness force could be determined from the aerodynamic mean drag and lift coefficients, which are given in Figures 5 to 7.
Figures 14 and 15 present the time histories of the aerodynamic mean, stiffness, and damping forces acting on the leeward cable within a period for the two cases of X = 5.5, Y = 1.3 and 1.7. It could be found from Figures 14 and 15 that the aerodynamic mean force is a dominant component in the total wind force, and the value of the aerodynamic mean force in the cross-wind direction is negative, which indicates that the cross-wind force acting on the leeward cable points to the center line of the wake. The aerodynamic damping force seems to be a sinusoid function with a mean value of zero. However, the time history of the aerodynamic stiffness force is more complicated with a non-zero mean value. Generally, the peak value of the aerodynamic stiffness force is larger than that of the aerodynamic damping force.

Aerodynamic mean, stiffness, and damping forces in the along-wind and cross-wind directions (X = 5.5, Y = 1.3): (a) along-wind direction and (b) cross-wind direction.

Aerodynamic mean, stiffness, and damping forces in the along-wind and cross-wind directions (X = 5.5, Y = 1.7): (a) along-wind direction and (b) cross-wind direction.
The energies per unit time inputted by the aerodynamic stiffness and damping forces, Ps and Pd, could be computed by
Figures 16 and 17 present the energies per unit time inputted by the aerodynamic stiffness and damping forces within a period for the two cases of X = 5.5, Y = 1.3 and 1.7. It could be found from Figures 16 and 17 that the aerodynamic stiffness force inputs energy into the leeward cable within a period since the area of Ps above the zero line is larger than that below the zero line, which means a positive work is done by the aerodynamic stiffness force within a period. However, the energies per unit time induced by the aerodynamic damping force always keep negative, which means a negative work is done by the aerodynamic damping force within a period. This indicates that the aerodynamic damping force always dissipates energy out of the leeward cable. Hence, it seems that the aerodynamic stiffness force is the key factor for the stable oscillation of the leeward cable.

Energies per unit time of the aerodynamic stiffness and damping forces (X = 5.5, Y = 1.3): (a) aerodynamic stiffness force and (b) aerodynamic damping force.

Energies per unit time of the aerodynamic stiffness and damping forces (X = 5.5, Y = 1.7): (a) aerodynamic stiffness force and (b) aerodynamic damping force.
Concluding remarks
To investigate the underlying mechanism of the aerodynamic interference effects on the cables of the suspension bridge hanger, a series of wind tunnel tests for a set of two smooth cylinders were carried out to measure the aerodynamic mean lift and drag coefficients of the leeward cylinder within X = [1, 11] and Y = [–4, 4] with an interval of ΔX = ΔY = 0.25. It was found that the mean drag coefficient of the leeward cylinder is symmetric about the center line of the wake, whereas the mean lift coefficient is asymmetric. On the basis of the quasi-steady theory, motion equations governing the leeward cable were derived by simplifying each cable as an oscillator. The Runge–Kutta method was adopted to numerically solve the derived motion equations of the leeward cable with the mean aerodynamic drag and lift coefficients obtained from the tests. The structural parameters of a hanger on the Xihoumen Bridge near the tower were used in the numerical simulations. The results show that large-amplitude vibrations of the leeward cable occur in the region of 1 ≤ |Y| ≤ 3, and there are no large-amplitude vibrations as the leeward cable locates near the center line of the wake (|Y| = 0). The time histories and power spectral densities of the displacement, the trajectories of the leeward cable for six typical cases were given in detail. It appears that the stable trajectory of the leeward cable is ellipse. The direction of the trajectory is clockwise above the center line of the wake (|Y| > 0), whereas anti-clockwise below the center line of the wake (|Y| < 0). Furthermore, the frequency of the stable vibration of the leeward cable is slightly smaller than its natural frequency. This implies that a negative aerodynamic stiffness might arise. To verify it, the time histories of the aerodynamic stiffness and damping forces on the leeward cable were identified from the numerical results, and their energies per unit time were obtained. It seems that a positive work within a period is always done by the aerodynamic stiffness force, whereas a negative work is always done by the aerodynamic damping force.
The responses of the leeward cable of the hanger of suspension bridge obtained in this study are completely identical with those of the wake-induced flutter obtained in the power transmission line. This implies that wake-induced flutter theory could well illustrate the underlying mechanism of the aerodynamic interference effects on the hangers of a suspension bridge.
Footnotes
Declaration of Conflicting Interests
The author(s) declared no potential conflicts of interest with respect to the research, authorship, and/or publication of this article.
Funding
The author(s) disclosed receipt of the following financial support for the research, authorship, and/or publication of this article: This project was jointly supported by the National Natural Science Foundation (51578234) and the National Basic Research Program of China (973 Program: 2015 CB057701 and 2015CB057702).
