
Abstract
The accurate measurement of the hanger tensile forces of suspension bridges is crucial for construction control and bridge maintenance. However, the commonly used vibration frequency method is not applicable to the short-hanger force assessment. The configuration of the main cable of a suspension bridge is closely related to hanger forces so that the main cable configuration can reflect the hanger forces. Based on the multi-segment catenary theory, this study proposed an analytical algorithm for the reverse assessment of hanger forces based on the measured configuration data of the main cable. First, the relationship between the hanger force and two critical parameters, that is, the horizontal force of the main cable and the catenary parameter, is established, in which the influence of the saddle arc on the main cable configuration is considered. Then, the horizontal force of the main cable is used as the breakthrough point, and a geometric condition (measuring the coordinates of a non-hanging point on the main cable) or a mechanical condition (measuring the tension of a long hanger by the vibration frequency method) is added. Using the nonlinear generalized reduced gradient method, the nonlinear equations are solved, and all hanger forces are identified. The proposed method feasibility and effectiveness are proved using a suspension bridge with a main span of 730 m as an example. The results show that the algorithm of adding a mechanical condition is lower in sensitivity, less affected by the accuracy of the additional condition, higher in precision, and easier to control, comparing to that of adding a geometric condition. Meanwhile, the horizontal force of the main cable and each hanger force exhibit a nearly perfect linear correlation.
Keywords
Introduction
The hanger is one of the typical cable components in bridges and a flexible member whose length varies from a few meters to several tens of meters in suspension bridges. Assessment accuracy of hanger tensile forces is related to the quality of the construction control, the safety assessment of the stress state of the bridge, and the formulation of the operation and maintenance strategy. According to the design specifications, the tension and stress of hangers should be controlled within the allowable range. The hanger transmits the load on the deck to the main cable, which also determines the safety and shape of the main cable. The safety of the whole bridge is closely related to hanger forces.
In the earlier research, the vibration frequency method was widely applied to the assessment of the tension of a slender cable. By measuring the frequency response of the cable under artificial excitation or environmental excitation, the internal tensile force was identified according to the relationship between tensile force and frequency. In the classical tension string theory proposed by Irvine (1981), the analytical relationship between the cable force, frequency and its order is considered, while the sag and bending stiffness effects are neglected. Moreover, cable density and length values are vital for further analysis. Therefore, within the framework of the tension string theory, Triantafyllou (1984) proposed a relationship between the frequency and cable force with an account of the sag effect and neglect of the bending stiffness, which involved the unstrained cable length. However, the actual measurement of the unstrained cable length is quite problematic. Hence, Triantafyllou and Grinfogel (1986) considered the relationship between the cable force, frequency, and vibration mode of the stay cable, and confirmed the dynamic amplification effect of the cable inclination angle. Shimada et al. (1989) applied the frequency method to the suspension bridge hanger in three steps. First, they studied the vibration mode of the hanger along the bridge axis. Next, they identified the hanger tension according to the measured frequency and considered the clamped cable boundary effect. Finally, the results obtained were compared with the stress measurements of load-bearing components. The obtained long hanger error was within 4%, and the cable clamp in the short hanger exhibited a non-negligible effect. Based on the cable frequency theory, which considered the bending stiffness, Zui et al. (1996) proposed an engineering formula for assessing the cable force/stress by the frequency method with the account of sag and stiffness effects. The method of cable force evaluation via the high-order vibration frequency based on the micro-vibration measurement was proposed and verified using the finite element method (FEM) simulation. Mehrabi and Tabatabai (1998) studied the relationship between cable tensile force and the frequency based on the finite difference method by considering the influences of sag, bending stiffness, boundary constraints, and dampers. The discrepancy between obtained analytical and FEM results could be controlled within 0.35%. Ni et al. (2002) took the sling with a large diameter as the research object and studied the bending stiffness effect on frequency based on the FEM approach. Taking the Tsingma Bridge as an example, they concluded that the bending stiffness effect on the high-order frequency could not be ignored. Kim and Park (2007) proposed an algorithm for assessing cable force, bending and axial stiffness values, according to the measured frequency. As verified by the FEM model, the proposed formula was suitable for large-size cables with an error of about 3%, which is better than previous research studies. Moreover, they concluded that the bending stiffness was proportional to the cable force. Ceballos and Prato (2008) proposed an explicit analytical expression of the natural frequency of the cable considering the cable’s bending stiffness and the rotation constraint at the ends. By optimizing the cable force and bending stiffness, the error of assessing the internal force of the short hanger could be effectively reduced. However, in the process of determining the cable force, it took the rotational constraint stiffness of both ends as the known parameter. Unfortunately, in the field measurement of the actual frequency, it is difficult to identify the constraint of the suspension bridge hanger. Park et al. (2010) studied the hanger force evaluation for the suspension bridge double-hanger system via the frequency method and simultaneously estimated its bending and axial stiffness values. The estimation accuracy was found to be higher for long hangers, as compared to short ones. Choi and Park (2011) investigated the gravity effect on cable force and natural frequency. Given the shortcomings of gravity research in previous studies, they explained the cable hardening and softening phenomena by nonlinear vibration and claimed that the gravity effect of the cable with large self-weight and large diameter should be mandatorily taken into account. Huang et al. (2015) introduced a correction factor in the vibration frequency method to test the cable force under the fixed–fixed condition and the fixed–hinged condition, but for the short cable, there is still a large error.
Available research results strongly indicate that the vibration frequency method applied to assess hanger forces of a suspension bridge has the following side-effects: (1) the measurement accuracy of the frequency method is affected by several parameters including boundary constraint stiffness, sling bending stiffness, and sling length, while the accurate determination of these parameters is quite problematic; (2) the frequency method can accurately assess the long-hanger tensile force but is less precise for short hangers. Therefore, the frequency method still has certain limitations in the hanger force assessment of actual suspension bridges, and it is urgent to seek new approaches. The cable configuration of a suspension bridge is closely related to hanger forces, and the cable configuration can reflect hanger forces. Therefore, hanger forces can be reversely assessed via the measured configuration of the main cable. However, to the best of the author’s knowledge, this research topic is scarcely investigated.
In the available studies on the main cable shape-finding for suspension bridges, the FEM and analytical methods based on the multi-segment catenary theory are mostly used. The FEM models the main cable, the hanger, and the main beam as complete systems. It can be used to simplify the boundary conditions, calculate the force and frequency modes, as well as verify the cable force estimates of the frequency method. However, there are non-negligible differences between the model and the actual structure. Moreover, the FEM is mostly used at the design stage, while it is not instrumental in the assessment of the stress state of the bridge during construction and operation. The multi-segment catenary shape-finding theory was developed by the refinement and comprehensive combination of the conventional parabolic and catenary theories. Kim and Lee (2001) calculated the main cable configuration of a suspension bridge with the Newton–Raphson algorithm combined with the analytical expression of the cable mechanics. The effect of hanger force was considered by the mechanical balance, whereas the hanger force was a known condition of the shape design, which was solved by the continuous beam model. Jung et al. (2013) proposed a nonlinear analytical algorithm for determining the shape of a suspension bridge under dead load. Based on the analytical method of elastic catenary theory, Cao et al. (2017) improved the computational efficiency using the iterative calculation and explicit Jacobian matrix. However, its hanger force was still determined using a finite element continuous beam model. Therefore, in the existing catenary analysis methods, the hanger force is often a known parameter, while in the actual construction and in-use phase, the real hanger tensile force cannot be determined due to construction errors and load changes. Thus, the safety status of the bridge could not be reliably assessed. The catenary analysis theory can provide a theoretical basis for the analytical algorithm of reverse recognition of hanger forces based on the measured cable configuration. Huang et al. (2017) identified the hanger force according to the shape-finding theory but did not further analyze the sensitivity of the algorithm.
At the same time, the existing analytical algorithms mostly use matrix parameter iterative calculation, which has low efficiency. The nonlinear generalized reduced gradient (GRG) method proposed by Lasdon et al. (1974) exhibited excellent calculation accuracy and computation speed. Later, Lasdon et al. (1978) also proved that GRG is an effective and reliable algorithm for solving small- and medium-sized numerical solution problems, and it is convenient for solving nonlinear problems.
To realize the identification of hanger tensions based on cable configuration, the primary task is the measurement of the main cable. There are a variety of advanced technologies to achieve large-scale three-dimensional (3D) coordinate measurement. Traditional equipment and techniques, such as theodolites, high-precision total station, and digital levels, are frequently used in engineering measurements. For example, the total station measurement system is based on the space pole coordinate system or spherical coordinate system, which is reliable and straightforward. It is widely used because the accuracy can generally be controlled in the millimeter range. In addition, some technologies continue to develop, such as laser range-finding techniques and close-range photogrammetry, which can reduce the risk of high-altitude work in total station measurement. The laser range-finding techniques’ ranging principle mainly includes pulse laser ranging, laser phase method ranging, and laser triangulation ranging. Its ranging accuracy is lower than that of the high-precision total station, but the measurement range is longer. Close-range photogrammetry was introduced in the 1840s and now has entered a period in which it has steadily developed. Psimoulis and Stiros (2013) used a robotic total station to measure the deflections of a short-span bridge in response to passing trains. Alamdari et al. (2019) presented the condition assessment of a cable-stayed bridge using remote sensing, including laser scanning, terrestrial robotic total station, and digital level. Slob and Robert (2004) introduced several applications of 3D terrestrial laser scanning (TLS), which may illustrate the potential benefits of using laser scanning in engineering geological practice and research. Park et al. (2007) presented a new approach for the health monitoring of structures using TLS. They proposed a displacement measurement model to improve the accuracy of the measurement. Golparvar et al. (2011) presented a new image-based 3D reconstruction approach based on structure-from-motion (SFM) and compared its application with a laser scanner. Jauregui and White (2005) summarized basic elements and system requirements for bridge engineering applications of close-range photogrammetry. Jiang et al. (2008) summarized the major aspects of bridge measurement applications with photogrammetry, which includes types of measurement, cameras, targets, network control, and software, covering the years from 1985 to 2003. These techniques have certain accuracy on small-scale structures, but the accuracy of measurement on large-scale structures still needs to be improved. At the same time, in bridge engineering, these technologies are mostly used for deflection measurement and even for dynamic feature monitoring. However, these technologies may provide the possibility and means for rapidly measuring the geometric shape of the main cable in the future. If we further use the multi-segment catenary analysis algorithm to propose the analytical formula for assessing hanger forces, it will be very innovative and practical.
Based on the multi-segment catenary theory, this study proposes an analytical algorithm for the reverse recognition of hanger forces. Taking the measured main cable configuration as the entry point, the mechanical balance condition and the geometric compatibility condition are considered as the constraint equations. The nonlinear GRG method is used to solve the nonlinear equations, and then all hanger forces of the suspension bridge can be identified. The method is successfully applied to a suspension bridge with a main span of 730 m, with the successful verification of the feasibility and effectiveness of the proposed method.
Main cable configuration theory
The multi-segment catenary theory of the main cable is based on the following assumptions:
The main cable material is in an elastic working phase, under Hooke’s law.
The main cable is the ideal flexible cable, with only the axial tensile force, no bending moment and pressure.
Under the slight change of the configuration, the slight inclination angle of the hanger can be neglected, that is, the direction of the force is always vertically downward.
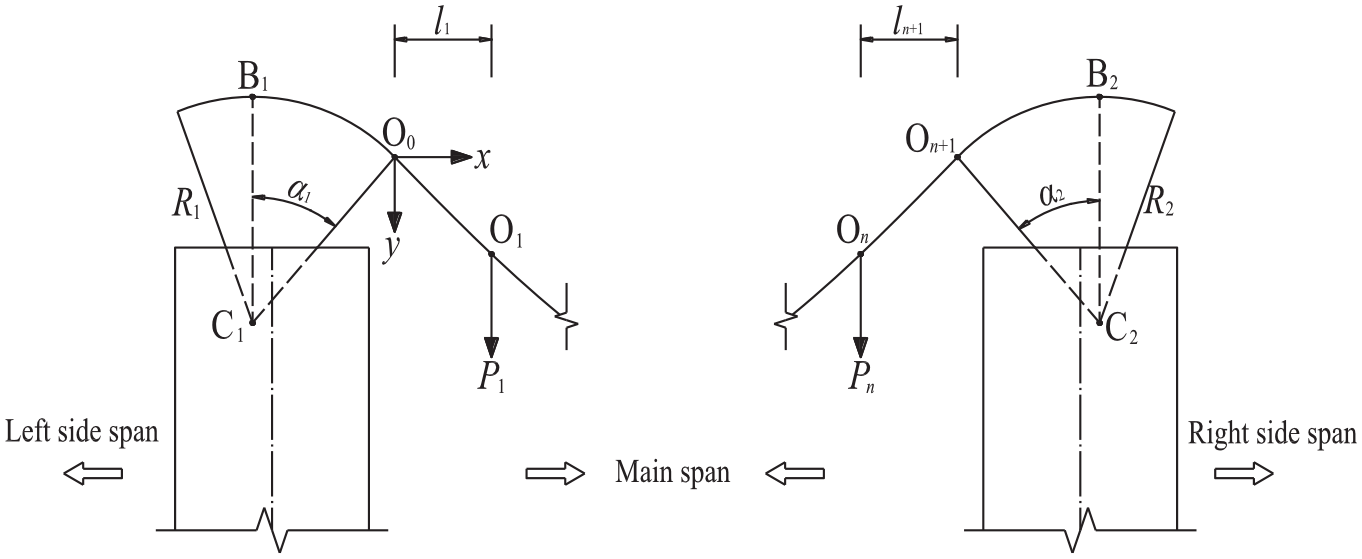
The main cable of a suspension bridge shows a multi-segment catenary configuration with folded angles (Figure 1). When n hanger forces are applied, the whole cable can be divided into n + 1 catenary segments. With the tangent point O0 on the left saddle and each hanging point O i (i = 1–n) as the coordinate origin, coordinate systems are established, respectively. The x-axis is horizontal to the right, while the y-axis has a vertically downward direction. The catenary equation of the ith segment can be expressed as follows


Main cable in the main span.
where c = –H/q, H is the horizontal component of the main cable force (kN), q is unit length weight of the main cable (kN/m); ai is the dimensionless parameter of the catenary equation.
In the above coordinate system, according to the geometric boundary condition y(li) – y(0) = Δhi, we get
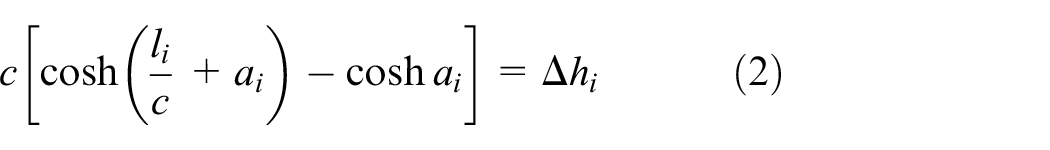
where Δhi and li are the measured height difference of adjacent hanging points and the measured value of the horizontal projection length of the cable segment between them, respectively, while
The expression of the catenary parameter ai can be obtained from equation (2) as follows
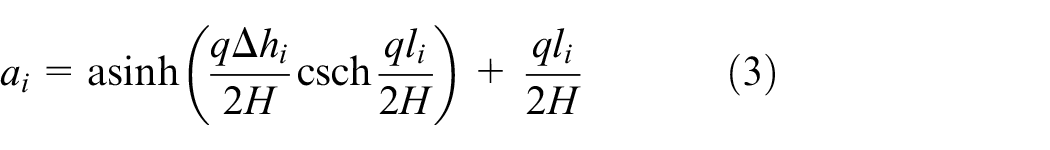
In the above formula, Δhi, li, and q are known conditions, and only the horizontal force H of the main cable is unknown. According to the horizontal mechanical balance, the horizontal force of the main cable in each catenary segment is equal. Considering both the influence of the hanger force on the geometric continuity of the cable configuration and the balance of forces at the hanging point, the way to identify the hanger forces is presented.
As shown in Figure 2, the vertical force balance at the hanging point is described by the following relationship


The balance of forces at the hanging point.
where θi is the tangent angle of the endpoint of the main cable on the left side of the ith hanging point; φi is the tangent angle of the starting point of the main cable on the right side of the ith hanging point; and Pi is the hanger force at the ith hanging point.
According to the catenary equation of the configuration, tangent values of angles θi and φi take the following forms

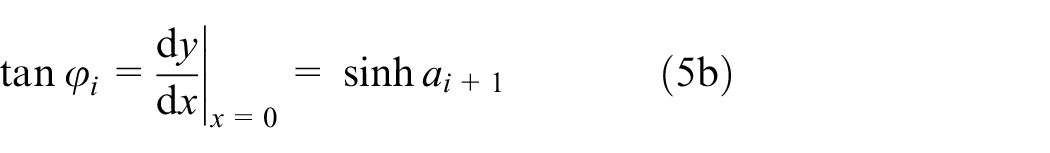
Substituting these values into equation (4), we get

Therefore, according to the mechanical equilibrium relationship of the cable, equation (6) is an explicit analytical formula for assessing the hanger force Pi, which is related to the horizontal force H and configuration parameters of the main cable. Besides, the parameter ai in the formula is also related to the horizontal force H of the main cable. So, the horizontal force H of the main cable is the critical breakthrough point to identify the hanger force.
In the above analysis process, it is worth noting that the first and the (n+1)th catenary lines are both connected to the arc segment of the saddle, and the tangent points (O0 and On+1 in Figure 3) generally cannot be obtained via intuitive measurement. Therefore, values l1 and ln+1 of the head and tail catenary segments need to be determined by the geometric characteristics of the saddles.
The shape of the main cable at the saddles.
At the top of the left tower, the main cable segment B1O1 is composed of a circular arc segment B1O0 and a catenary segment O0O1, where O0 is a tangent point and also the starting point of the first catenary segment. According to the measured configuration data, the elevations of points B1 and O1 and the horizontal distance between them are easily obtained. At the tangent point O0, there is the following relationship
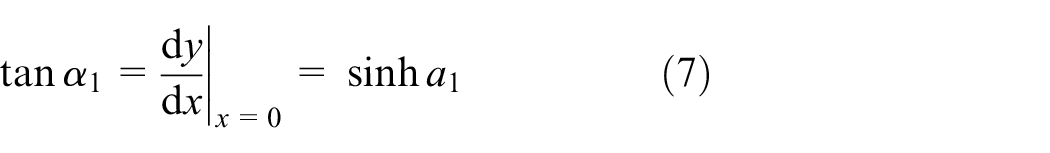
where α1 is the angle between the line connecting the tangent point O0 and the saddle center C1 and the vertical line B1C1 (Figure 3).
This yields


Due to the tangent point existence, geometric parameters Δh1 and l1 of the first catenary line O0O1 are unknown. Therefore, if the horizontal force H of the main cable is known, the following two equations can be established, according to the closure conditions of the height difference and horizontal distance between points B1 and O1, respectively. This allows one to derive the unknowns, namely, the horizontal projection length l1 and the catenary parameter a1 of the first catenary segment
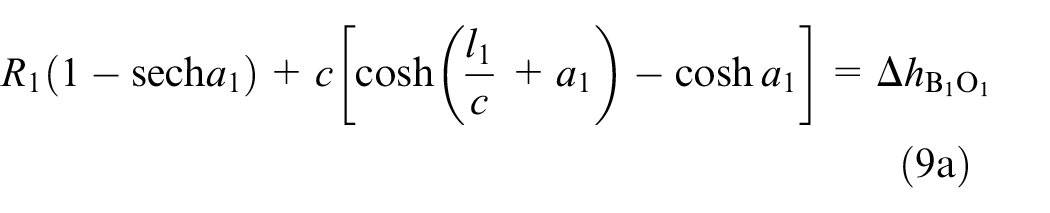

where R1 is the radius of the left saddle (Figure 3);
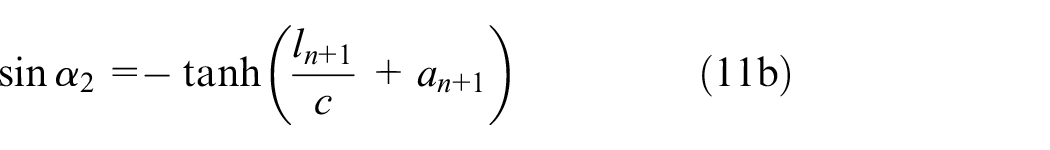
At the top of the right tower (Figure 3), the main cable segment O n B2 is composed of the catenary segment O n On+1 and the arc segment On+1B2, where On+1 is a tangent point and also the endpoint of the (n+1)th catenary segment. It is easy to assess the measured elevations of points B2 and O n and the horizontal distance between them. The following relationship is valid for the tangent point On+1
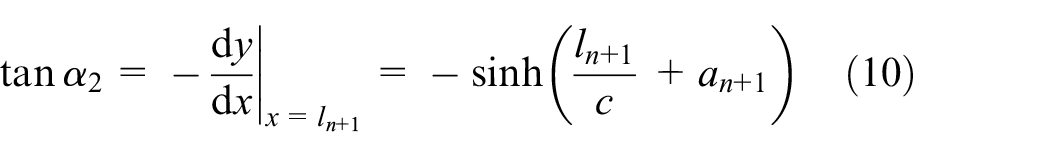
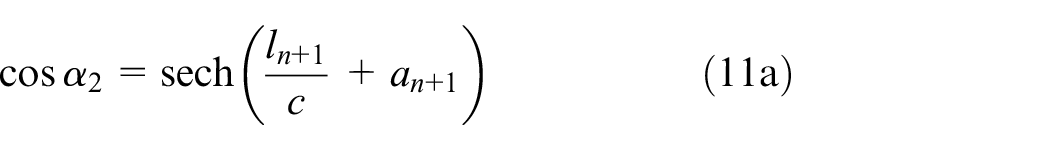
where α2 is the angle between the line connecting the tangent point On+1 and the right saddle center C2 and the vertical line B2C2 (Figure 3).
Thus, there are
In equation (10), the (n+1)th catenary segment parameters ln+1 and an+1 are unknown. However, if the horizontal force H is known, then according to the closure conditions of the height difference and the horizontal distance between points B2 and O n , the following two equations can be constructed to derive the horizontal projection length ln+1 and the catenary parameter an+1 of the (n+1)th catenary segment, respectively

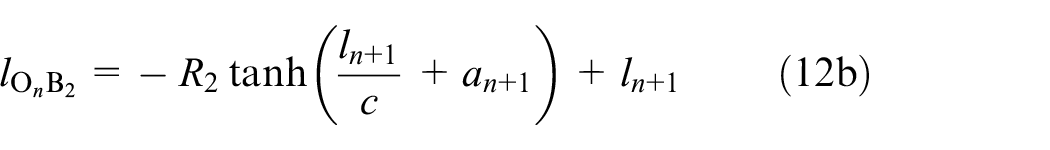
where R2 is the radius of the right saddle;
In the above derivation, there are five unknowns: a1, l1, an+1, ln+1, and H, but there are only four equations for deriving the unknowns, namely, equations (9a), (9b), (12a), and (12b), so one more equation is required to solve the system. Among them, H is the most critical unknown. Once H is determined, a1 and l1 can be derived via equations (9a) and (9b), while an+1 and ln+1 can be calculated via equations (12a) and (12b).
Hanger force calculation
To identify hanger forces, the horizontal force H of the main cable must be the critical breakthrough point. However, according to the measured cable-curve data of each hanging point, there is still a lack of decoupling conditions. Therefore, from the perspective of making rational use of existing research means, two algorithms for decoupling conditions are proposed. The first one is the geometric condition, that is, based on advanced measurement technology, the coordinates, and elevation of a non-hanging point on the main cable are added. Then, the horizontal force of the main cable is settled, and hanger forces are identified. The second is the mechanical condition, that is, the tensile force of a long hanger is tested based on the frequency method. The main cable horizontal force is derived, and the remaining hanger forces are then identified.
Geometric condition (Method I)
Using state-of-the-art measurement techniques, the elevation of a non-hanging point Q and its horizontal distance from adjacent hanging points can be measured complementarily on the kth catenary segment of the main cable (Figure 4). Considering that the first catenary segment and the (n+1)th one have an unknown tangent point, respectively, to improve the recognition accuracy, a specific catenary segment is selected from the second to nth ones. According to the catenary equation of the kth segment, the following equations are established on the closure condition of the height difference of hanging point O k and the supplementary point Q, and the closure condition of the height difference of hanging points O k and Ok–1 (Figure 4), respectively

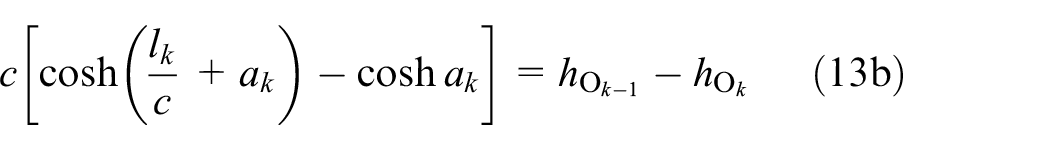
where
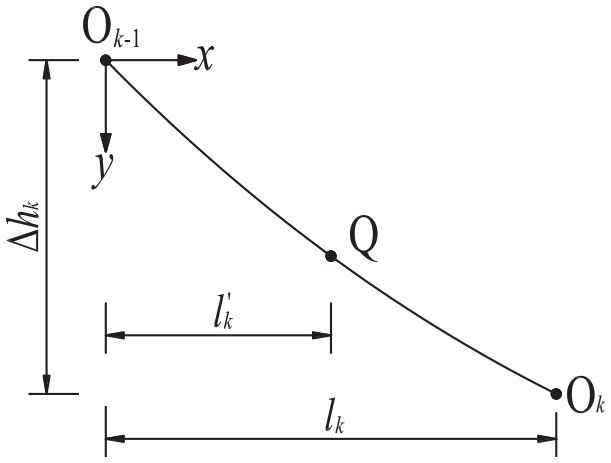
Position of the supplementary measurement point Q.
In equation (13), there are two unknowns: the main cable horizontal force H and the kth catenary parameter ak. Noteworthy is that equation (13) includes two transcendental terms. To facilitate the above equation solving, its right-part term is shifted to the left part. Thus, equations (13a) and (13b) are reduced to the following functions


Then, the objective function
By substituting the calculation results of the horizontal force H of the main cable into equations (9) and (12), a1, l1, and an+1, ln+1 can be obtained, respectively. By substituting H into equation (3) and using the cable curve conditions (Δhi and li) of each segment, the catenary parameters ai of the remaining segments can be solved. Then, all hanger forces Pi can be identified via equation (6).
Mechanical condition (Method II)
In the test of the short hanger, the vibration frequency method is affected by the boundary and bending stiffness, and the result is often unsatisfactory. However, it has high precision in the tensile force assessment of long hangers, and the result is reliable. As a mechanical condition, the tension of a slender hanger is measured complementarily using the vibration frequency method, for which procedure the side hanger near a pylon is recommended. Substituting the measured tensile force Pj of the jth hanger into equation (6), the following additional equation can be constructed

By combining equations (9), (12), and (15), the unknowns a1, l1, an+1, ln+1, and H can be derived via the nonlinear GRG method. The remaining hanger forces Pi are then assessed via equations (3) and (6).
Example analysis
The Jindong Bridge, China
As an example, we analyzed the Jindong Bridge in Dongchuan District, Kunming City, Yunnan Province of China. It adopts a steel truss suspension bridge structure with a single main span of 730 m, as shown in Figure 5. It is the suspension bridge with the largest span over the Jinsha River. The main cable has a sag-to-span ratio of 1/10 and adopts 91 prefabricated parallel steel wire strands (PPWSs). Each strand contains 91Φ5.2 galvanized high-strength steel wires. The self-weight load per length of the main cable is q = 14.268 kN. The stiffening steel truss girder is of the Warren type and consists of main truss, upper/lower bracings, and horizontal truss. The height is 5 m, the width is 17.5 m, and the intersection length is 5.0 m. The bridge deck adopts the combination of longitudinal I-beam and concrete bridge deck. The bridge deck width is 20 m, and the distance between the upstream and downstream main cable centers is 17.5 m. There are 71 hangers in the upstream and downstream of the main span, respectively, and high-strength galvanized steel wire parallel bundles are used. Each hanger adopts 109Φ5.0 galvanized high-strength steel wires. It is known that the left and right main cable saddle arc radius is R1 = R2 = 5.5 m.

The Jindong Bridge: (a) elevation scheme (unit: m) and (b) photo.
Table 1 describes the measured configuration of the main cable, including the elevation and horizontal position data for each measurement point, in particular, the main cable saddle vertexes B1, B2, and each hanging point O i (i = 1, 2, …, 71). The horizontal distance between points B1 and O1 is 15.227 m; the horizontal distance between points B2 and O71 is 14.939 m. These data were measured by a high-precision total station (Leica TS30, angular accuracy 0.5″ and ranging accuracy 0.6 mm + 1 ppm).In order to ensure the accuracy of the measurement, the mercury thermometer and DYM3-type empty box barometer were used to correct the temperature and atmospheric pressure, respectively. During the measurement work, several basic points were arranged along the bridge and on both sides of the main cable to form a measurement control network. A prism was then placed on each of the upper and lower sides of the main cable clamp, and the positions of the prisms’ centers were measured using the total station. Finally, the prisms’ coordinates at each cable clamp are averaged to obtain the coordinates of the center of the main cable. It is to be noted that a prism is a tool used to reflect back the light signal from the total station.
Measured configuration data of the main cable.
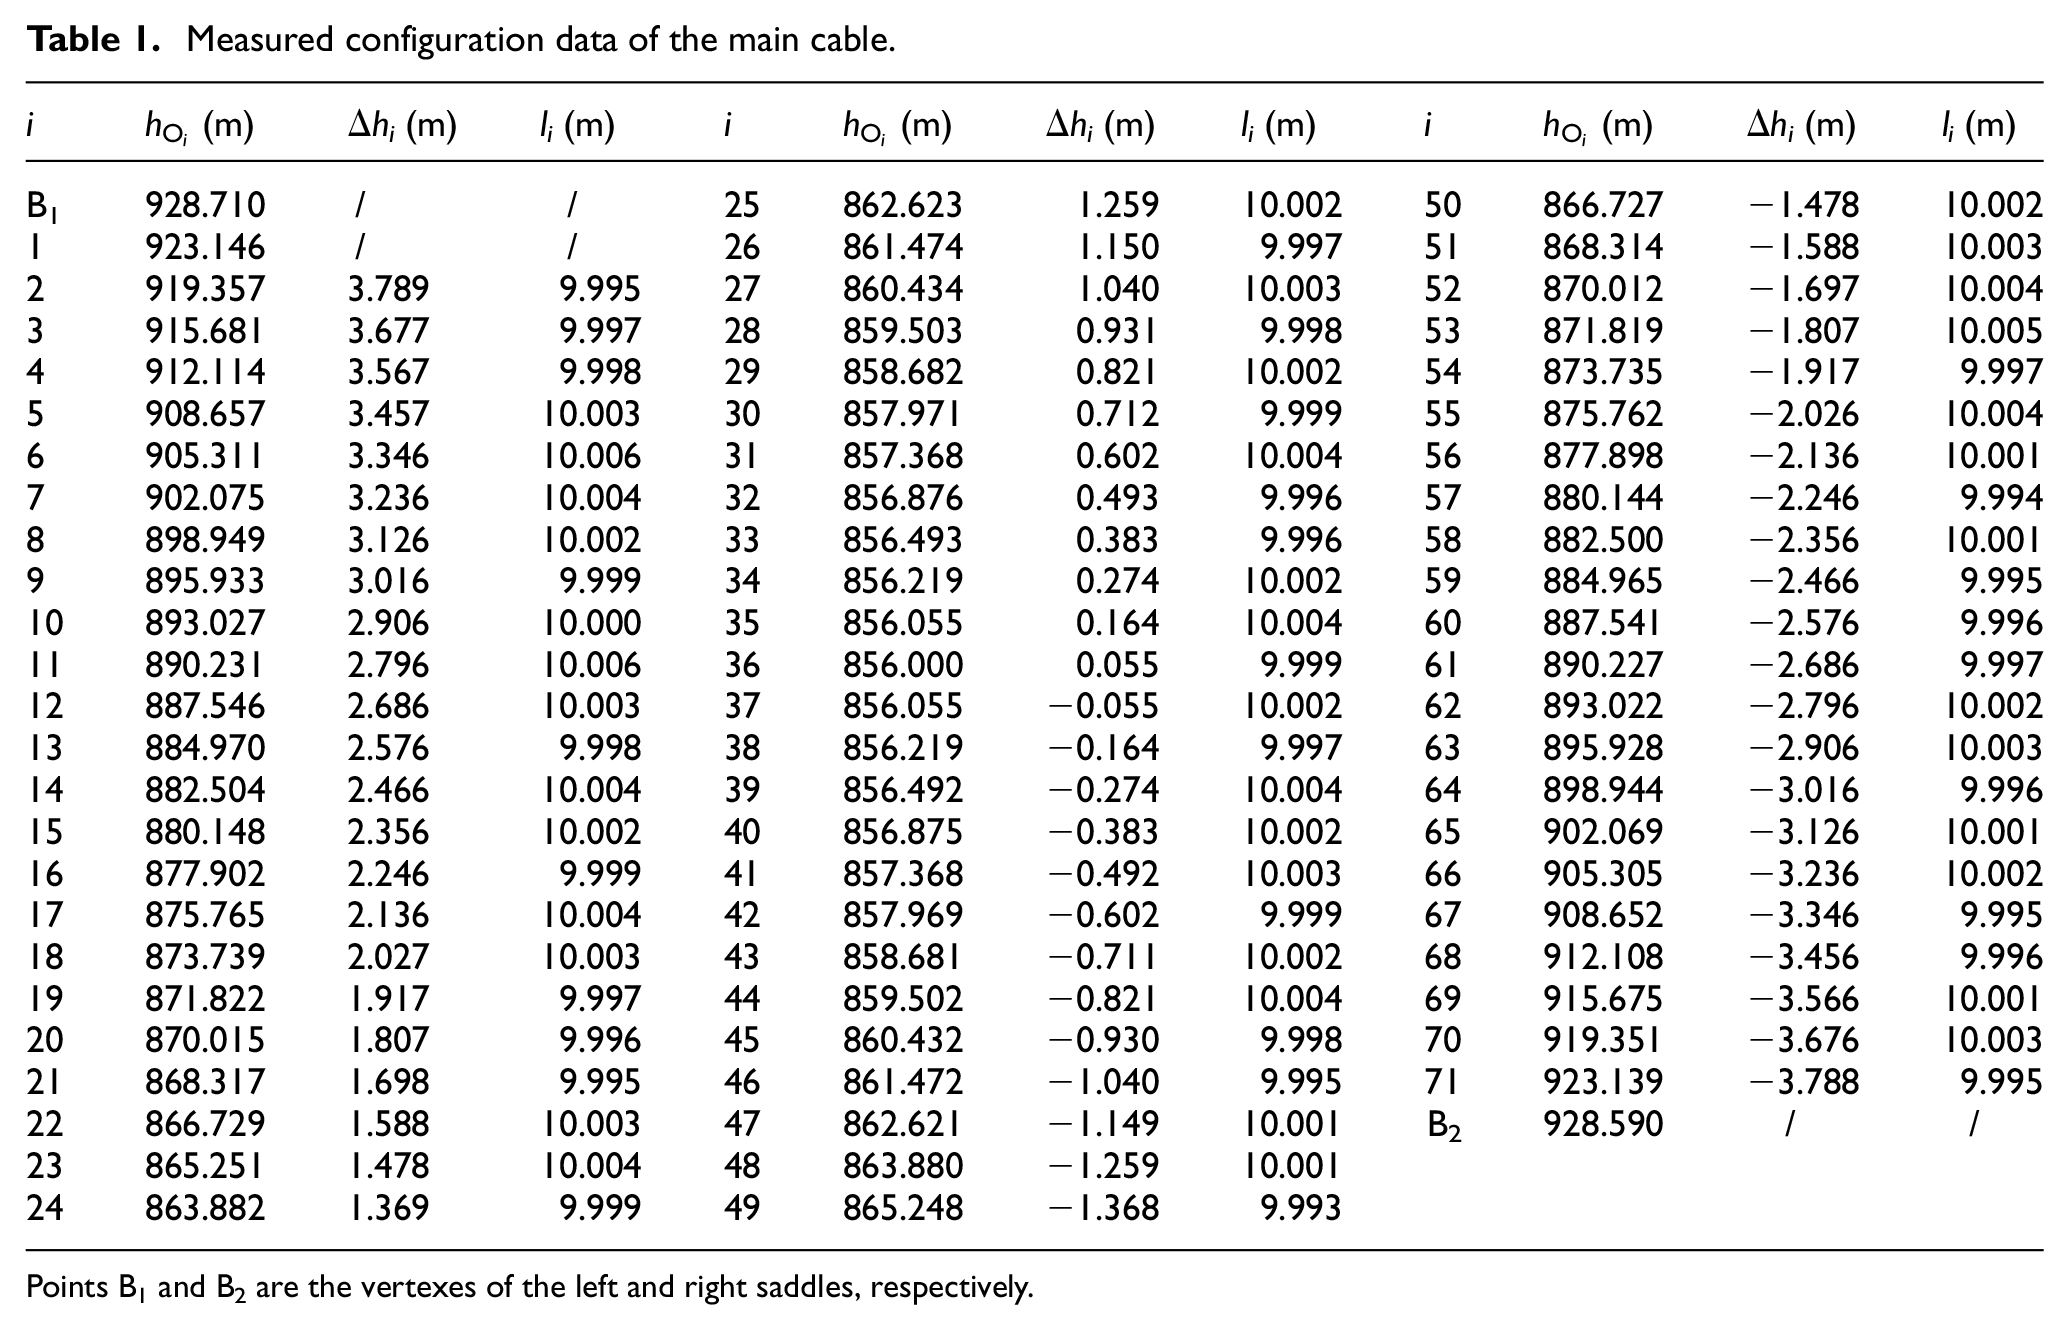
Points B1 and B2 are the vertexes of the left and right saddles, respectively.
Hanger force assessment
According to section “Geometric condition (Method I),” the measurement point Q is added to the second catenary segment of the main cable, and the position is approximately at the midpoint of the segment. The measured values are hQ = 921.249 m,
Configuration parameters.
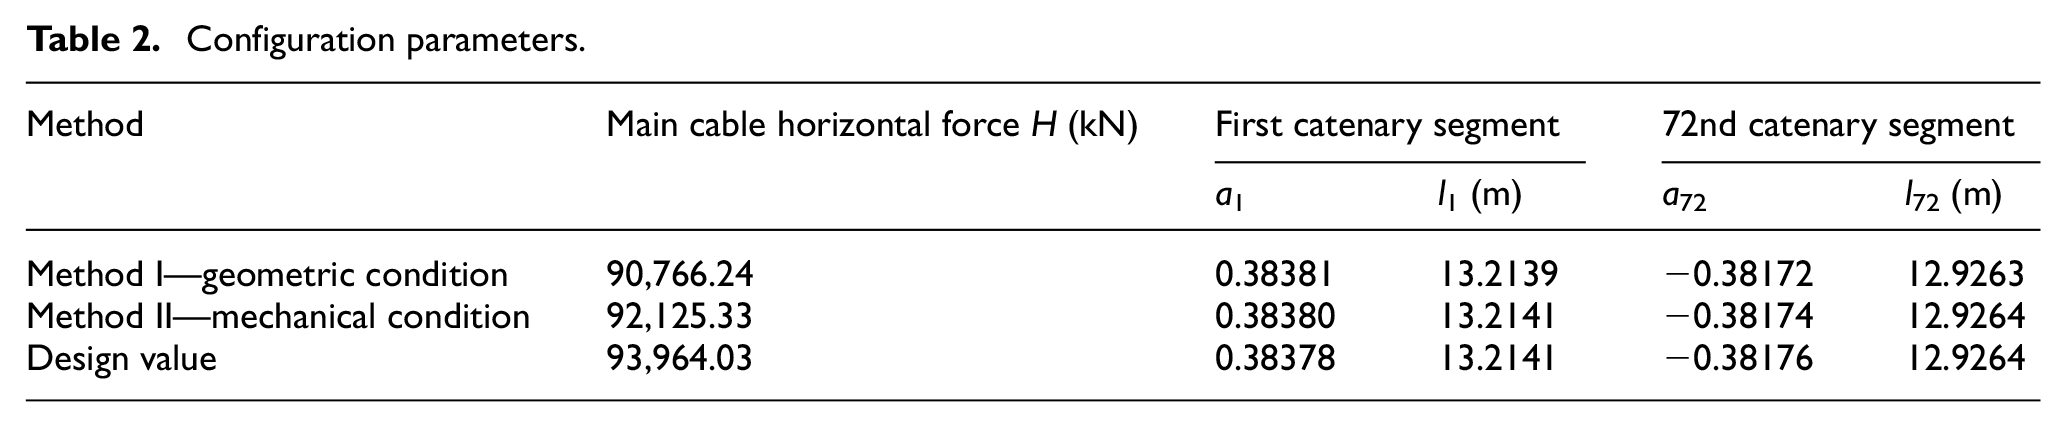
According to section “Mechanical condition (Method II),” the tensile force of the first hanger measured by the vibration frequency method is P1 = 1050.0 kN, and then the unknown quantities a1, l1, a72, l72, and H can be solved, as listed in Table 2. According to the design data, the design value of hanger spacing is li = 10 m (2 ≤ i ≤ 71). Under the design hanger force (Figure 6(a)), the theoretical value of the horizontal force of the main cable is H = 93,964.03 kN. The design parameters of the first and last catenary segments a1, l1, a72, and l72 are also listed in Table 2.
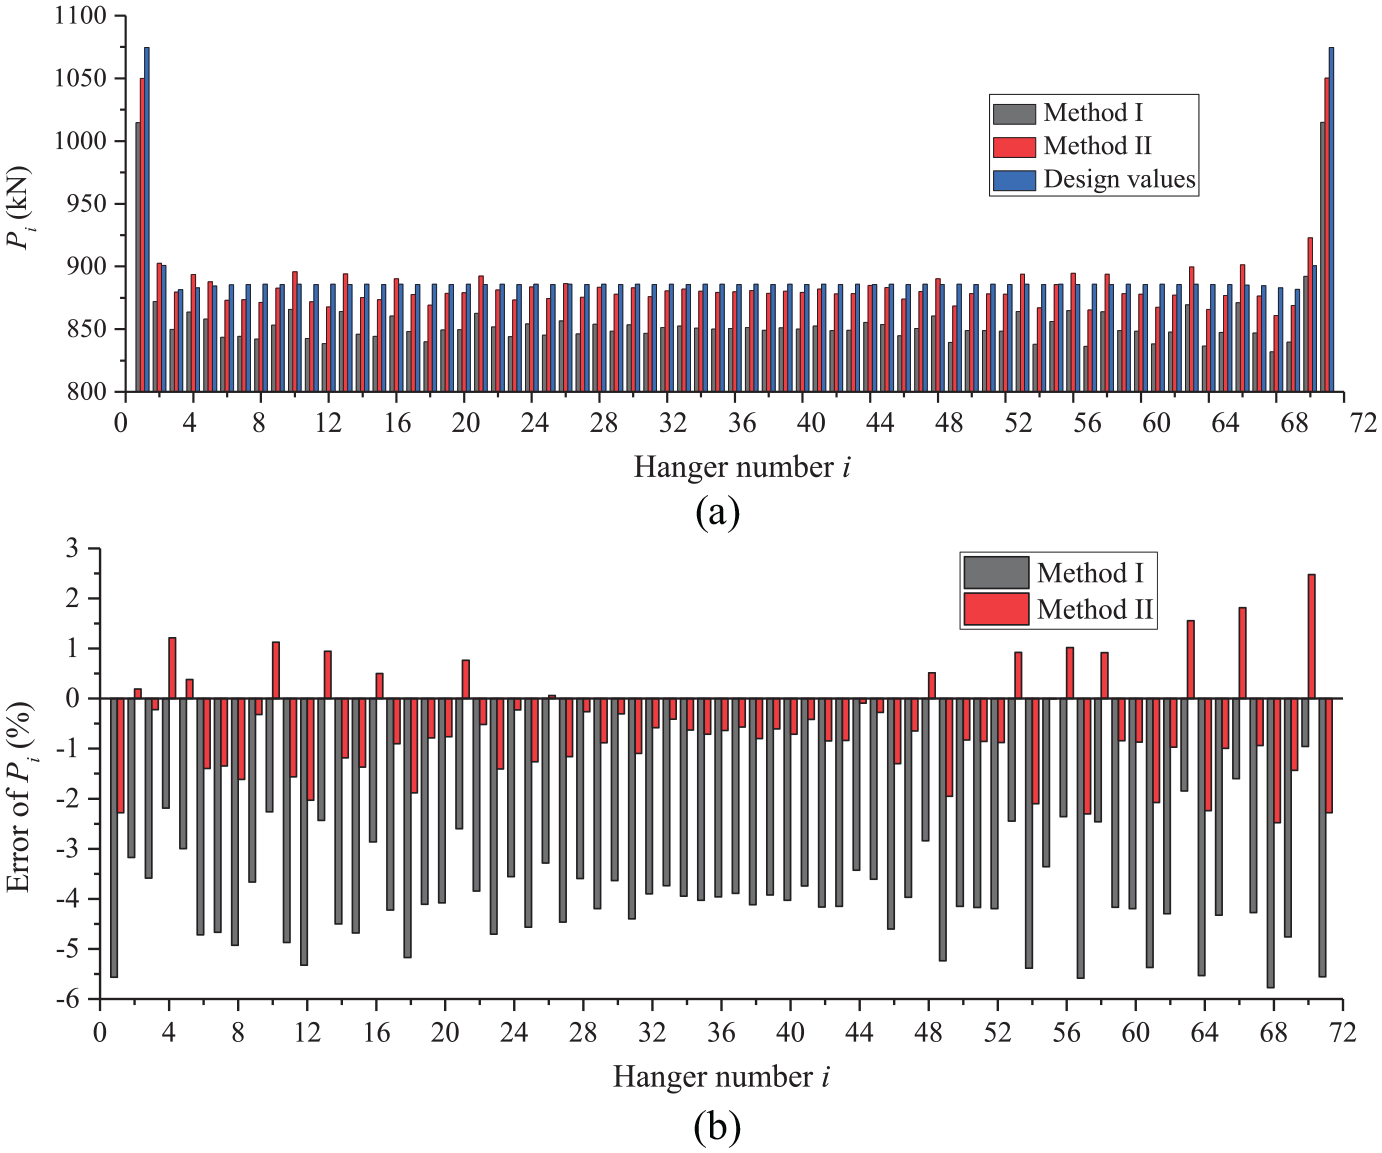
Hanger tensile forces: (a) values and (b) the relative error.
The comparison shows that (1) the horizontal forces of the main cable identified by the two methods are both close to the design value, that is, the error of Method I is 3.40%, and that of Method II is −1.96%; (2) by considering the influence of saddle arc, the calculated parameters of the first and the 72nd catenary segments are also close to the design value. The difference between the horizontal projection length l1 (or l72) and the design value is about 0.1-mm level, and the difference between the calculation results and design values of a1 and a72 are also in the 100,000-digit position.
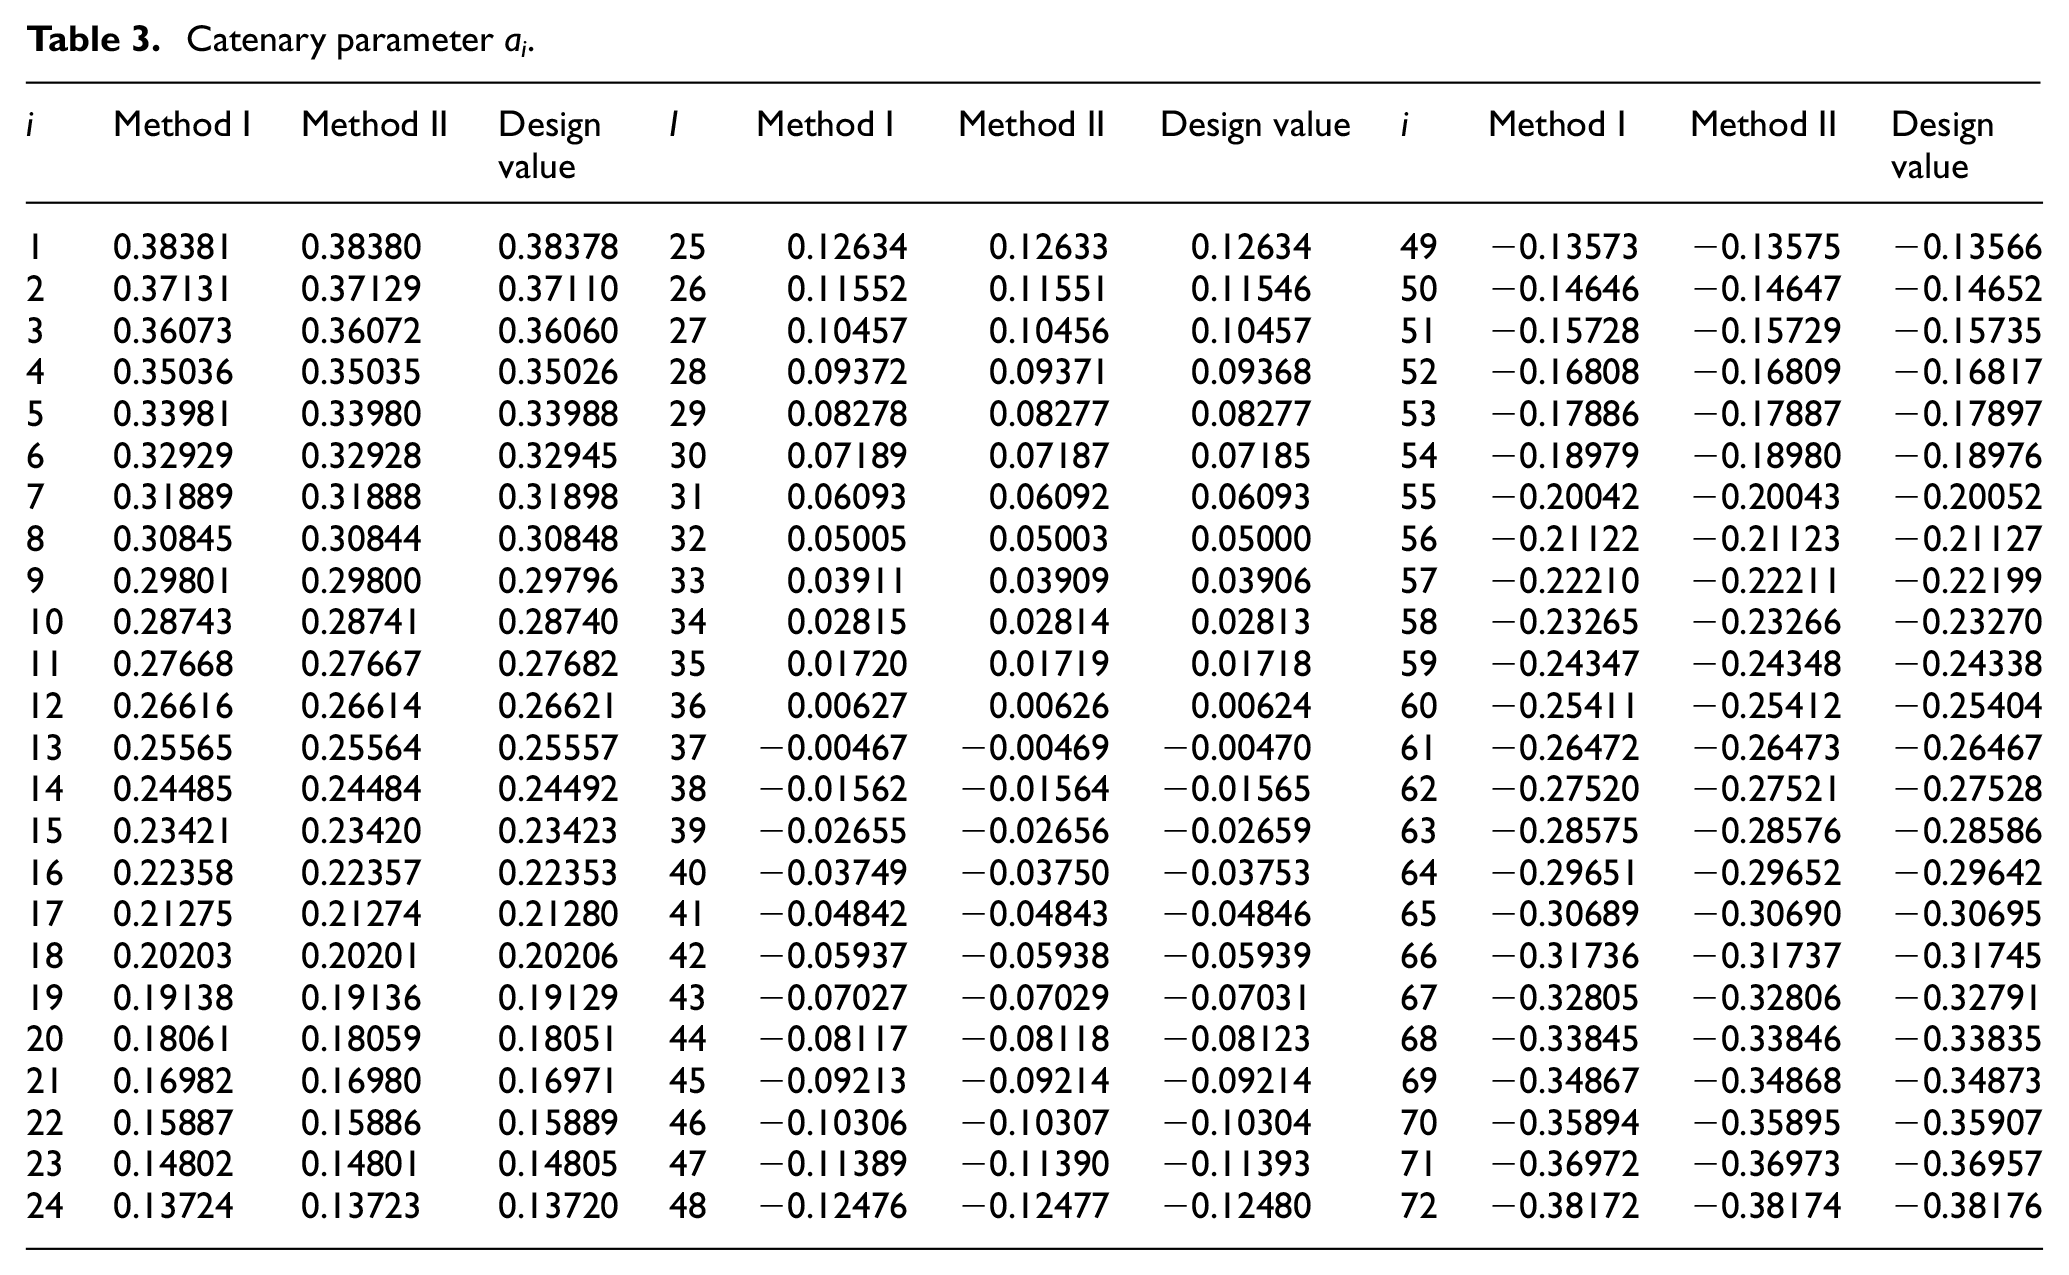
By substituting the main cable horizontal force H and main cable measured cable-curve data Δhi and li into equation (3), the catenary parameter ai of each catenary segment of the main cable can be calculated, as listed in Table 3, together with the design values. It was found that the discrepancy between ai values calculated by the above two methods was in the 100,000-digit position. It can be concluded that the cable configuration assessed by both methods is the same, which is consistent with the design one, and the construction quality of the bridge is relatively reliable.
Catenary parameter ai.
Each hanger force Pi can be calculated via equation (6), as shown in Figure 6(a), together with the design values. Figure 6(b) shows the relative error between the calculated value of each hanger force and the design value. It can be seen from Figure 6 that
In terms of the distribution of hanger forces, the side hanger forces near both pylons are large, and the hanger forces in the span are relatively uniform;
The hanger forces identified by Method I are all lower than the corresponding design value. The hanger forces defined by Method II are generally smaller than the corresponding design value, but some hanger forces are slightly larger than the design value;
The error of Method I is higher than that of Method II. The error of Method I is −5.8% at maximum, the maximum error of Method II is −2.5%, and the maximum error is present in the 68th hanger.
Sensitivity analysis
Besides the systematic error caused by the assumptions in the analytical expression and measurement error of the main cable configuration, the error sources of the two methods are still different. They are derived from the coordinate measurement error of the supplementary measurement point Q and the error of the long hanger tension recognized by the frequency method, respectively. Considering that the measured data are affected by the site environment and instrument errors, there is a certain degree of randomness. Therefore, it is necessary to evaluate the dependence of the algorithm on the accuracy of the measured data, so the robustness of the algorithm is assessed by sensitivity.
Method I
In section “Hanger force assessment,” the main cable passes the supplementary measurement point Q. If the Q position changes (caused by measurement error), both the calculated main cable horizontal force and the identified hanger forces will be affected. To study the influence of the point Q coordinate measurement error on the hanger forces, we artificially change the measurement result on Q coordinate. In Figure 7, point 1 corresponds to the original position of point Q in section “Hanger force assessment,” while points 2–5 are virtually added measurement points. In other words, the measured point Q coordinate changes to points 2–5 due to the measurement error. Points 2 and 3 are located approximately along the actual main cable axis, while points 4 and 5 are in the normal direction of the main cable on the lower and upper sides, respectively. Insofar as the measurement error of the geometric shape is generally in the level of a millimeter, the magnitude of the point Q coordinate variation is 1 mm. The coordinates of points 1–5 are listed in Table 4.
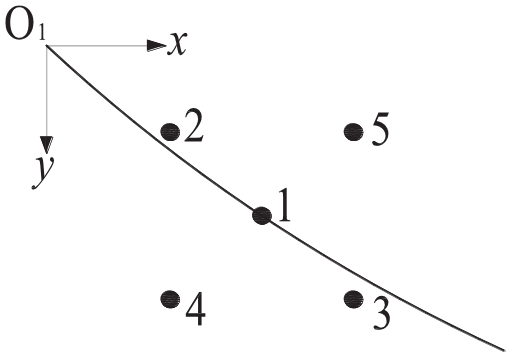
The original position of the supplementary measurement point Q and artificially changed positions.
Point coordinates and horizontal force of the main cable.
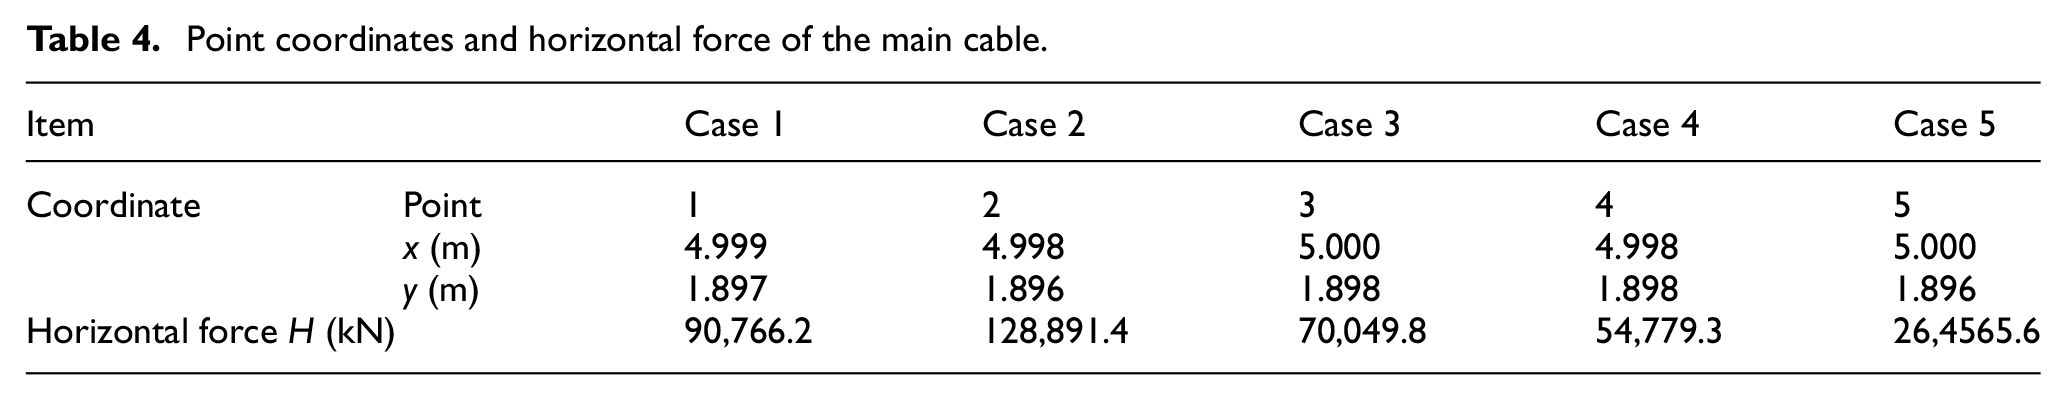
Table 4 shows the horizontal force of the main cable identified by the five cases, where cases 1–5 correspond to points 1–5, respectively. It can be seen from Table 4 that although the coordinate variation of point Q is only 1 mm, the identified horizontal force of the main cable is quite different. From the results of cases 1, 4, and 5, it can be seen that the change of the supplementary measurement point Q in the normal direction of the main cable will cause a sharp change in the horizontal force of the main cable. The horizontal force of the main cable at point 4 is significantly reduced because of the measurement point moving outward, similar to the effect of relaxing the main cable and increasing the unstrained length of the main cable segment between both ends. Point 5 is shifted inward, which is equivalent to tightening the main cable and shortening the unstrained main cable segment between the two endpoints, thus, results in a substantial increase in the main cable force. From the results of cases 1, 2, and 3, if the coordinate of point Q changes to point 2, the effect is similar to that of tightening the main cable, that is, the horizontal force is increased. Meanwhile, point 3 is similar to the relaxation of the main cable, that is, the reduction of the horizontal force is made.
Hanger forces identified in the five cases are shown in Figure 8(a) along with the design values. The relative errors are shown in Figure 8(b). The error of case 5 is the largest, and the relative error has reached 200%, followed by those of cases 4, 2, and 3. The error of case 1 is the smallest. Although the horizontal force of the main cable changes abruptly, the catenary parameters ai are still relatively close (as shown in Figure 9), and the error magnitude is always at the 100,000-digit position. In summary, in Method I, the subtle measurement error, even if it is in the millimeter scale, still has a significant impact on the hanger force assessment. Therefore, the solving method based on the supplementary measurement of point coordinate has high sensitivity to geometric measurement accuracy and is relatively unstable.
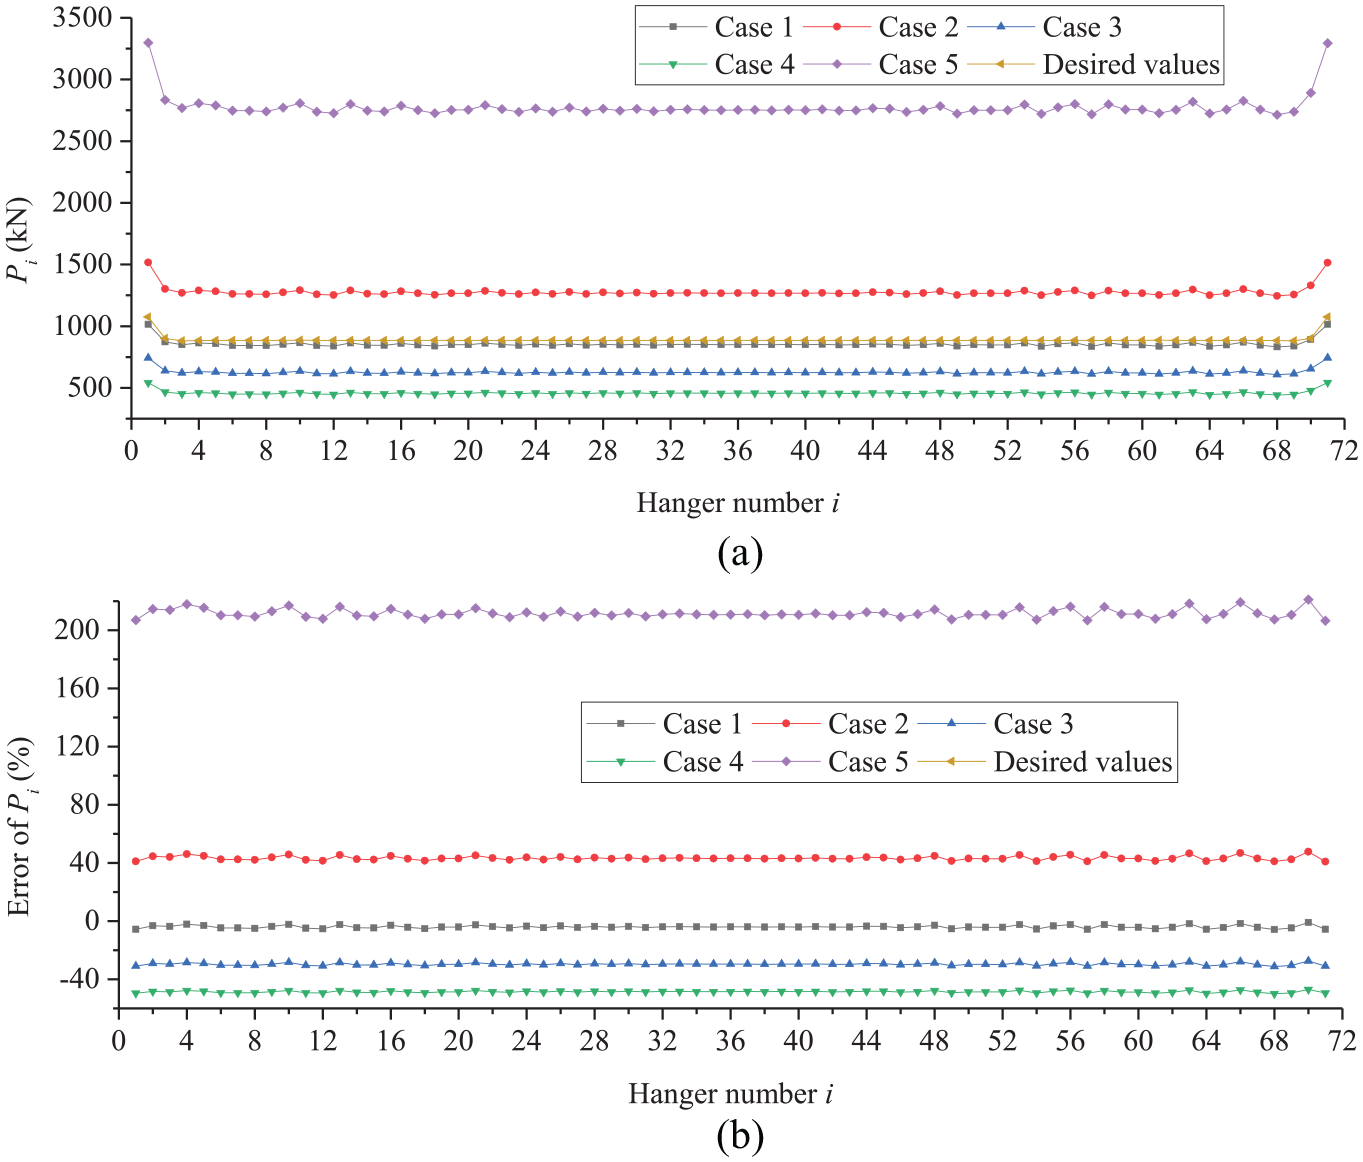
Hanger tensile forces: (a) values and (b) the relative error.
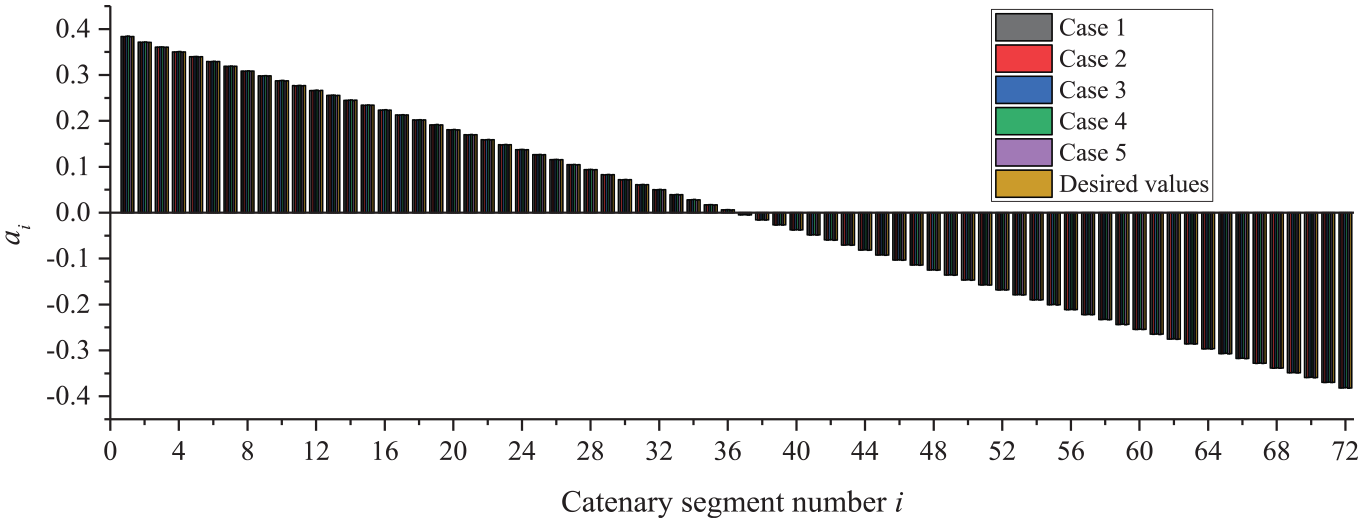
The catenary parameter ai.
Method II
Considering that the side hanger force P1 measured by the frequency method has certain randomness, the P1 is artificially adjusted by a magnitude of 20 kN (about 2% of the hanger force). With the 1010, 1030, 1050 (original measured value in section “Hanger force assessment”), 1070, and 1090 kN as the virtual hanger forces, respectively, the cases 6–10 are established. Case 8 corresponds to the result in section “Hanger force assessment.” The horizontal force of the main cable was then calculated, as listed in Table 5.
The tensile force of the side hanger, P1, and the corresponding horizontal force of the main cable, H.

After the artificial change is applied to the side hanger force P1, the horizontal force H of the main cable is linearly changed with P1, as shown in Figure 10. In the regression analysis, the correlation coefficient of the two is very close to 1. As P1 increases, H also increases. The variation of P1 per 1 kN causes a change of 76.13 kN in H, that is, a 1% error in P1 causes a 0.81% error in H.
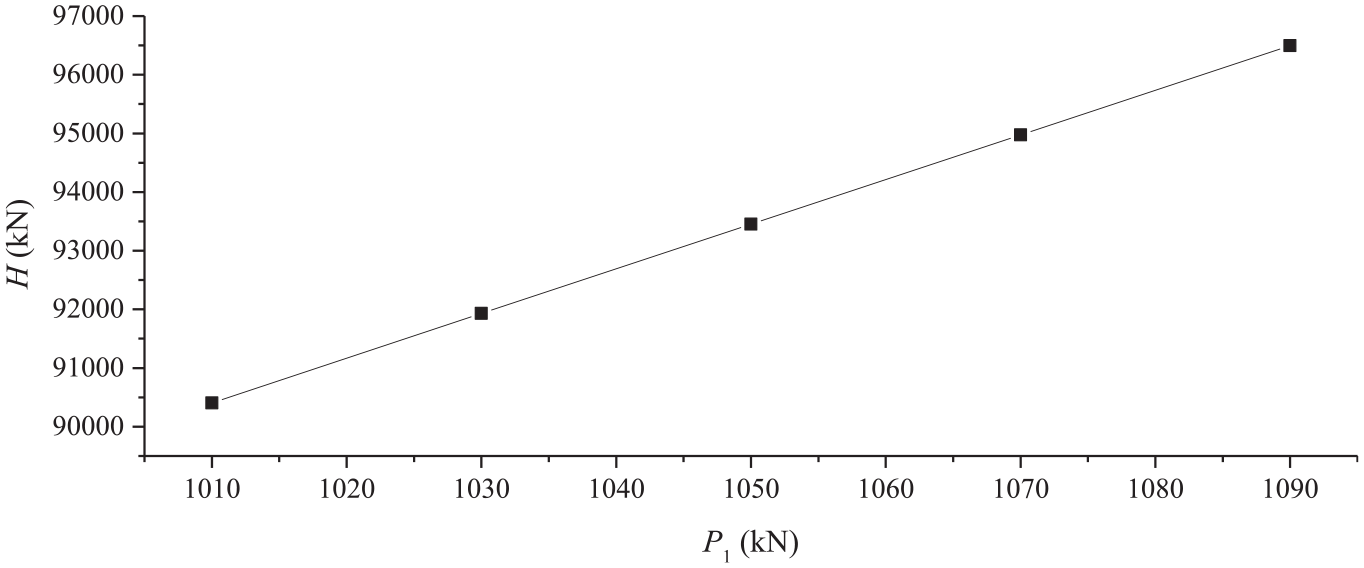
A linear relationship between H and P1.
The hanger forces derived for cases 6–10 are shown in Figure 11(a) along with the design values. The relative error is depicted in Figure 11(b). It can be seen that the assessment error of the hanger force is within ±6%. When the side hanger force changes by 2%, the influence on the catenary parameter ai is insignificant (Figure 12), and the hanger force variation by 20 kN causes the average change of −0.00001 of ai. So, it can be considered that the main cable configuration in cases 6–10 is the same. In summary, Method II, which takes the measured long hanger force as the control condition, is less sensitive and more reliable than Method I.

Hanger tensile forces: (a) values and (b) the relative error.
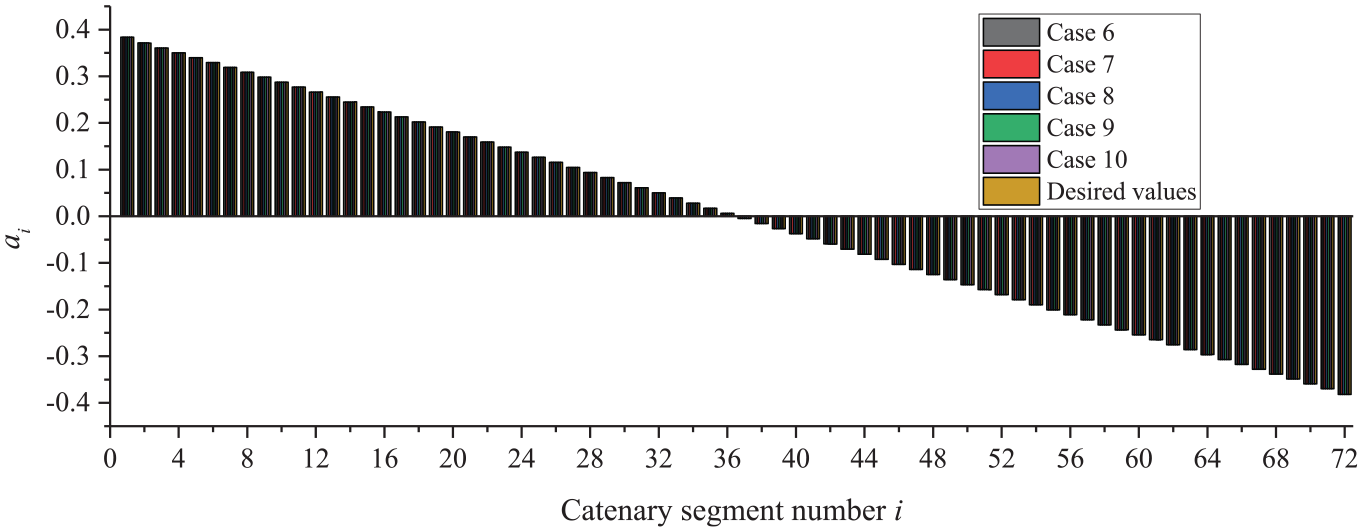
The catenary parameter ai.
It was found that P1 has almost a linear relationship with the horizontal force H of the main cable. To study whether the remaining hanger forces and H have a similar linear relationship, the calculated values of the hanger forces Pi (i = 2–71) in cases 6–10 are illustrated, with H as the horizontal axis and Pi as the vertical axis, showing the relationship between the two. The results for some hangers are shown in Figure 13. As can be seen from the figure, multiple data points of a hanger are distributed along a straight line. These data points are fitted in order by a linear relationship. The results of the regression analysis show that the correlation coefficient between P2–P71 and the horizontal force H of the main cable is very close to 1, so it can be considered that there is also a linear relationship.
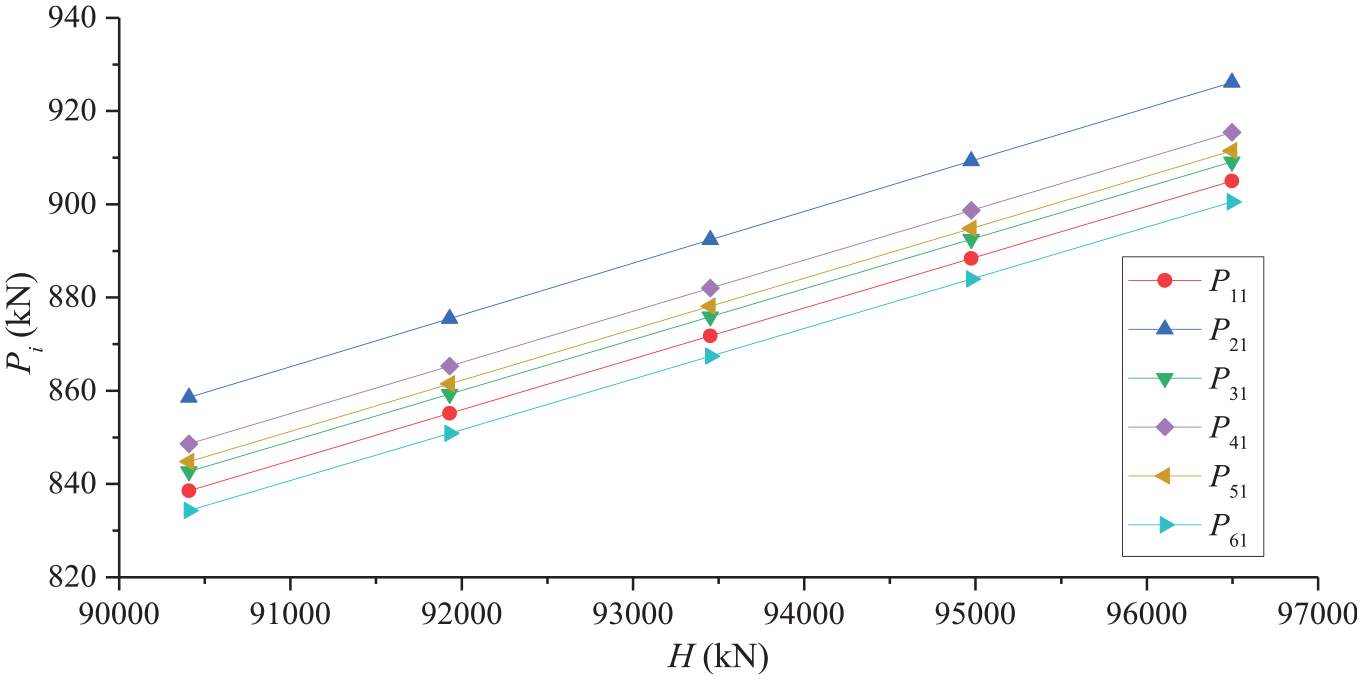
The relationship between H and Pi.
Conclusion
Based on the multi-segment catenary theory and the measured configuration of the main cable, an analytical algorithm for the reverse assessment of hanger forces of a suspension bridge is proposed. Starting from the geometric compatibility condition and the mechanical balance condition, the relationship between the hanger tensions and two key parameters, that is, the parameter of main cable configuration and the horizontal force of the main cable, is discussed, in which the effect of saddle arc is considered. The expression for the hanger force is then derived. The horizontal force of the main cable is solved by supplementing a geometric condition or a mechanical condition and then used to calculate the hanger forces. The proposed method was successfully applied to the real suspension bridge with a main span of 730 m and 71 pairs of hangers, and the sensitivity analysis of the algorithm was carried out. According to the calculation results, the following conclusions can be drawn:
Only the measured coordinates of the hanging points of the main cable and the saddle apex are insufficient to identify the suspension bridge hanger forces. It is also necessary to add a geometric condition (to test the coordinates of a non-hanging point on the main cable) or a mechanical condition (the tension of a long hanger is measured by the frequency method).
The method can accurately identify all hanger forces of the suspension bridge, effectively avoiding the problem of “poor precision in the short hanger force measured by the vibration frequency method.” The method has a clear concept and physical meaning; it is convenient in use and suitable for implementation.
With the method of “supplementing a non-hanging point coordinates of the main cable” as an additional condition, the results of the identified hanger forces are greatly affected by the supplemental terms, which are highly dependent on the accuracy of geometric measurement and challenging to control.
The method of “measuring a certain long hanger force” as an additional condition can effectively identify the remaining hanger forces. The sensitivity of this algorithm is low, and the recognition result is less affected by the supplemental terms and easy to control.
The main cable horizontal force H is very close to the linear relationship of each hanger tension Pi. For the Jindong Bridge taken as an example in this study, a 1% error of the side hanger force P1 causes a 0.81% error in H.
Footnotes
Declaration of Conflicting Interests
The author(s) declared no potential conflicts of interest with respect to the research, authorship, and/or publication of this article.
Funding
The author(s) disclosed receipt of the following financial support for the research, authorship, and/or publication of this article: The research described in this study was financially supported by the NSFC under the grant 51678148, a project supported by the Natural Science Foundation of Jiangsu Province (BK20181277), and the National Key R&D Program of China (No. 2017YFC0806009), which are gratefully acknowledged.