
Abstract
Due to the strike of wind-blown raindrops, the pressure caused by wind and rain on building facades is different from the action of wind-only. The wind–rain induced pressure during Typhoon Haikui (2012) was collected at three taps on the windward side of Tongji University experimental building which was located near the coast of East China Sea. The observed data during the storm was compared with both the data of normal wind events without rains and wind tunnel test. The results show that the presence of driving rains intensifies the wind effects acting on the windward side of the building. More specifically, the mean wind–rain induced pressure coefficients at the three locations of the experimental building are larger than those collected from the strong wind-only events and the wind tunnel test when the wind direction ranges from 110° to 130°. It was also found that the mean wind–rain induced pressure coefficients at each tap increase in magnitude with rainfall intensity and the distance between the pressure tap and the wall corner. Similarly, the fluctuating wind–rain induced pressure coefficients are larger in comparison to the wind-only pressure coefficients from the full-scale measurement and wind tunnel test. However, the coefficients decrease with the distance from the wall corner in the case of 80°–140° wind directions. In addition, it was found that Gamma distribution is a robust model to represent the probability distribution of the wind–rain induced pressure coefficients. High quality of pressure correlation was observed among three taps, regardless of the rainfall intensity. By contrast, the presence of driving rains slightly reduces the correlation of wind–rain induced pressure.
Introduction
As a major disaster that often take place along with heavy rainfall (Mohammad et al., 2017; Peng et al., 2016), typhoons inflict serious economic losses and casualties in China every year, which pose a threat to buildings and infrastructures in coastal area (Mao et al., 2018, 2019; Wang et al., 2013a, 2019). Strong winds combined with driving rain during typhoons impose a force on buildings that is significantly different from the wind-only effects. More specifically, the raindrop driven by strong winds strikes the building surfaces, which exerts additional pressures on the building envelope and consequently enlarges the wind effects on buildings. According to post-storm surveys in the southeast coastal area of China, many low-rise buildings experienced severe structural damages to their exterior walls during typhoons, such as cracking, partially or fully collapse of exterior walls (Huang et al., 2010). These damages are often caused by a combination of strong winds and wind-driven rains. In the field of wind engineering, previous studies are predominately focused on the characteristics of wind effects on the envelope of buildings, and extensive research achievements have been obtained (Cochran and Cermak, 1992; Ginger and Holmes, 2001; Huang et al., 2014). As a branch of wind engineering, wind–rain induced pressure (WRIP) issue has been widely investigated and these existing studies primarily concern the distributions or the quantity of WRIP on the building facades. In the previous studies, four methods were adopted:
Numerical simulation using computational fluid dynamics (CFD)—This methodology helps to avoid time-consuming, expensive field measurement, or reduced-scale wind tunnel test. It is becoming popular with the development of CFD, and it can provide more detailed and accurate information than other methods (Blocken et al., 2011). Souster (1979) and Choi (1993) were the first to utilize CFD technique to simulate WRIP on buildings. Choi’s technique was applied by following researchers to assess the WRIP exposure of building facades (Blocken and Carmeliet, 2004, 2006; Blocken et al., 2011; Choi, 1997; Etyemezian et al., 2000; Lakehal et al., 1995, Kubilay et al. 2017).
Semi-empirical models (Straube and Burnett, 2000), including the International Organization of Standardization model proposed by the European Standard Committee in 2009 and the model developed by Straube and Burnett in 2000—The semi-empirical models establish the relationship between the intensity of WRIP and contributing meteorological parameters, such as wind speed, wind direction, and horizontal rainfall intensity (RI). The advantage of semi-empirical methods is their ease-of-use, whereas their main disadvantage is the rough estimate of the WRIP exposure (Blocken and Carmeliet, 2004).
Experimental simulation (Baheru et al., 2014a, 2014b; Bitsuamlak et al., 2009; Fu et al., 2015; Fu and Li, 2019; Inculet, 2001)—This methodology provides means for testing building models under realistic WRIP conditions. In experimental setup, the realistic representation of the parameters of wind and WRIP is warranted to reproduce WRIP effects and develop useable test-based data of rainwater deposition and intrusion through building envelope. In recent years, laboratory simulation of WRIP is favored because it can solve esthetic problems such as discoloration of facades and formation of soiling pattern.
Field measurement (Nore et al., 2007; Surry et al., 1994)—Field measurements have been the most primary and direct tool in researching the WRIP. A well-designed field measurement can provide valuable data for the study of WRIP and help to improve the CFD and semi-empirical models.
In 2010, Tongji University commenced a project of full-scale measurements of wind effects on a low-rise building that is located on the eastern coast of Shanghai (Huang et al., 2012). In this study, the WRIP data on the experimental building during the Typhoon Haikui (2012) were collected. In addition, a wind tunnel study was conducted to quantify the wind pressures on a scaled model of the experimental building. By comparing the results from the field measurements and the wind tunnel tests, the impact of driving rain on the wind loading of the building was evaluated. Moreover, the probability characteristics of the WRIP coefficients on the components and cladding of the building were also identified. This study will improve the structural design with respect to resisting the pressures as a result of combined high winds and driving rain, especially for low-rise buildings.
Experimental setup and data processing
Field measurement
The Tongji University field measurement base is at Shanghai’s Pudong district and near the mouth of the Yangtze River. As shown in Figure 1, the surrounding terrain is relatively flat, which is in accordance with the terrain category B specified in the Chinese Load Code (GB 50009-2012, 2012). A lattice towers with the height of 40 m were built to measure the wind velocity at various elevations, as shown in Figure 2. Three types of anemometers were used: three-dimensional (3D) sonic anemometers (R.M. Young 81000), two-dimensional (2D) sonic anemometers (R.M. Young 85106), and propeller anemometers (R.M. Young 05305V). The sampling frequency was 4 Hz, and the anemometers were installed at heights of 10, 20, 30, and 40 m, respectively, to record the wind speed and direction. The 0° wind direction corresponds to north. Positive wind directions were defined by clockwise rotation. The experimental building is 10 m in length, 6 m in width, and 8 m in height and had the unique feature of a roof pitch which can be adjusted from 0° to 30° (see Figure 3). For this study, the roof pitch was adjusted to 0°. The detailed information of this base was provided in the study of Huang et al. (2012).
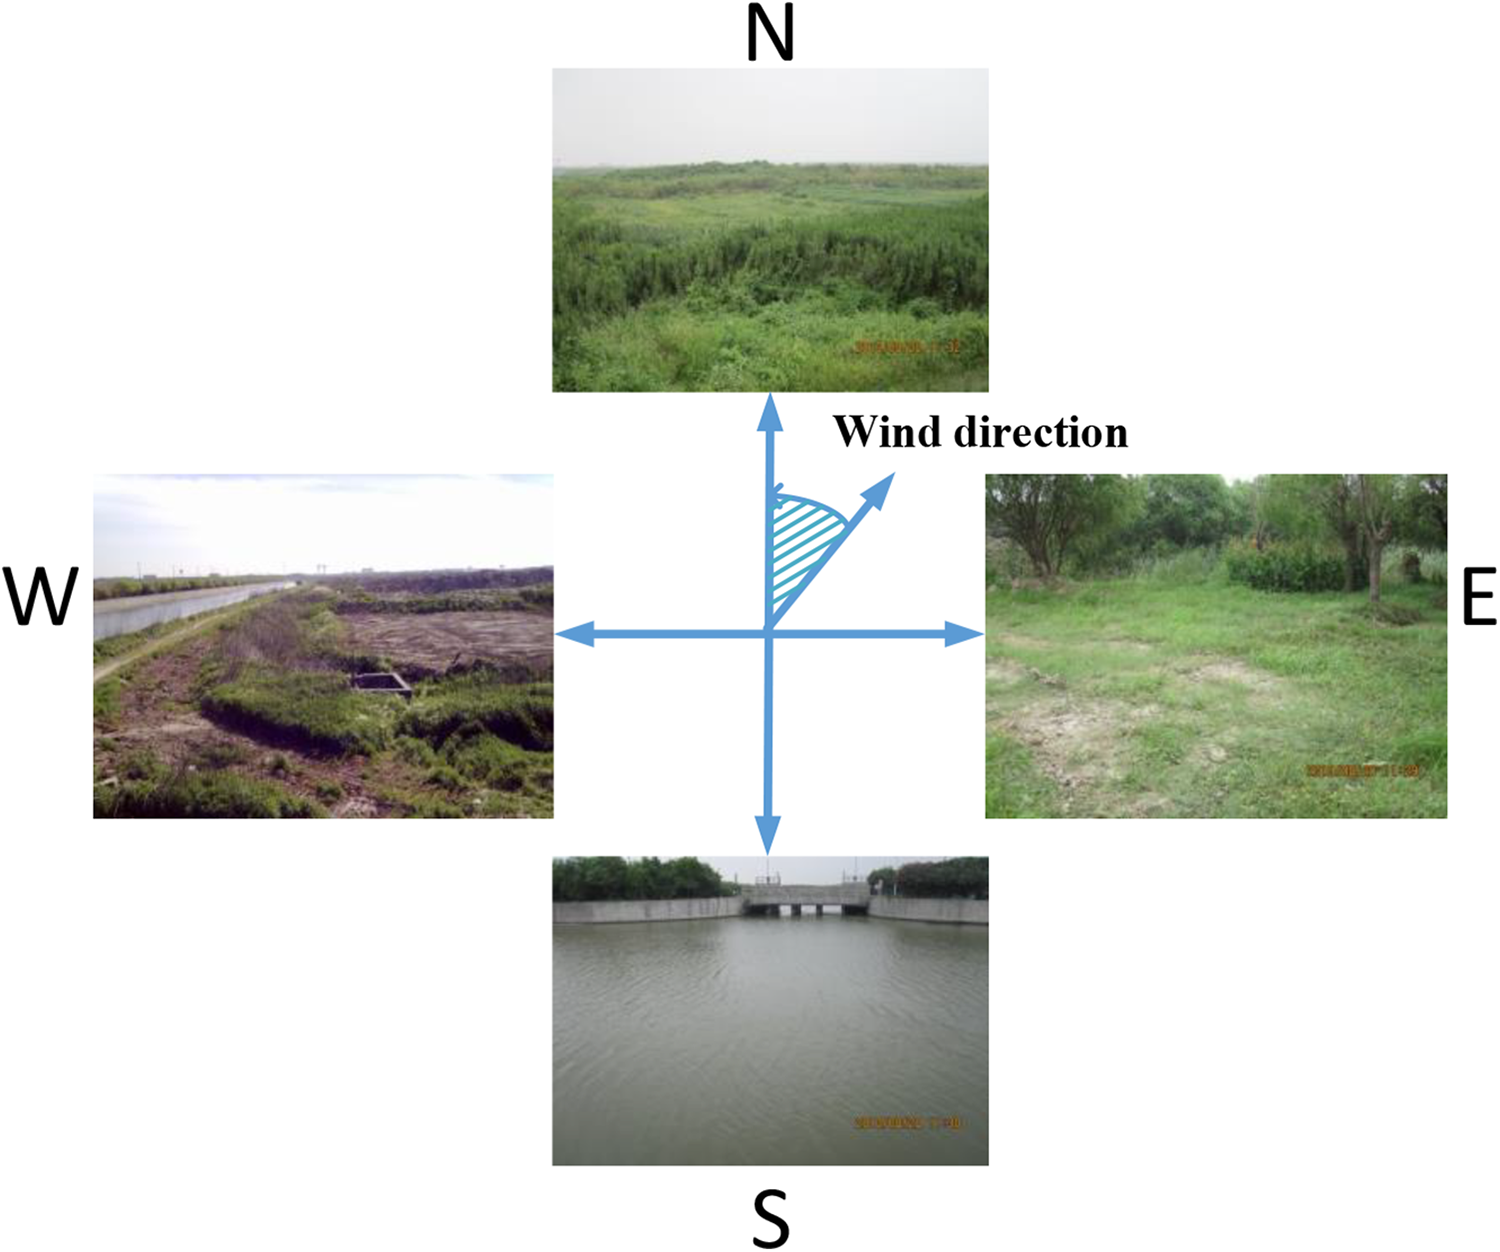
The terrain around testing building.
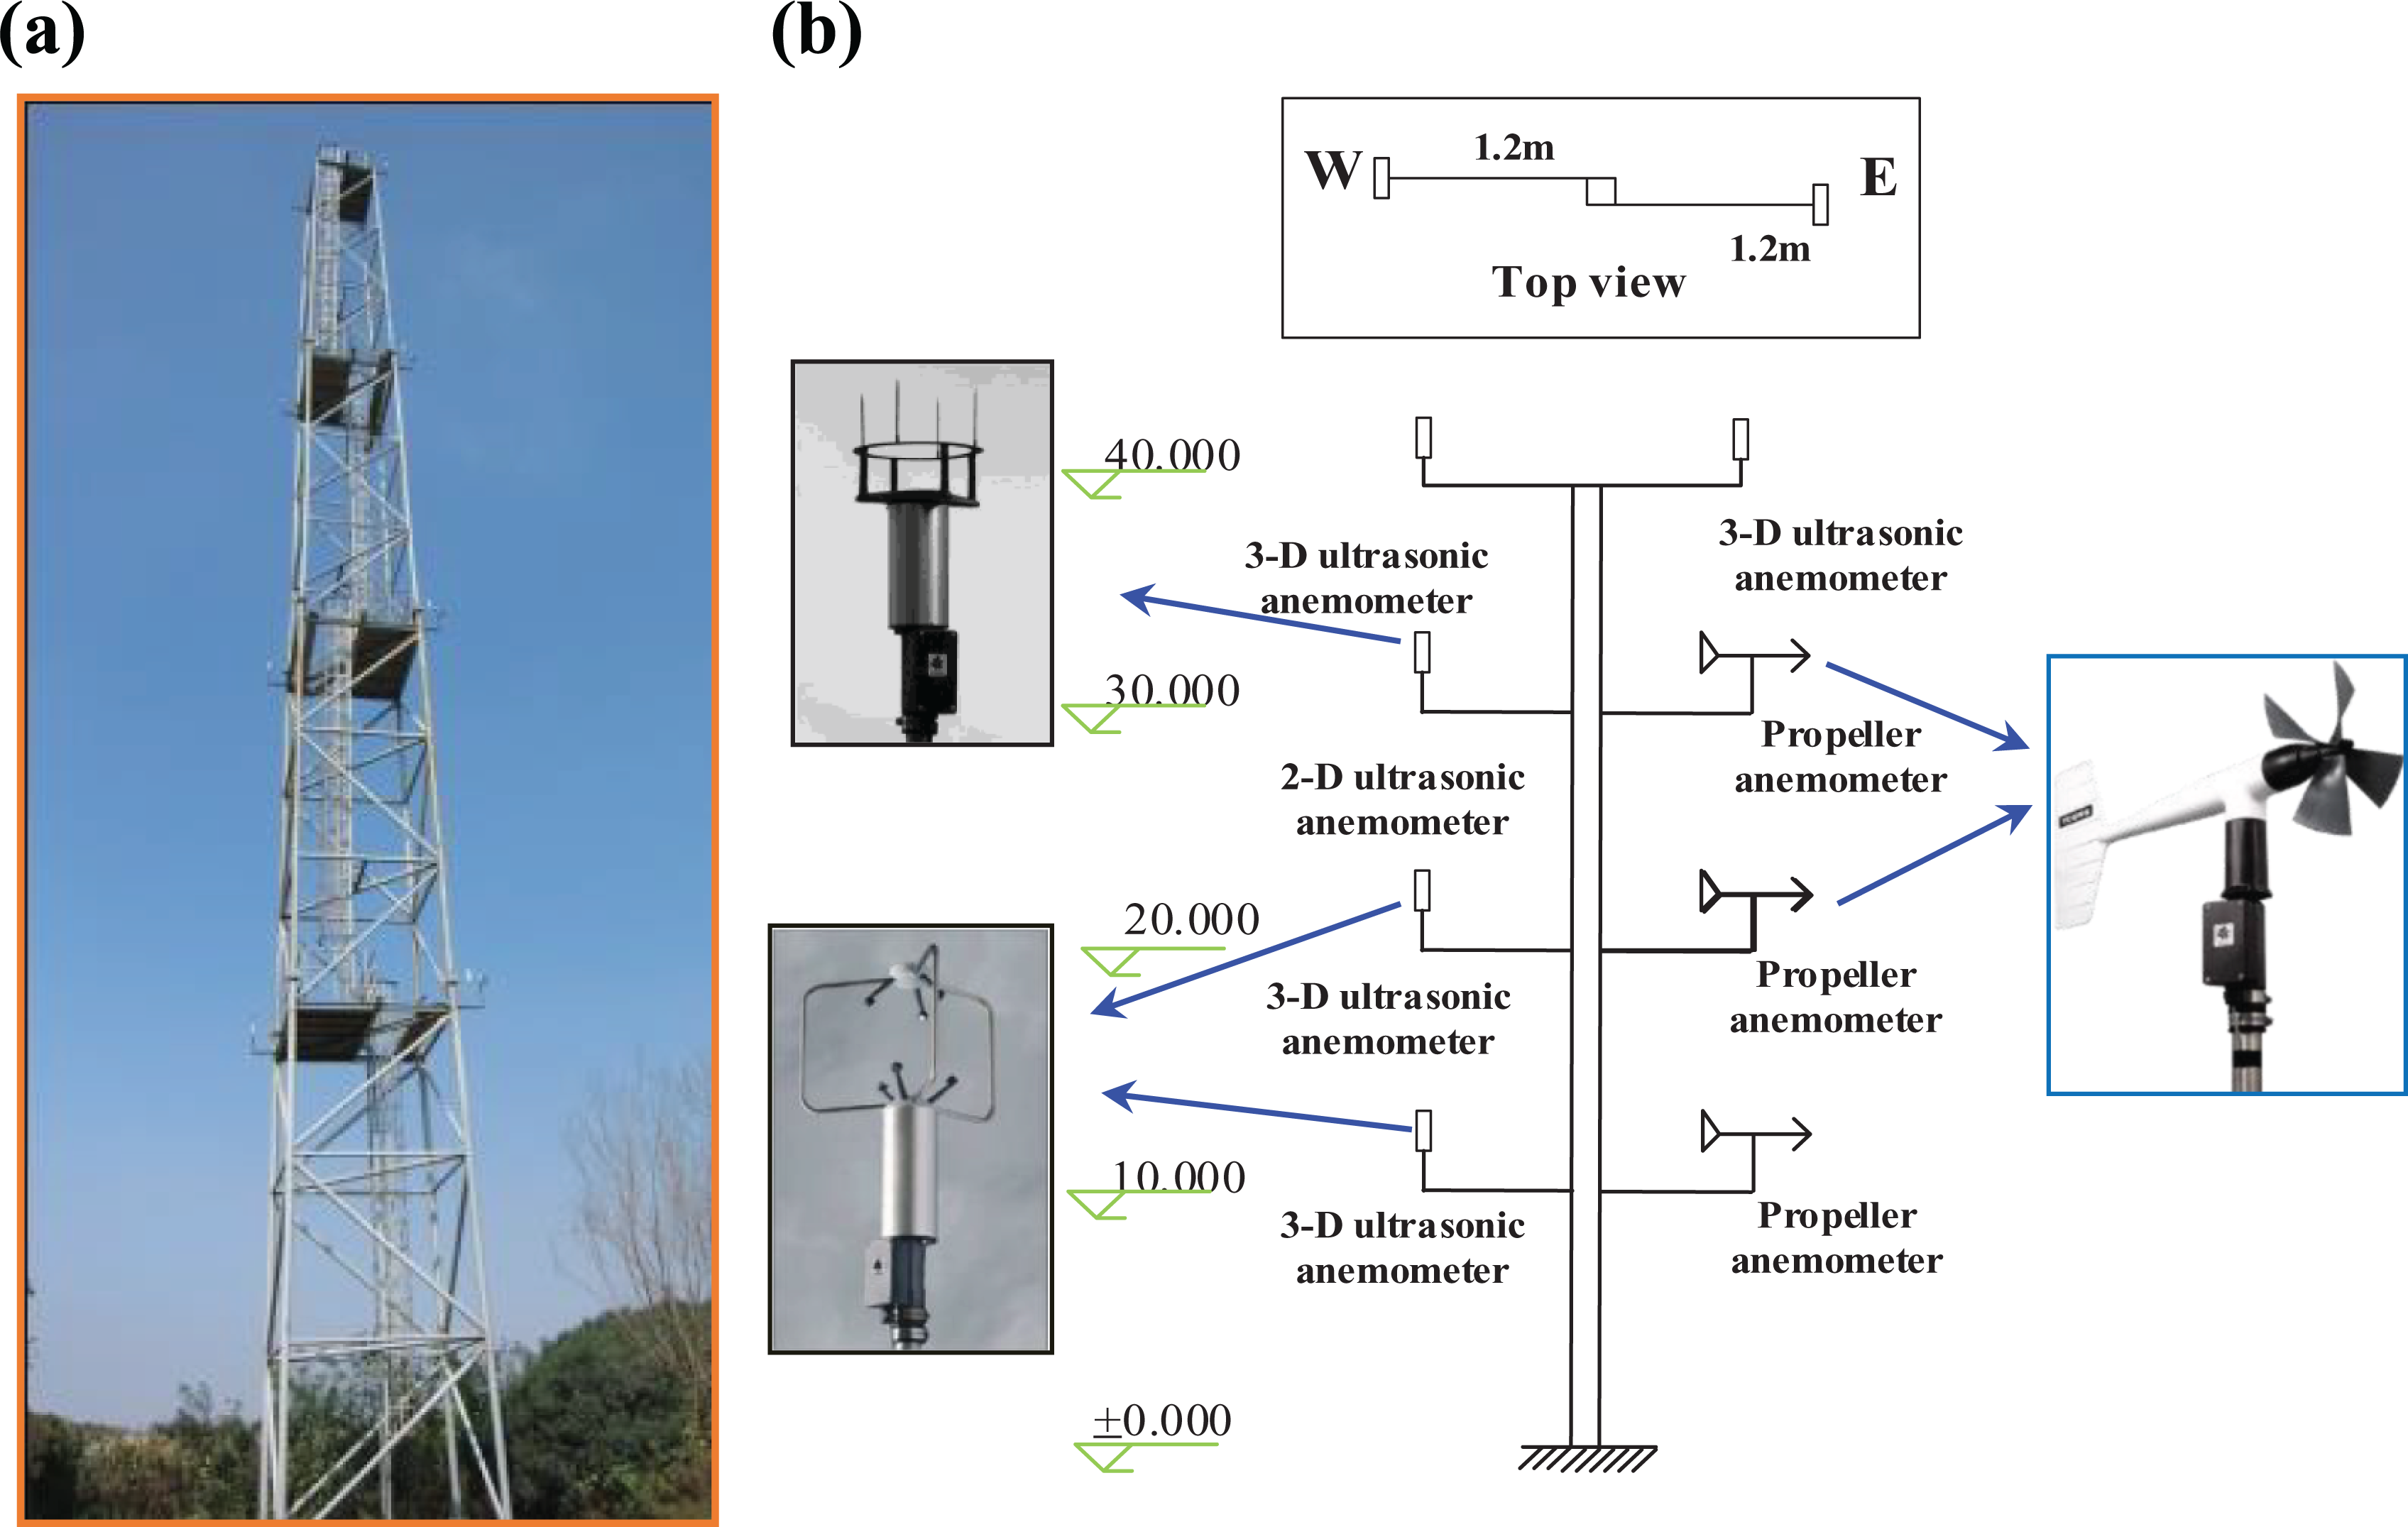
(a) Wind measurement tower with height of 40 m and (b) arrangement of anemometers.
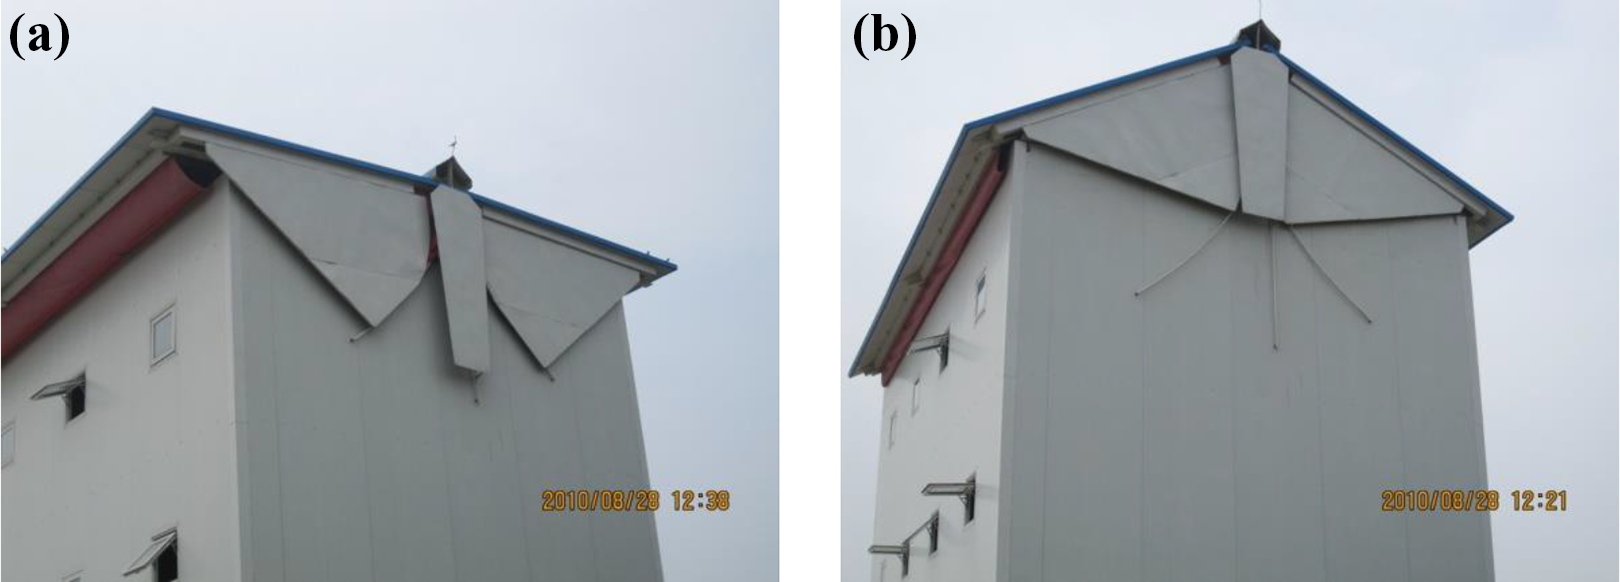
Tongji University experimental building: (a) 0° and (b) 30°.
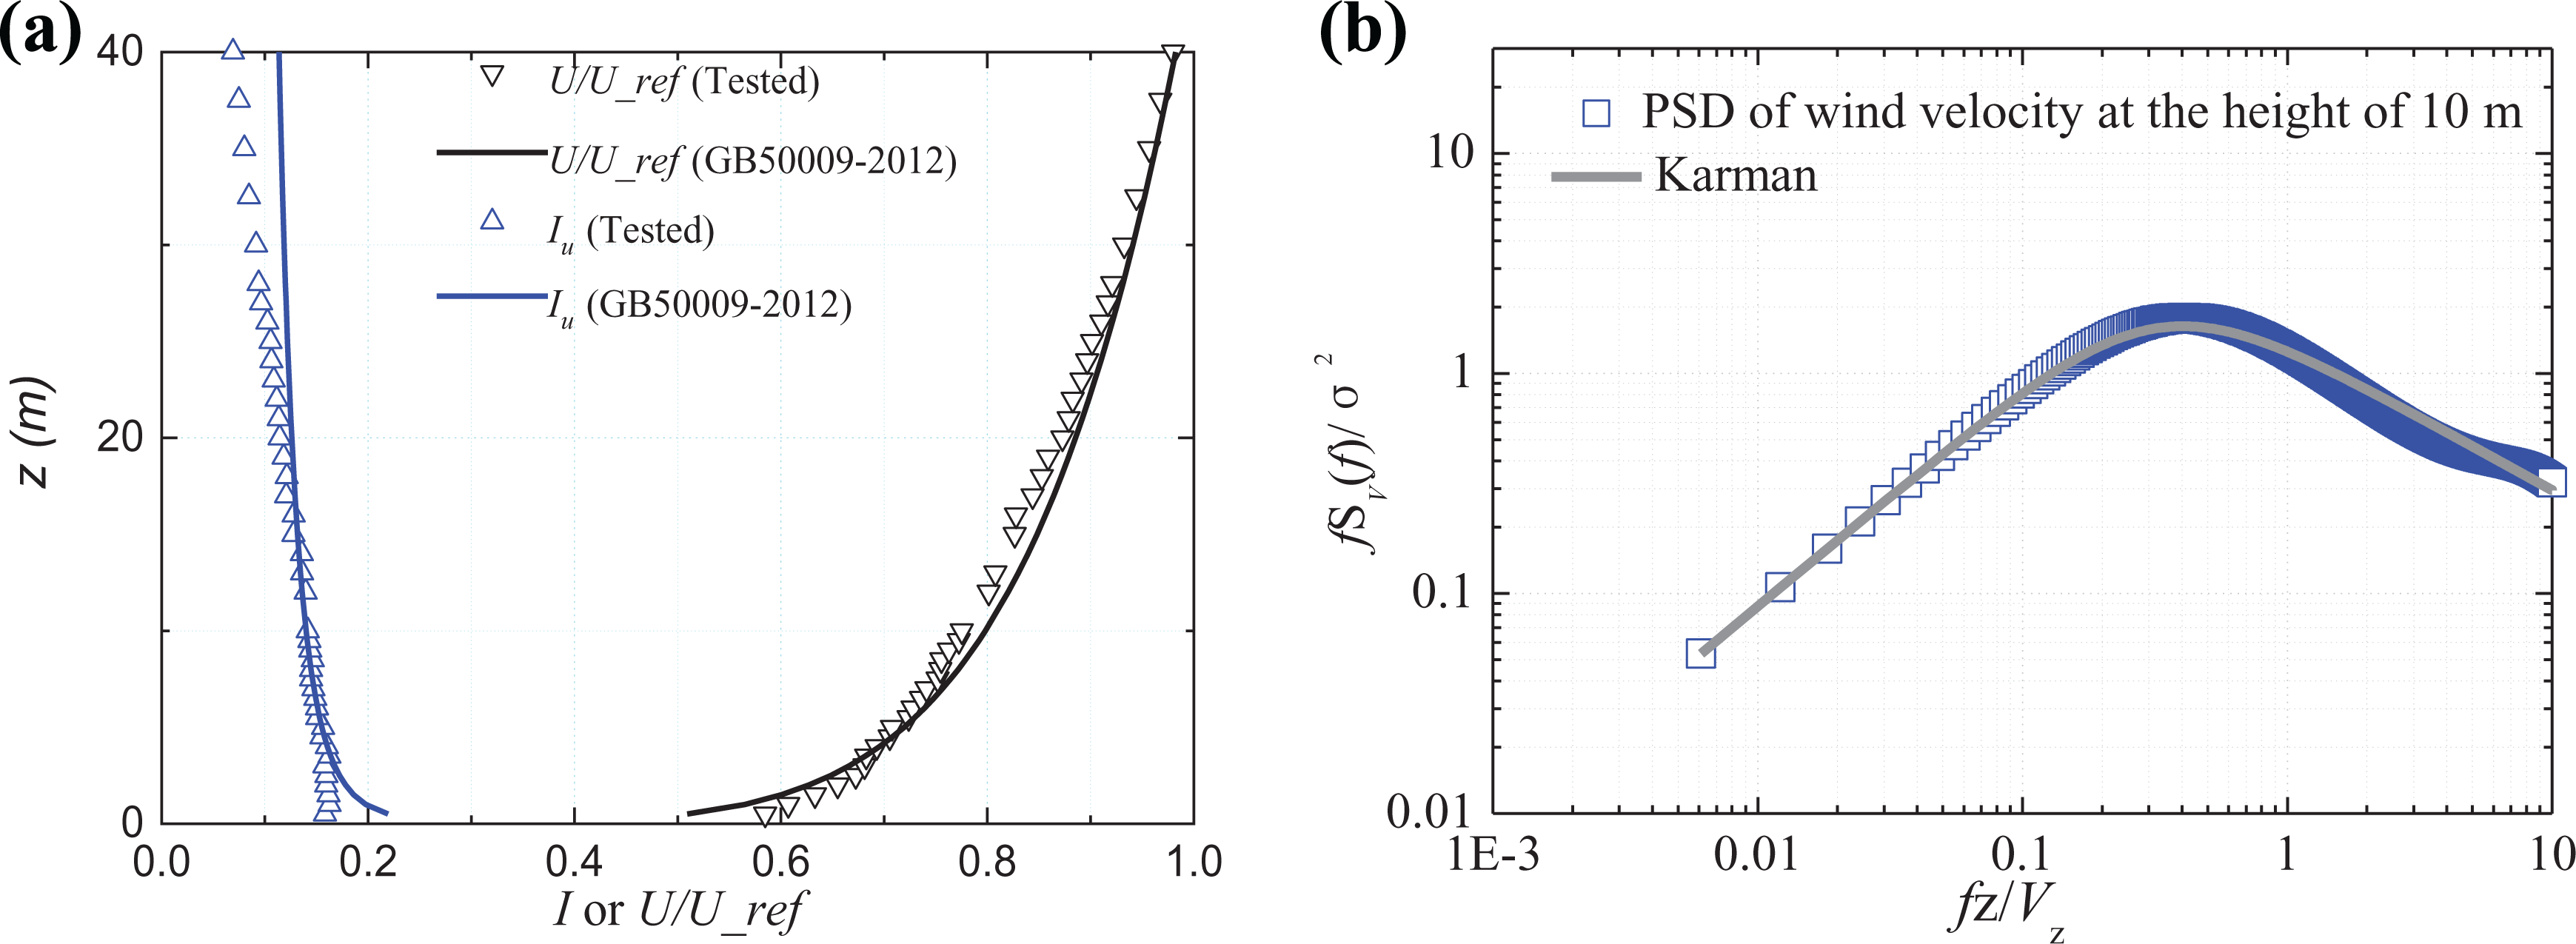
The tenth typhoon in 2012, Typhoon Haikui, brought strong wind and rainstorm in the Yangtze river delta in China. The grade of Haikui is low given by the Joint Typhoon Warning Center. The minimum pressure at the center of the typhoon was 98 kPa, and the minimum distance between the eyewall of the typhoon and the experimental building was 180 km. Figure 4 shows the observation location and a photo of the observation tower and testing building. As displayed in Figure 5, wind speed and direction data during Typhoon Haikui were obtained from eight anemometers installed at heights of 10, 20, 30, and 40 m on the 40-m tower. In addition, wind speed profile, turbulence profile, and wind speed spectra of field measurement were shown in Figures 6 and 7, which can be used to guide the atmospheric boundary layer simulation in wind tunnel. For comparison, the mean wind speed profiles and turbulence intensity profile proposed in Chinese Load Code (GB 50009-2012, 2012) and Japanese Code (Architectural Institute of Japan (AIJ), 2004) were displayed in Figure 6. In addition, the Von Karman spectrum was also added in Figure 7 to compare with tested wind speed spectra.
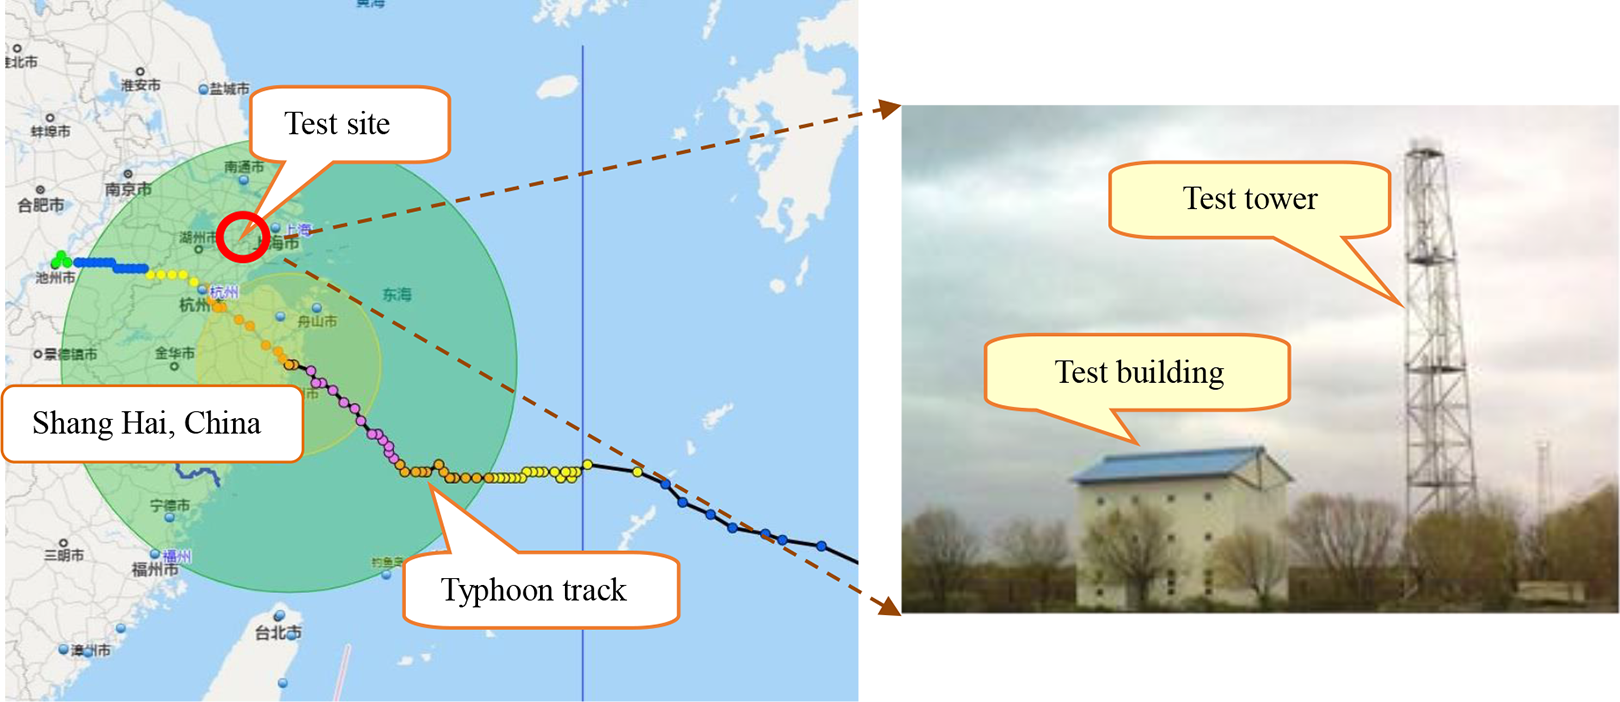
Observation location and a photo of the observation tower and testing building.
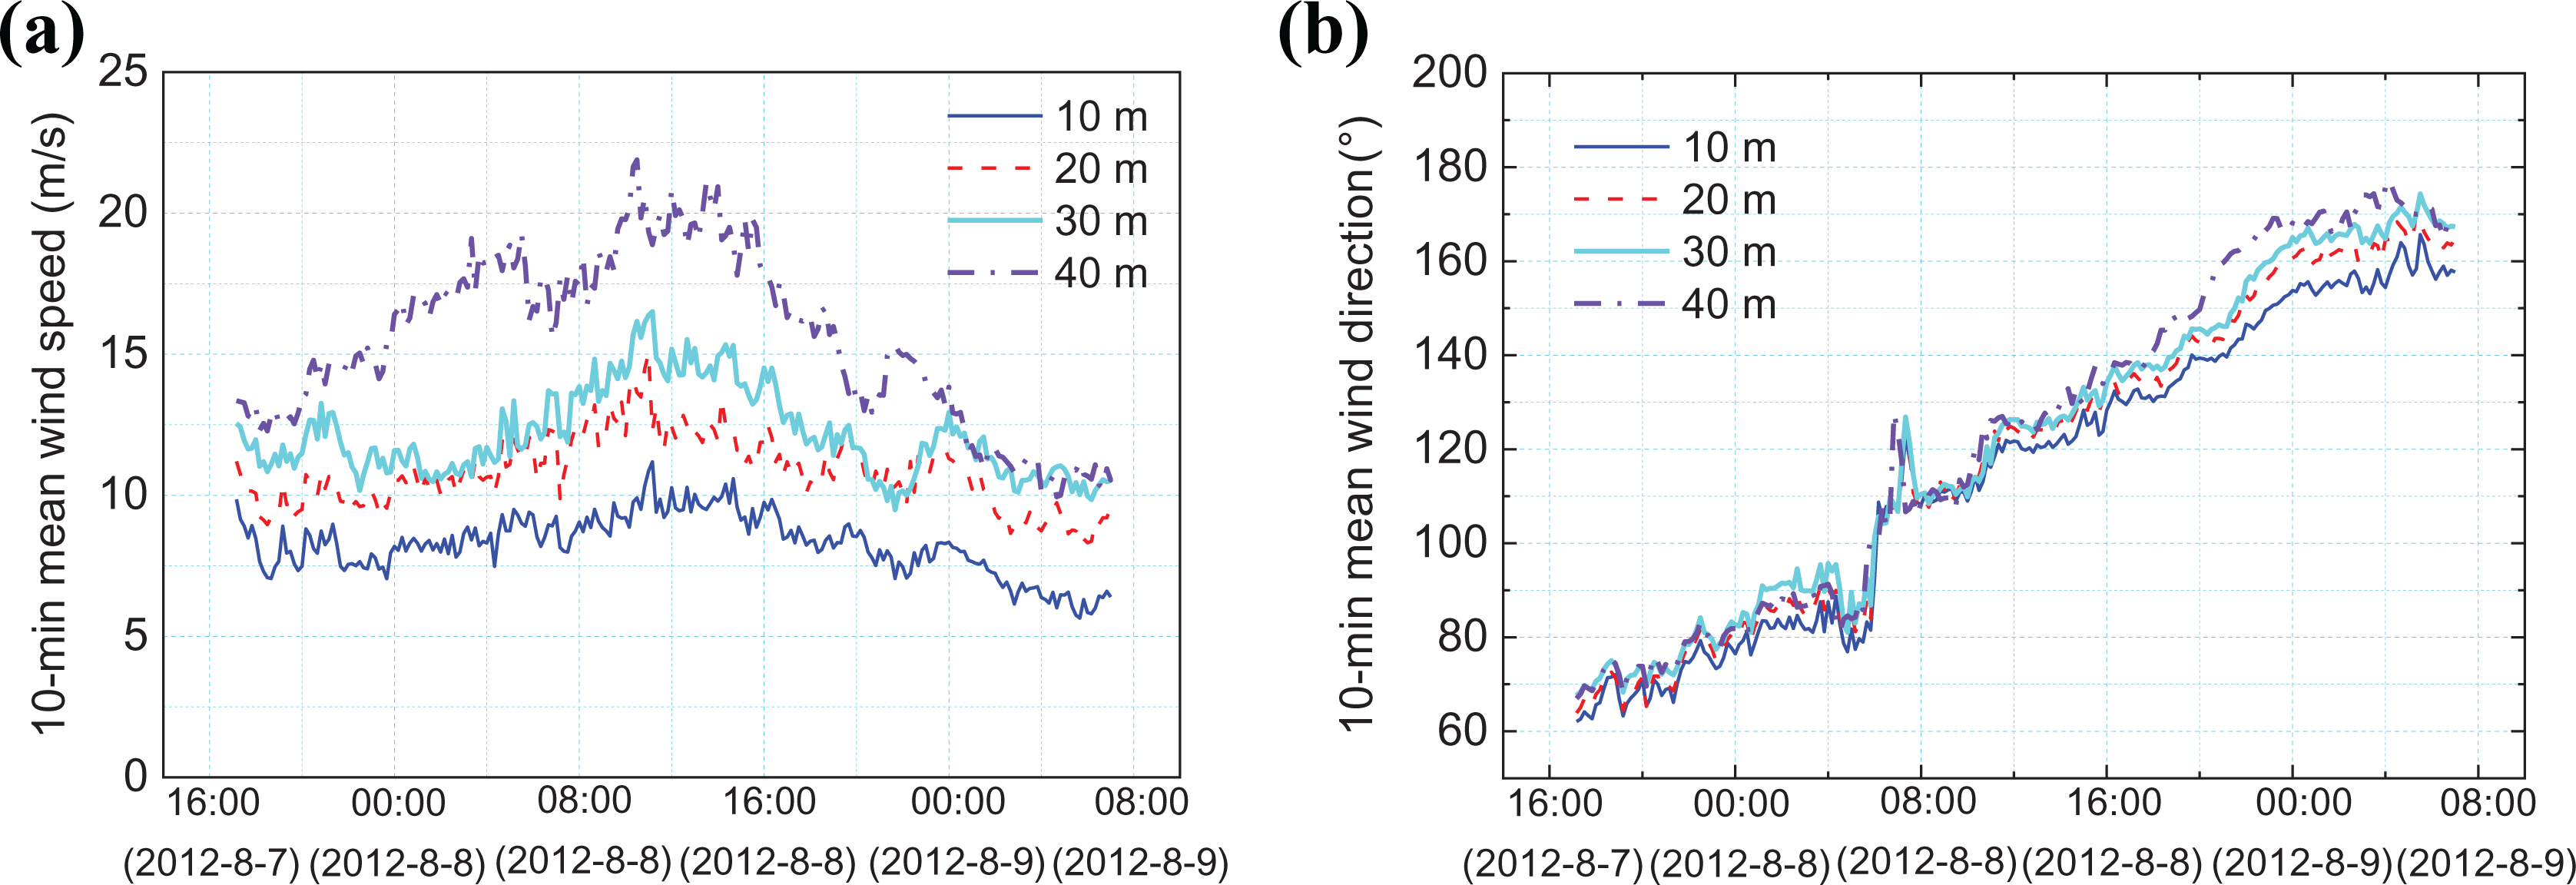
Time histories of 10-min-mean (a) wind speed and (b) wind direction at various elevations during Typhoon Haikui.
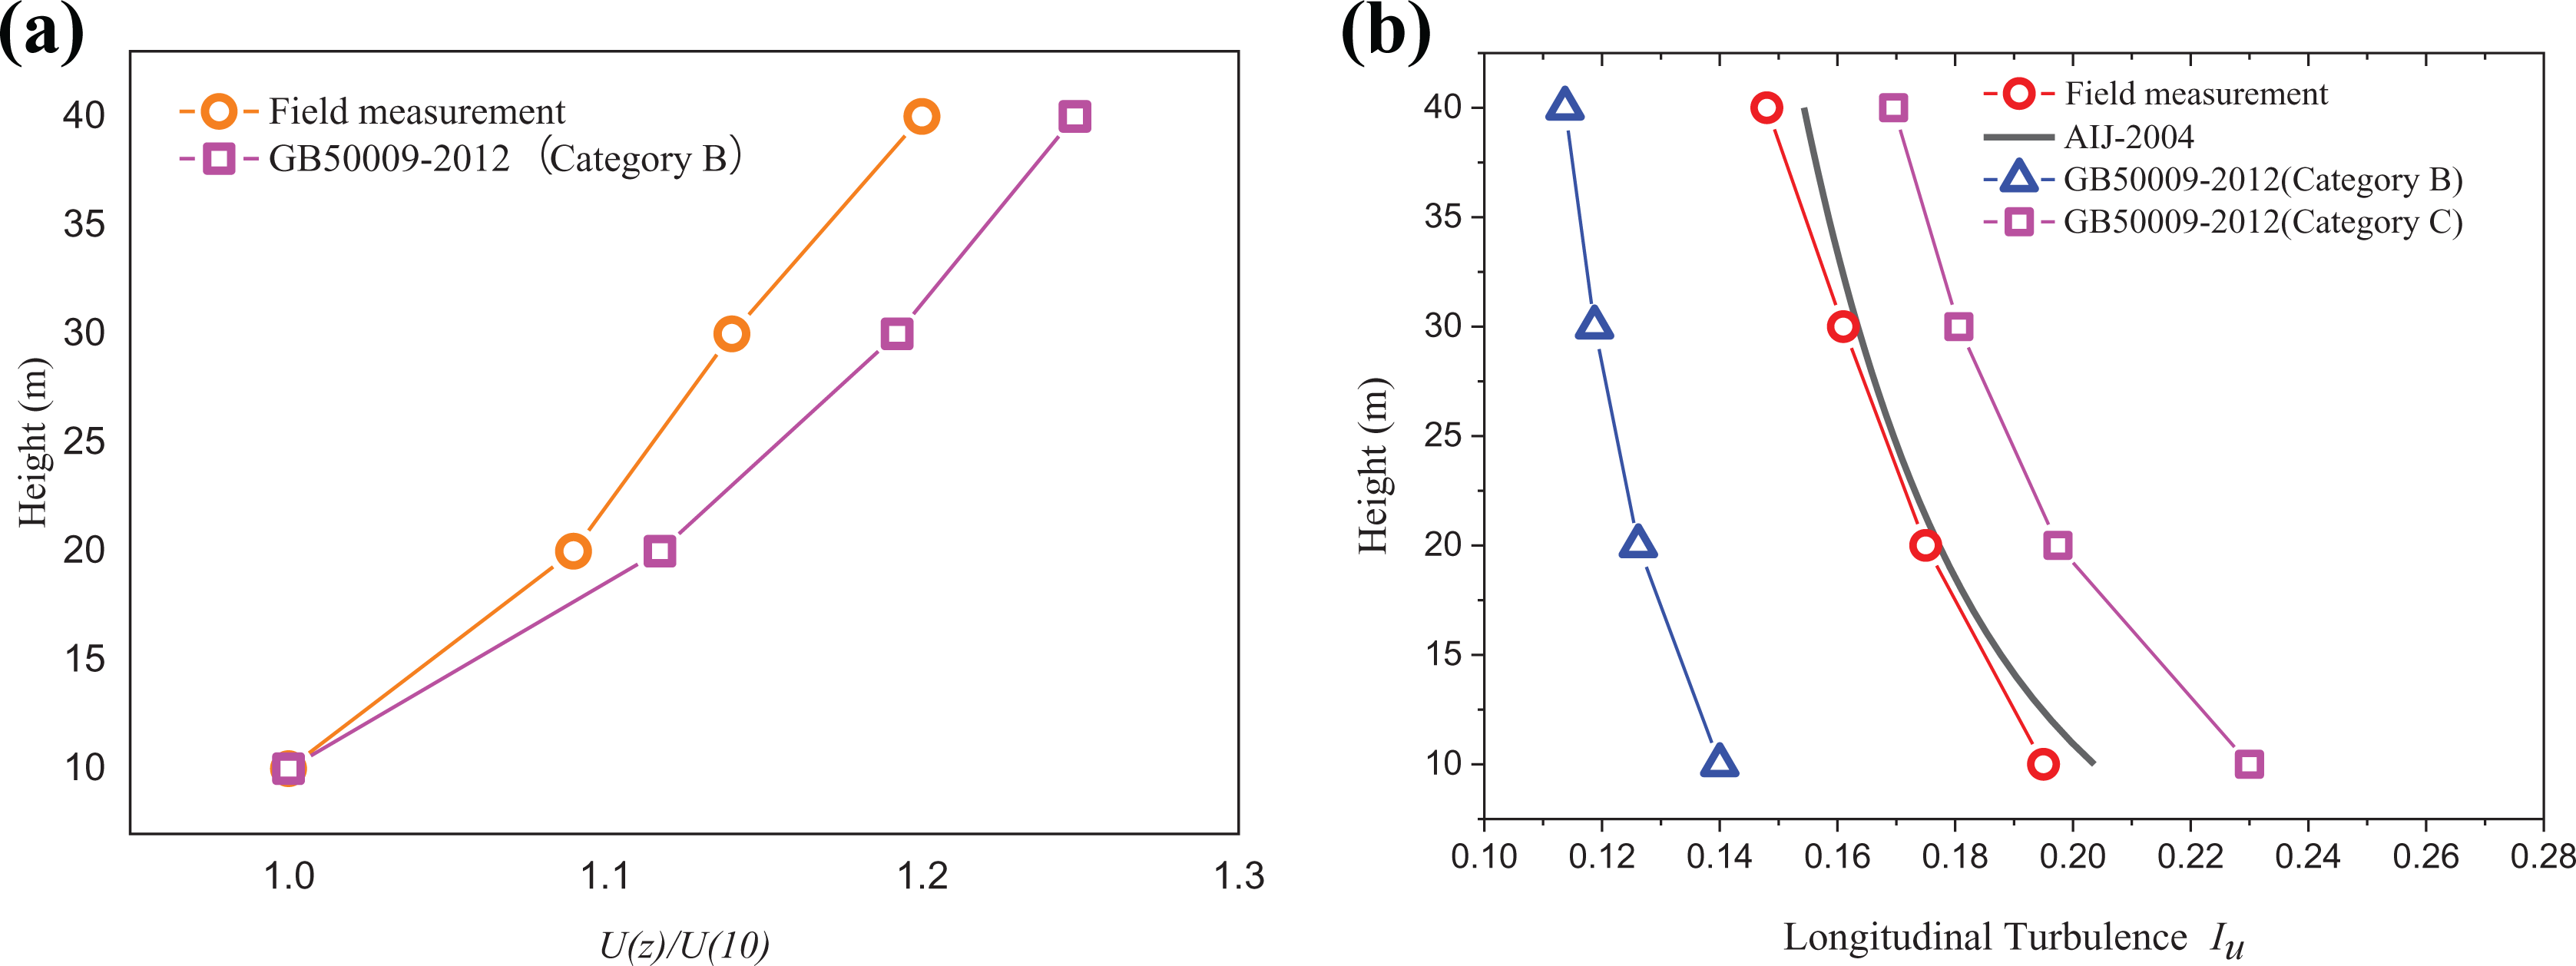
(a) Wind speed profile and (b) turbulence profile of field measurement.
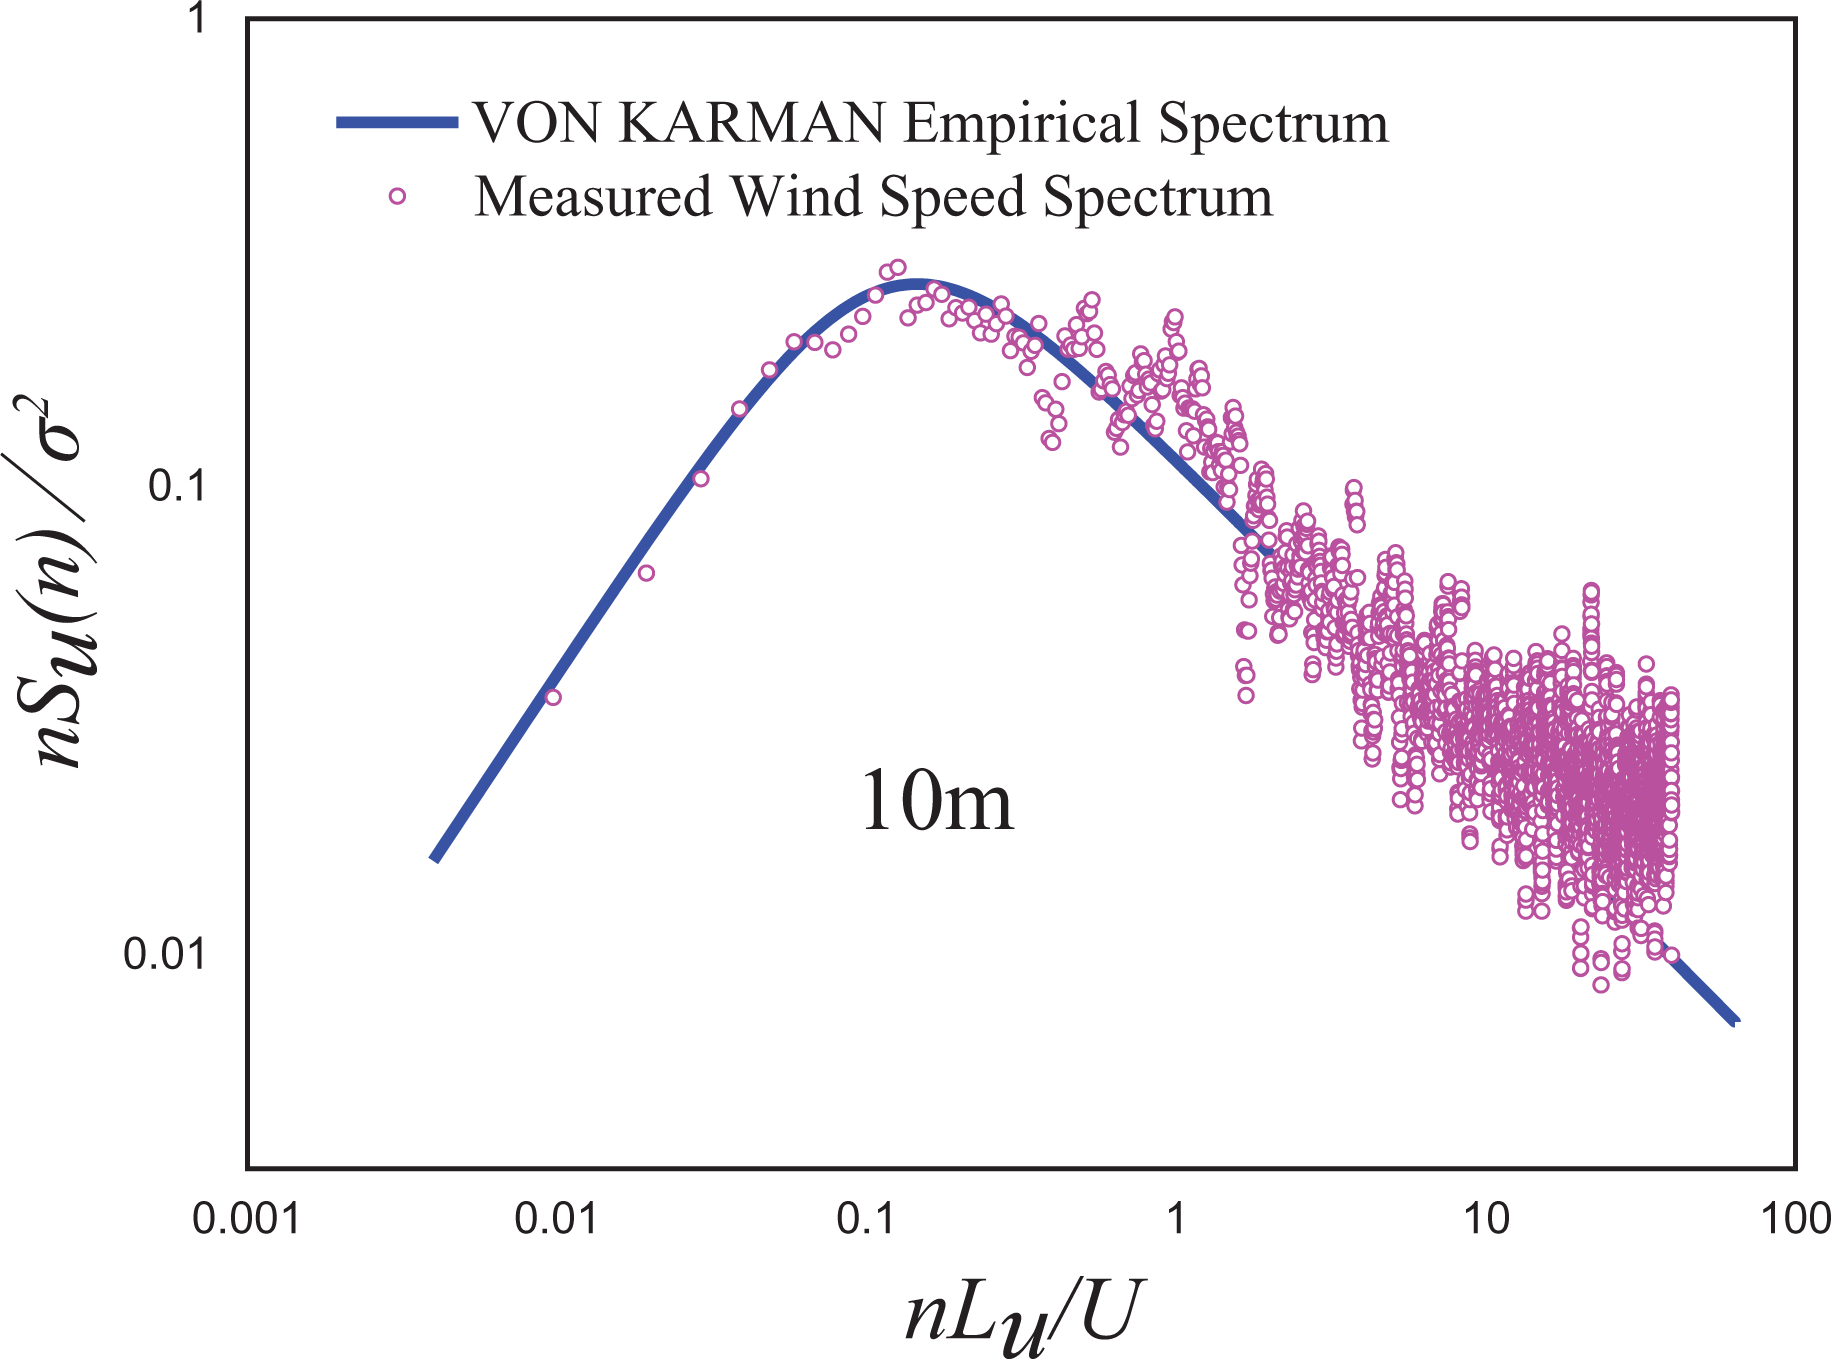
Wind speed spectra of field measurement (Lu : longitudinal turbulence intensity and Su : longitudinal power spectrum).
Wind pressure data were measured on the facades of the low-rise building during Typhoon Haikui (2012). The pressure sensors installed on the wall of low-rise building (see Figure 8) operated by a thin metal film with 20 mm diameter, which is different from micro-differential pressure sensors used by pipeline. So pipeline correction was not needed in this study. It has the advantage that it can measure the combined action of wind and rain. Before the typhoon, the zero of static pressure was calibrated inside the testing building where wind speed almost keep zero. The sensor has a wide range of pressures between 0 and ±2.5 kPa and an accuracy grade better than 0.5% full scale (FS) (fiducial error). The pluviometer with 0.1 mm resolution and 900 mL maximum water storage was shown in Figure 9 to be used to measure the RI in this study. The variation of the RI and wind direction during Typhoon Haikui is depicted in Figure 10. It was observed that the RI reaches the peak over the period from 12 pm to 4 pm on 8 August 2012. However, there is a slight change in the wind direction observed during this period.
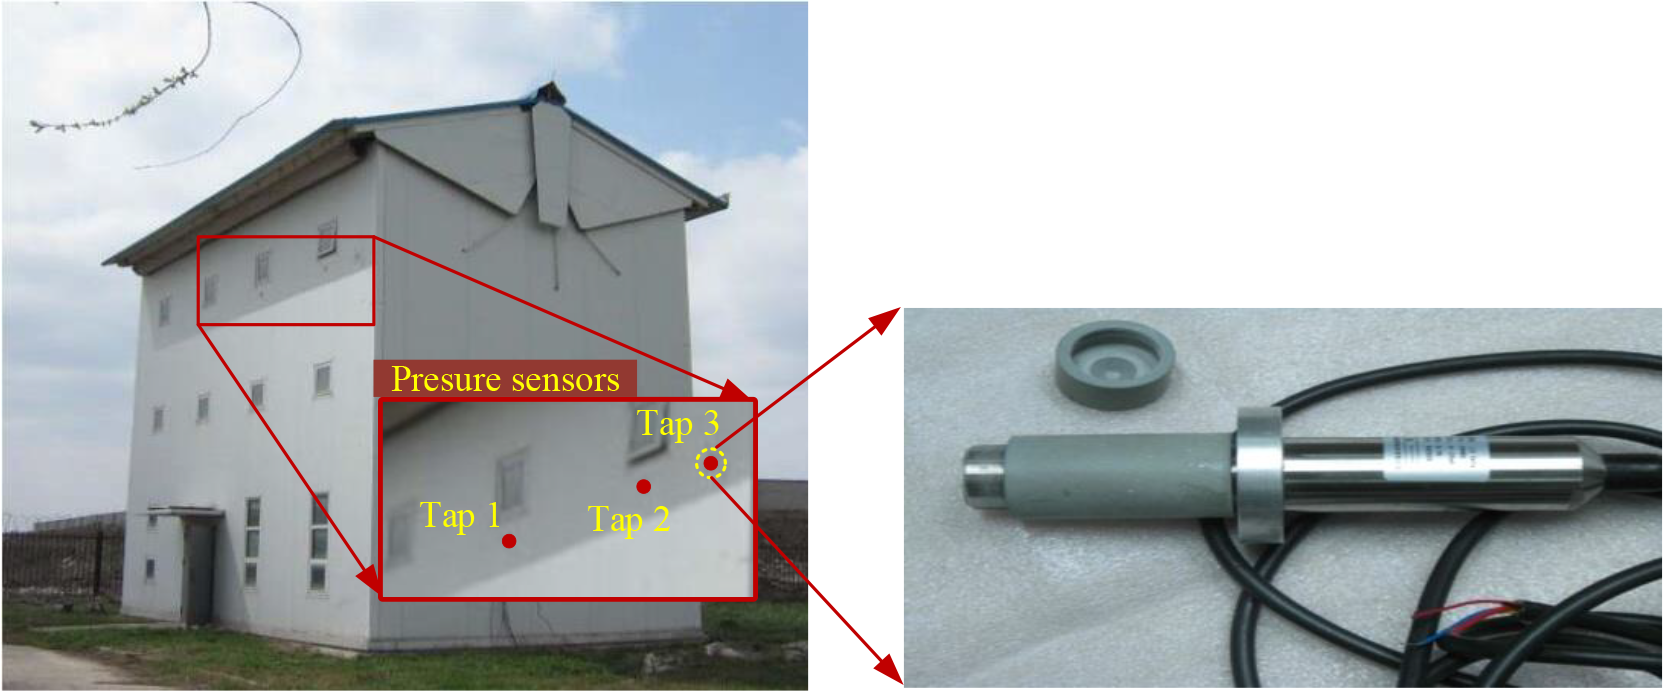
Locations of measuring points and a photo of sensors.
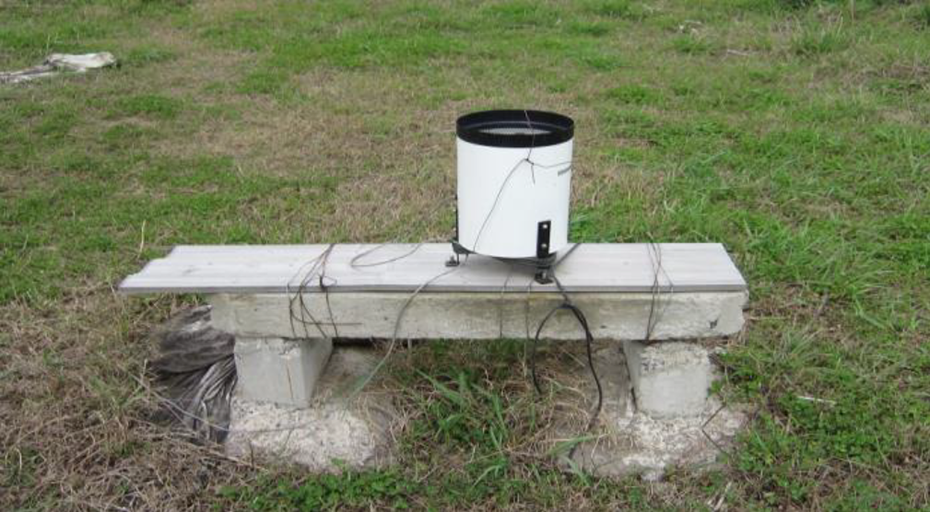
View of pluviometer.
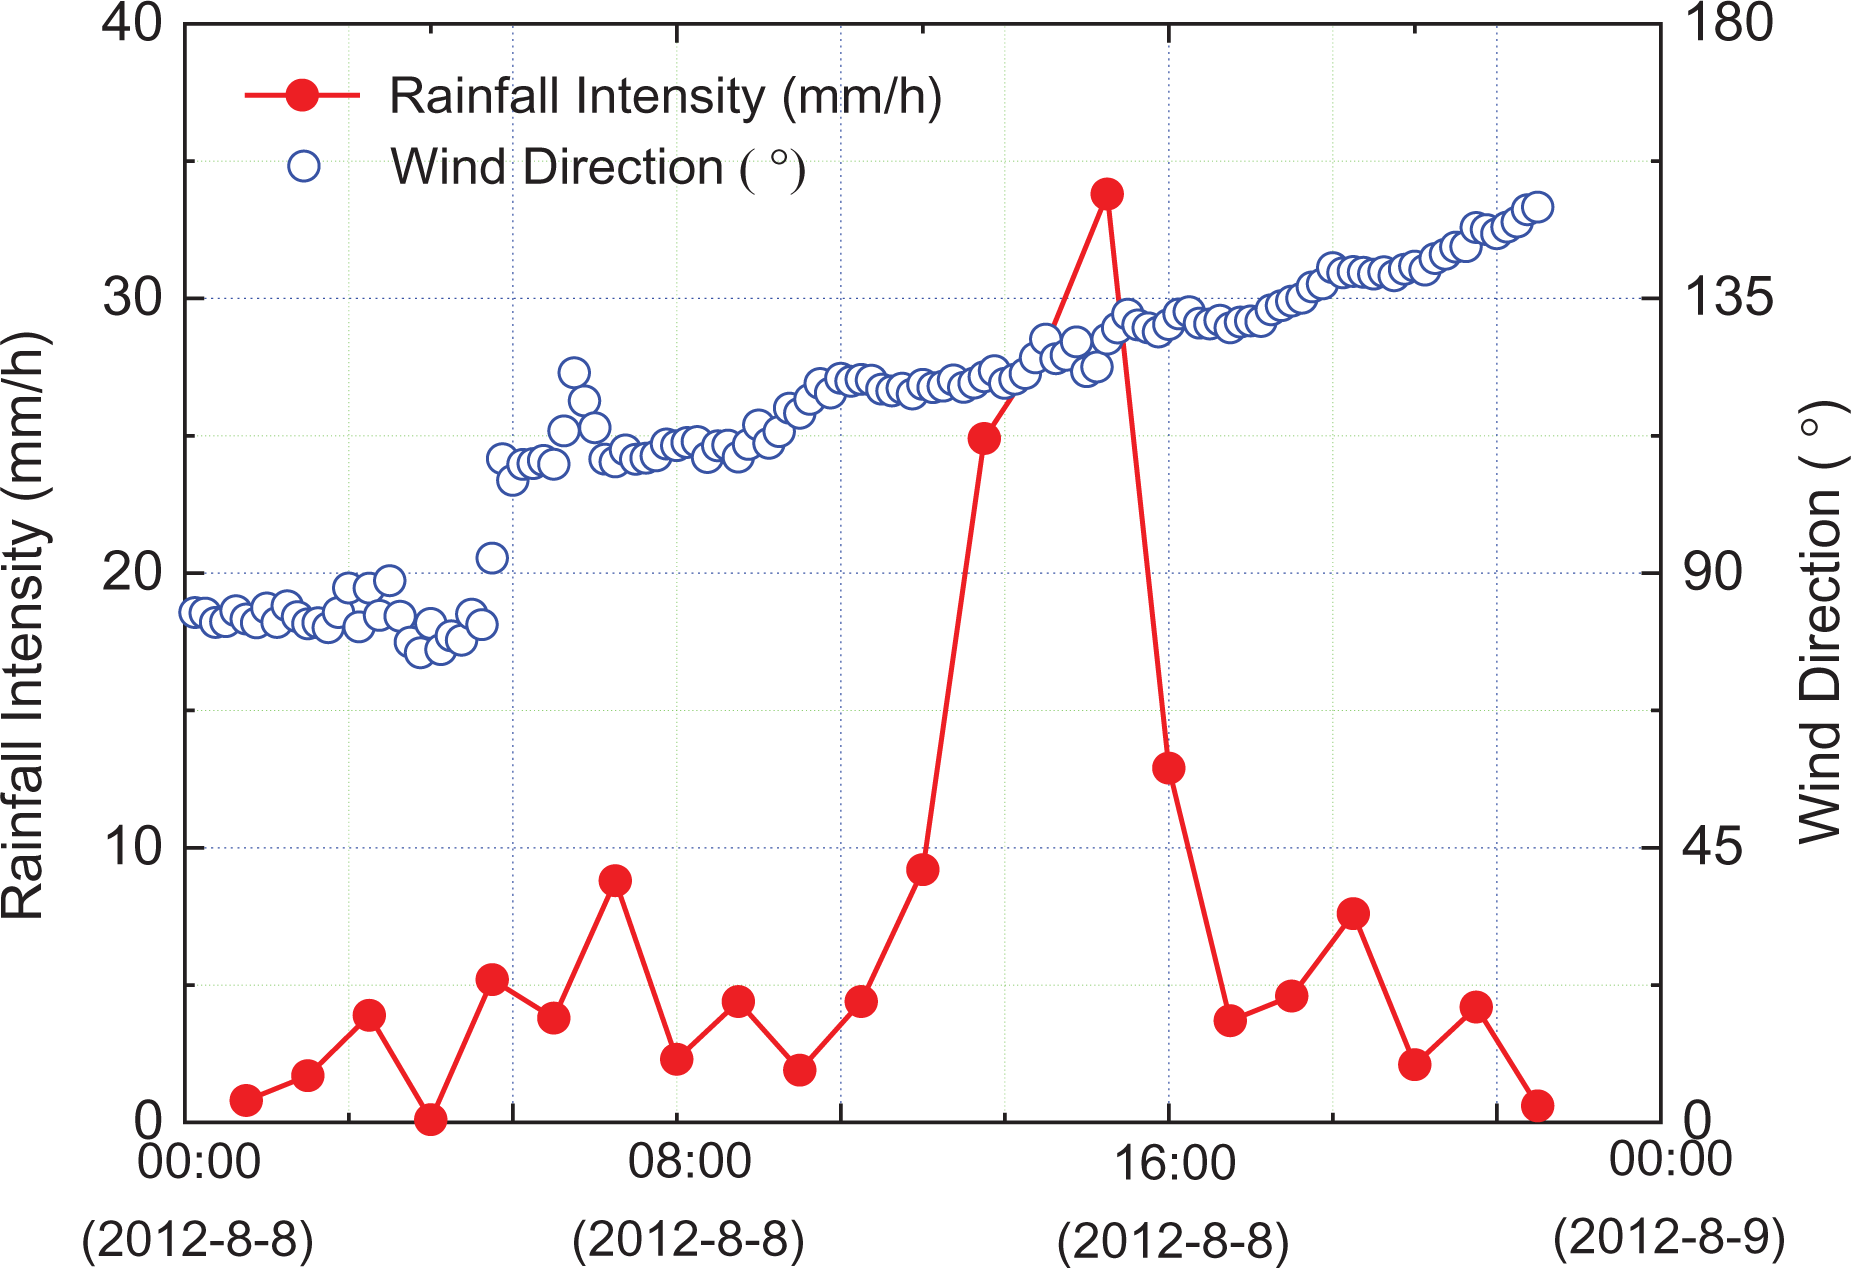
RI and wind direction during Typhoon Haikui.
Wind tunnel test
A wind tunnel test was conducted to measure the wind pressures on a scaled model of the experimental building in a similar wind condition but without rain. Figure 11 shows the layout of the pressure taps of concern. The definition of wind directions for the wind tunnel test is also presented in Figure 11.
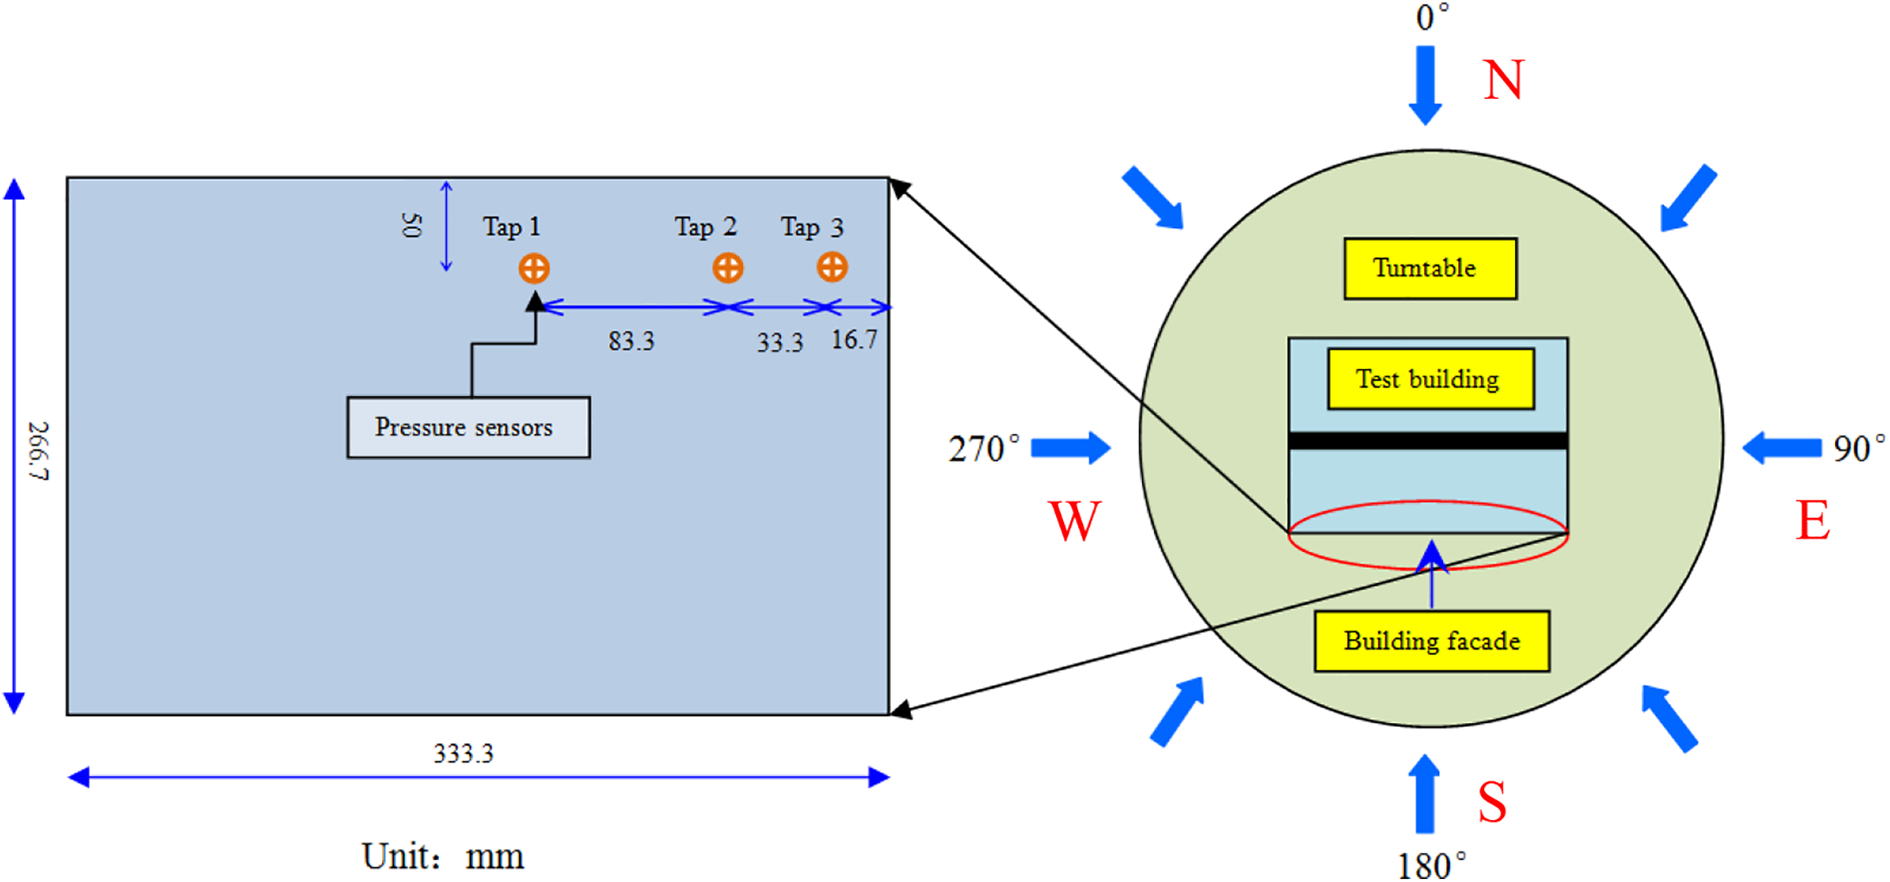
Layout of pressure taps and definition of wind direction angle in wind tunnel test.
Figure 12 shows the wind tunnel model of the full-scale experimental building. The wind tunnel test was performed in the TJ-2 boundary layer wind tunnel at Tongji University. The terrain category B specified in the Chinese Load Code (GB 50009-2012, 2012) was simulated. Figure 13 shows the mean wind speed profiles, turbulence intensity profile, and power spectrum of the fluctuating wind speeds in the longitudinal direction. The length scale of the model is 1:15, and the time scale is 1:12.5. The test sampling frequency is 312.5 Hz, the sampling numbers is 15,000, and the wind tunnel sampling duration is 48 s. The mean reference velocity is 15 m/s at the height of the building roof.
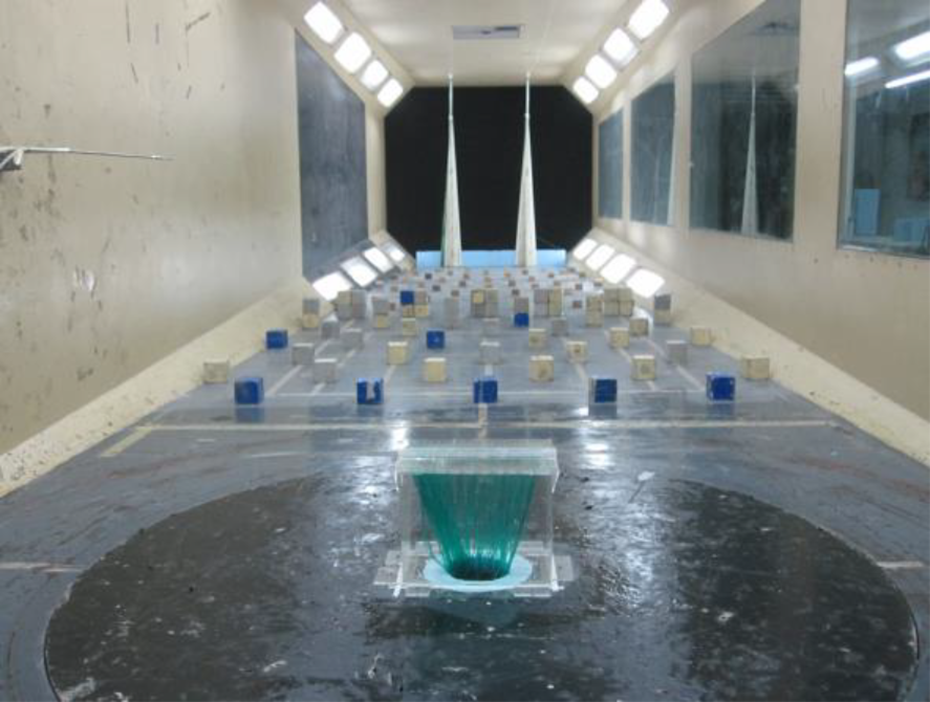
Wind tunnel model of the experimental building.
Simulated atmospheric boundary layer. (a) Profiles of mean wind speed and turbulence and (b) wind speed spectrum in longitudinal direction.
Data processing
The wind pressure coefficient (with or without rain) at each tap is calculated as follows
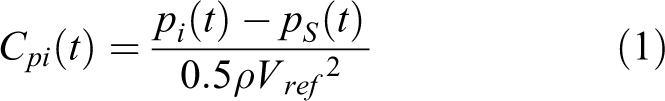
where Cpi (t) is the wind pressure coefficient of test point i at time t, pi (t) is the measured pressure of test point i, pS (t) is the static pressure, ρ is the air density, and VRef is the wind speed at the reference height, which is equal to 10 m above the ground in full scale.
The system for measuring the WRIPs is synchronized with the system for measuring the wind speeds, and their sampling frequency is all 20 Hz. By definition, the WRIP coefficient Crp can be defined as follows
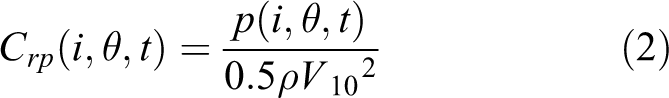
where Crp (i,θ, t) and p(i,θ, t) are the WRIP coefficients and WRIP pressures obtained from the field measurements for the point i at the wind direction of θ and V10 is the wind speed in the field measurement base at the height of 10 m.
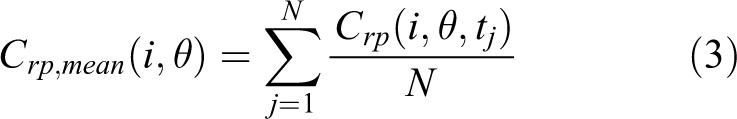
For different time intervals of sampling data, the number of sampling data is T×f at a sampling frequency of f. The mean WRIP coefficient Crp, mean for Tap i at the wind direction of θ is obtained by averaging the time histories of WRIP coefficient as follows
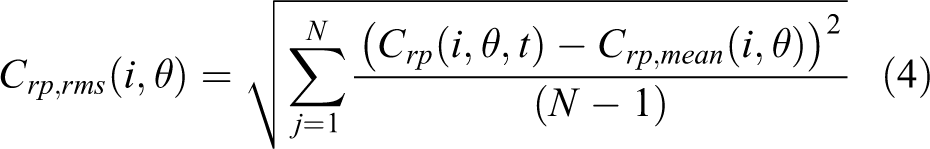
The fluctuating WRIP coefficient Crp,rms can be defined as follows
Characteristic of WRIPs on walls
Mean pressure coefficients
Wind data at three tap locations were collected during Typhoon Haikui. The 10-min mean pressure coefficients of the data acquired over this period are presented in Figure 14. There is a similar trend between the mean pressure coefficients and the RI, indicative of the 10-min average pressure coefficients correlating highly with the RI. It was observed that for the wind directions between 80° and 110°, the mean pressure coefficients vary with the RI, which exhibits an identical tendency. The maximum negative pressure coefficient at the corner of the wall for the wind direction of 80° amounts to −1.0. For the wind directions between 110° and 130°, the RI gradually increases to a peak of 33.8 mm/h and then decreases to 3.7 mm/h in 2 h. The mean WRIP coefficients of three tap locations increase with the RI and the difference among the mean WRIP coefficients at three taps become smaller when the RI increases with time. For the wind directions between 130° and 150°, the mean WRIP coefficients decrease with the wind direction, while the discrepancies among the mean WRIP coefficients at three locations become larger.
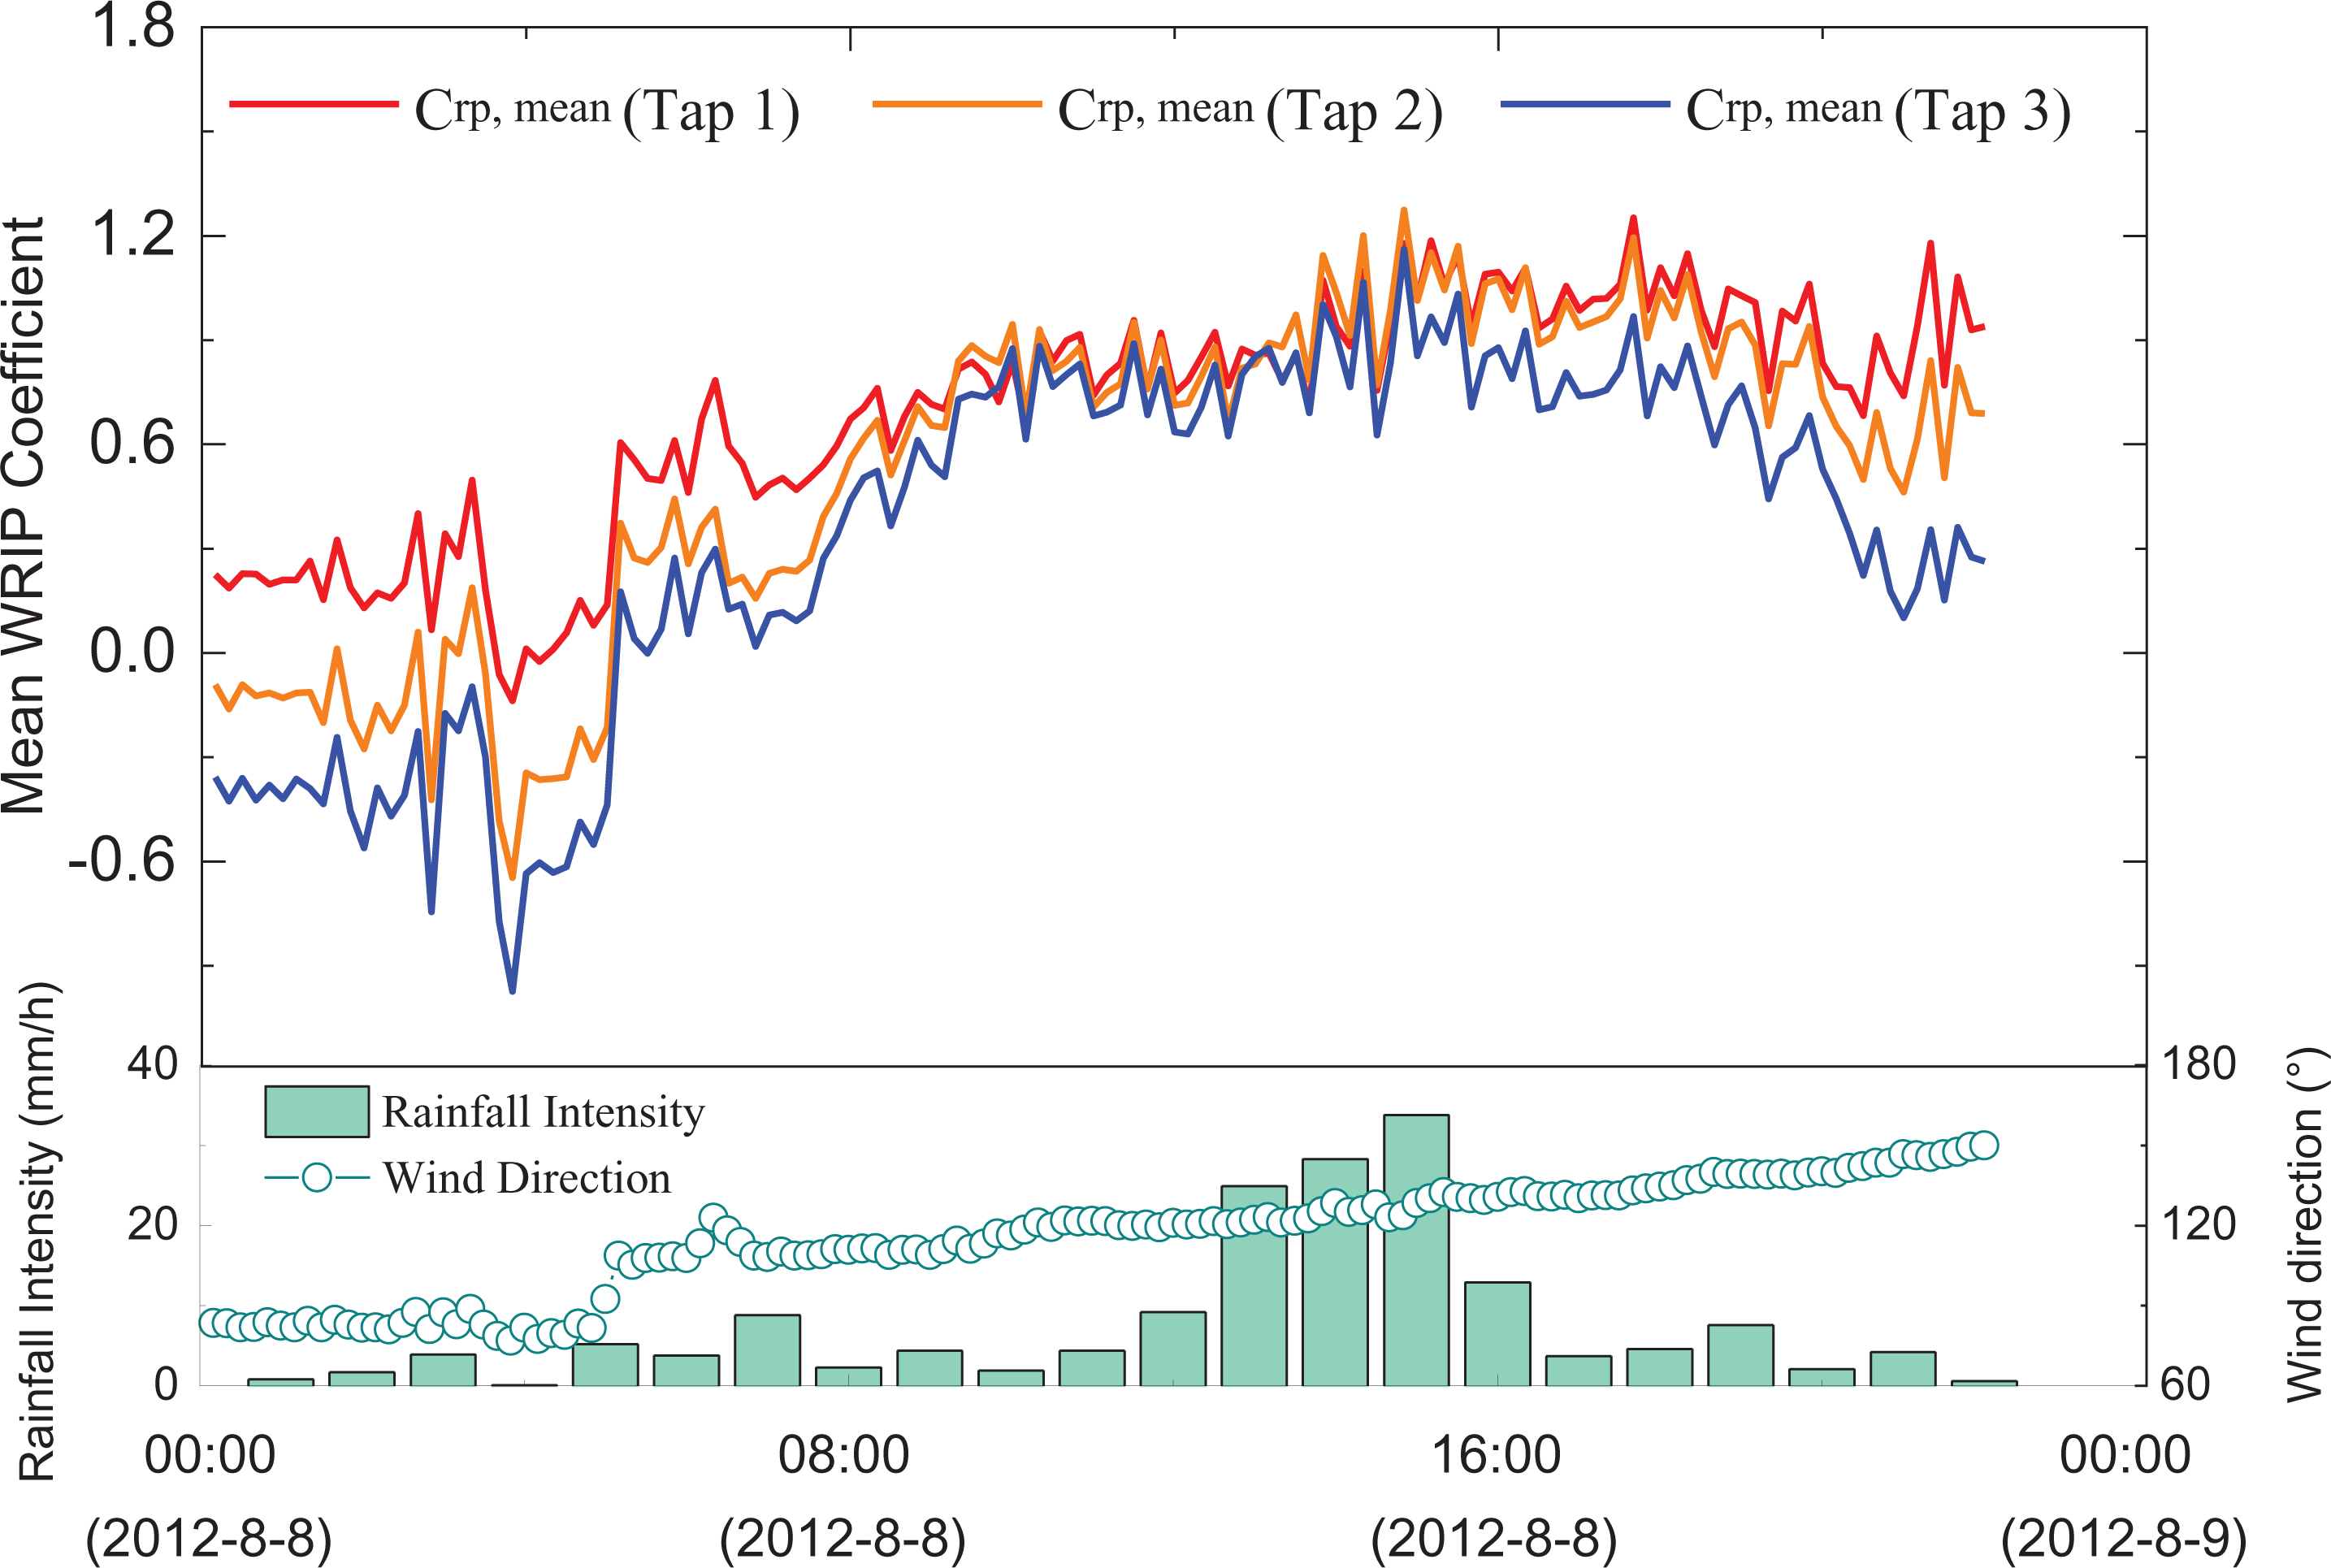
Time series of 10 min mean wind–rain induced pressure coefficients at three taps during Typhoon Haikui.
For the sake of better understanding the impact of rain drops on the wind loadings of the low-rise building, the data collected in the past strong wind-only events were used in this study. In these events, the wind characteristics like turbulence intensity are similar to those under Typhoon Haikui. For each tap location, 17 10-min time records of the wind pressures sampled at the wind directions between 105° and 135° were extracted from these data. Figure 15 presents the mean WRIP coefficients from Typhoon Haikui, along with the full-scale data from the past wind-only events measured in the field and the wind tunnel test results. The previous studies (Cermak and Cochran, 1992; Ham and Bienkiewicz, 1998; Mehta et al., 1992) by the roof of Texas Tech University (TTU) building shown that the mean wind pressure coefficients are the same size as wind tunnel results. But in this study, it was found that the wind tunnel test results are smaller than these in field measurement. It is probably due to the imperfect wind field simulation, unstable wind direction in field, general scale, and so on. The further analysis is hard to develop at this stage, because there are not sufficient data to mechanism analysis. The WRIP coefficients for different locations all increase gradually with wind directions. More importantly, the WRIP coefficients at these taps were larger in magnitude than those obtained from the wind-only field measurements. It is indicated that raindrops have influence on the pressure of the façade, which is in accordance with many early research works (Ke et al., 2018; Wang et al., 2013b; Zhao et al., 2014).
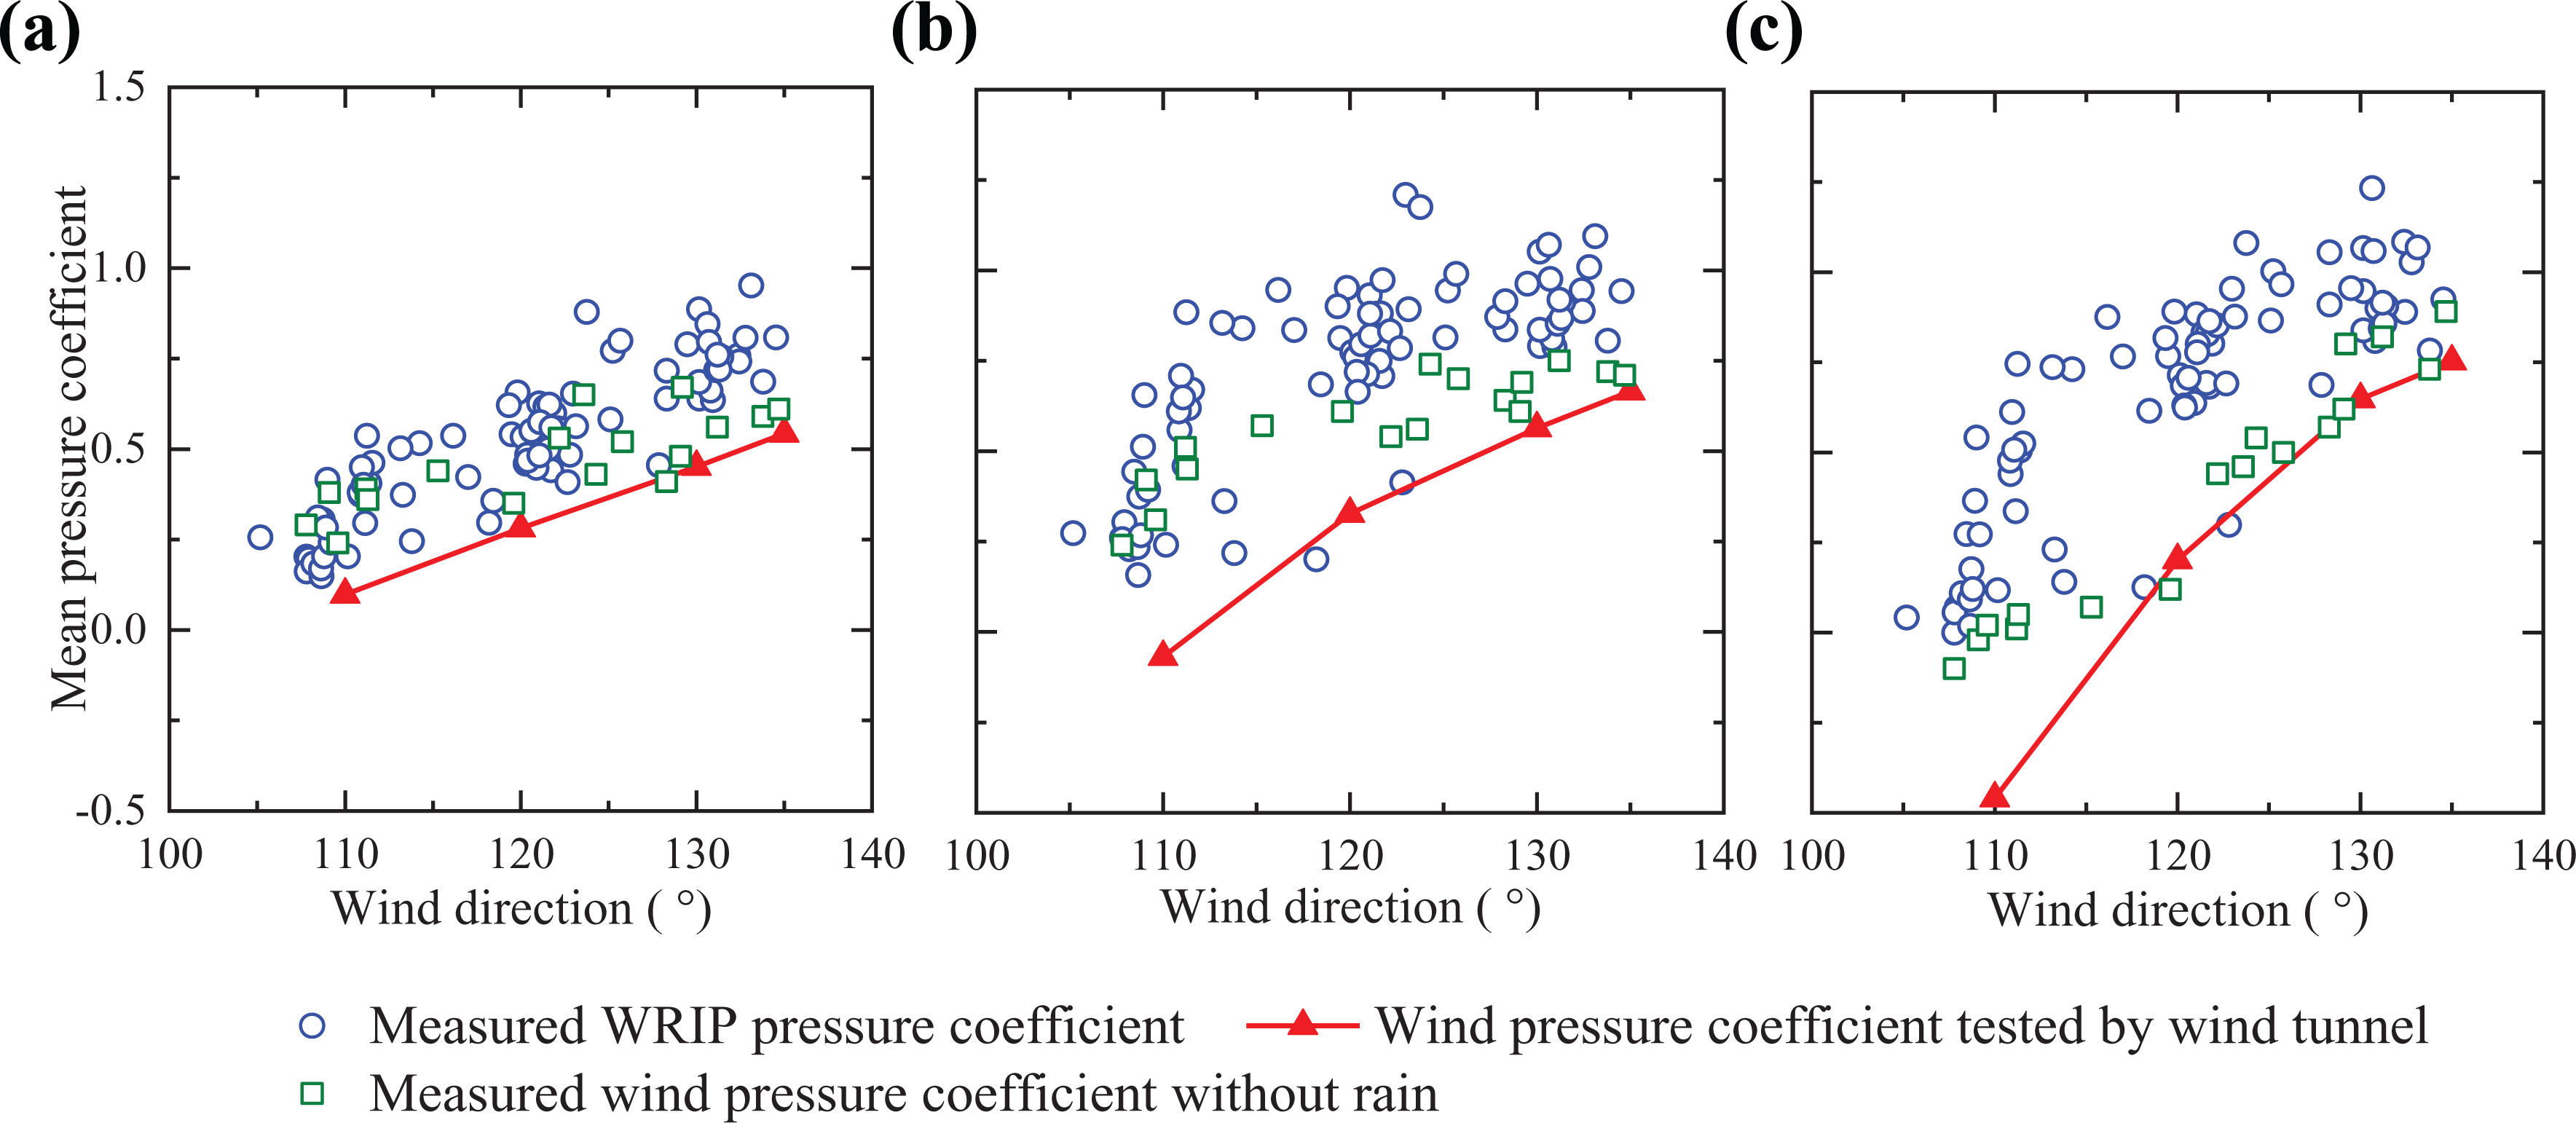
Variation of the mean pressure coefficients with wind direction. (a) Tap 1, (b) Tap 2, and (c) Tap 3.
It can be seen from Figure 15 that the measured data during the Typhoon Haikui (2012) are limited to a small range of wind directions. The wind data collected at three wind directions, including 110°, 120° and 130°, are chosen for analysis. Figure 16 shows the effects of the RI on the mean WRIP coefficients at three taps for three directions. For the wind directions of 110°, 120°, and 130°, the WRIP coefficients exhibit an increasing trend with the RI. The WRIP coefficients are dramatically larger than those from the wind tunnel test and become positive at the corner of the wall (Tap 3), whereas the pressure coefficients at Tap 3 tested by wind tunnel are negative. It is because the rainfall has an impact on the flow movement and then increases the pressure on the corner of the wall.
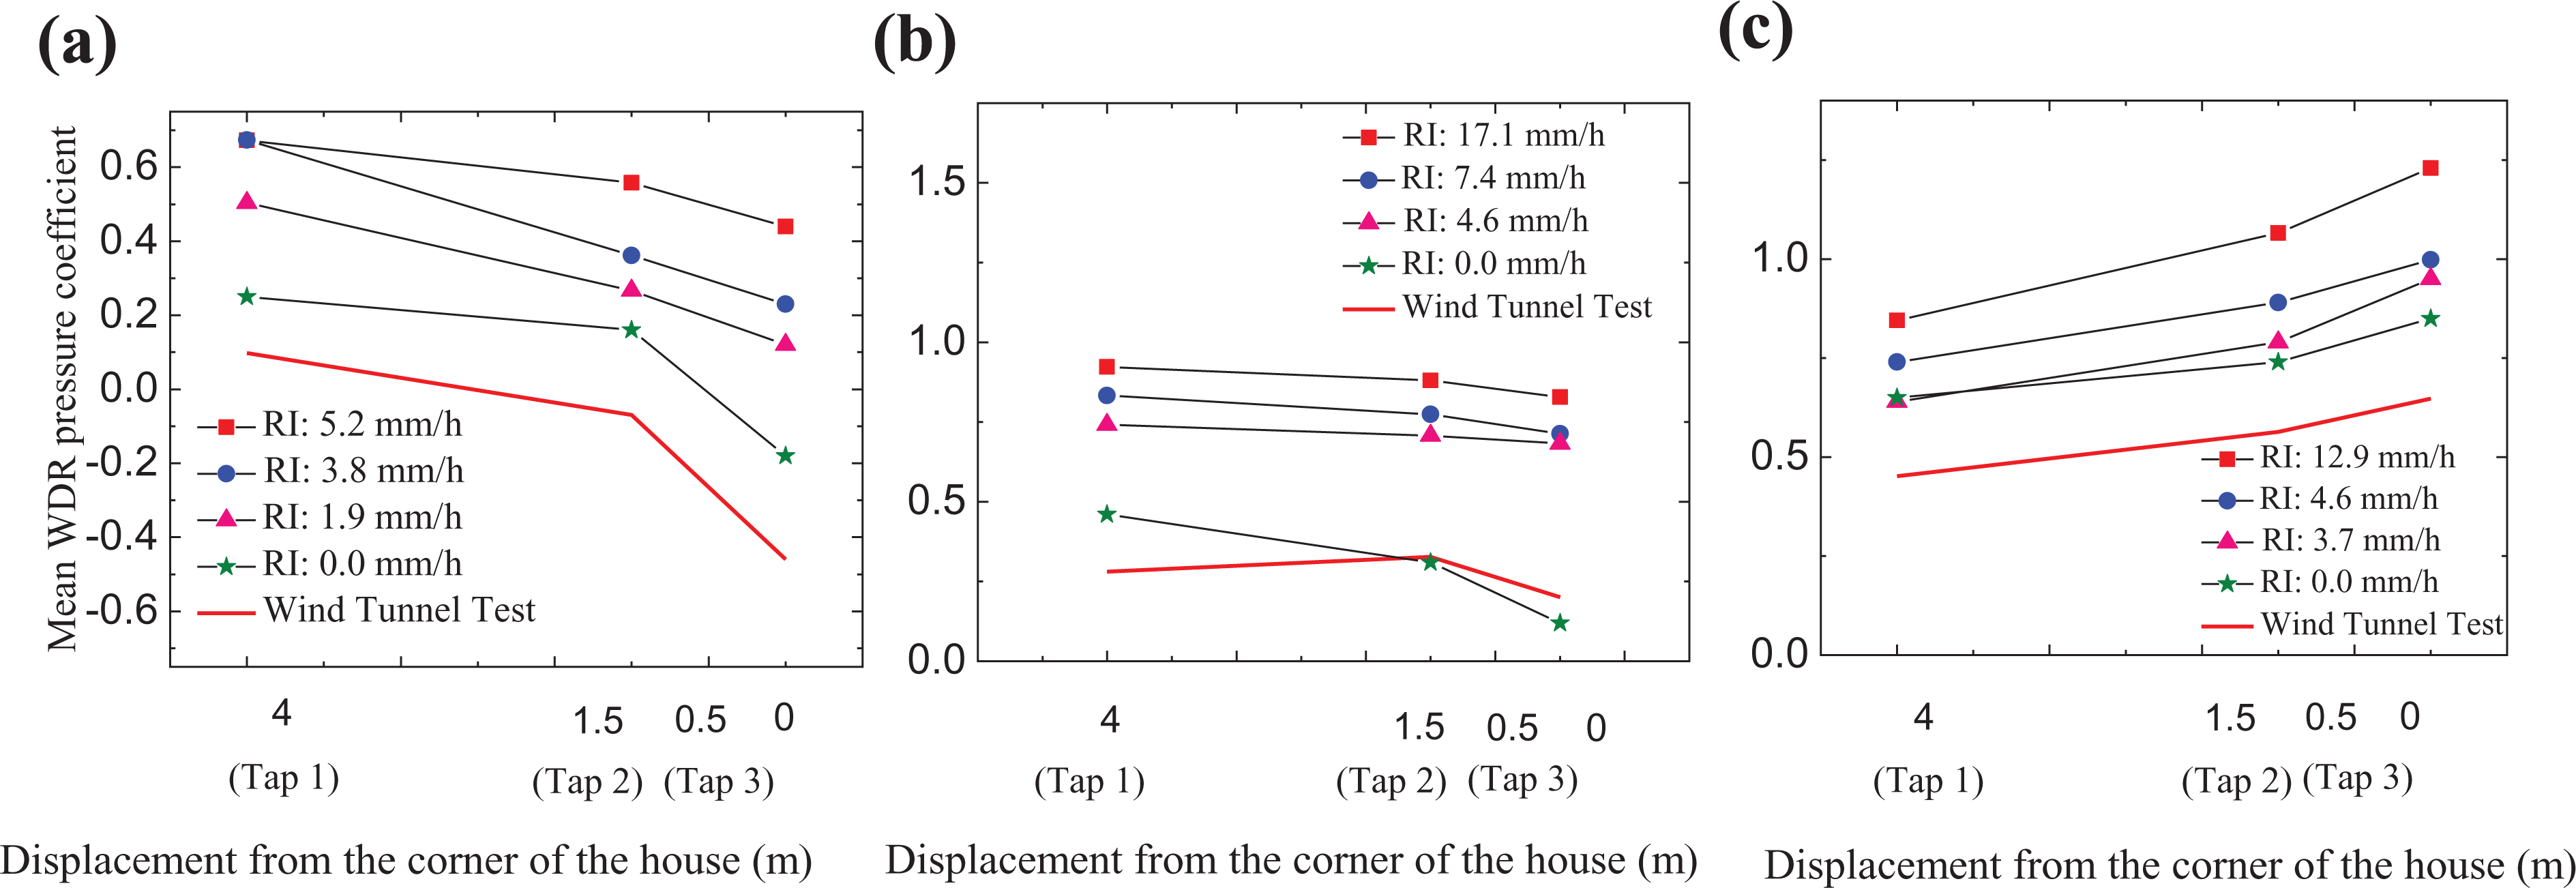
Effects of the RI on the mean pressure coefficients at three taps: (a) wind direction of 110°, (b) wind direction of 120°, and (c) wind direction of 130°.
In conclusion, the heavy rainfall imposes an additional pressure on the building envelope and thus affects the mean WRIP coefficients on the wall. For the wind directions between 110° and 130°, the mean WRIP coefficients on the wall increase with RI. Large wind–rain driven pressures were observed to occur at the taps which are located further to the corner of the wall.
Fluctuating WRIP coefficients
Figure 17 presents the time histories of the fluctuating WRIP coefficients at three taps. In general, the fluctuating WRIP coefficients of Tap 1 are increased with the RI and wind direction. However, the fluctuating WRIP coefficients of Tap 2 and Tap3 first increase and then decrease with the RI and wind direction. It is obvious that the fluctuating WRIP coefficients are more sensitive to RI and have a sharp increase when the RI increases. The maximum fluctuating WRIP coefficient can reach about 1 at the corner of the wall at large RI as a result of the formation of the vortex shedding at the corner of the wall. For the wind direction less than 140°, the fluctuating WRIP coefficients of three measuring points decrease with the distance to the corner of the wall, and it has an opposite changing tendency for the wind directions of larger than 140°.
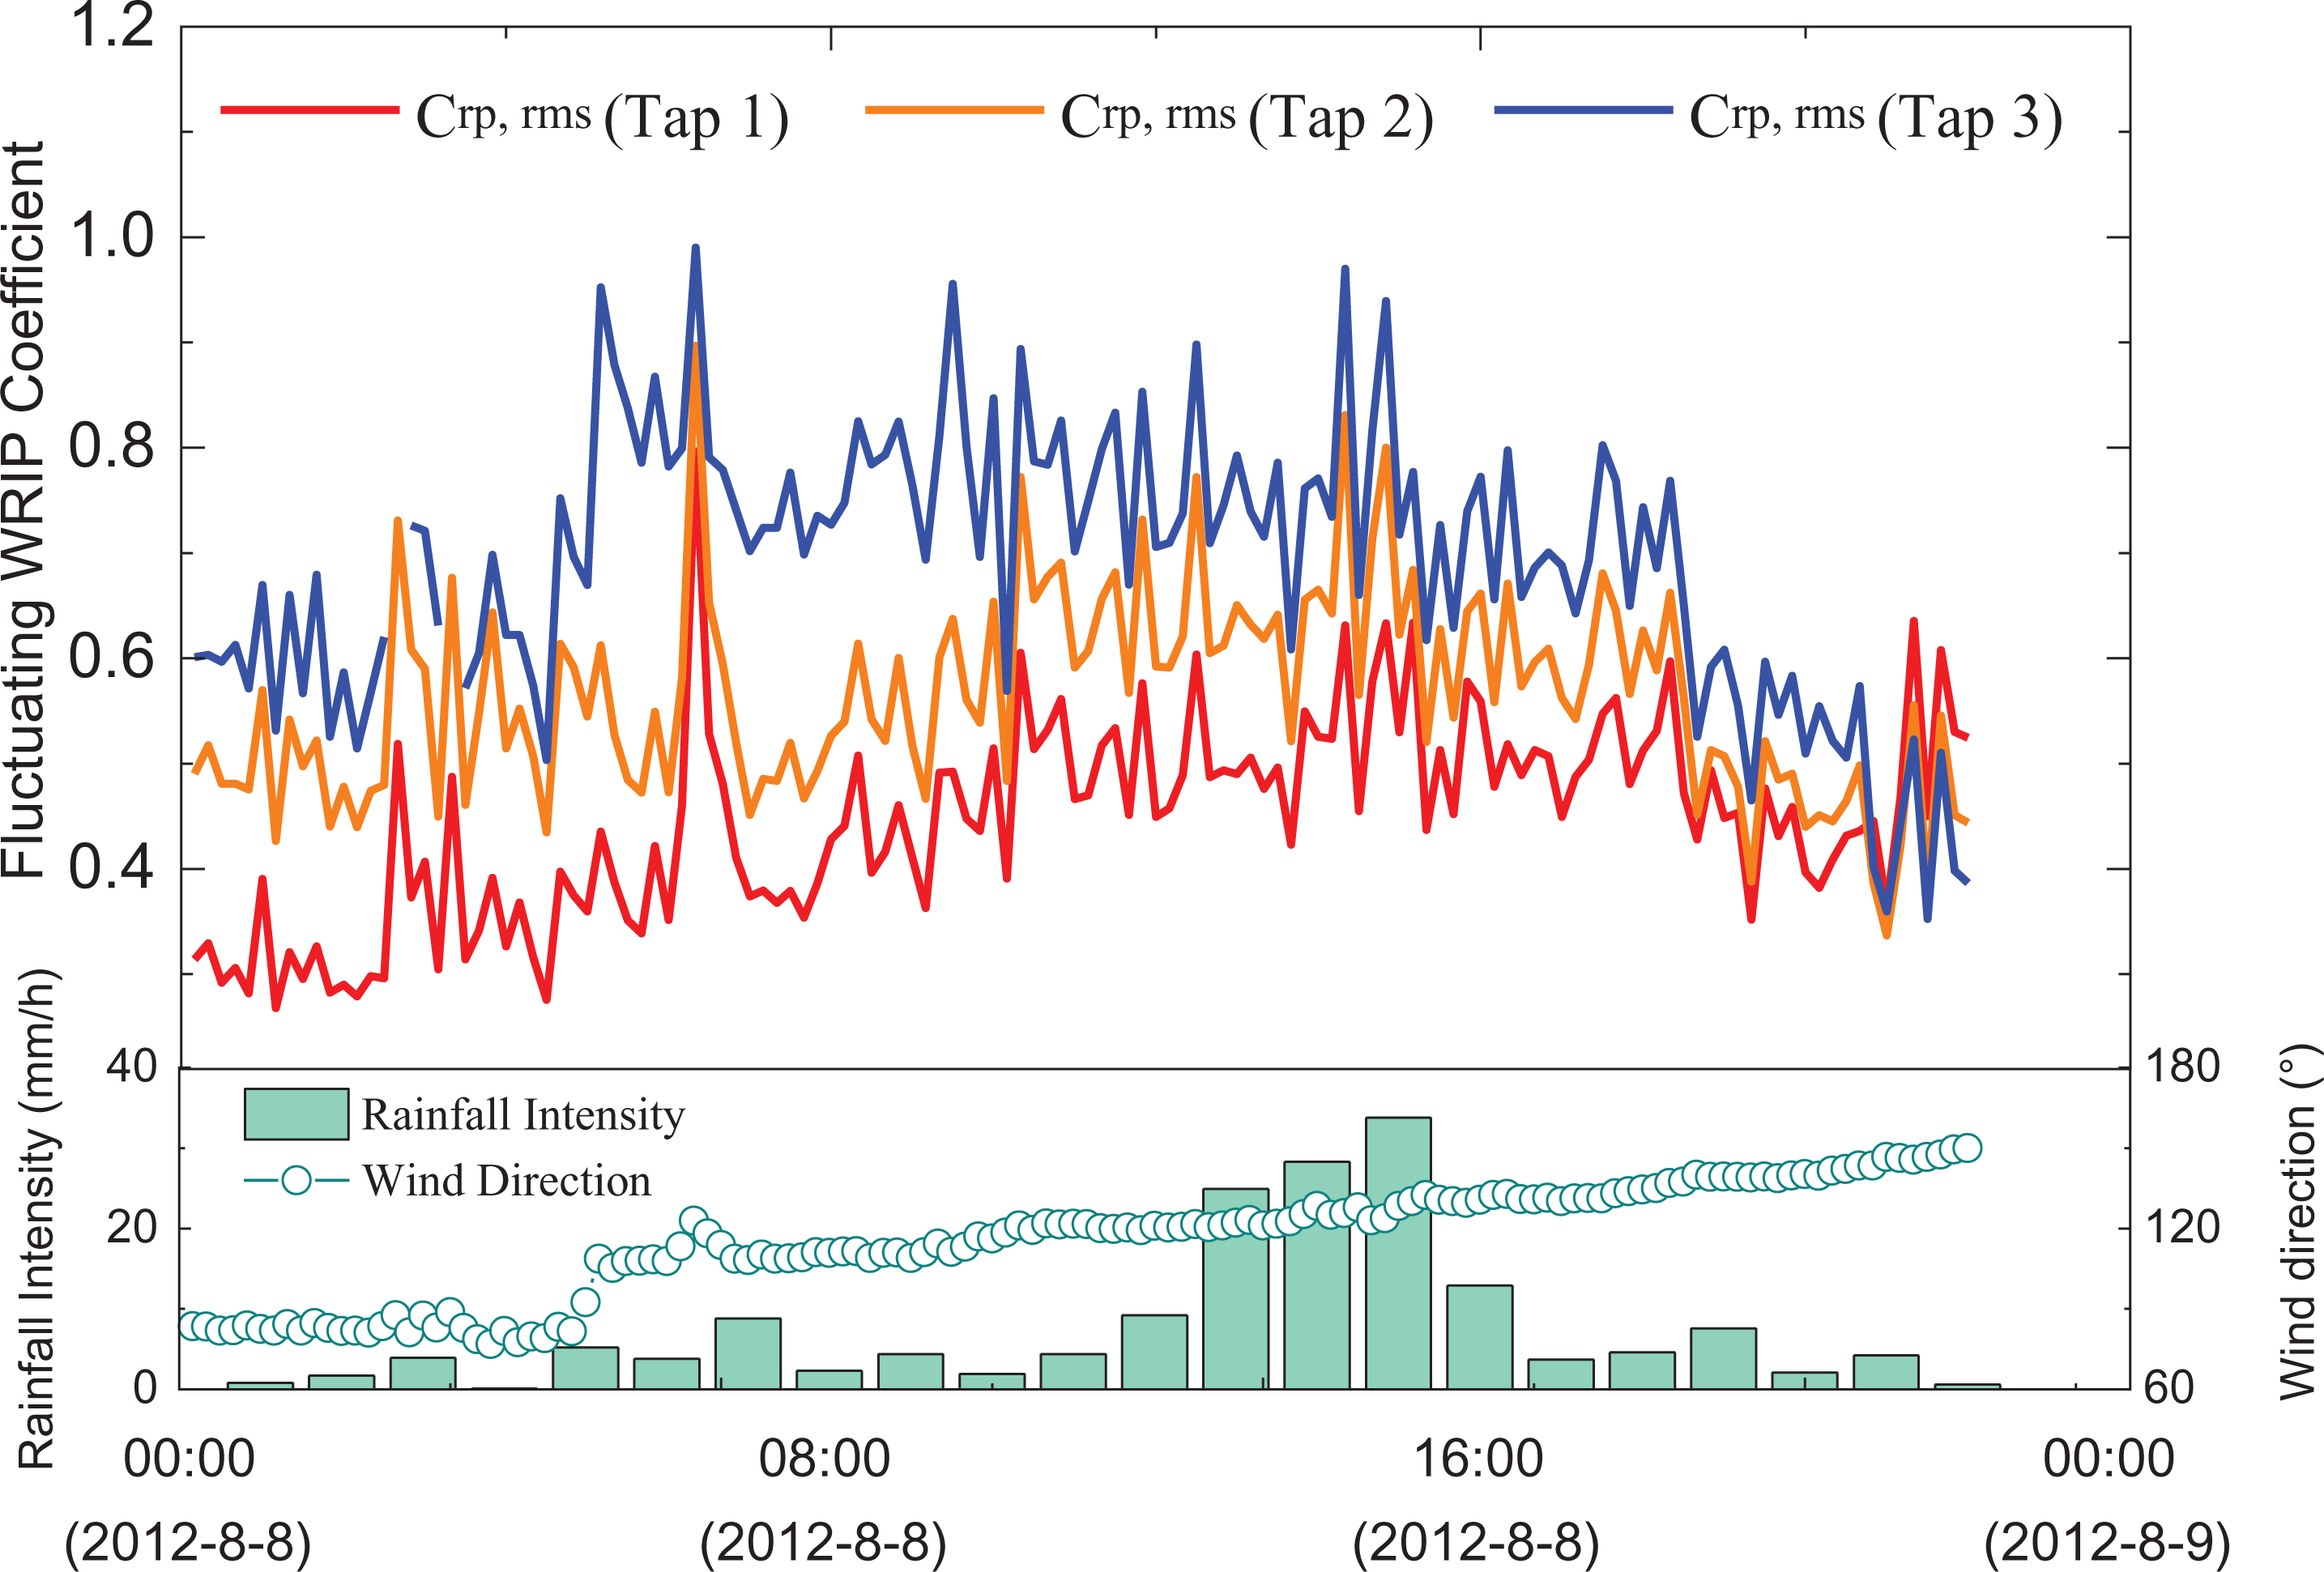
Fluctuating wind–rain induced pressure coefficients for three measuring points on wall during Typhoon Haikui.
The variation of the fluctuating WRIP coefficients at three taps with the wind direction is illustrated in Figure 18, along with the results from the wind tunnel test. Consistence with many previous research works (Ham and Bienkiewicz, 1998; Lin et al., 1995; Okada and Ha, 1992; Tieleman et al., 1996; Xu, 1995), in this study, the fluctuating wind-only pressure coefficients on the wall are greater than those from the wind tunnel tests. But compared with fluctuating WRIP coefficients, fluctuating wind-only pressure coefficients is smaller, which can be attributed to the effect of the rainfall. The mean value of the fluctuating WRIP coefficients of the measure point is increased with the distance to the corner of the wall. It is because the WRIP pressures at the taps, which are close to the corner of the wall, tend to be influenced by the flow separation generated at the corner of the wall. And this trend is consistent with the results of the wind tunnel tests.
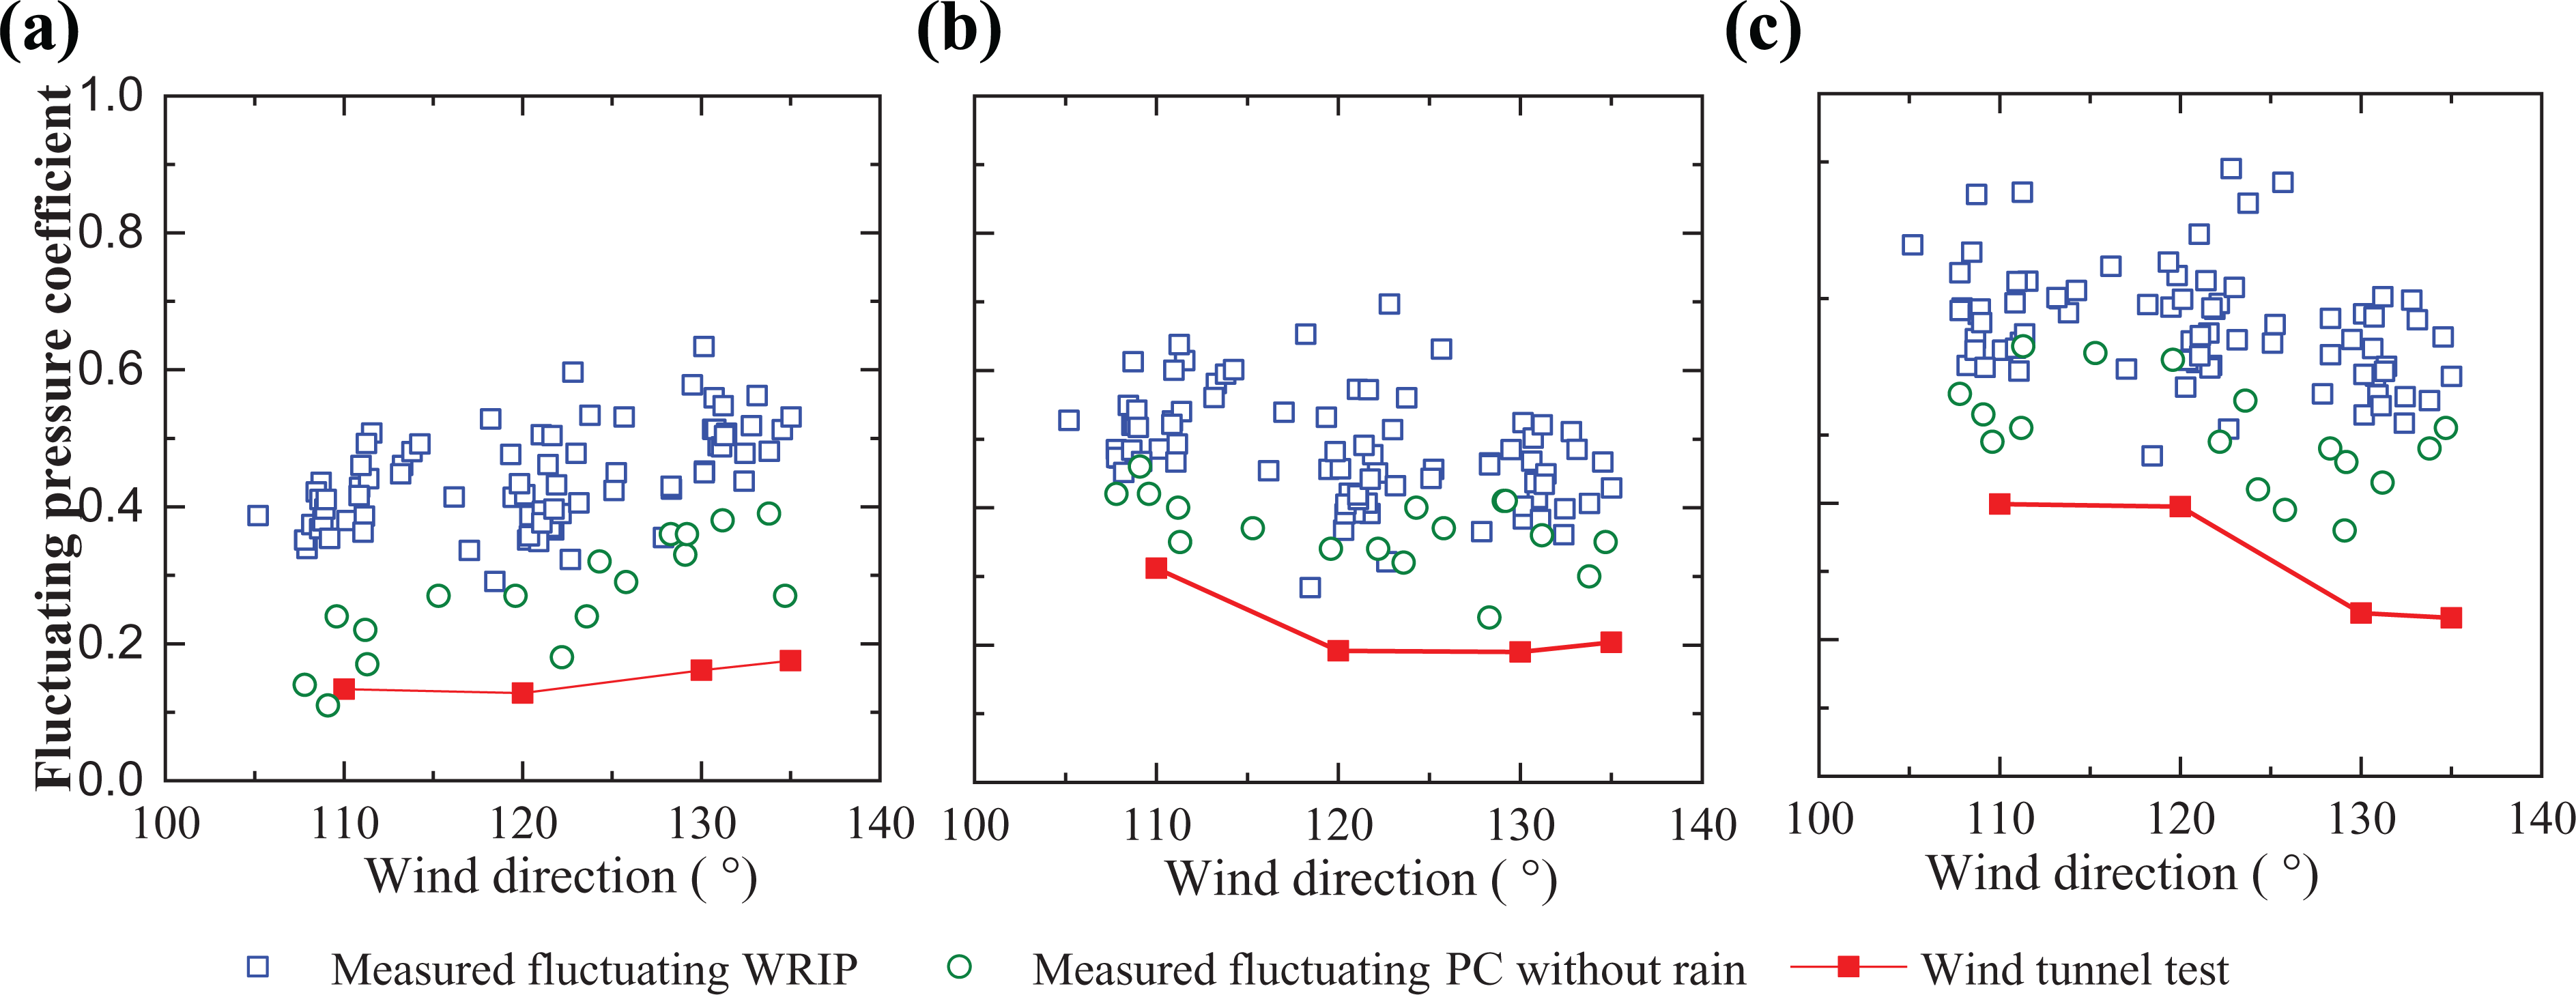
Variation of fluctuating wind–rain induced pressure coefficients with wind direction: (a) Tap 1, (b) Tap 2, and (c) Tap 3.
Figure 19 depicts the effects of the RI on the fluctuating WRIP coefficients at three different wind directions. In the case of the wind directions of 110° and 120°, the fluctuating WRIP coefficients are increased with the RI, which agree well with the trend obtained from the wind tunnel results. For the wind direction of 130°, the RI has little influence on the fluctuating WRIP coefficients, probably due to the increase in in the flow separation in the corner.
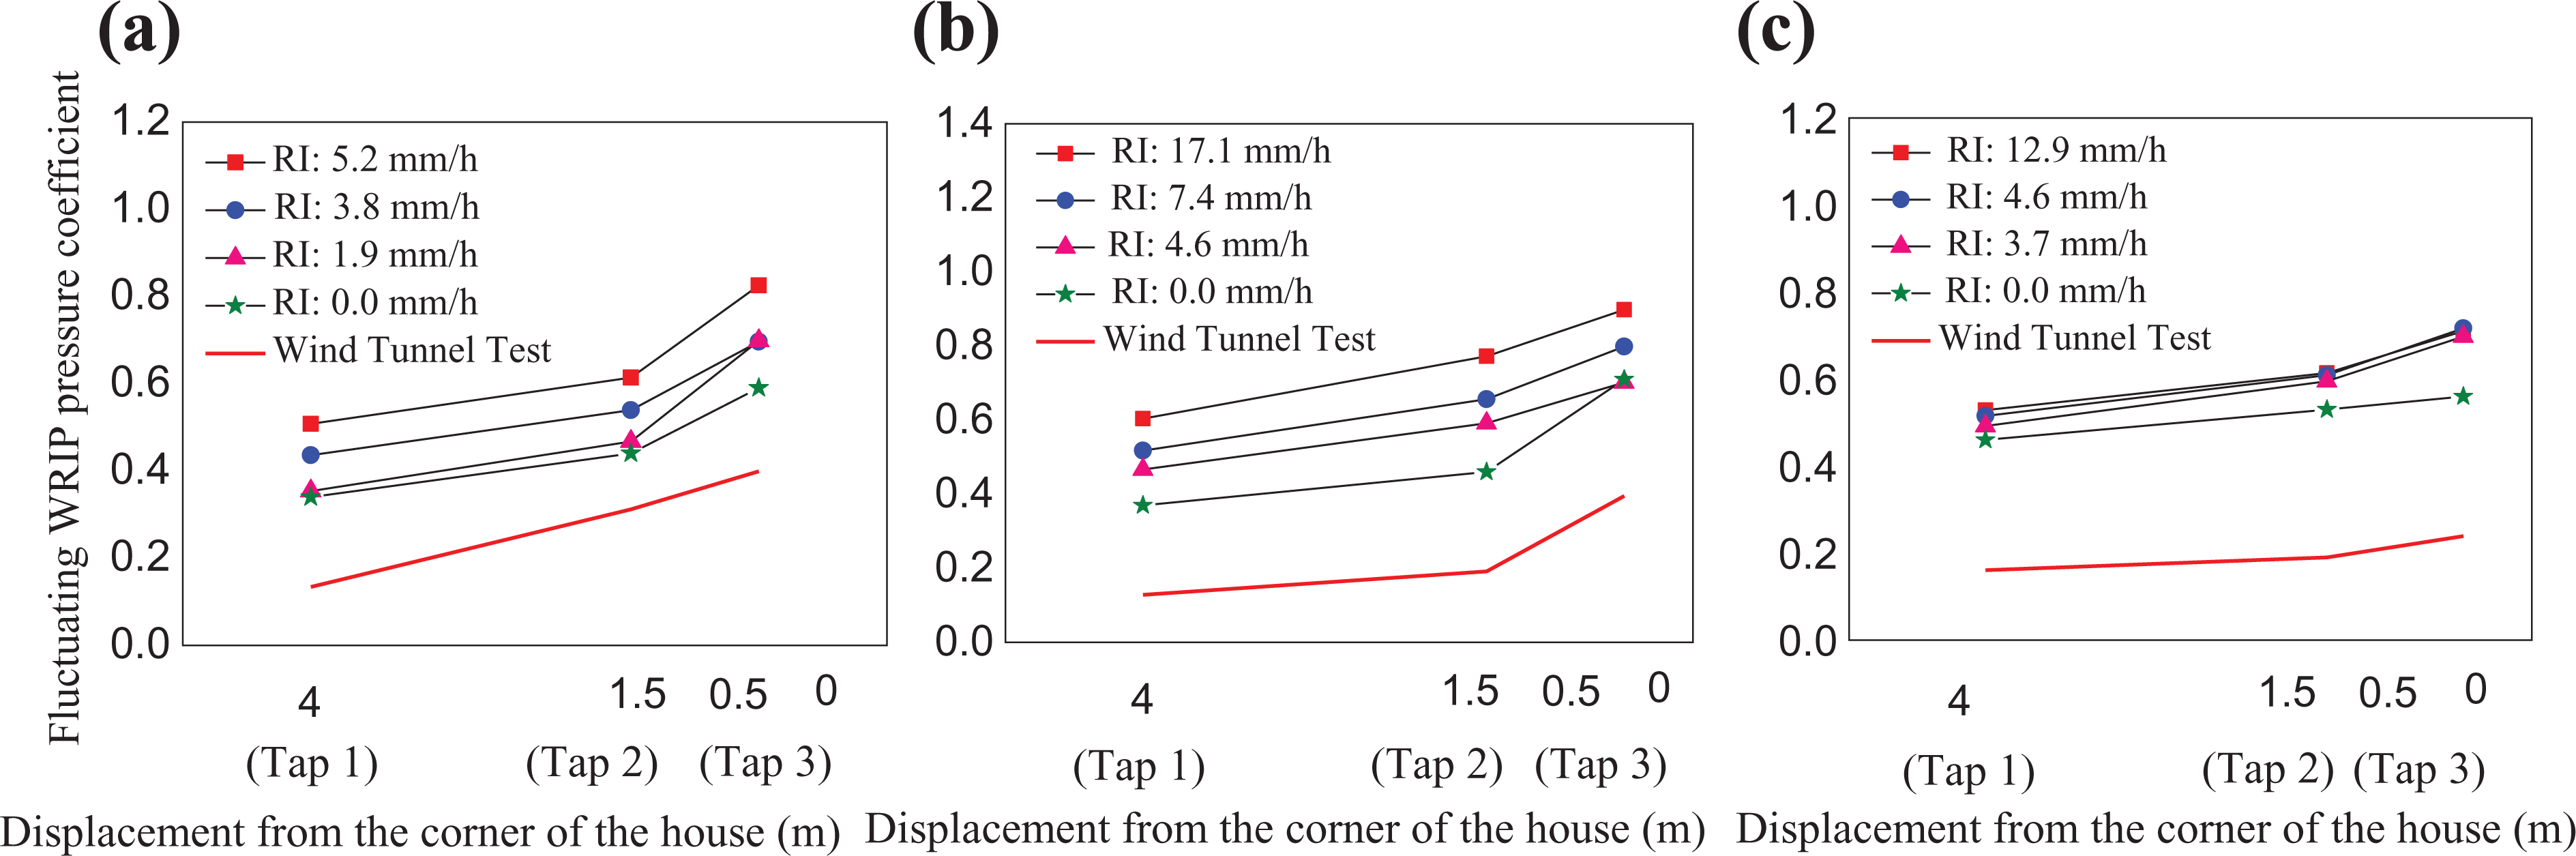
Effects of RI on fluctuating pressure coefficients: (a) wind direction of 110°, (b) wind direction of 120°, and (c) wind direction of 130°.
In summary, the fluctuating WRIP coefficients at three taps are significantly larger than those from the wind tunnel test. The fluctuating WRIP coefficients at these taps increase with RI and decrease with the distance of the taps to the corner of the wall.
Probability characteristics of WRIPs
In the realm of wind engineering, it is often assumed that wind pressures on the surface of a building envelope follow the Gaussian distributions. However, according to the studies by Quan et al. (2011), Huang et al. (2014, 2017) and Peng et al. (2013, 2014), for a gable-roofed low-rise building, wind pressures in some regions of the windward wall, most regions of the leeward wall and the roof exhibit strongly non-Gaussian features. Many studies have been conducted to investigate the cause of these non-Gaussian characteristics and the generation of non-Gaussian wind pressures. It is generally accepted that the non-Gaussian wind pressures on the building surface are mainly attributed to the separation of the shear layers at the corners of the building, the separation bubble on the side surface of the building, and the flow reattachment. Moreover, these features are determined by the turbulence characteristics and wind direction of the incoming flow and the structural geometry. The 2D separation bubble and the 3D conical vortex generated by the tilt flow directly lead to the non-Gaussian portion of wind pressure. According to a previous study on a low-rise building (Chen, 2008), the non-Gaussian distribution of wind pressures is mainly ascribed to the fact that the internal structure of the vortices in the incoming flow is damaged by flow separation (Holmes, 2007). Therefore, it is not conservative to estimate the wind effects on the building envelope based on the Gaussian assumption. The probability distribution of wind pressure on the surface of the building envelopes has drawn researchers’ attentions, but few studies have been conducted to investigate the probability distribution of WRIPs on the building components and cladding, which is of the main concern in this section.
The data collected during the Typhoon Haikui are selected to identify the probability characteristics of WRIP pressures. Table 1 provides the detailed information of the test cases. The probability density function describes the fluctuation of pressure at a specific location. To describe the characteristics of a non-Gaussian distribution, high-order statistics of skewness and kurtosis are applied. The results of skewness and kurtosis for different cases were displayed in Table 2. The present results of skewness and kurtosis for these three points significantly deviate from 0 and 3, respectively, which do not correspond to the Gaussian process. Thus, the WRIP pressures of these three points are significantly non-Gaussian. When the wind direction is a constant, the kurtosis of the three points in case 1 is greater than that of case 2, and the kurtosis in case 3 is also greater than that of case 4. However, the wind speeds of these cases are also different. Therefore, we cannot draw the conclusion that the kurtosis increases with the RI, and this issue need more investigations in the future.
A summary of all test cases.
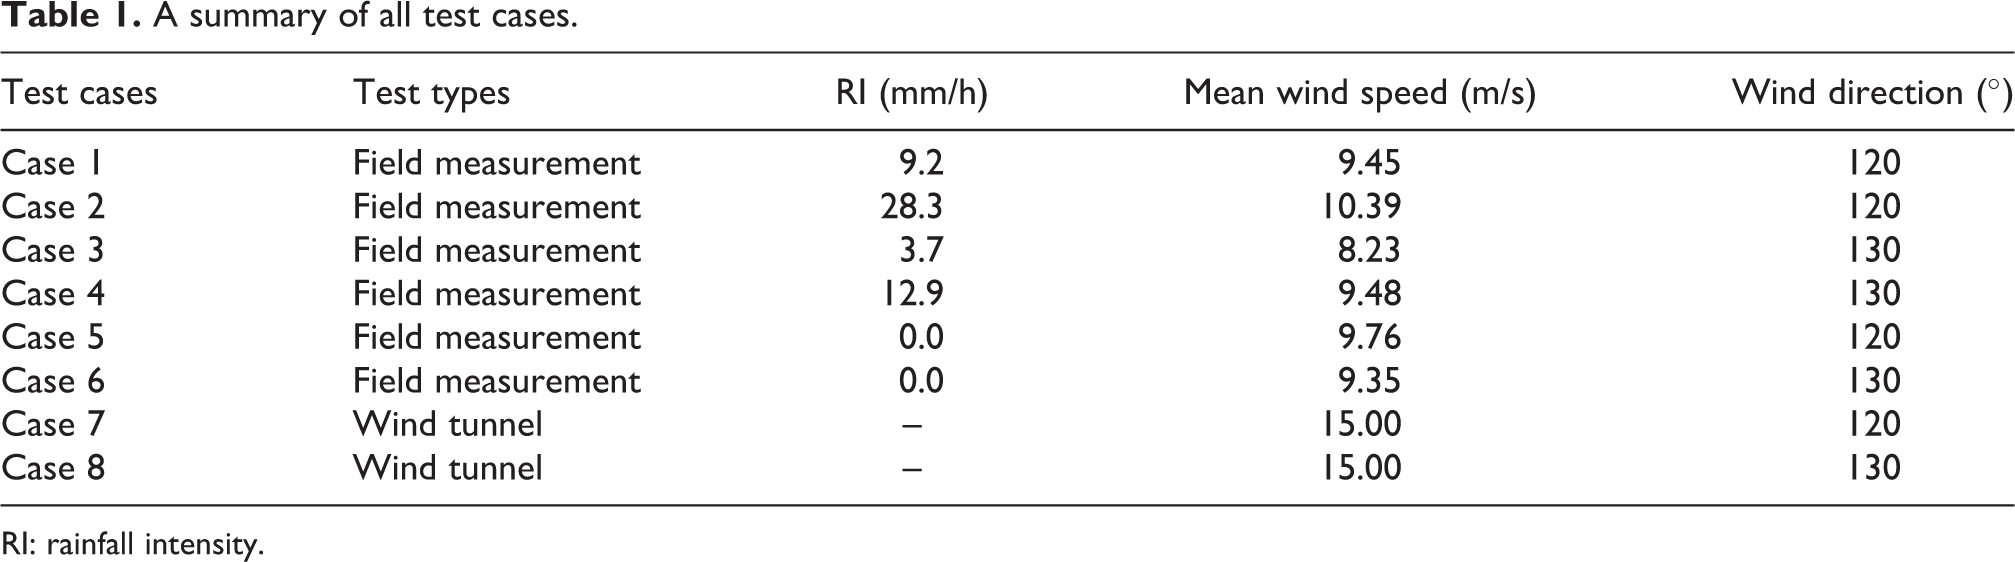
RI: rainfall intensity.
Skewness and kurtosis of wind–rain induced pressure records for four cases.
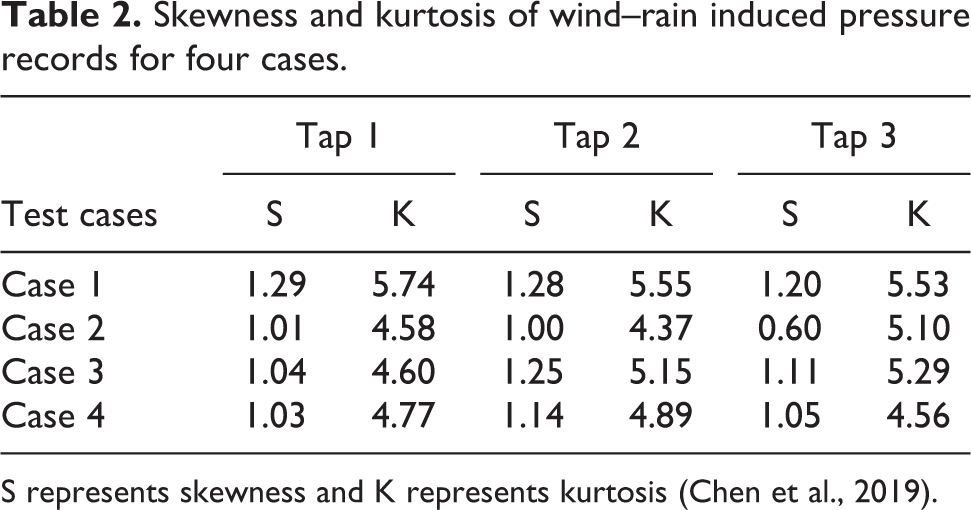
S represents skewness and K represents kurtosis (Chen et al., 2019).
Figure 20 shows the probability density functions of the WRIP coefficients at three measuring points for Case 1. The left tail of the probability density curve deviates from the Gaussian curve, whereas the right tail zone exhibits a rapid falloff as compared with the Gaussian curve. These findings agree well with the results from the wind tunnel test by Quan et al. (2011), which indicates that the RI does not affect the probability distribution of pressure coefficients on the wall. For comparison, Figure 20 also shows the fitting results of the gamma distribution and the generalized extreme value (GEV) distribution of the WRIP coefficients of three measuring points for Case 1. Taps 2 and 3 are best fitted to these two kinds of distributions, whereas the right side of probability density curves of the point 3 deviates from the curves of these two distributions. The reason for this deviation is that the measuring point 3 is very close to the corner of the wall, and the flow characteristics near this point is obviously affected by the flow separation at the corner.
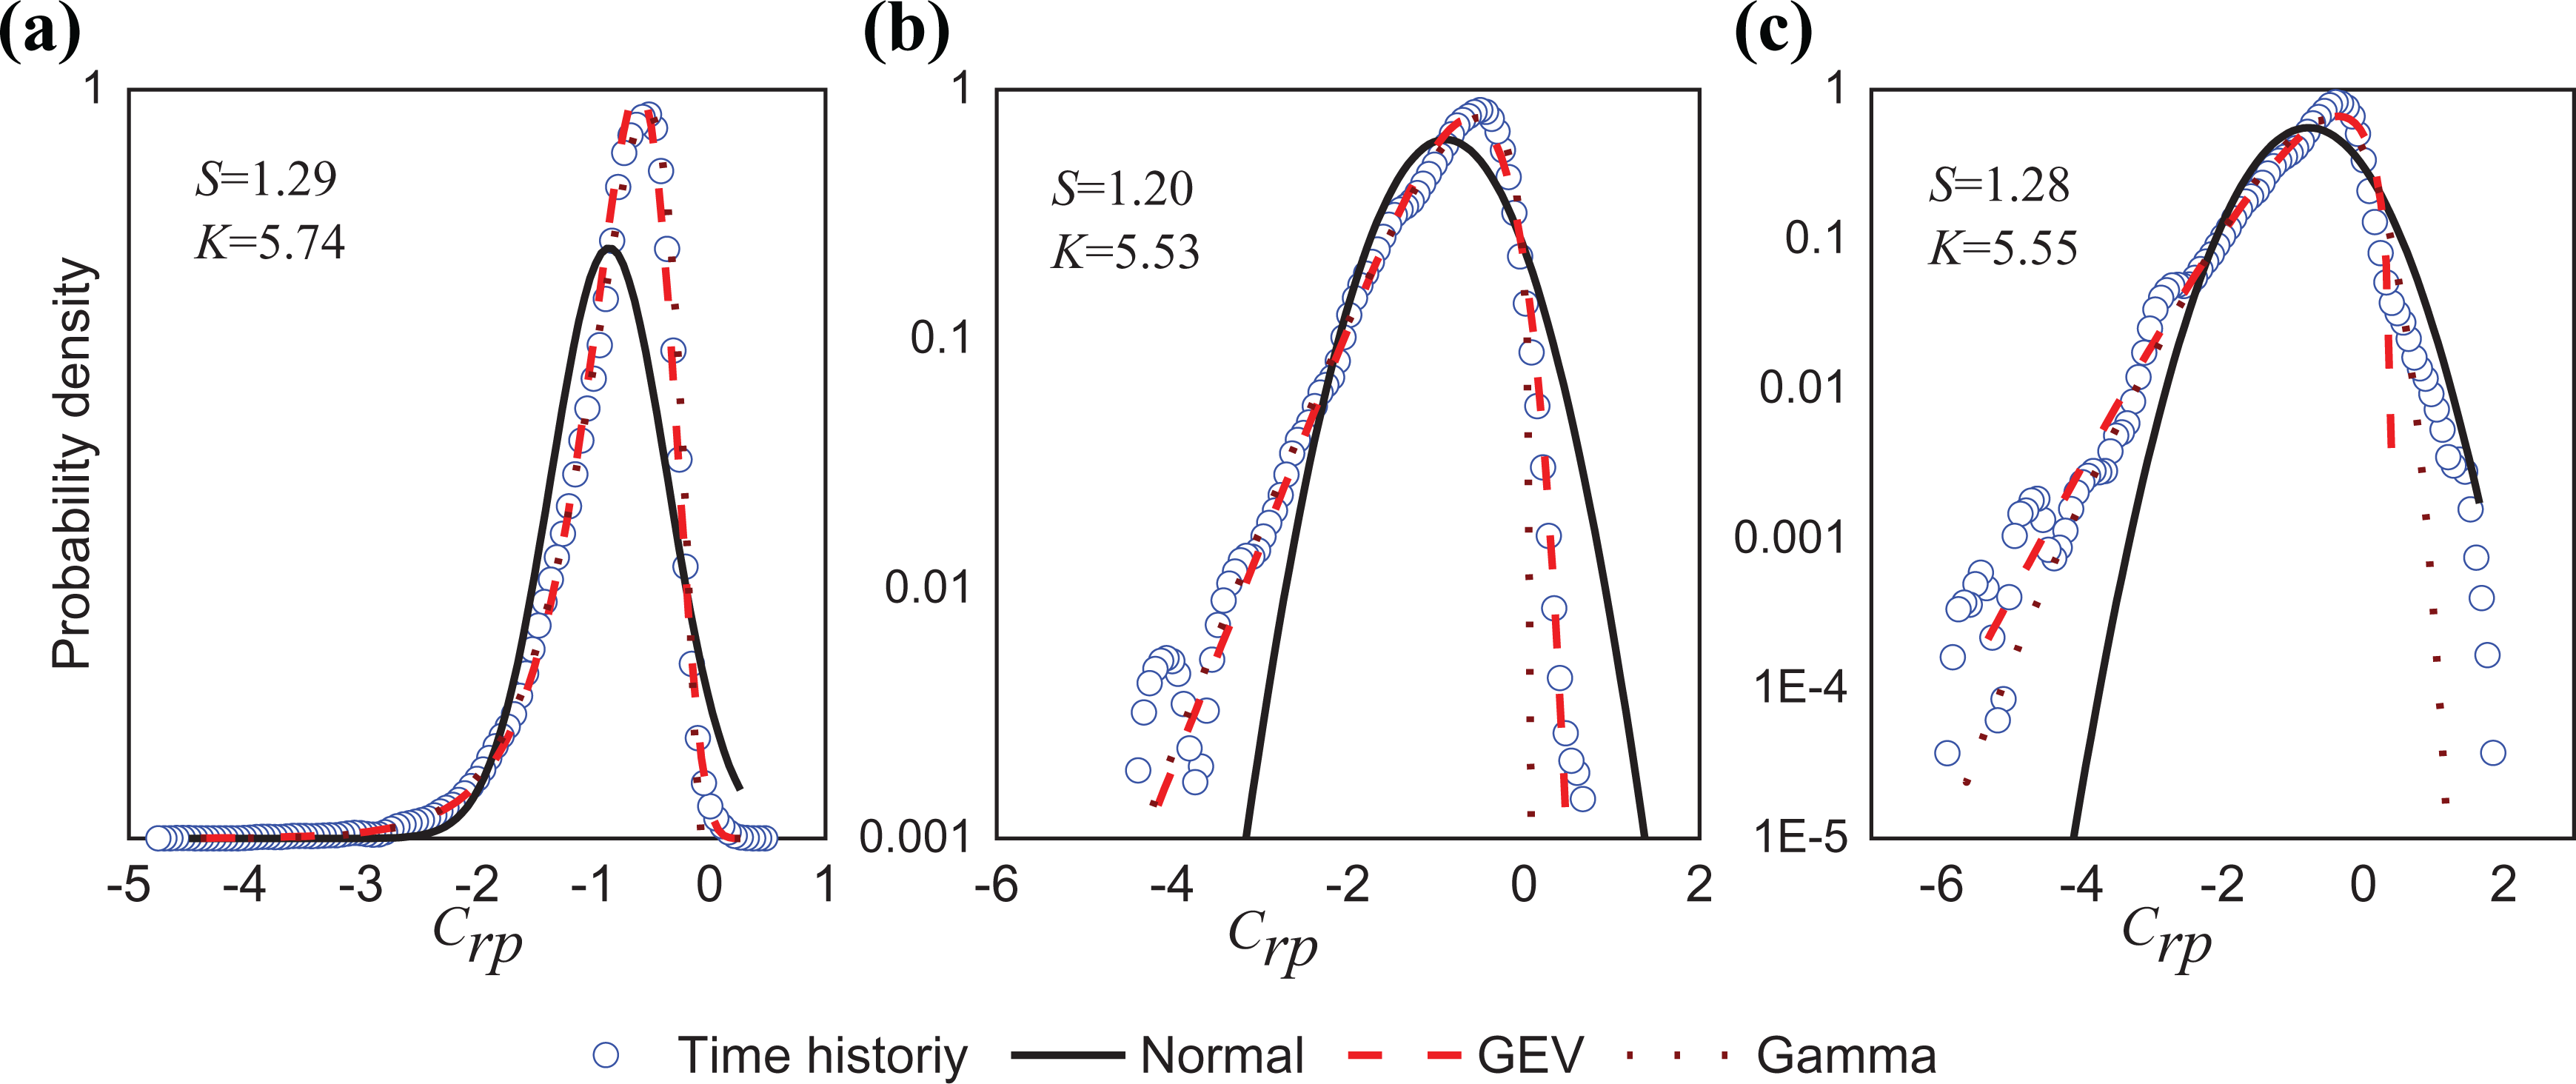
Probability distributions of wind–rain induced pressure coefficients for Case 1: (a) Tap 1, (b) Tap 2, and (c) Tap 3.
Spatial correlation analysis for WRIPs
When the flow approaches test building, flow separation and attachment were generated which make different scales of complicated vortex movement on the surface of the building (Kawai, 2002). In this case, wind pressure on building’s surface cannot be predicted by quasi-steady method. The fluctuation wind pressure correlation between different points on building’s surface is correlated with vortex movement (Sun et al., 2009). So study on fluctuation wind pressure correlation between different points on building’s surface has important significance for deeply understanding the flow movement and exploring the variation of turbulence structure.
Spatial cross-correlation coefficient which shows the correlation between WRIPs at different locations is given
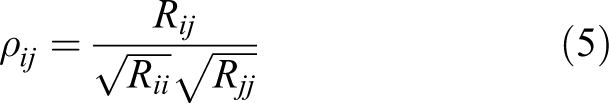
where ρij and Rij are cross-correlation coefficient and cross-correlation function of WRIP for Taps i and j, respectively. Rii and Rjj are autocorrelation function for Taps i and j, respectively.
Strong correlation often refers to the condition of the absolute value of correlation coefficient being greater than 0.5, whereas coefficients between –0.2 and 0.2 are indicative of a poor correlation. The correlation coefficients of WRIP pressures at three taps are shown in Figure 21. It is found that the correlation coefficients are greater than 0.7 for all cases, which indicates a strong correlation among them. However, the correlation coefficient decreases with the increase in distance between the taps.
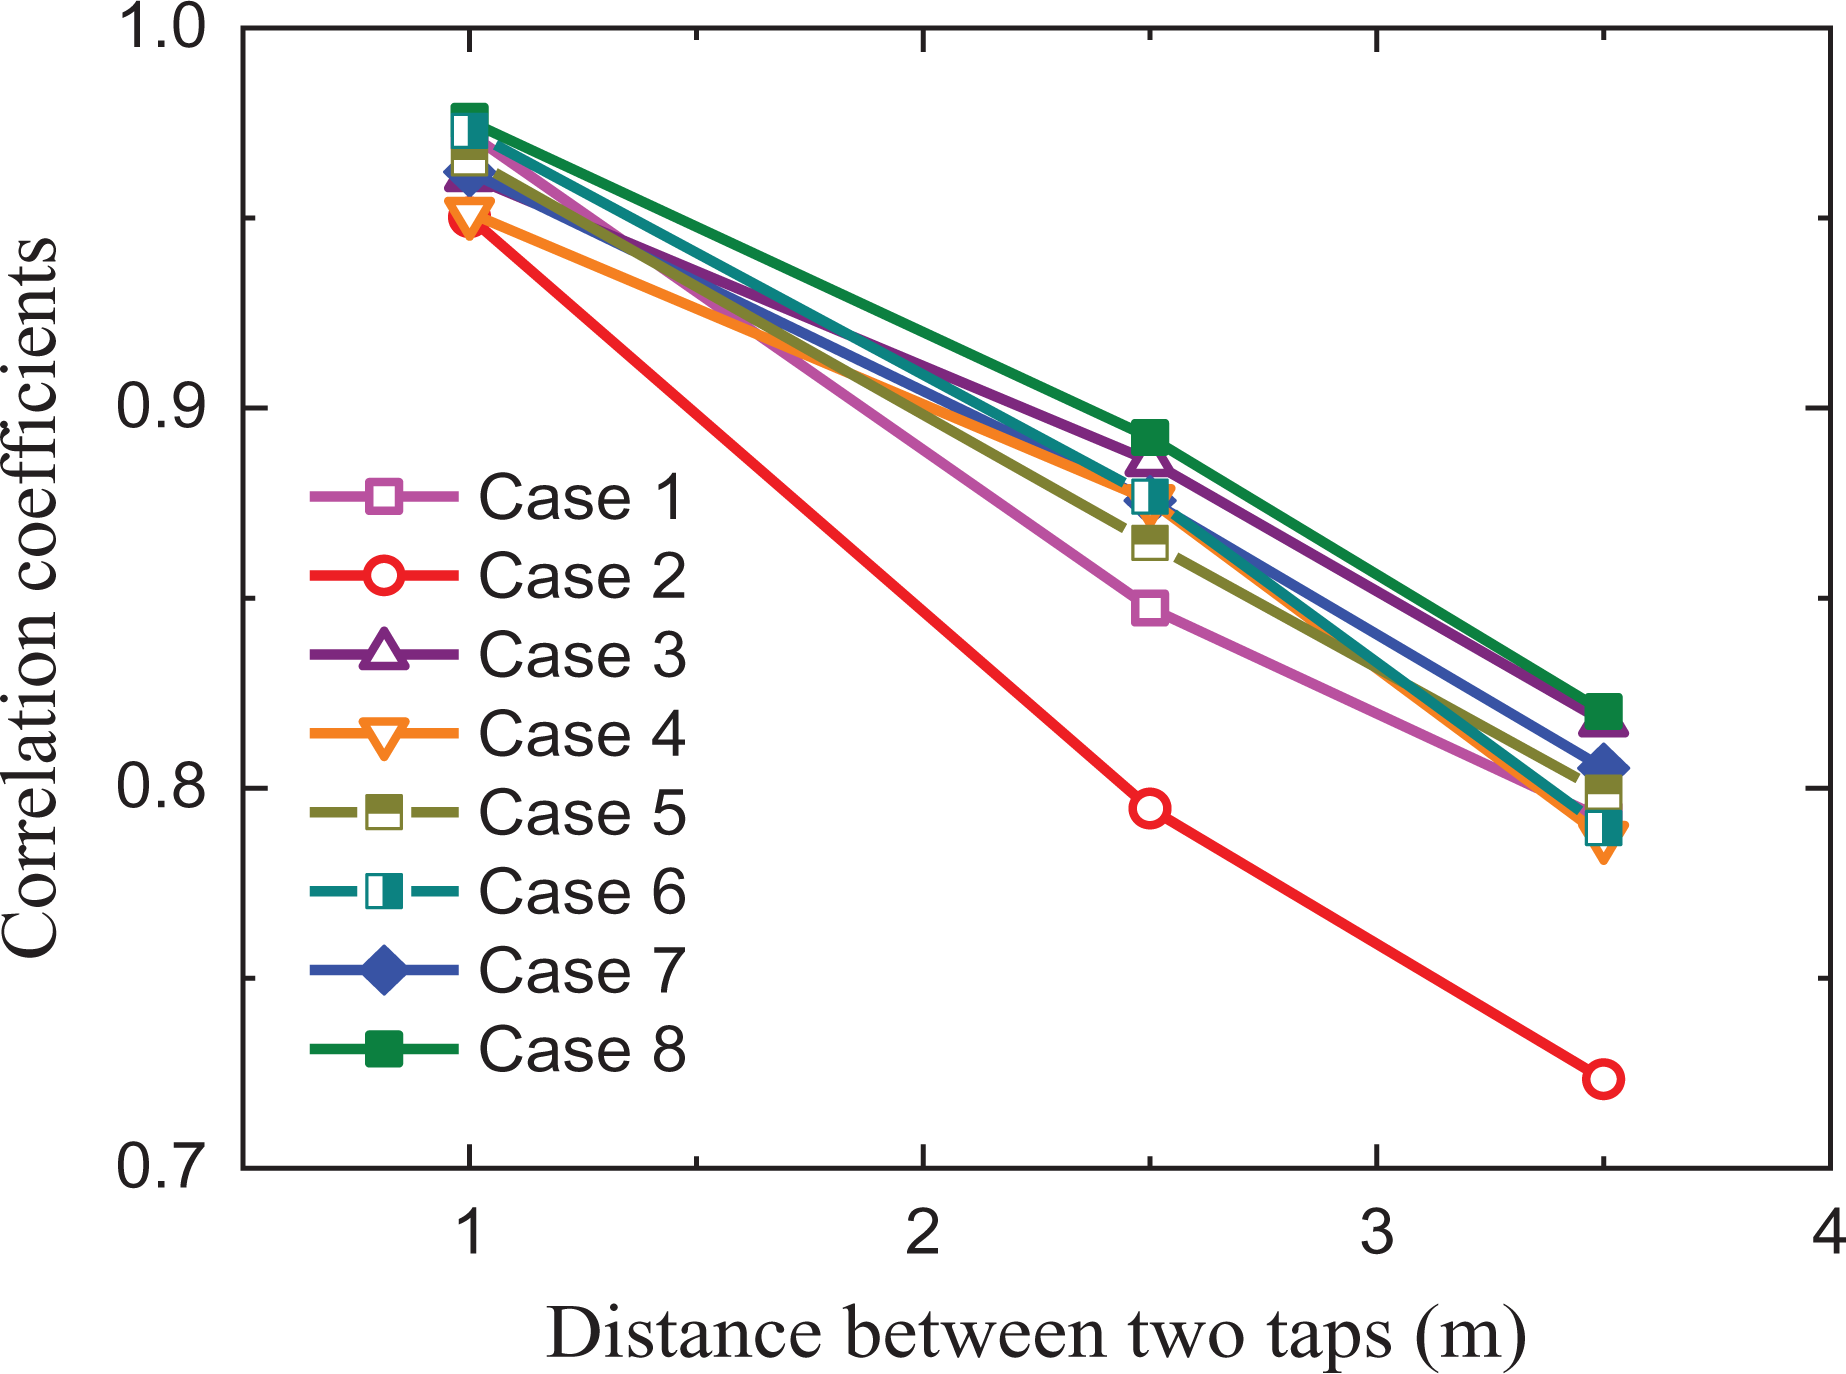
Pressure correlation coefficients for eight cases.
At a specific wind direction (e.g. 120° and 130°), the correlation coefficient of the data collected during the storm decreases with the increase of RI. It indicates that the RI has somehow influence on the correlation of the wind loading acting on the wall. The probability action mechanics is that heavy raindrops can destroy the inner structure of the vortex and hamper the formation and development of the vortex, which lead to the decrease in correlation coefficient. In addition, the correlation coefficients obtained using the full-scale data are less than those by the wind tunnel test. The reason is that the formation of vortex is easier in wind tunnel than in field, because of the more complicated wind field and unstable direction in field condition.
Conclusion
In this study, WRIP data were collected at three taps on the windward side of the Tongji University experimental building during the Typhoon Haikui (2012). The characteristic and probability distribution of the WRIPs at the wind directions ranging from 110° to 135° were analyzed. The following conclusions were drawn:
The presence of driving rains clearly intensifies the wind effects acting on the windward side of the building, so structural designers and researchers should pay more attention to it.
The mean WRIP coefficients at the three taps increase in magnitude with their distances from the wall corner. Results reveal that the mean WRIP coefficients collected during the storm are clearly larger in magnitude as compared with the data from normal wind events without rains and wind tunnel study. It was found that for the wind directions of 110° to 135°, the mean WRIP coefficients show an increasing trend with the RI, regardless of the tap locations.
The fluctuating WRIP coefficients at the three taps decrease in magnitude with their individual distances from the wall corner. However, the fluctuating coefficients from the full-scale measurements are still larger than those from the wind tunnel test. For the wind directions of 110°–135°, the variation of the fluctuating WRIP coefficients with the RI exhibits a trend similar to the mean WRIP coefficients.
The WRIP coefficients collected during the storm are strongly non-Gaussian and can be represented by Gamma distribution.
The WRIPs at three taps are highly correlated, regardless of whether the rain is present or not. However, the presence of the rains reduces the WRIP correlation. It was found that the correlation between two taps decrease with their increasing spacing.
Footnotes
Declaration of conflicting interests
The author(s) declared no potential conflicts of interest with respect to the research, authorship, and/or publication of this article.
Funding
The author(s) disclosed receipt of the following financial support for the research, authorship, and/or publication of this article: The research described in this article was financially supported by grants from the National Science Foundation of China (Grant Nos. 51678452, 51708074, and 51678544), the project of foundation and frontier research of Chongqing (Grant Nos. cstc2015jcyjBX0022 and cstc2017jcyjAX0187), and the Ministry of Science and Technology of China (Grant No. SLDRCE19-B-12). The authors gratefully acknowledge such financial support.