
Abstract
For investigation of the effects of turbulence intensity (TI) on the wind loads on wind turbine blade, a 1:20 scaled model of a typical 3D wind turbine blade is designed and used for the pressure measurement test in a wind tunnel. Five uniform flows with different turbulence intensities are simulated in the wind tunnel test. The mean and root-mean-square (RMS) wind pressure coefficients, base moment coefficients, and their power spectral densities are presented and discussed in detail. Combined with the dynamic properties of the blade structure, wind-induced displacements at the tip of the blade are calculated by the random vibration theory. The results show that the increasing of TI amplifies the aerodynamic loads on the blade in terms of RMS wind pressure coefficients and RMS bending moment coefficients. Large wind-induced displacement of the wind turbine blade may be stimulated by high TI even under the feathering condition. This article aims to further the understanding of wind loads on wind turbine blades and provide useful information for the wind-resistant design of wind farms established in regions with high turbulence levels.
Introduction
As a renewable and non-polluting green energy source, wind energy has been developed and utilized by many countries all over the world (Adaramola et al., 2014; Li et al., 2018a, 2018b; Millward-Hopkins et al., 2013; Mukulo et al., 2014; Shu et al., 2015). Most wind farms were built on the top of mountains or plains to capture more wind energy at the early stage. In recent years, offshore wind power is getting more and more attractive for its stable wind resources, smaller environmental impact, and less constraints on the wind turbine size (Bagiorgas et al., 2012; Esteban et al., 2011). However, offshore sites are usually near the coastal areas and easy to suffer from the extreme wind conditions, such as typhoons. As a flexible structural system, the aerodynamic performance of wind turbine is very sensitive to environmental wind excitations (Dai et al., 2011; Kaya et al., 2018). Chou et al. (2013) pointed out that over 46.2% of wind turbine blades were resulted from the extreme wind conditions. Wang and Chen (2010) investigated the blade damages of offshore wind turbine after strong typhoon “Cuckoo” and concluded that high turbulence caused the buffeting problem of wind turbine blade, although the blades were pitched to a feather position to sustain minimal wind loads during the typhoon. So, it is necessary to study the aerodynamic performance of wind turbine blades during extreme wind conditions.
In the early stage, researchers investigated the aerodynamic performance by conducting a series of wind tunnel test for prototype small sized wind turbines. National Renewable Energy Laboratory (NREL) measured the loads and wind pressure distributions of a two-blade wind turbine with a diameter of 10 m in the wind tunnel at National Aeronautics and Space Administration (Hand et al., 2011). He and Chen (1990) obtained the wind load distributions by measuring the pressure distributions on the blade surface of a horizontal axis wind turbine with a diameter of 5.35 m at the China Aerodynamics Research and Development Center. Scheper and Snel (2007) conducted a study on a 4.5 m three-blade wind turbine in the wind tunnel of Deutschland–Netherlands Wind Tunnels and analyzed the pressure distributions and the flow fields around the wind turbine blade. With the application of composite materials, the size of wind turbine blade has been gradually increased for capturing more wind energy in recent years. Due to the section limitation of wind tunnels, it is very hard to carry out wind tunnel tests for prototype wind turbine blades or large size scaled models (Ross and Altman, 2011). Alternatively, various 2D airfoils were usually selected to investigate the aerodynamic performance of wind turbine blades for simplification. Devinant et al. (2002) carried out the wind tunnel test to study the aerodynamic properties including lift, drag, pitching moment, and pressure distributions of an airfoil and indicated that the aerodynamic behavior of the airfoil can be strongly affected by the turbulence level of incident wind flows. Li et al. (2017a, 2017b) investigated the wind pressures acting on the blade surface at different low Reynolds numbers with turbulence generation grids in wind tunnel testing. Bai et al. (2013) designed a horizontal axis wind turbine blade by the blade element momentum theory and investigated its flow structures and aerodynamic characteristics by numerical simulation. Ge et al. (2019) studied the effects of leading edge defects on aerodynamic performance of the S809 airfoil via CFD simulation. However, the previous research works on the 2D airfoils are not available to reflect the 3D aerodynamic performance of wind turbine blades. Moreover, Wang et al. (2018) pointed out that the maximum turbulence intensity (TI) can even reach to 20% under typhoon. The TI classification specified in the standard of International Electro-technical Commission (IEC) (IEC61400-1, 2005) is not enough to cover all the extreme wind conditions. In view of the above discussions, this article aims to investigate the aerodynamic performance of 3D wind turbine blade subjected to wind flows with various turbulence intensities. First, five uniform wind fields with different turbulence intensities are simulated in a wind tunnel. Second, a 1:20 scaled model of a typical wind turbine blade is designed and built for the pressure measurement wind tunnel test. Then, the pressure measurements for the model of 3D wind turbine blade are conducted. Based on the test results, wind pressure distributions on the surface of the blade model, base moment coefficients at the blade root, and wind-induced displacements of the blade tip are analyzed and discussed in detail. The results of this study aim to further the understanding of the wind loads on wind turbine blades and provide useful information for the wind-resistant design of wind farms established in regions with high turbulence.
Wind tunnel test
Wind field simulation
Wind tunnel testing was carried out in the wind tunnel at Hunan University of Science and Technology, China. The facility is of 21 m long and its working section is of 4 m (width) × 3 m (height). Five different uniform wind fields were simulated by changing the width of the wooden grid baffles mounted on an upstream cross-section ahead the turntable in the wind tunnel (Li et al., 2019). In order to cover the turbulence intensities specified in the standard of IEC, the turbulence intensities in the five wind fields were simulated as 7.0% (I
1
), 10.0% (I
2
), 14.0% (I
3
), 18.0% (I
4
), and 22.0% (I
5
), respectively, as shown in Figure 1. The wind speed in the simulated wind fields was about 10 m/s, 10 m/s, 8.15 m/s, 8 m/s, and 7.75 m/s, respectively. The different turbulence intensities and various wind speeds were tested by a TFI Cobra Probe system. The Reynolds number calculated in terms of the mean wind speed and the width of the top blade are 7.13 × 10⁵, 7.13 × 10⁵, 5.81 × 10⁵, 5.71 × 10⁵, and 5.53 × 10⁵ for the five wind fields, respectively. It can be observed that the mean wind speed and TI almost keep the same along the elevation for each simulated wind field. Simulated uniform wind field profiles. (a) Mean wind speed profile. (b) Turbulence intensity profile.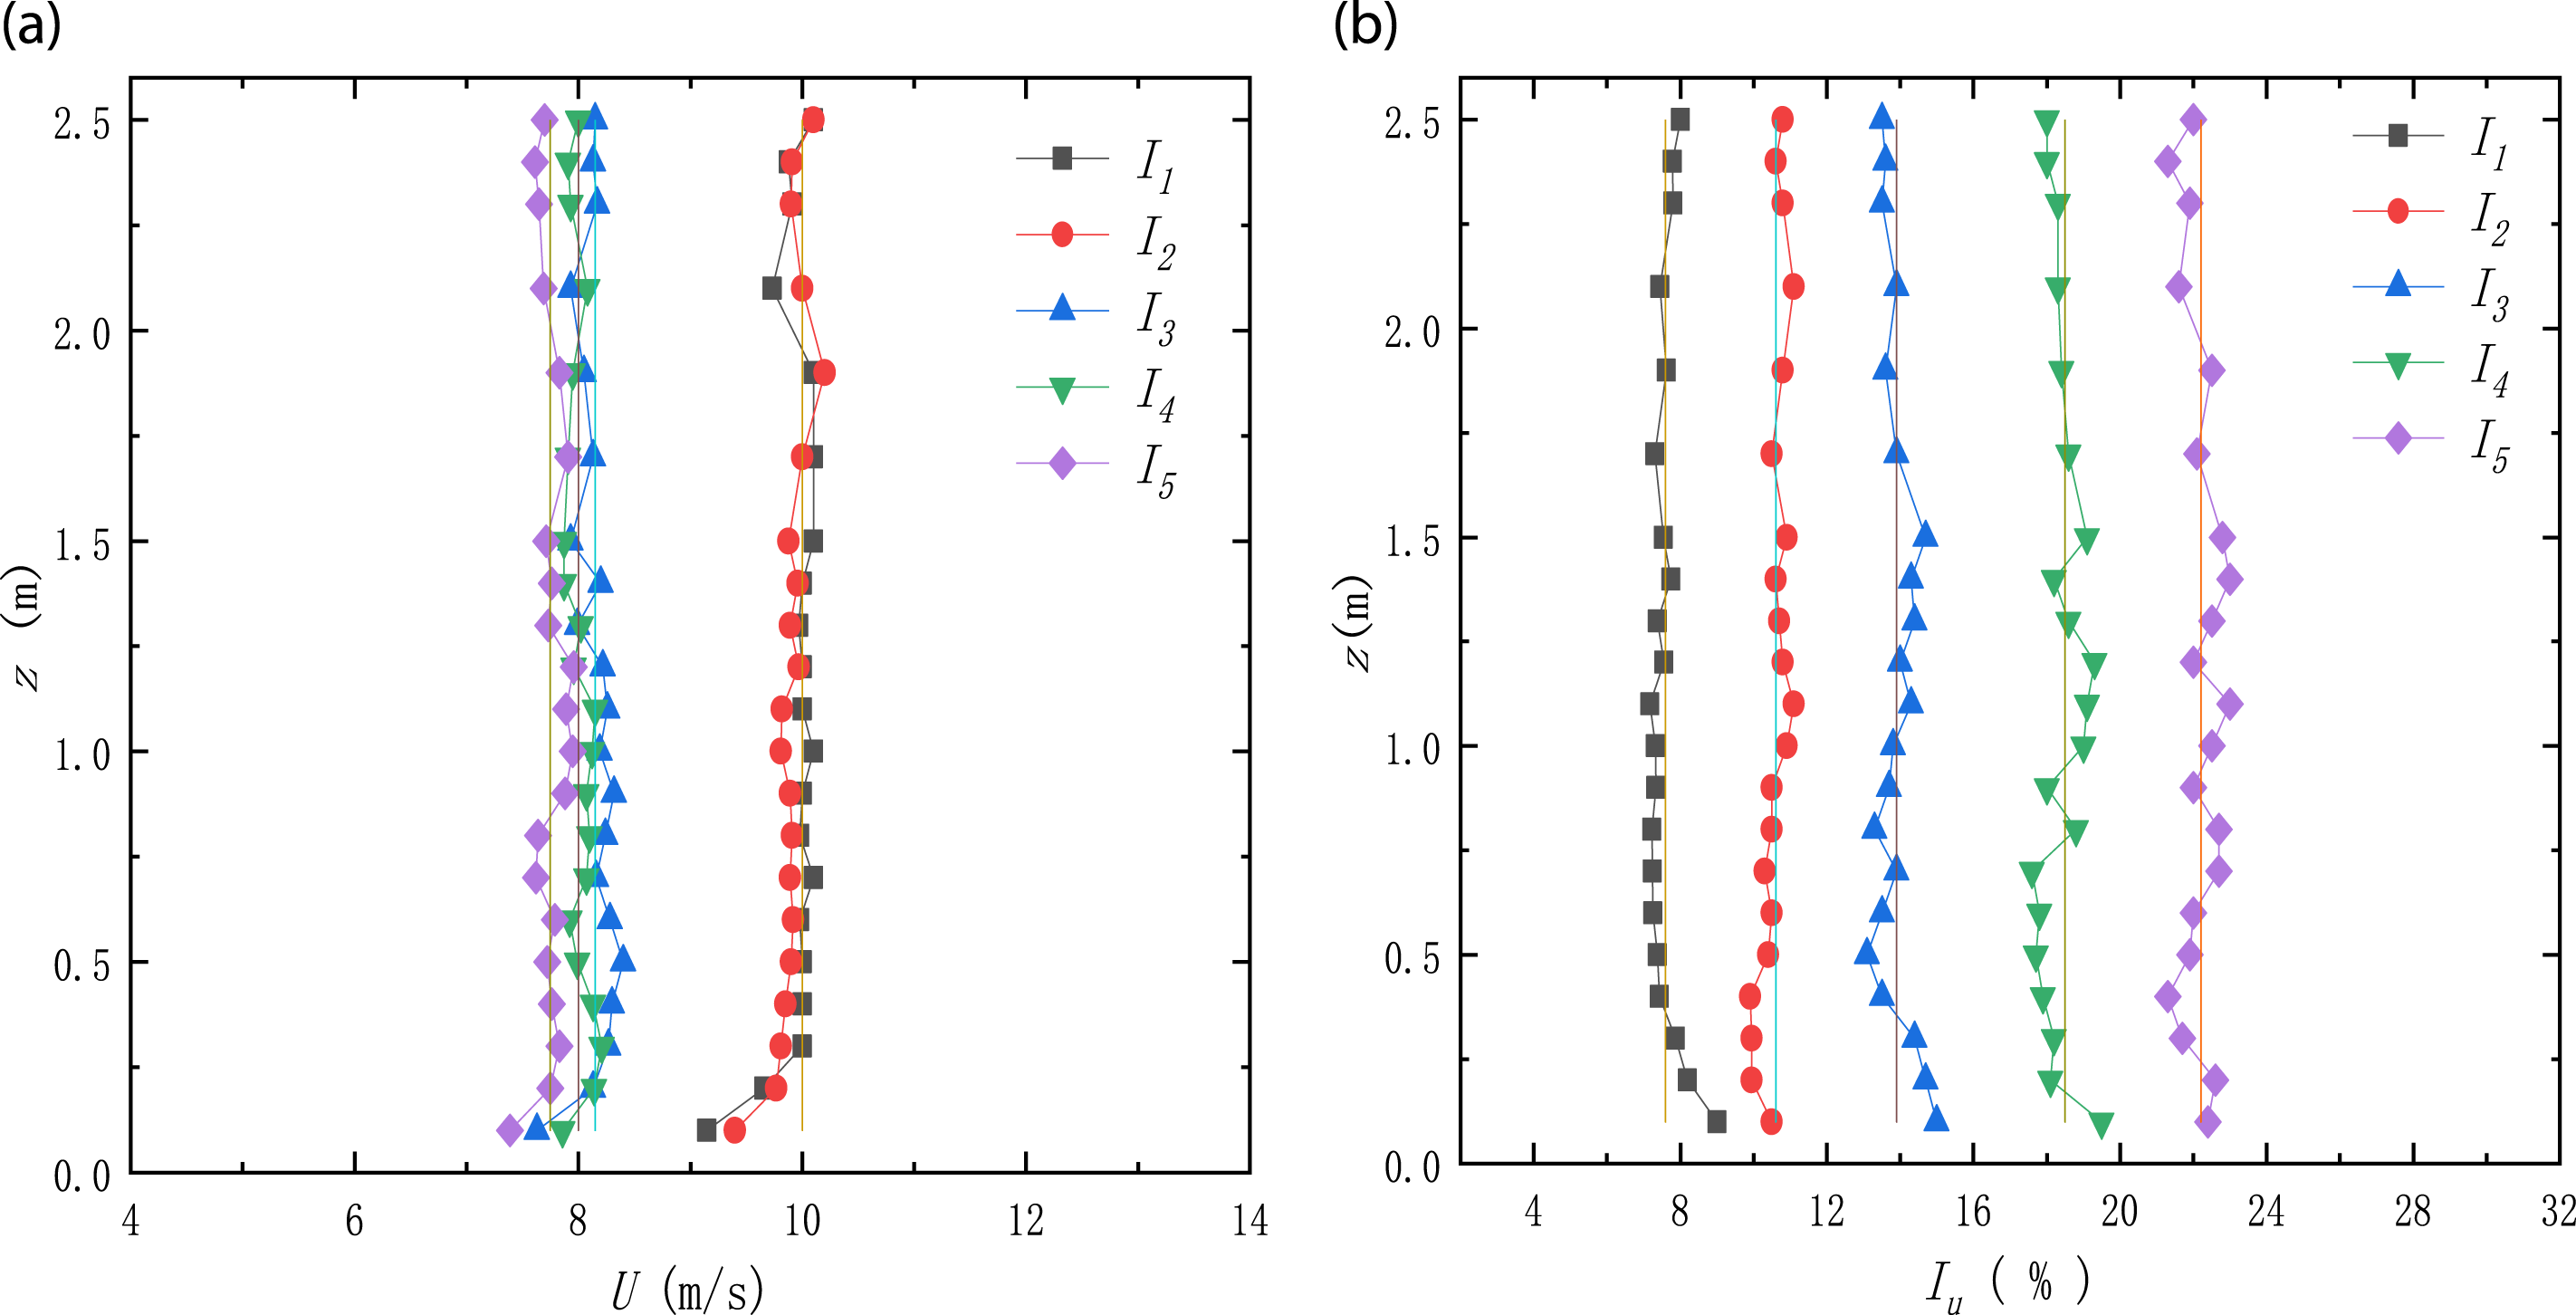
Wind turbine blade model
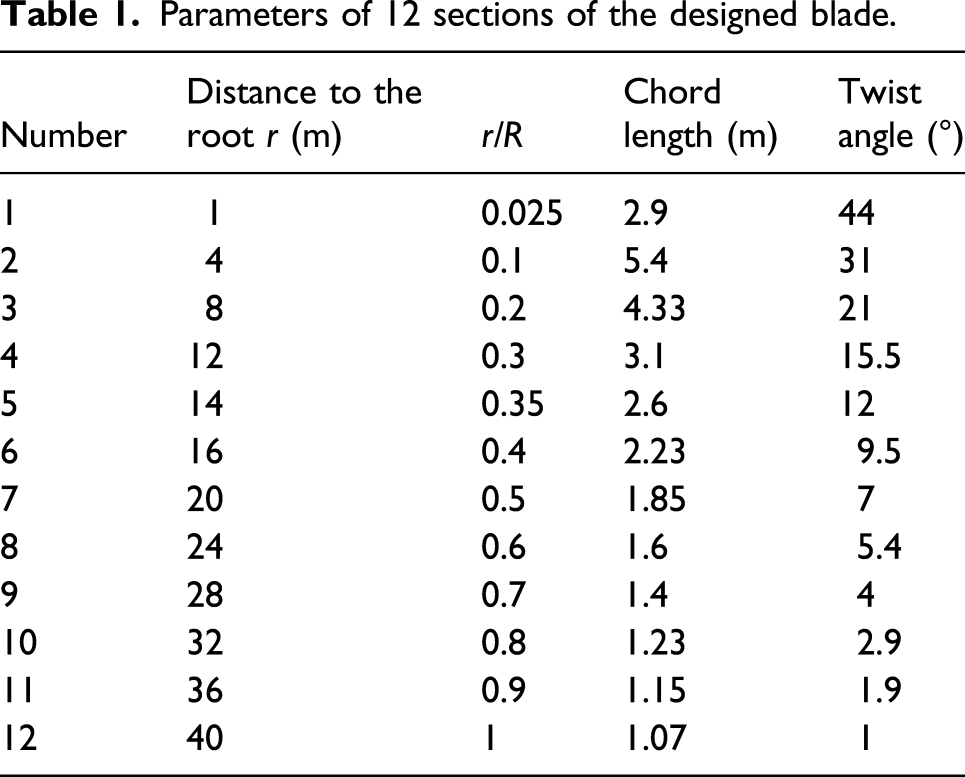
In order to accurately evaluate the 3D wind effects on wind turbine blades, the popular S-series airfoils of NREL were considered in this study to design a 40 m prototype wind turbine blade. As shown in Figure 2, three standard airfoils S818, S825, and S826 were adopted for the root, middle, and tip of the blade, respectively. The blade was divided into 12 sections to have the corresponding chord length and twist angle for the purpose of meeting the demands for aerodynamic performance and structural strength (O’Brien et al., 2017). Table 1 lists the parameters of the 12 sections of the designed blade. R stands for the radius of the blade. Standard airfoils for root, middle, and tip of the blade (relative dimension). Parameters of 12 sections of the designed blade.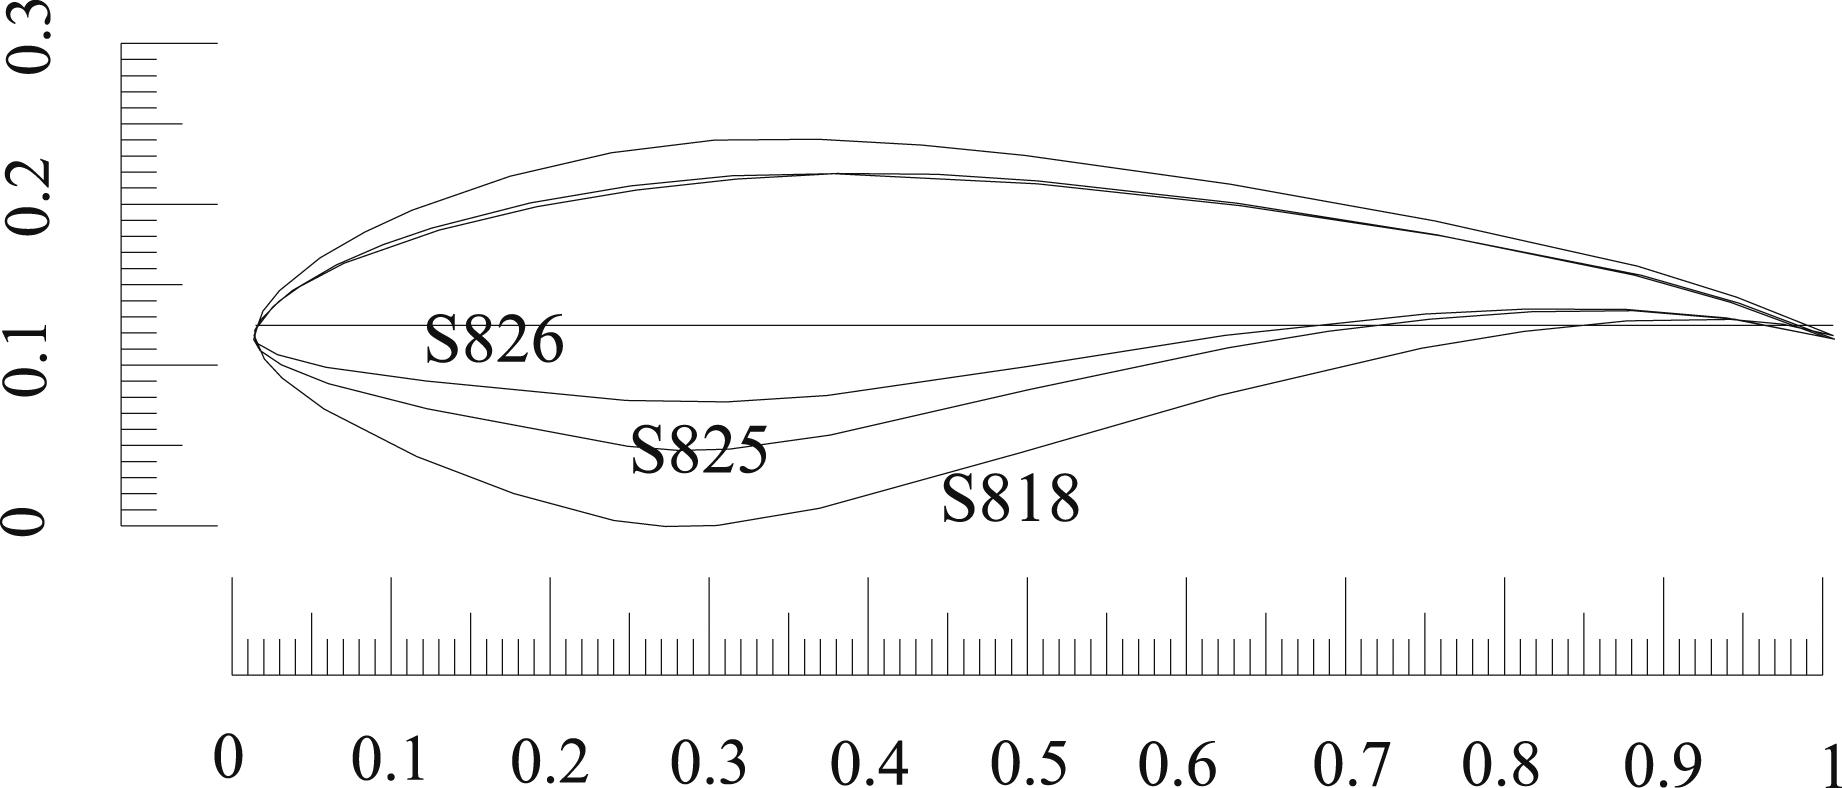
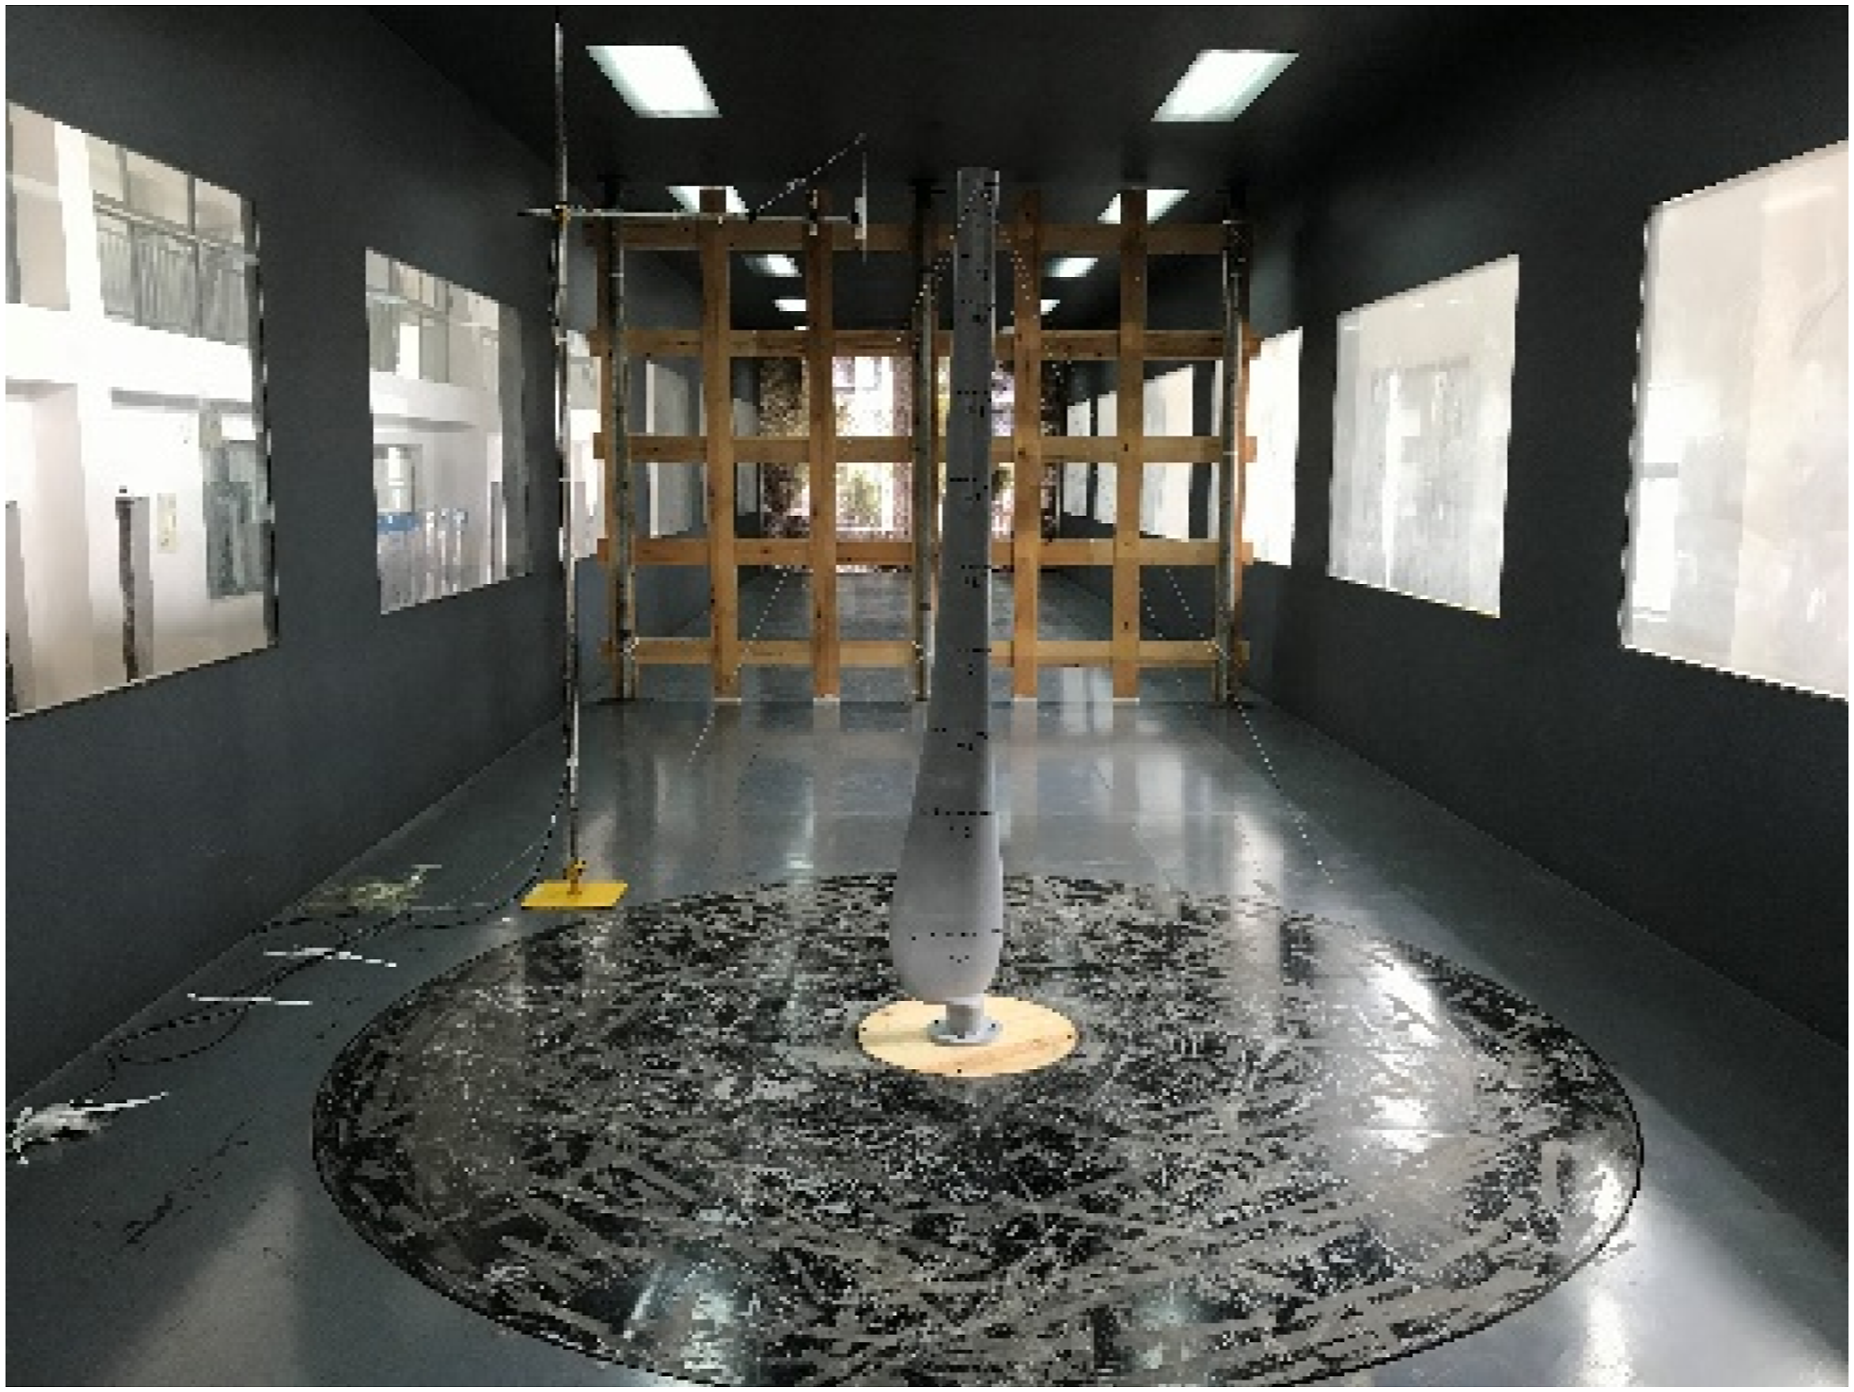
A 1:20 scaled rigid model of the blade for pressure measurements in the wind tunnel testing was made with 5 mm thick Acrylonitrile Butadiene Styrene plate to ensure its strength and rigidity. There are 11 measurement levels along the height of the blade model. The pressure taps are distributed on the model as illustrated in Figure 3. Since the airfoils change along with the length of blade, the measurement pressure taps on the root, central, and tip of the blade are different. Moreover, no taps have been designed along the trailing edges for the small scaled thickness of blade. The total number of the pressure taps is 189. The electronic pressure scanning system was used to synchronously measure the wind pressures at the pressure taps. Each tap was connected to the scanning module by a plastic tube through the hollow space inside the blade model. The maximum blockage ratio in the wind tunnel experiment was 1.82%. The sampling frequency for the pressure measurements was set to be 333 Hz, and the sampling length was 30 s. The total number of the wind pressure data obtained from a pressure tap was 10,000 for each wind direction considered in the wind tunnel testing. Figure 4 shows the wind turbine blade model in the wind tunnel. The root of the blade model was fixed on the turntable in the wind tunnel. The angle between the rotation plane of the blade and its tip line is defined as the pitch angle Distribution of pressure taps on the blade model. (a) Measurement levels. (b) Pressure taps at root, middle, and tip of the blade (relative dimension). Wind turbine blade model in wind tunnel testing. Definition of blade pitch angle.

Correction for tube-induced distortion effects
Dynamic pressure signal transferred from a pressure tap on the model surface to the scanning module may be distorted (He et al., 2019). Length and diameter of a tube are the key issues for the tube-induced distortion effects (Holmes and Lewis, 1987a, 1987b). Since the diameter of all tubes adopted for the present wind tunnel test keeps the same, hereby only the correction for the tube-induced distortion effects caused by the tube length is considered.
The tube-induced distortion is actual a problem of the frequency response function of the tube system. The frequency response function 
The frequency response function test was conducted for the tube system with different lengths. Figure 6 presents the measurement arrangement for the frequency response function test of the tube system. The measurement devices include a signal generator, a power amplifier, a speaker, and a Polyvinyl Chloride board with two pressure taps. The distance between the two taps is close enough so that the two input signals can be recognized as the same. The length of the short tube is limited to as short as 5 mm so that the output signal of the short tube is recognized as the same as the input signal. On contrary, the measured output signal of the long tube is the distorted signal. Measurement for the frequency response function of the tube system.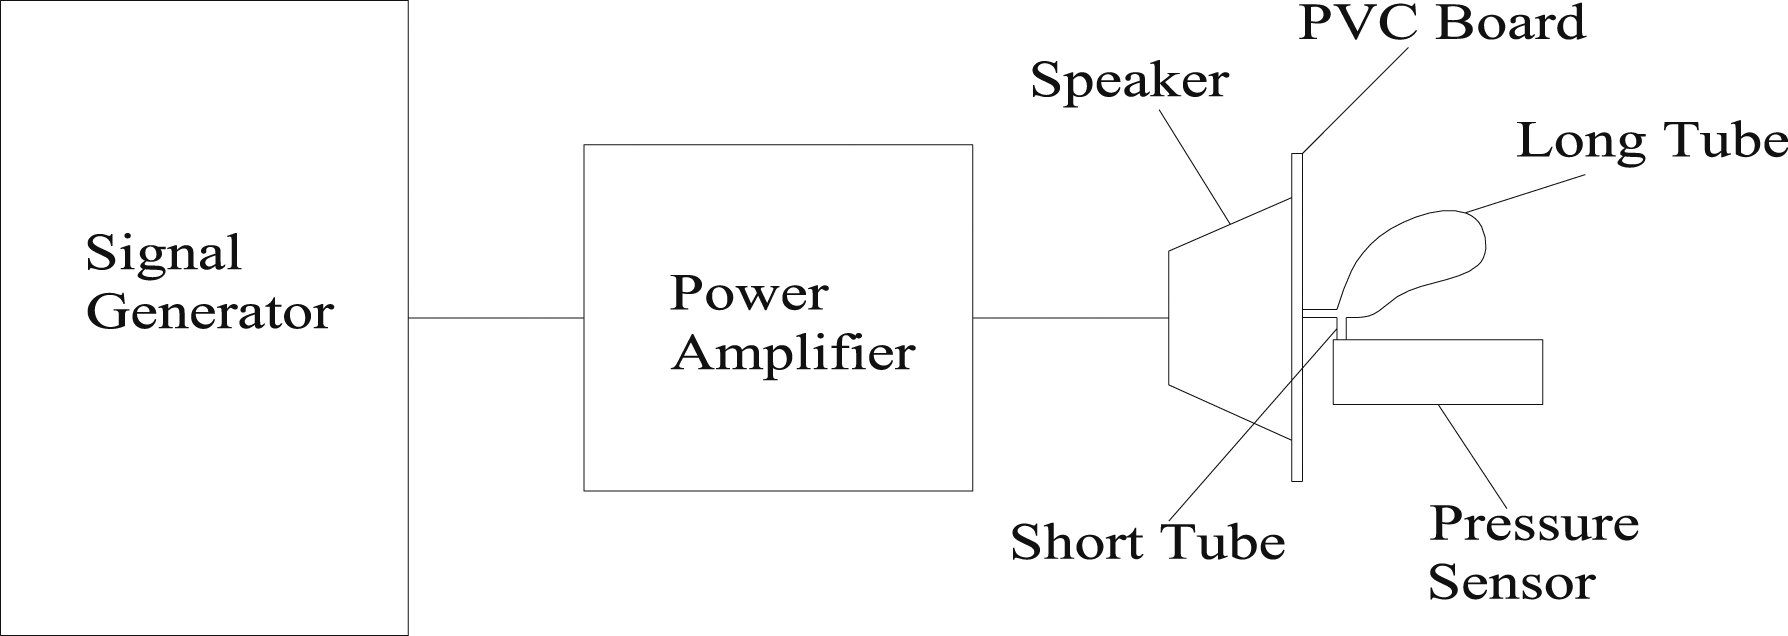
A series of sine wave pressure signals generated by the signal generator were used to measure the frequency response function of the tube system. Tubes with nine different lengths including 900 mm, 1100 mm, 1300 mm, 1500 mm, 1700 mm, 1900 mm, 2000 mm, 2100 mm, and 2200 mm were selected for the frequency response function test. By changing the frequency of the input signals, the amplitude ratios and phase differences of the output signals of the tube system with various lengths can be obtained as shown in Figure 7. It can be observed that the amplitude ratio decreases quickly at the low frequency and stays almost stable when the frequency is larger than 40 Hz. The phase difference decreases linearly as the frequency increases. Both the amplitude ratio and phase difference decrease as the tube length increases, indicating that the tube-induced distortion cannot be ignored. Frequency response functions of the tube system with different lengths. (a) Amplitude ratio. (b) Phase difference.
Although the length of the blade is 2000 mm, extra length (about 200 mm) is designed between the base of blade model and the scanning module. Therefore, this study focuses on the correction for the tube-induced distortion effects on the tube system with length of 2200 mm. By applying the correction method proposed by He et al. (2019) to the frequency response function test of the tube system, the output pressure signals were corrected accordingly. Figure 8 illustrates the comparisons of time-varying results among the original, distorted, and corrected signals. It can be found that the tube-induced distortion effects can be effectively corrected by the frequency response function method. Moreover, the comparisons of distorted and corrected wind pressures are presented in Figure 9. In general, the corrected wind pressures match well with the distorted wind pressures, which indicated that the 2200 mm length tube with the corrected frequency response function can be used for the wind pressure measurement of the blade. Comparisons of periodic pressures measured by 2200 mm tube. Comparisons of wind pressures measured by 2200 mm tube.

Data processing
Wind pressure coefficients
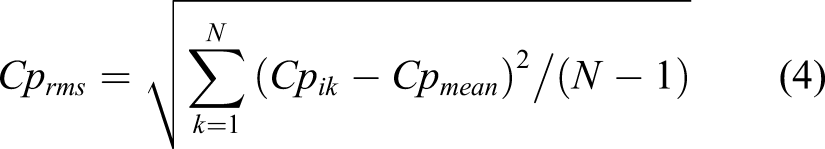
The wind pressure coefficient 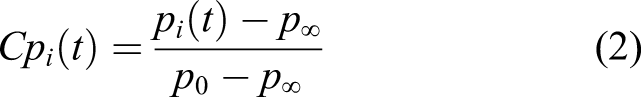
The mean wind pressure coefficient 
Bending moment coefficients
The bending moment coefficients of a cantilever structure can be calculated based on the following equations (Li et al., 2020a, 2020b)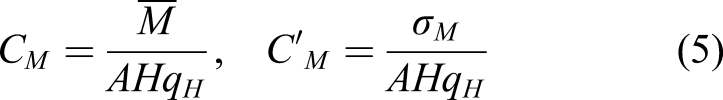
Wind-induced responses
The wind turbine blade considered in this study can be simplified as a cantilever structure with variable cross-section. Based on the random vibration and structural mechanics theory, the differential equation of its wind-induced motion can be expressed as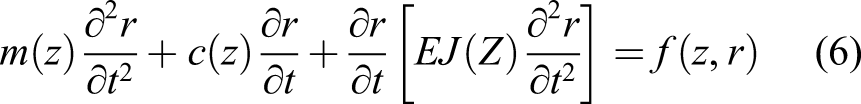
Based on the orthogonality of mode shapes, equation (6) can be simplified with generalized coordinates 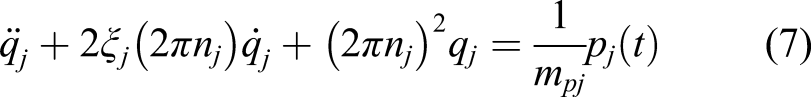
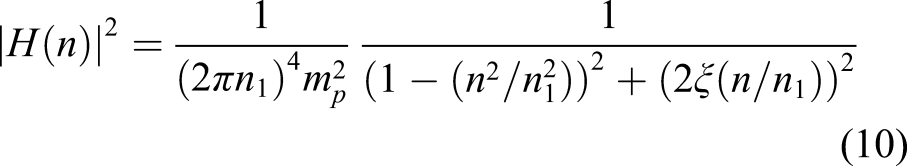
Since the wind-induced response of a cantilever structure is mainly attributed to the first mode of the structure (Li et al., 2007, 2016), hereby only the first-order mode of the wind turbine blade is taken into consideration for analysis of the wind-induced responses in this article. So, the spectrum of displacement response 

The RMS displacement 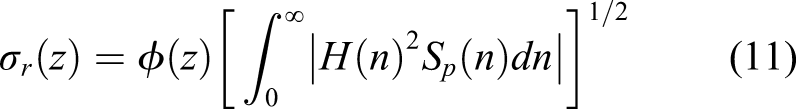

Results and discussions
Variation of mean wind pressure distribution with pitch angle
The pitch angle of a wind turbine blade usually keeps at 0° to capture more wind energy. When extreme wind condition happens, the pitch angle will turn to feathering status ( Variations of mean wind pressure coefficient distributions on the blade with pitch angle under flow field with turbulence intensity of 7%. (a) Upper wing of the blade. (b) Lower wing of the blade.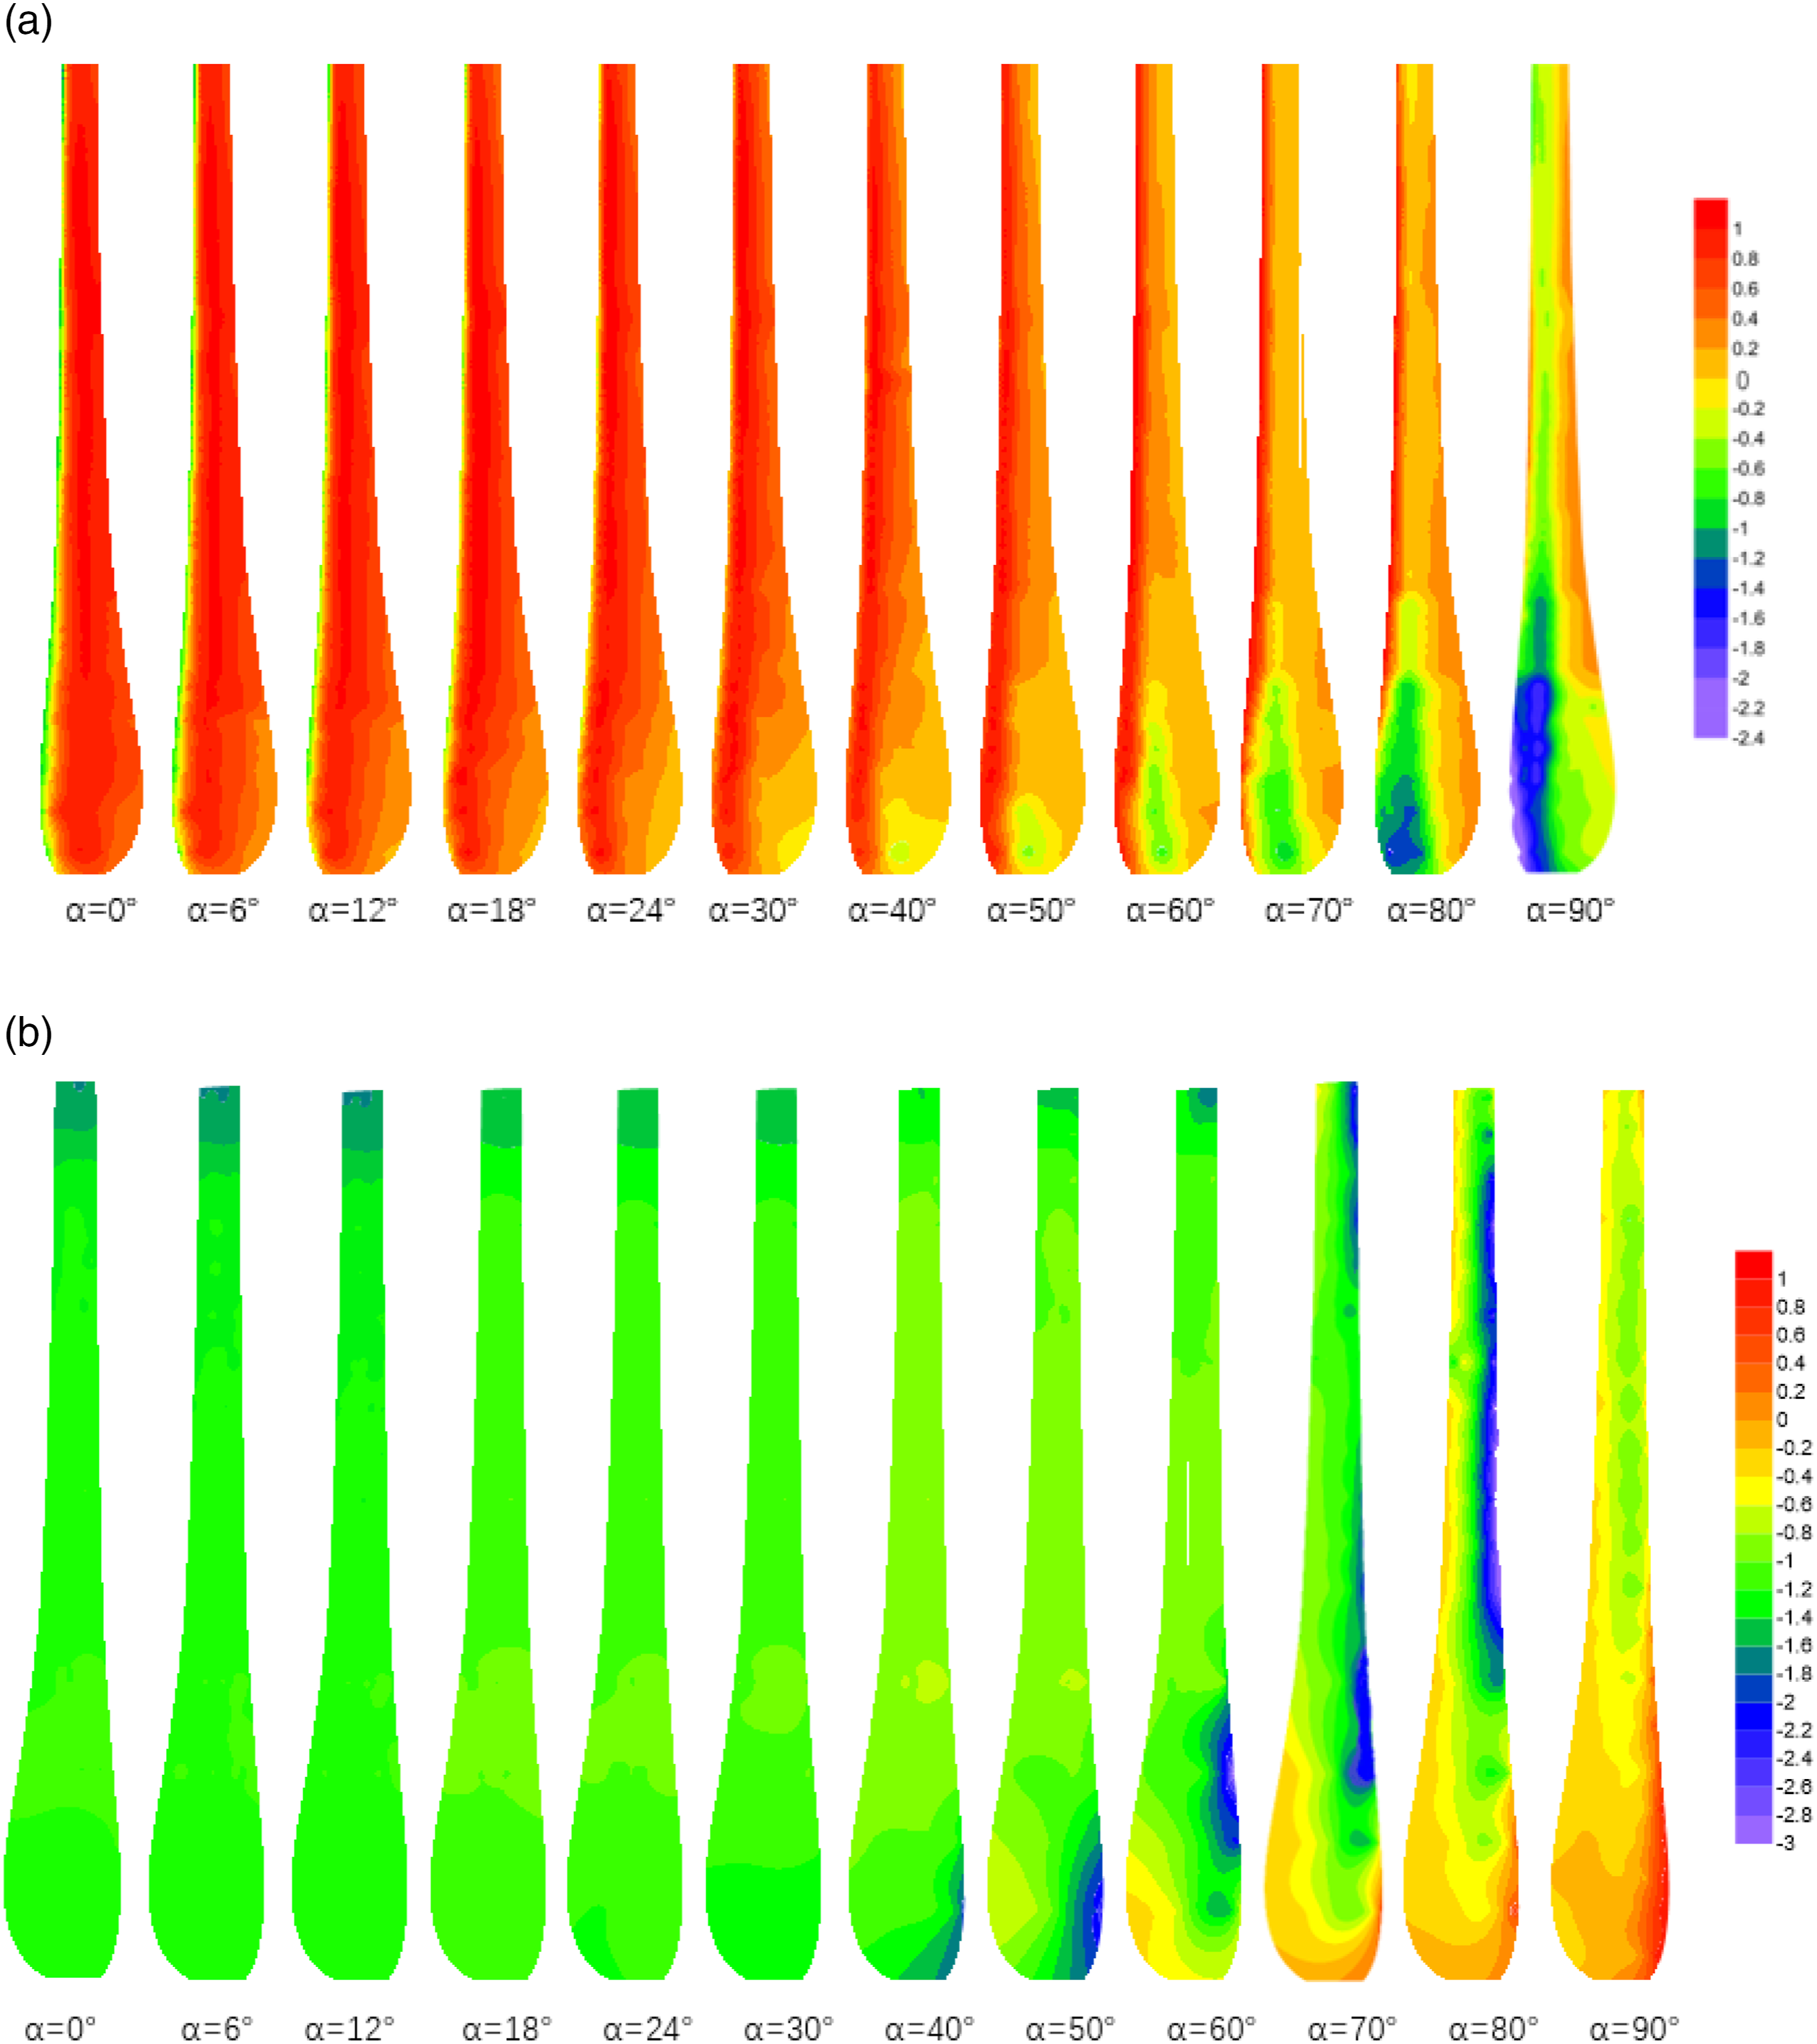
Wind pressure coefficients under pitch angle of 0°
Three typical measurement levels corresponding to the root (0.1 R), middle (0.5 R), and tip (0.9 R) of the blade are selected to investigate the variation of wind pressure coefficients with turbulence intensities in the Wind Pressure Coefficients Under Pitch Angle of 0° and Wind Pressure Coefficients Under Pitch Angle of 90° sections. Figure 11 shows the mean wind pressure coefficients on the root, middle, and tip of the blade, respectively. The label Mean wind pressure coefficients on typical measurement levels. (a) 0.1R. (b) 0.5R. (c) 0.9R. Note: TI stands for turbulence intensity, unless otherwise specified.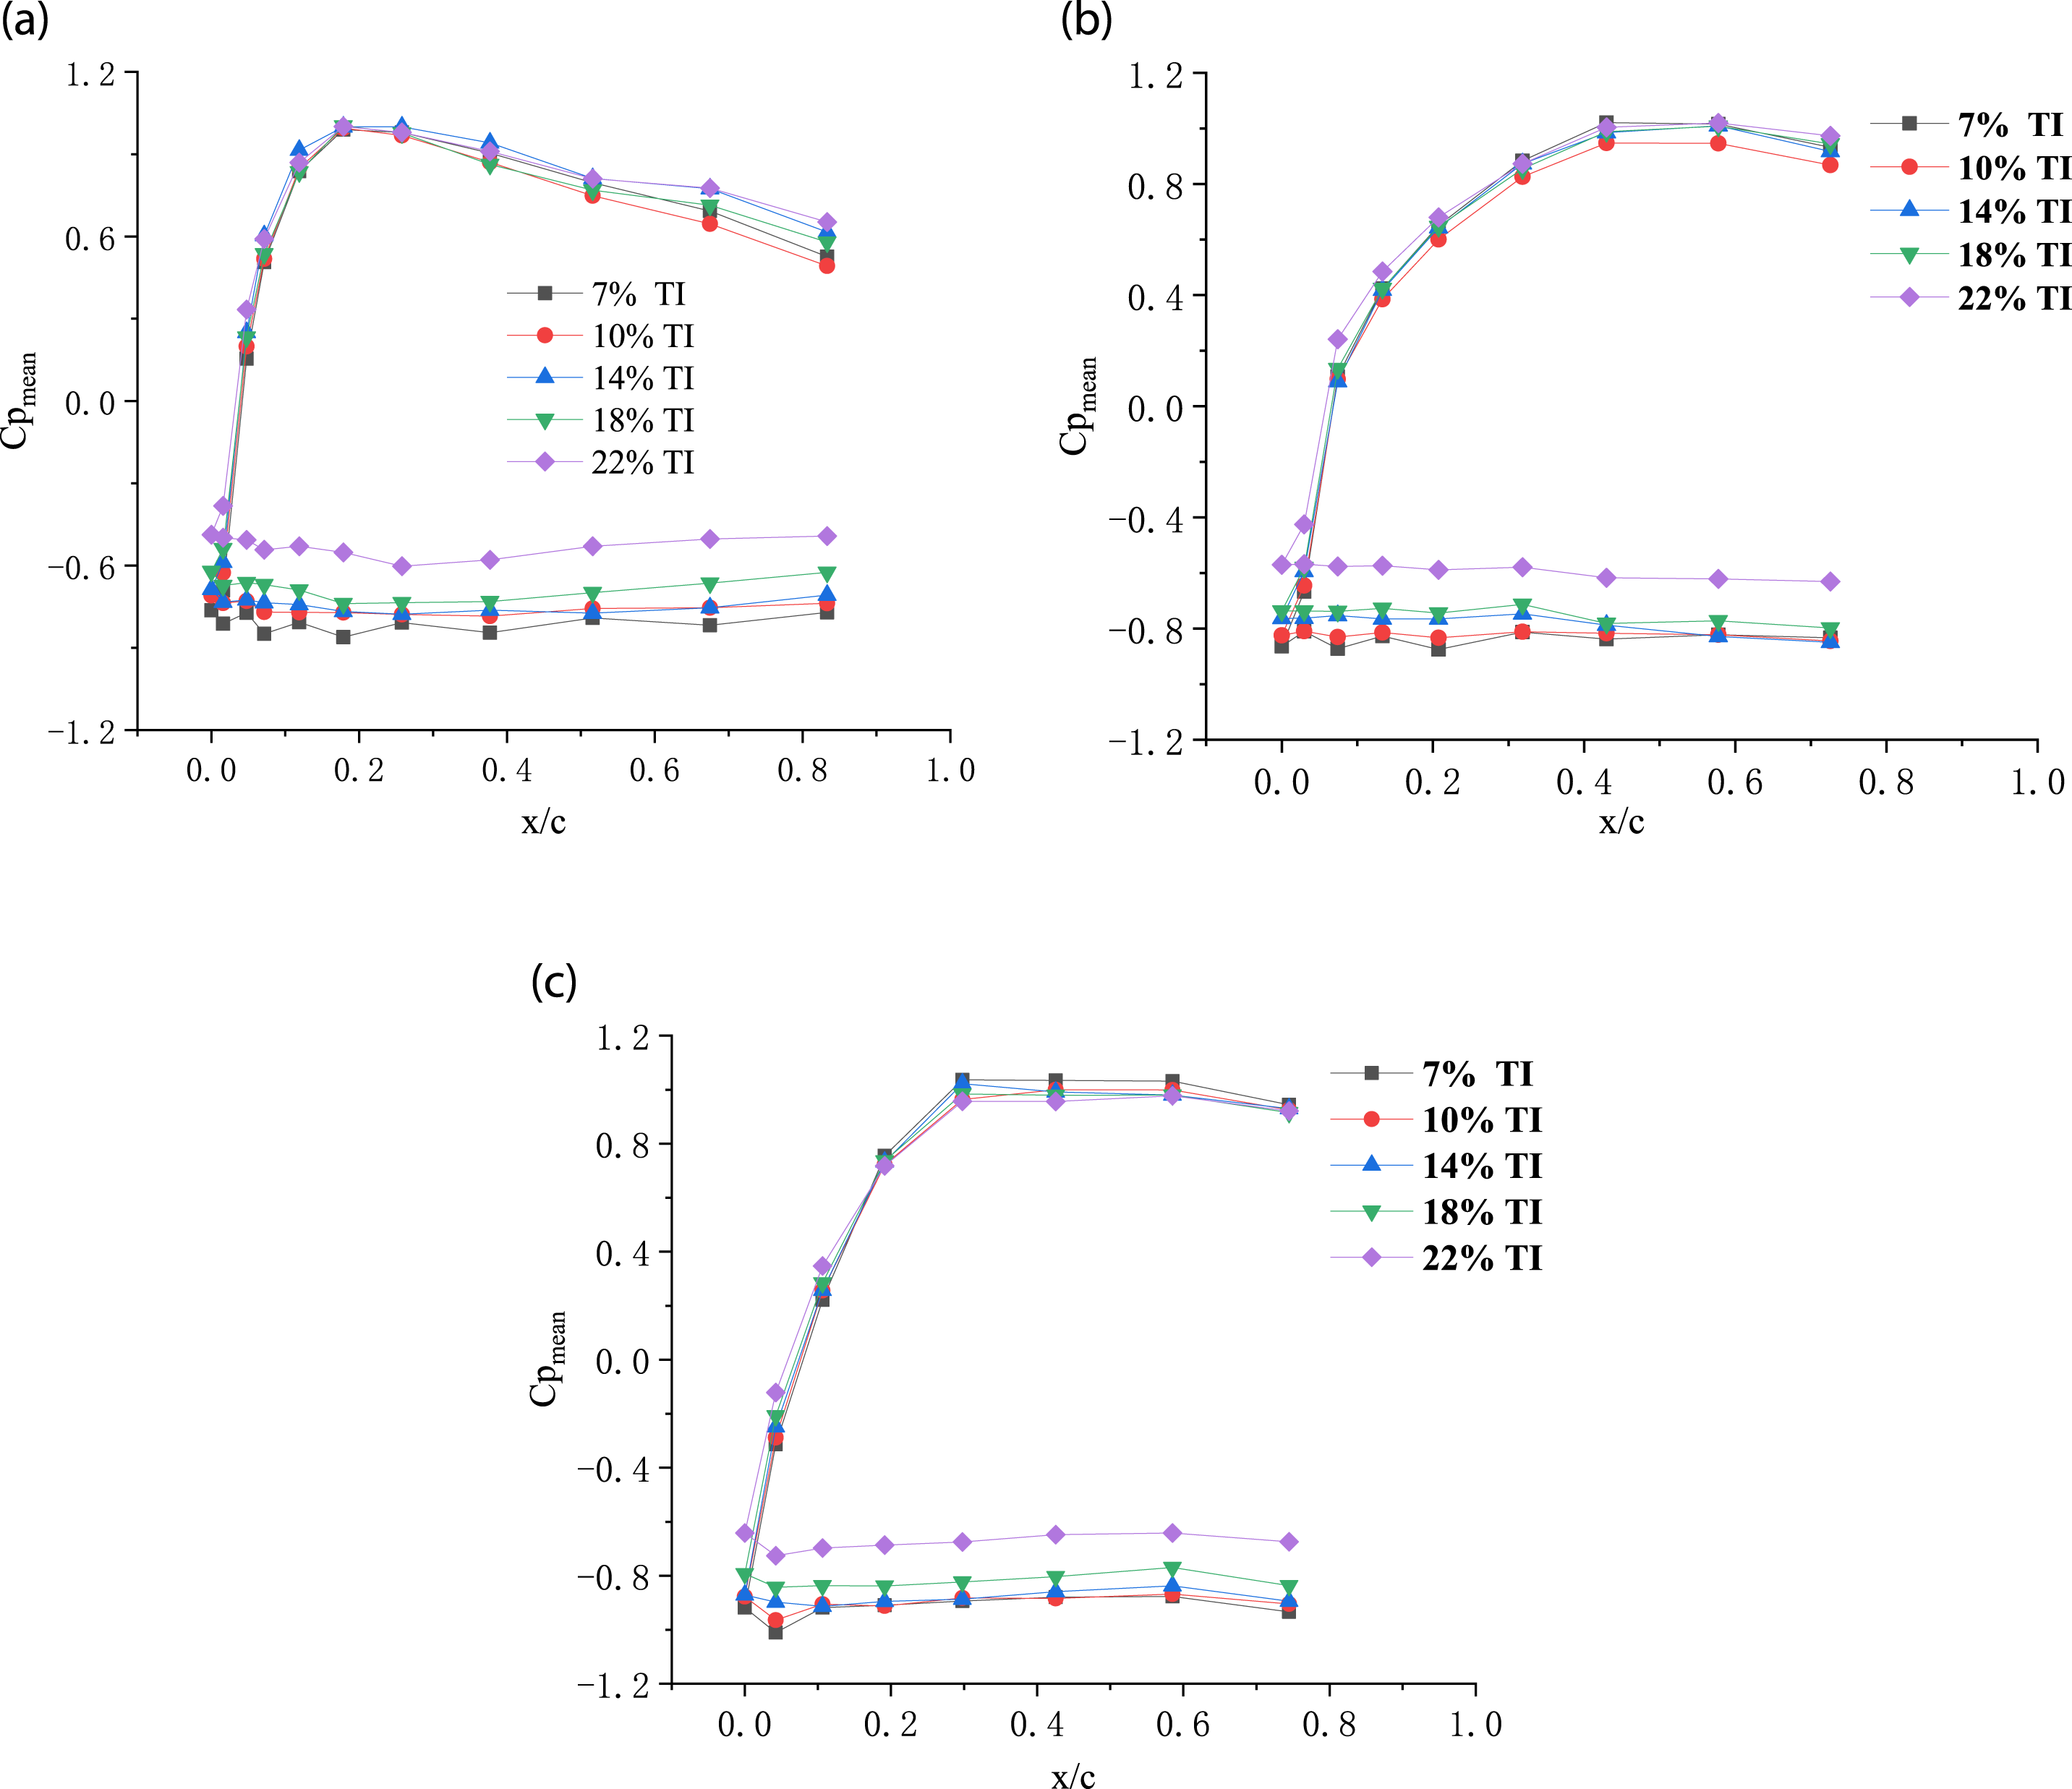
RMS wind pressure coefficients on the root, middle, and tip of the blade are, respectively, illustrated in Figure 12. Due to the twist angle, the RMS wind pressure coefficients show disparate variation patterns for the different parts of the blade. Obviously, the RMS wind pressure coefficients increase with the TI, in particular when the TI is larger than 10%. Root-mean-square wind pressure coefficients on typical measurement levels. (a) 0.1R. (b) 0.5R. (c) 0.9R.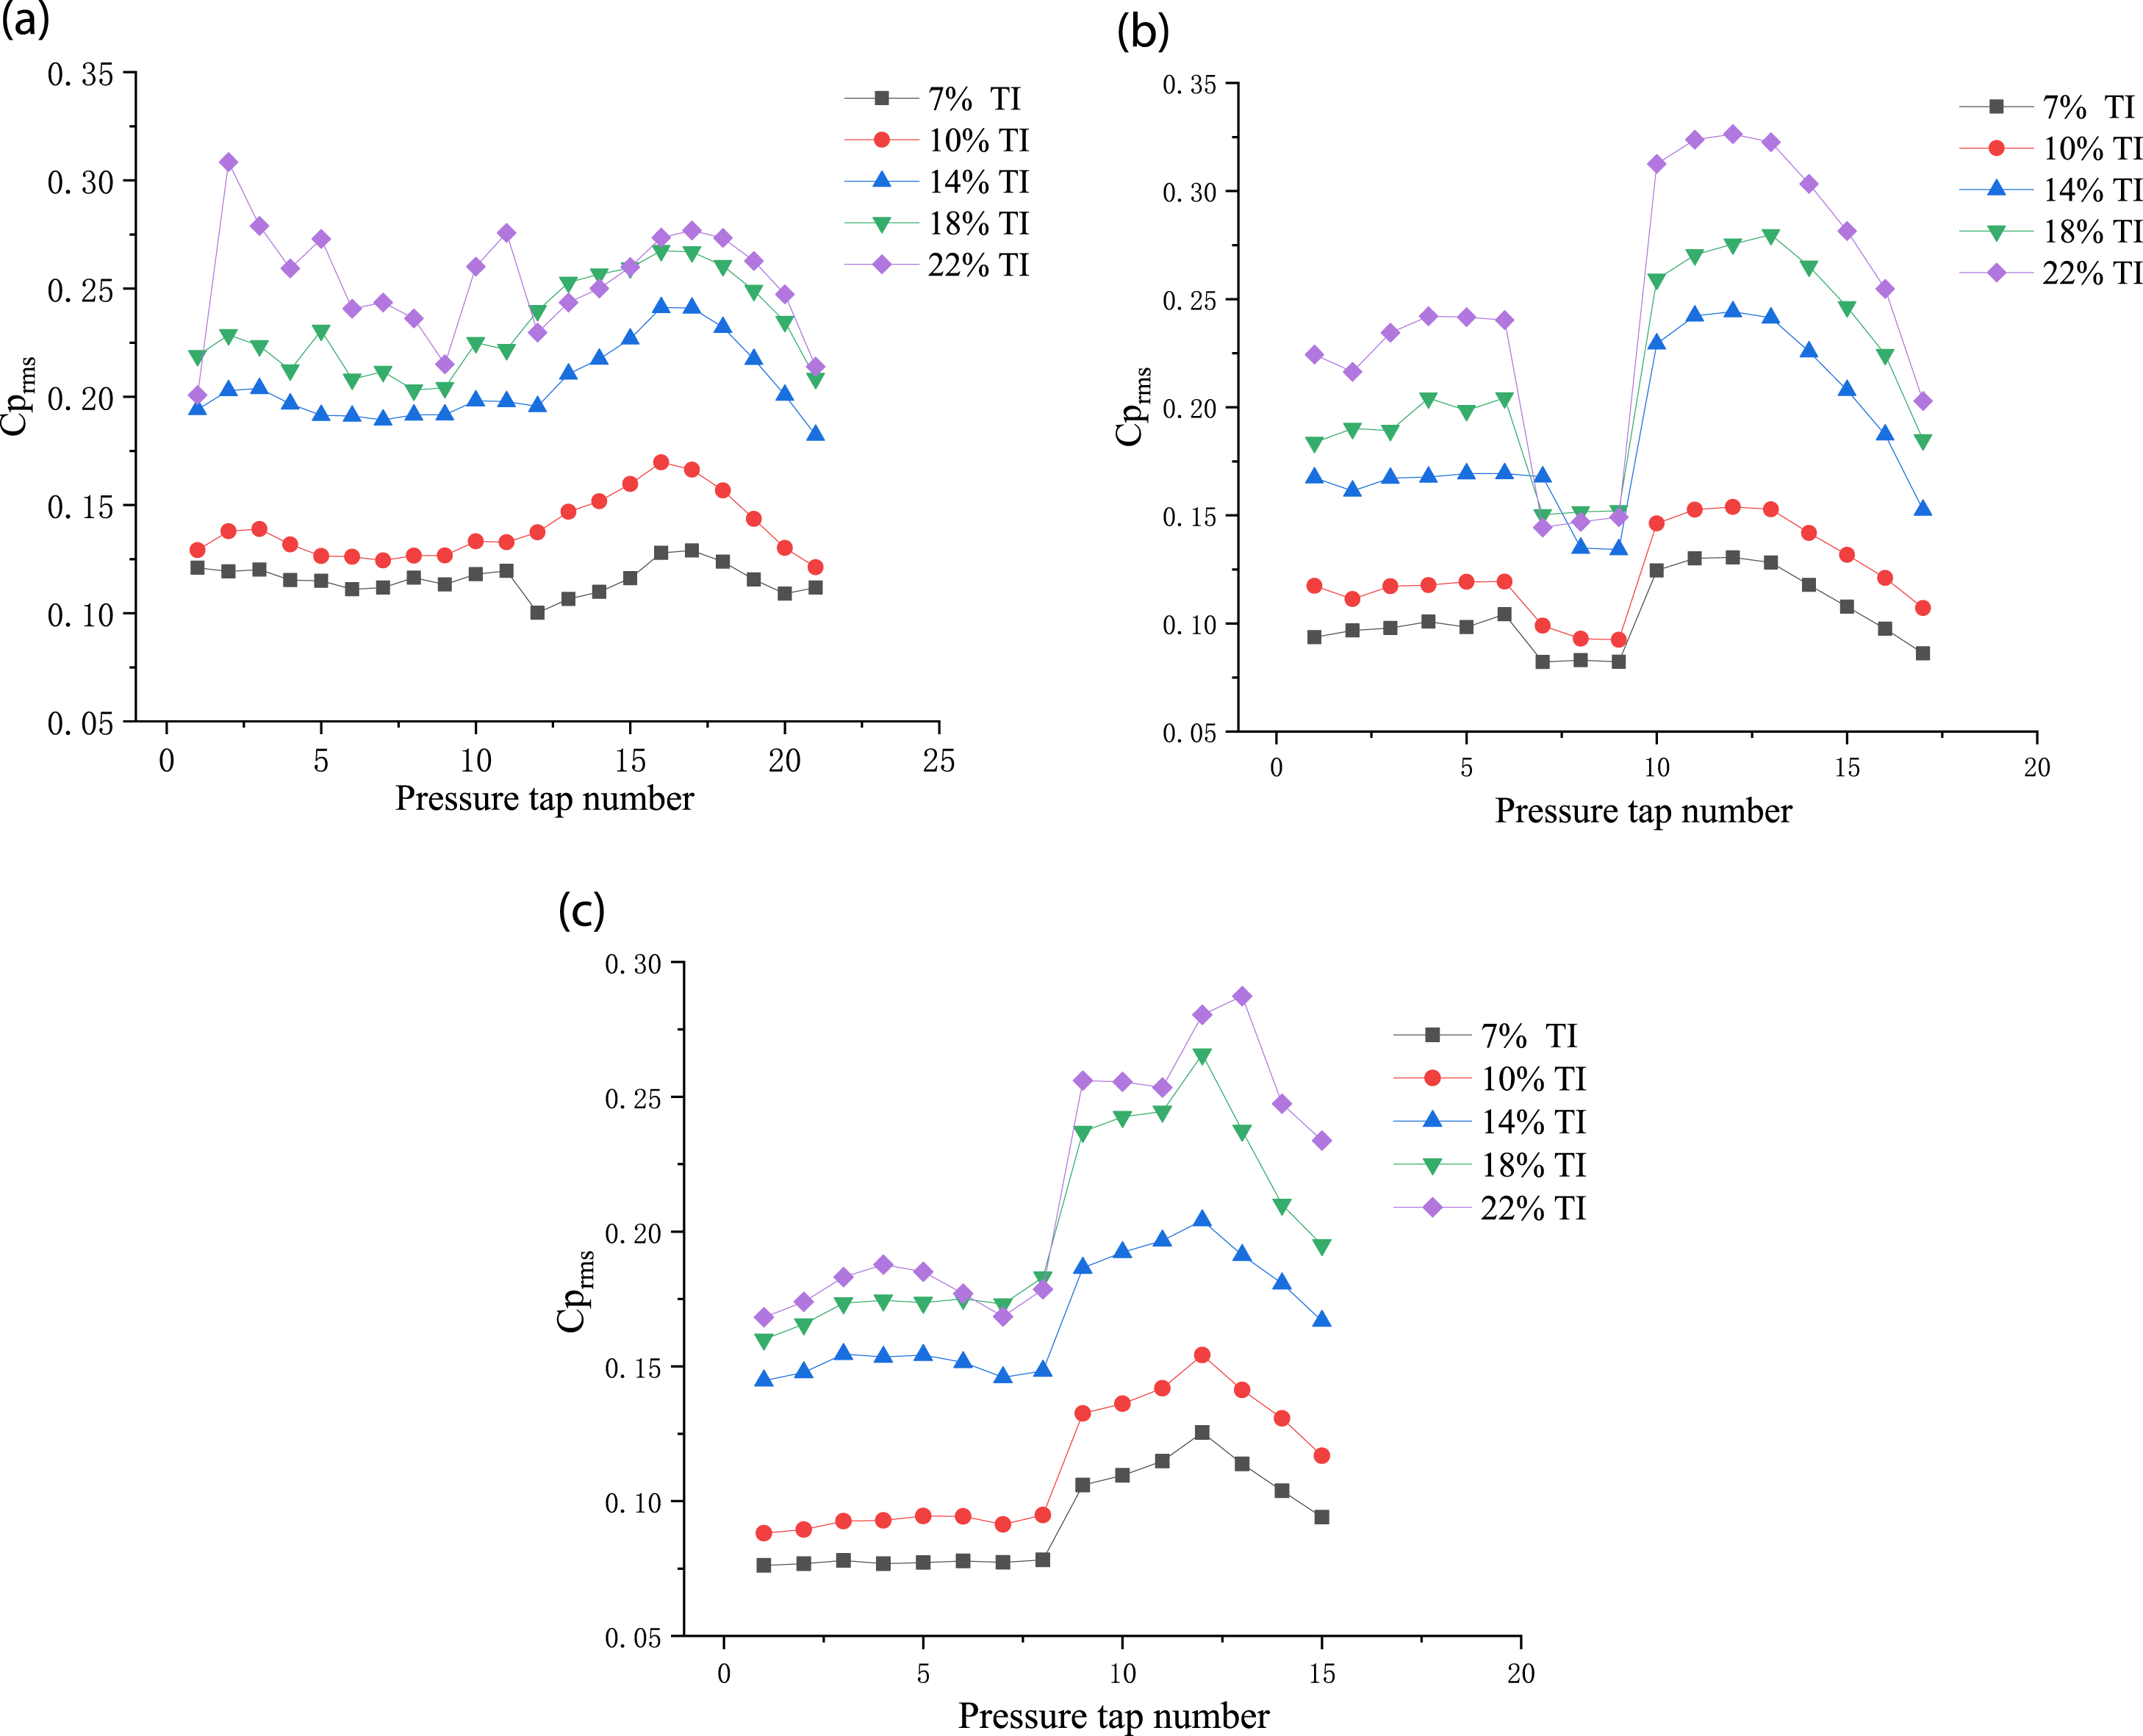
Wind pressure coefficients under pitch angle of 90°
The pitch angle of a blade usually changes to 90° for the reason of reducing the aerodynamic loads when suffering from the extreme wind action. However, many blade damage accidents still happened under this situation. So, it is necessary to study the wind pressure distribution on the wind turbine blade under pitch angle of 90°. Similarly, Figure 13 shows mean wind pressure coefficients on the root, middle, and tip of the blade, respectively. In general, mean wind pressure coefficients are almost negative and the absolute values of mean wind pressures on the lower wing are larger than those on the upper wing. For the blade root, large suction can be found owing to the flow separation. The negative pressure coefficient can even reach −2.4. The absolute values of the mean wind pressure coefficients decrease with the increase of x/c. When the TI is smaller than 18%, it has no obvious influence on the mean wind pressure coefficients. Nevertheless, the mean wind pressure coefficients show significant increase on both the upper and lower wings of the blade when the TI is 22%. Variations of mean wind pressure coefficients on the middle and tip of the blade keep the same pattern. Due to the incoming flow, mean wind pressure coefficients at the leading edge on the middle and tip of the blade are positive. The upper and lower wings of the blade are basically subjected to negative pressures. The absolute values of mean wind pressure coefficient decrease with the increase of TI. Mean wind pressure coefficients on typical measurement levels. (a) 0.1R. (b) 0.5R. (c) 0.9R.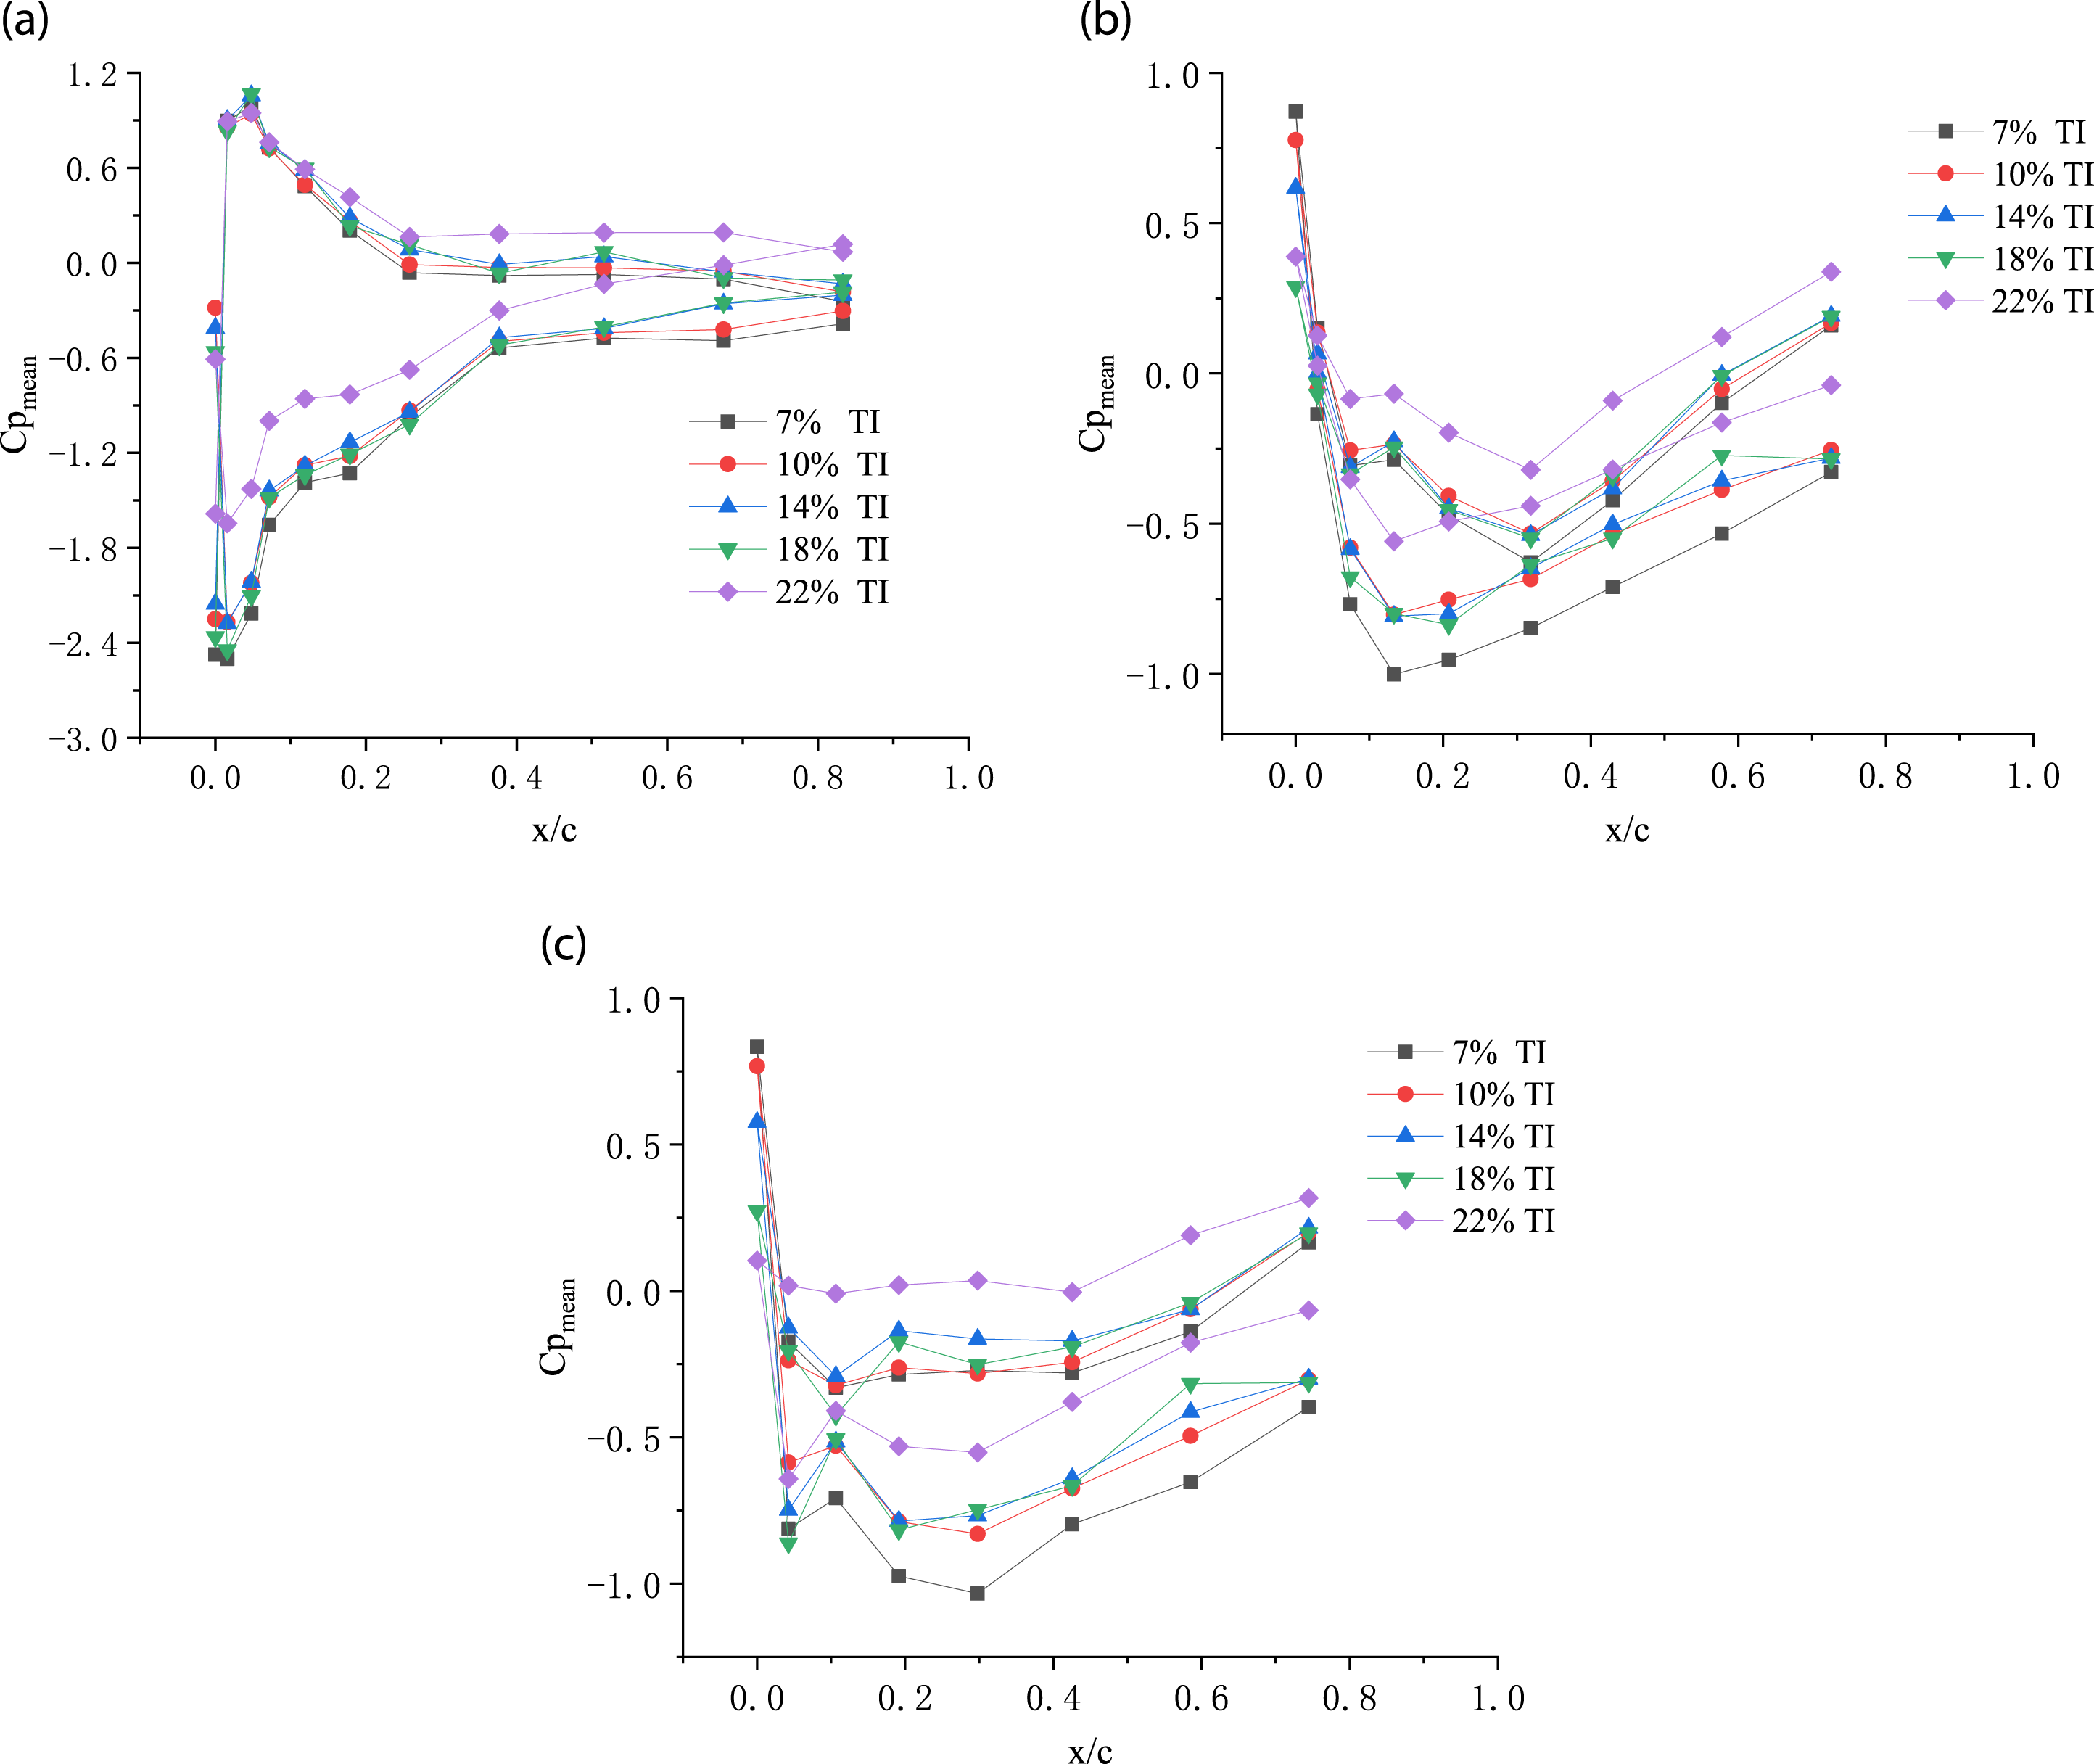
Figure 14 presents the RMS wind pressure coefficients on the root, middle, and tip of the blade, respectively. It is noted that the RMS wind pressure coefficients on the leading edge of the blade are much larger than those of the blade under pitch angle of 0°. As the TI increases, the RMS wind pressure coefficients increase, especially on the middle and tip parts of the blade. From the leading edge to the trailing edge along the upper and lower wings of the blade, the RMS wind pressure coefficients first decrease and then increase with the increasing of Root-mean-square wind pressure coefficients on typical measurement levels. (a) 0.1R. (b) 0.5R. (c) 0.9R.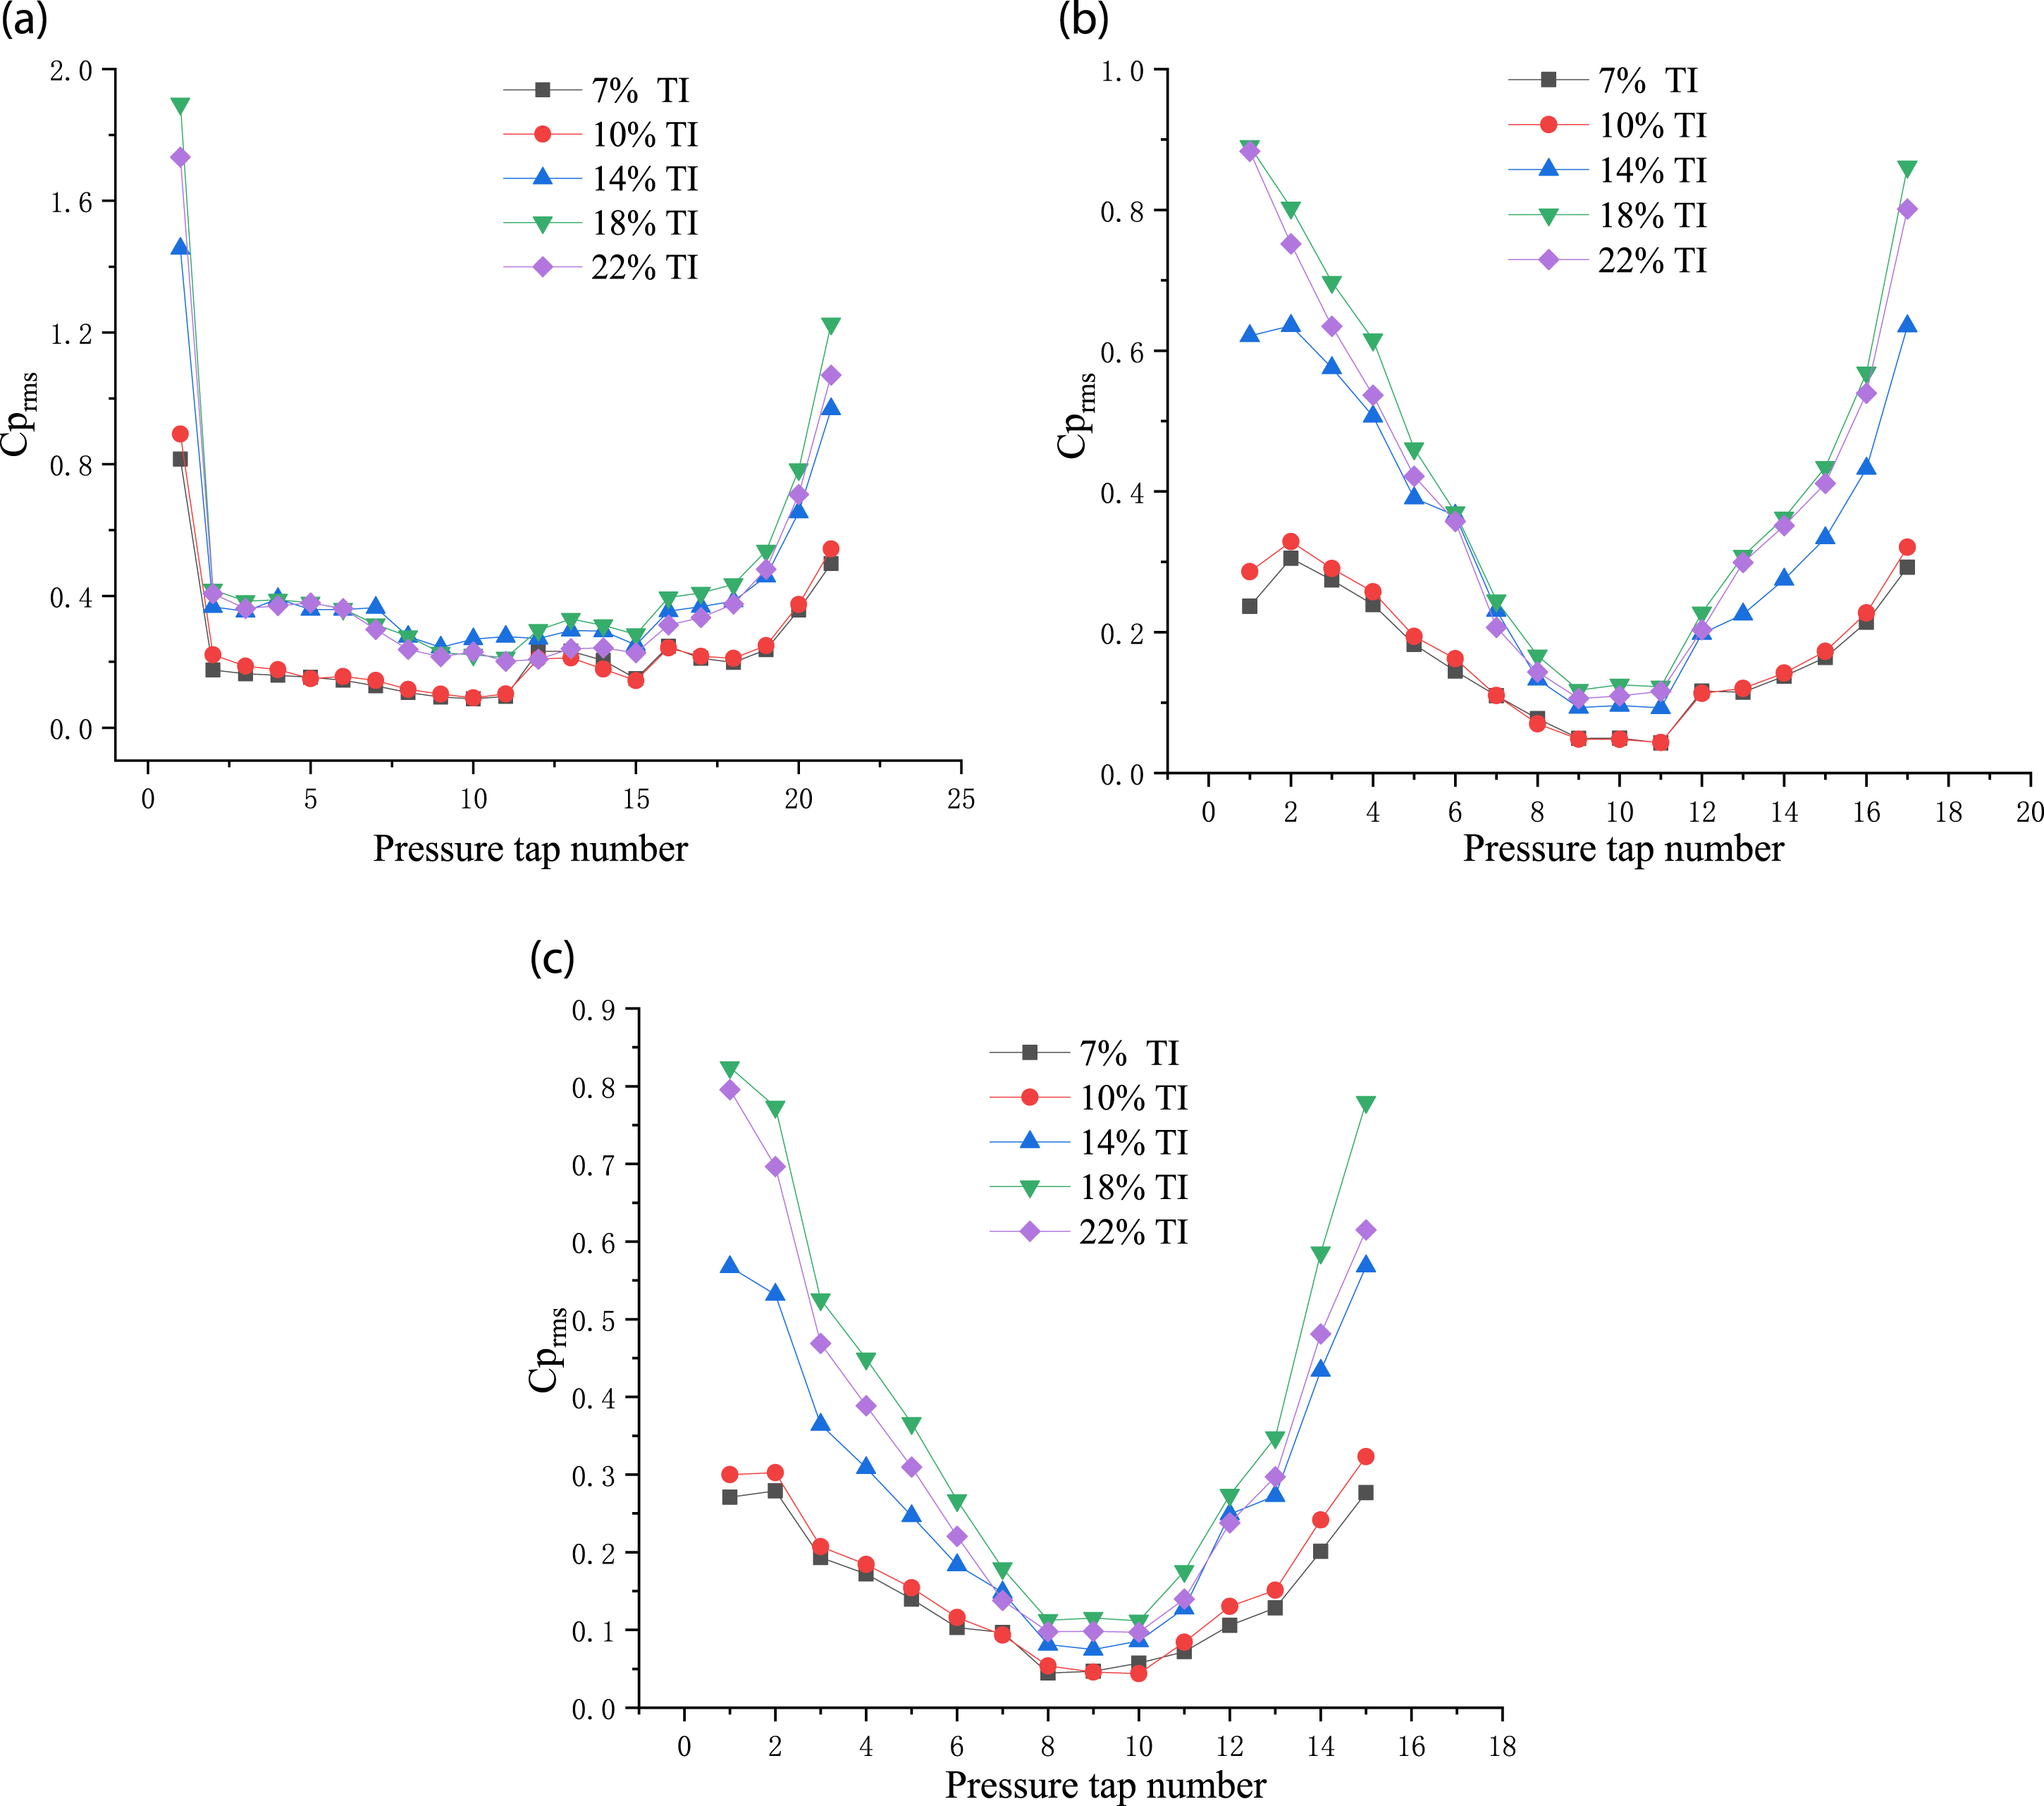
Bending moment coefficients
Bending moment was found to play an important role for structural failure of wind turbine blade (Zhang et al., 2019). Similar to high-rise building, the bending moment coefficients of the blade can be calculated by integrating the local wind force at each measurement level and its corresponding height (Li et al., 2017a, 2017b, 2018a, 2018b). Figure 15 shows the variations of the bending moment coefficients perpendicular to the chord length of the blade with the TI under pitch angle of 0° and 90°, respectively. It can be observed that the effects of TI on the bending moment coefficients are not consistent for the two pitch angles. For pitch angle of 0°, the mean bending moment coefficients decrease slightly with the increase of TI. The average value of the mean bending moment coefficient is 0.67. For pitch angle of 90°, the mean bending moment coefficients change little with the TI. The average value of the mean bending moment coefficients is 0.08. Regarding the RMS bending moment coefficient, it can be seen from Figure 15(b) that the RMS bending moment coefficients increase as the TI increases for pitch angle of 0°. Large amplification of the RMS bending moment coefficients can be observed when the TI is larger than 10%. For pitch angle of 90°, the RMS bending moment coefficients first increase and then decrease with the TI. The maximum value of the RMS bending moment coefficients occurs under TI of 18%, which is 2.6 times the minimum value emerged under TI of 7%. Variation of bending moment coefficient with turbulence intensity. (a) Mean bending moment coefficient. (b) Root-mean-square bending moment coefficient.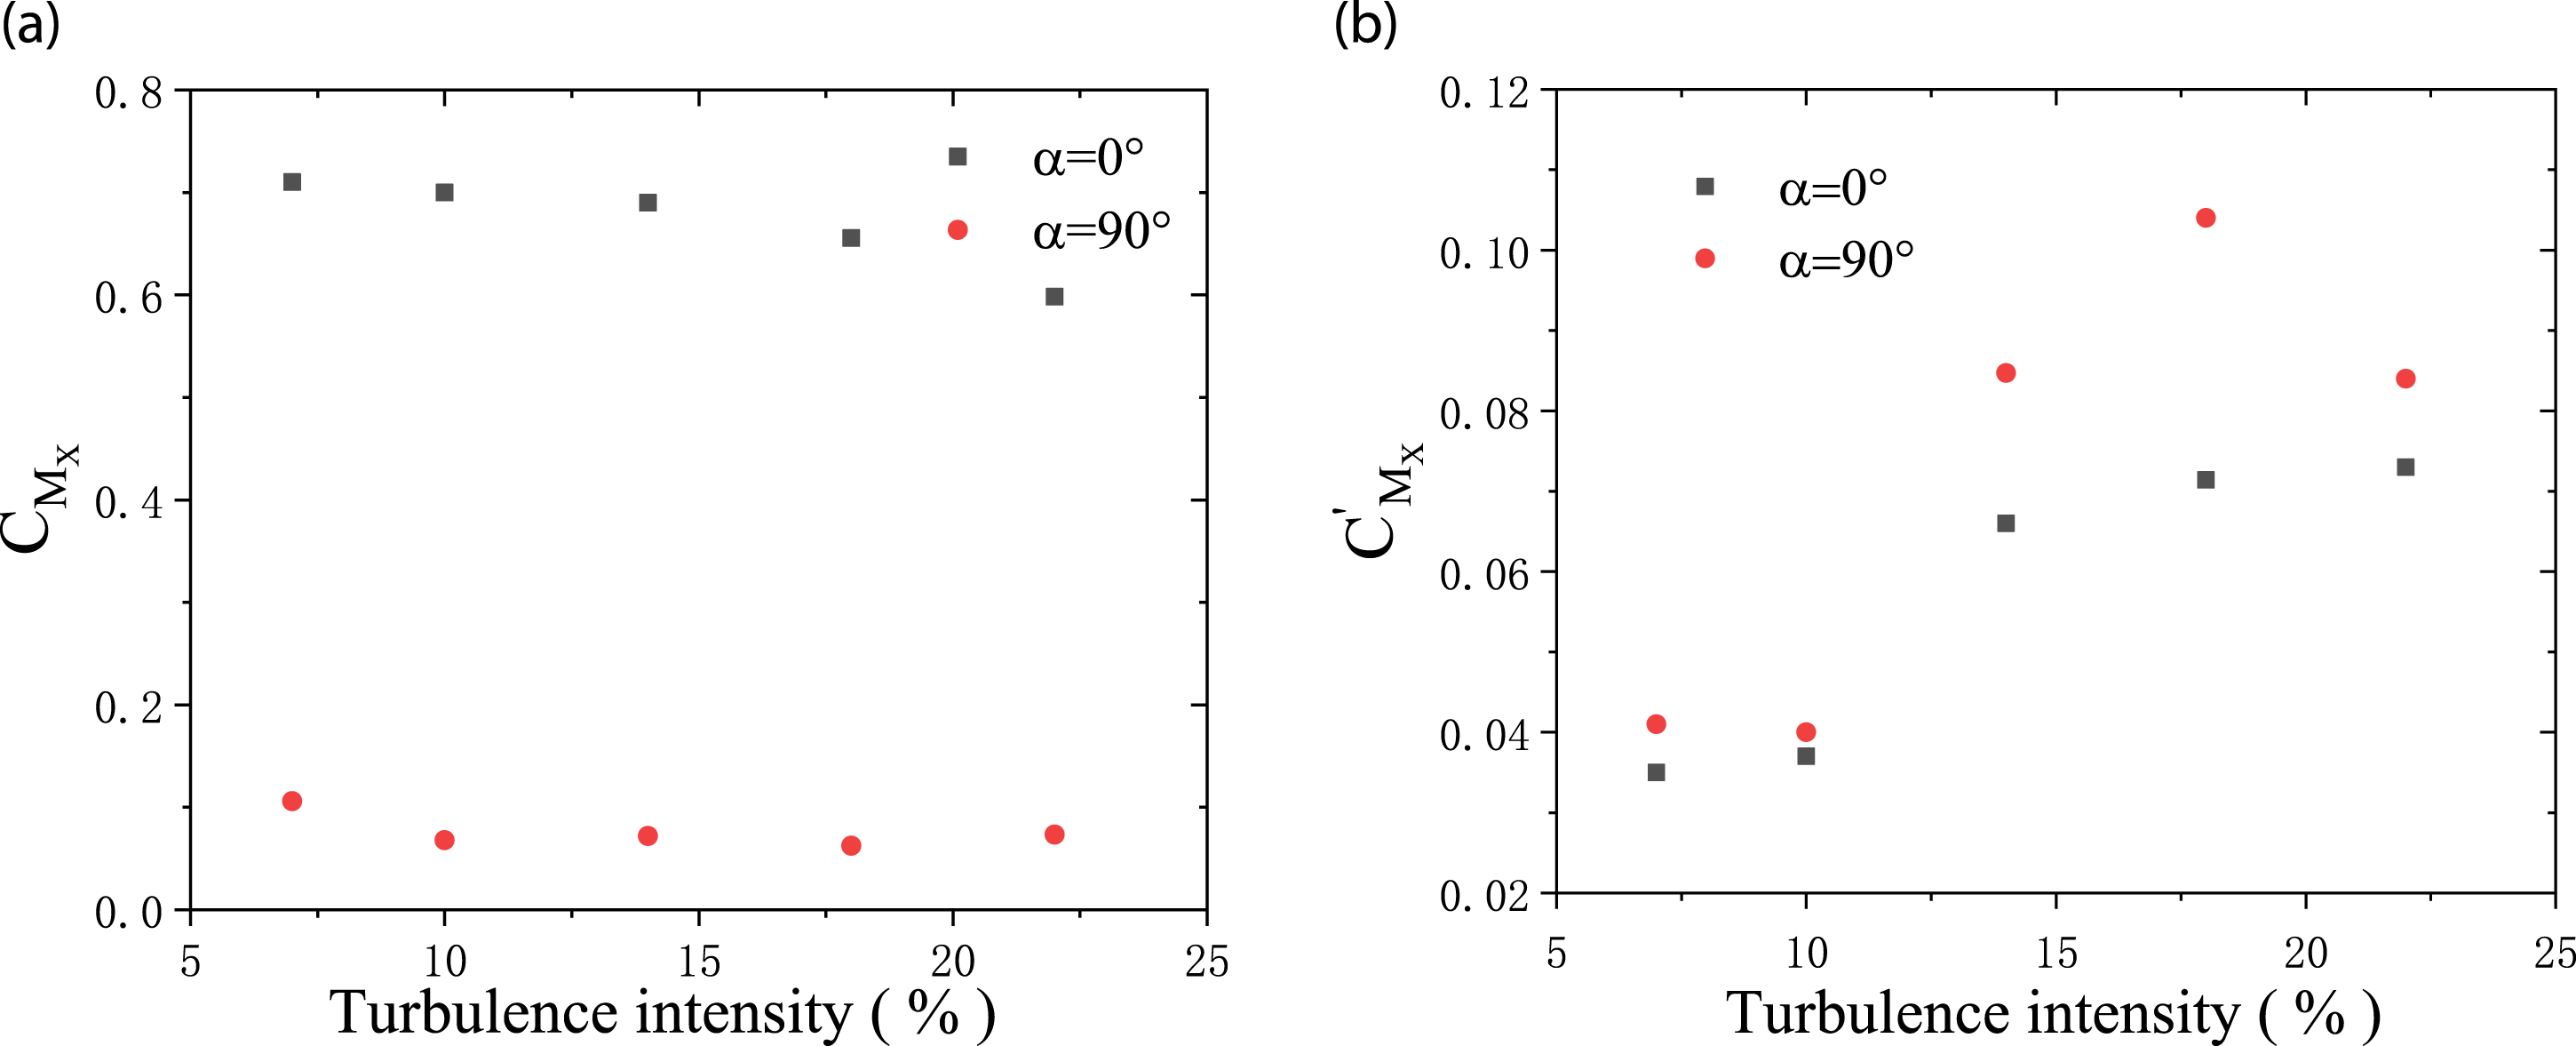
Power spectra of bending moment coefficients
Power spectra of bending moment coefficients represent the energy distribution in the frequency domain and provide useful information in wind loads estimation of structures (Li et al., 2014; Li and Li, 2016). Figure 16 illustrates the power spectra of bending moment coefficients of the blade under pitch angle of 0° and 90°, respectively. Both the power spectra under the two angles change gently with the reduced frequency, showing obvious wide-band characteristics. The pitch angle has little influence on the power spectra. Also, the effect of TI on the power spectra is not evident. Power spectra of bending moment coefficients. (a) Pitch angle of 0°. (b) Pitch angle of 90°.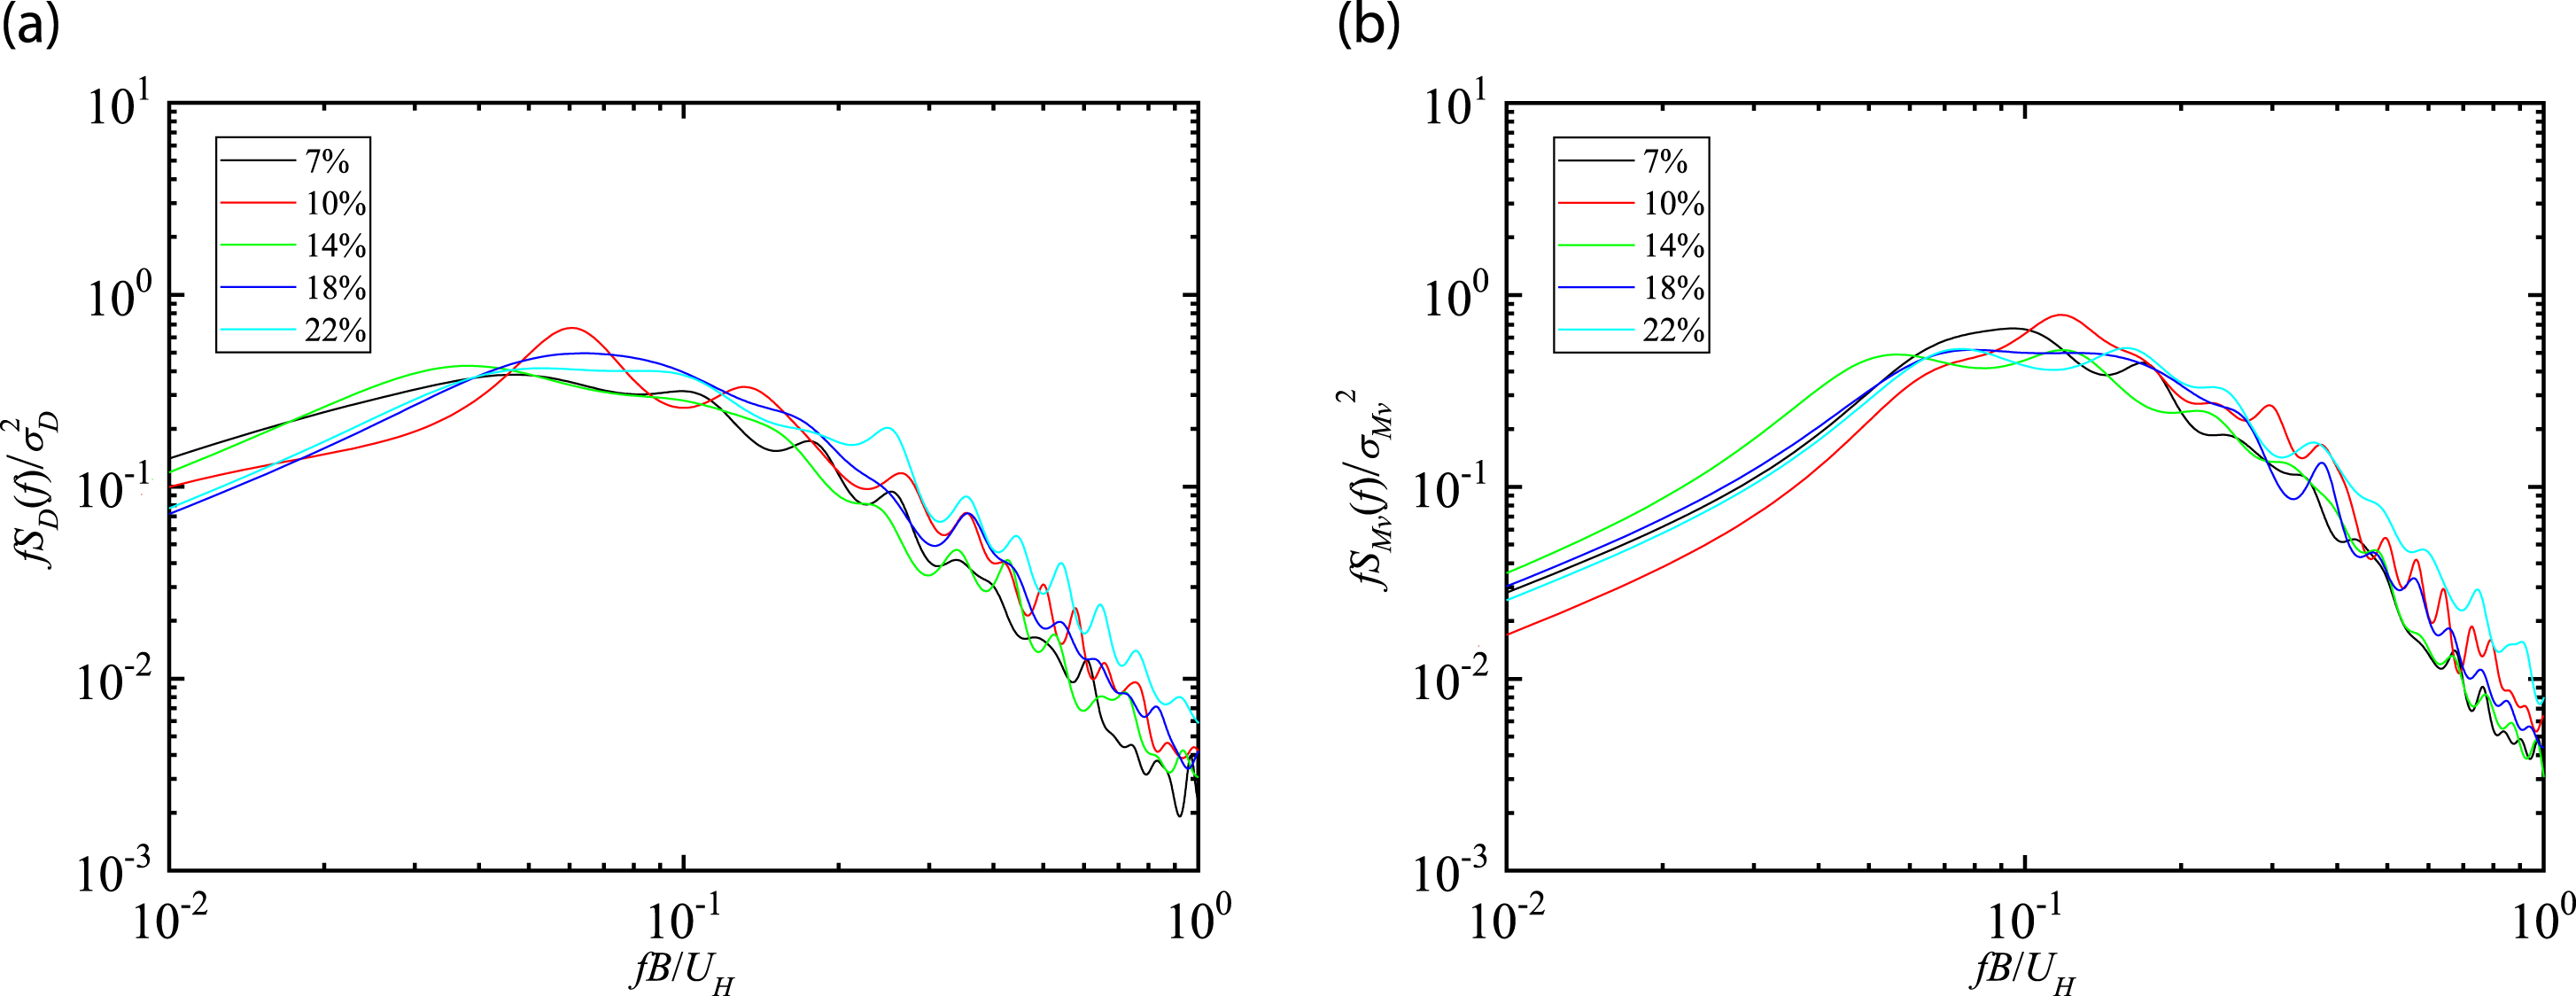
Dynamic characteristics and wind-induced responses of the blade
Since the wind loads acting on the twisted blades can be projected into the in-plane and out-of-plane directions, the wind-induced vibrations of the blades can happen in the in-plane and out-of-plane directions (Zuo et al., 2020). The two vibrations can shorten the fatigue life and cause catastrophic failure of the wind turbines, respectively. In the section, the prototype of the tested wind turbine is first established in the finite element (FE) model to analyze its dynamic properties. Combined with the dynamic properties of the blade, wind-induced tip displacements of the blade can be calculated by the method introduced in the Bending Moment Coefficients section with the assumption of a cantilever structure.
FE model and dynamic properties of the blade
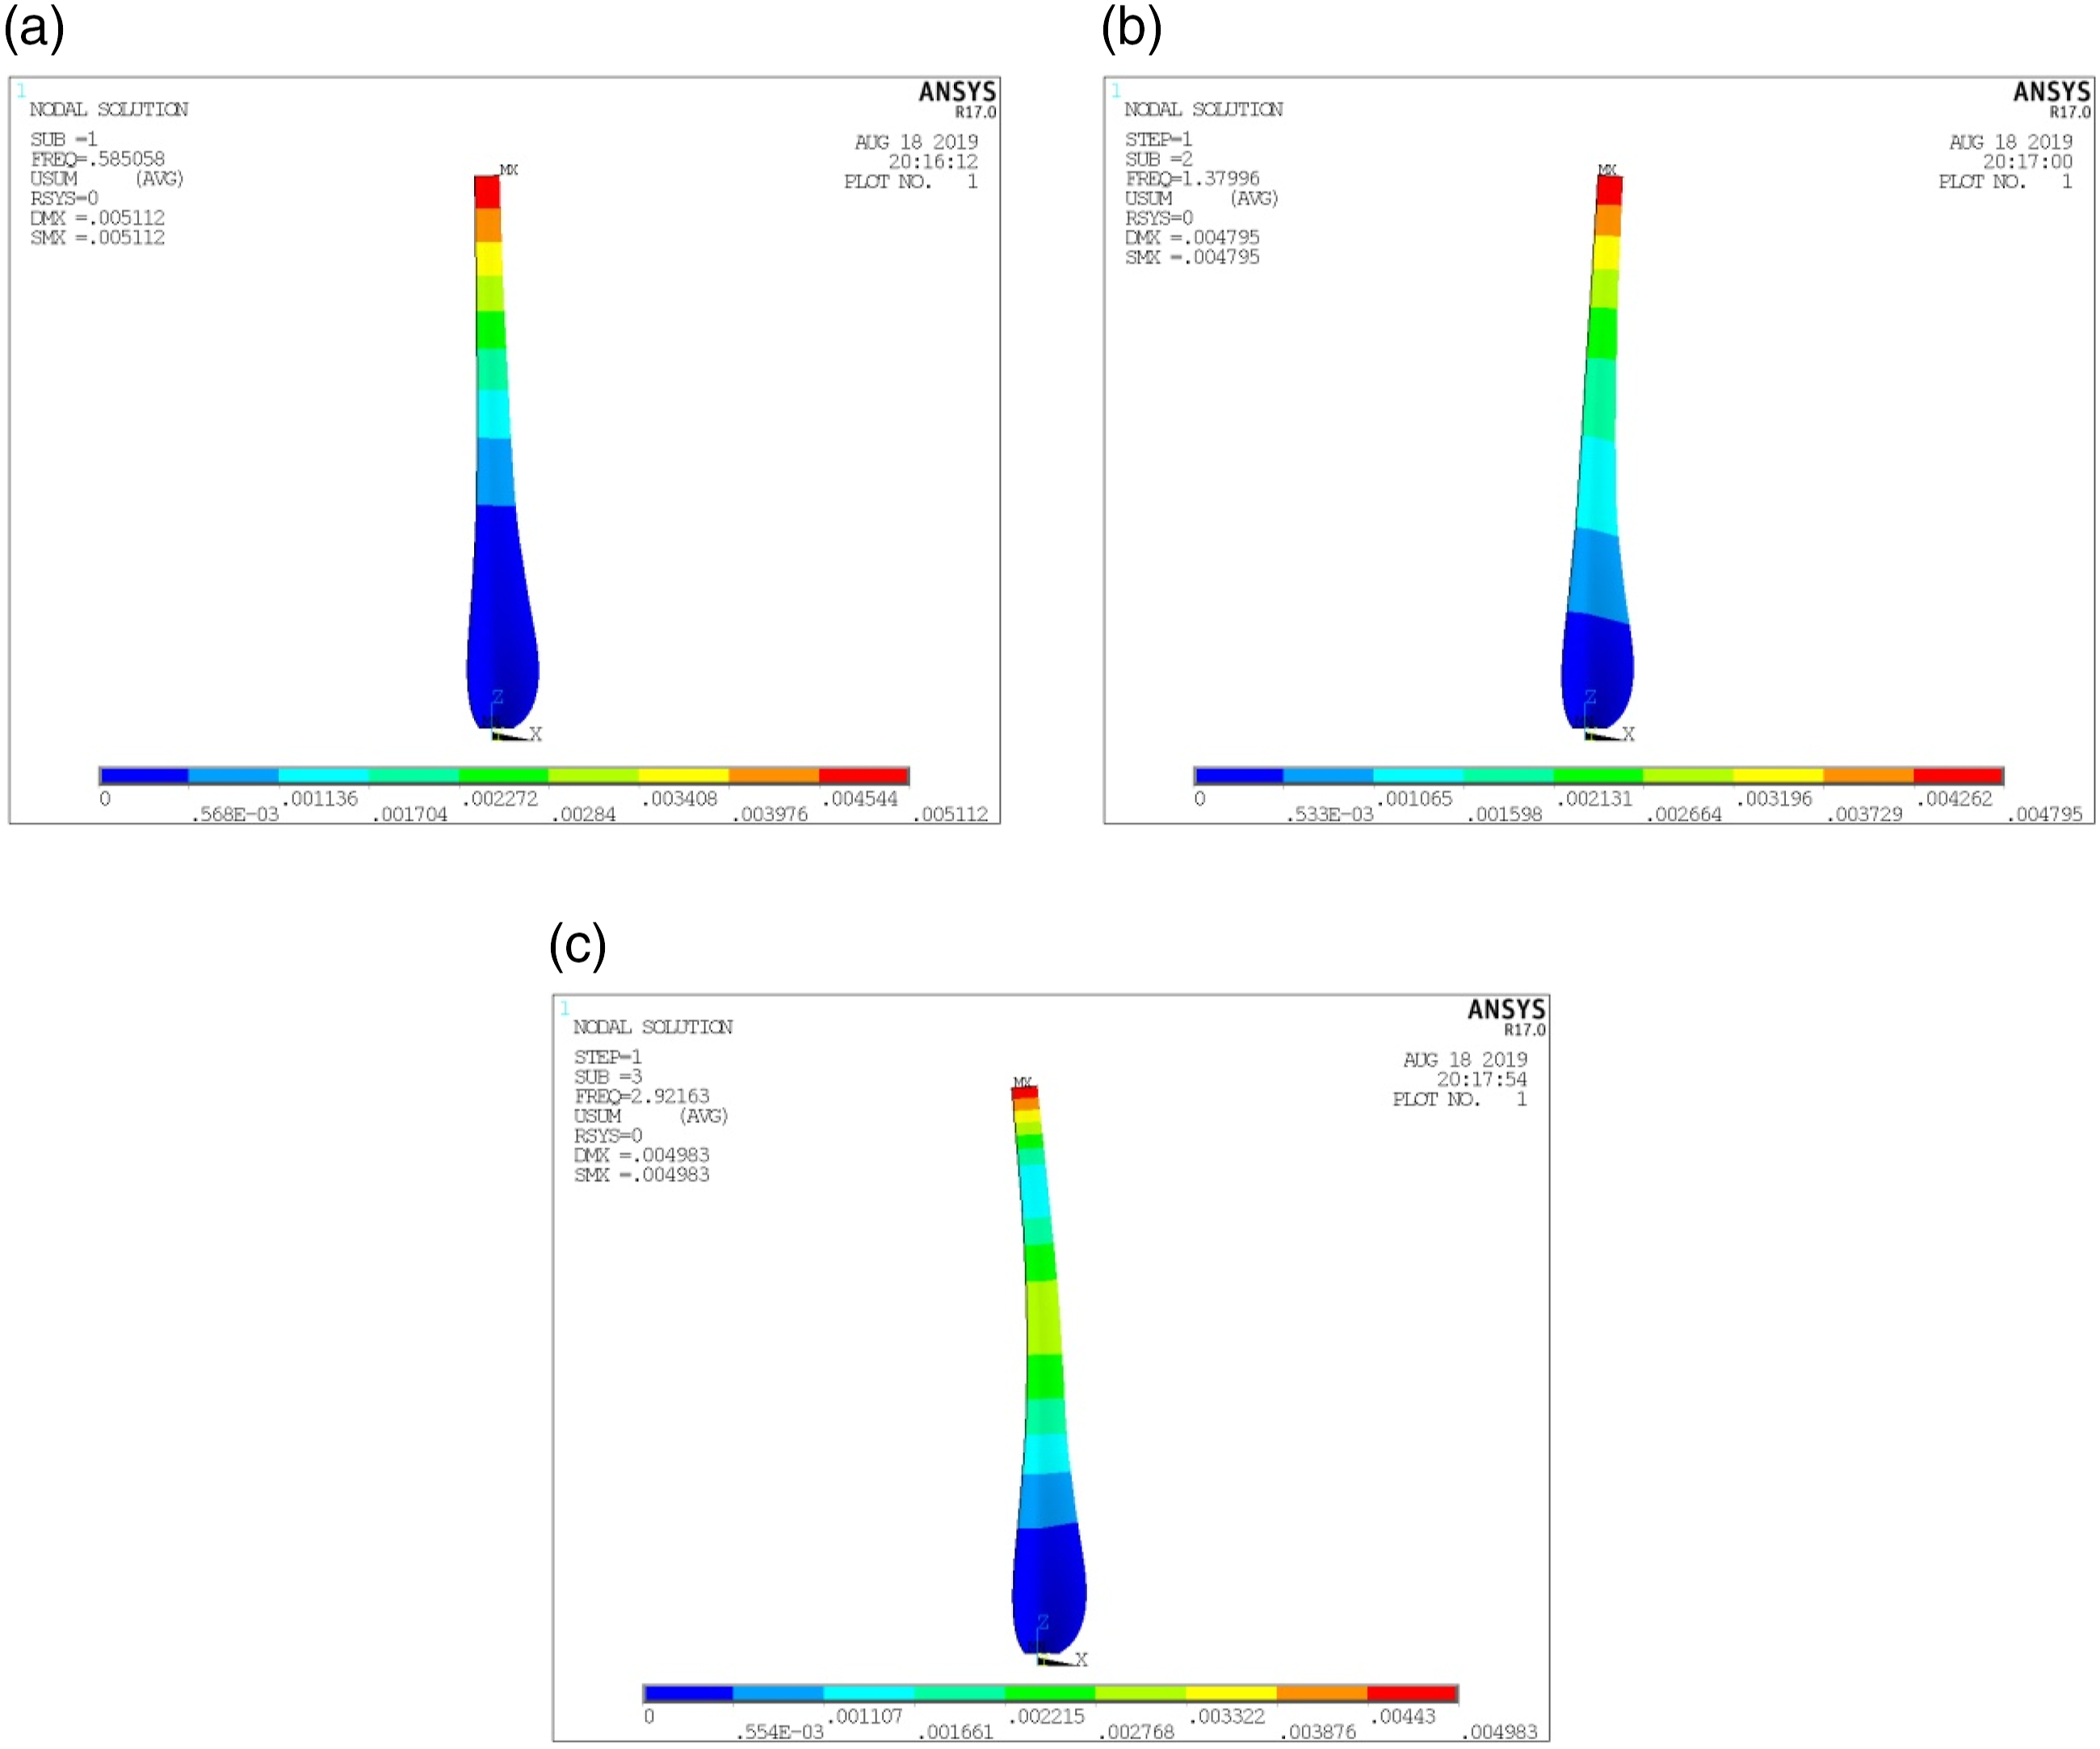
The designed wind turbine blade is imported into ANSYS 16.0, and the shell 181 element is selected to mesh the model. The elastic modulus is Finite element model of the wind turbine blade. (a) Overall mesh. (b) Mesh details. (c) Root constraints. The first three mode shapes of the blade. (a) First order. (b) Second order. (c) Third order.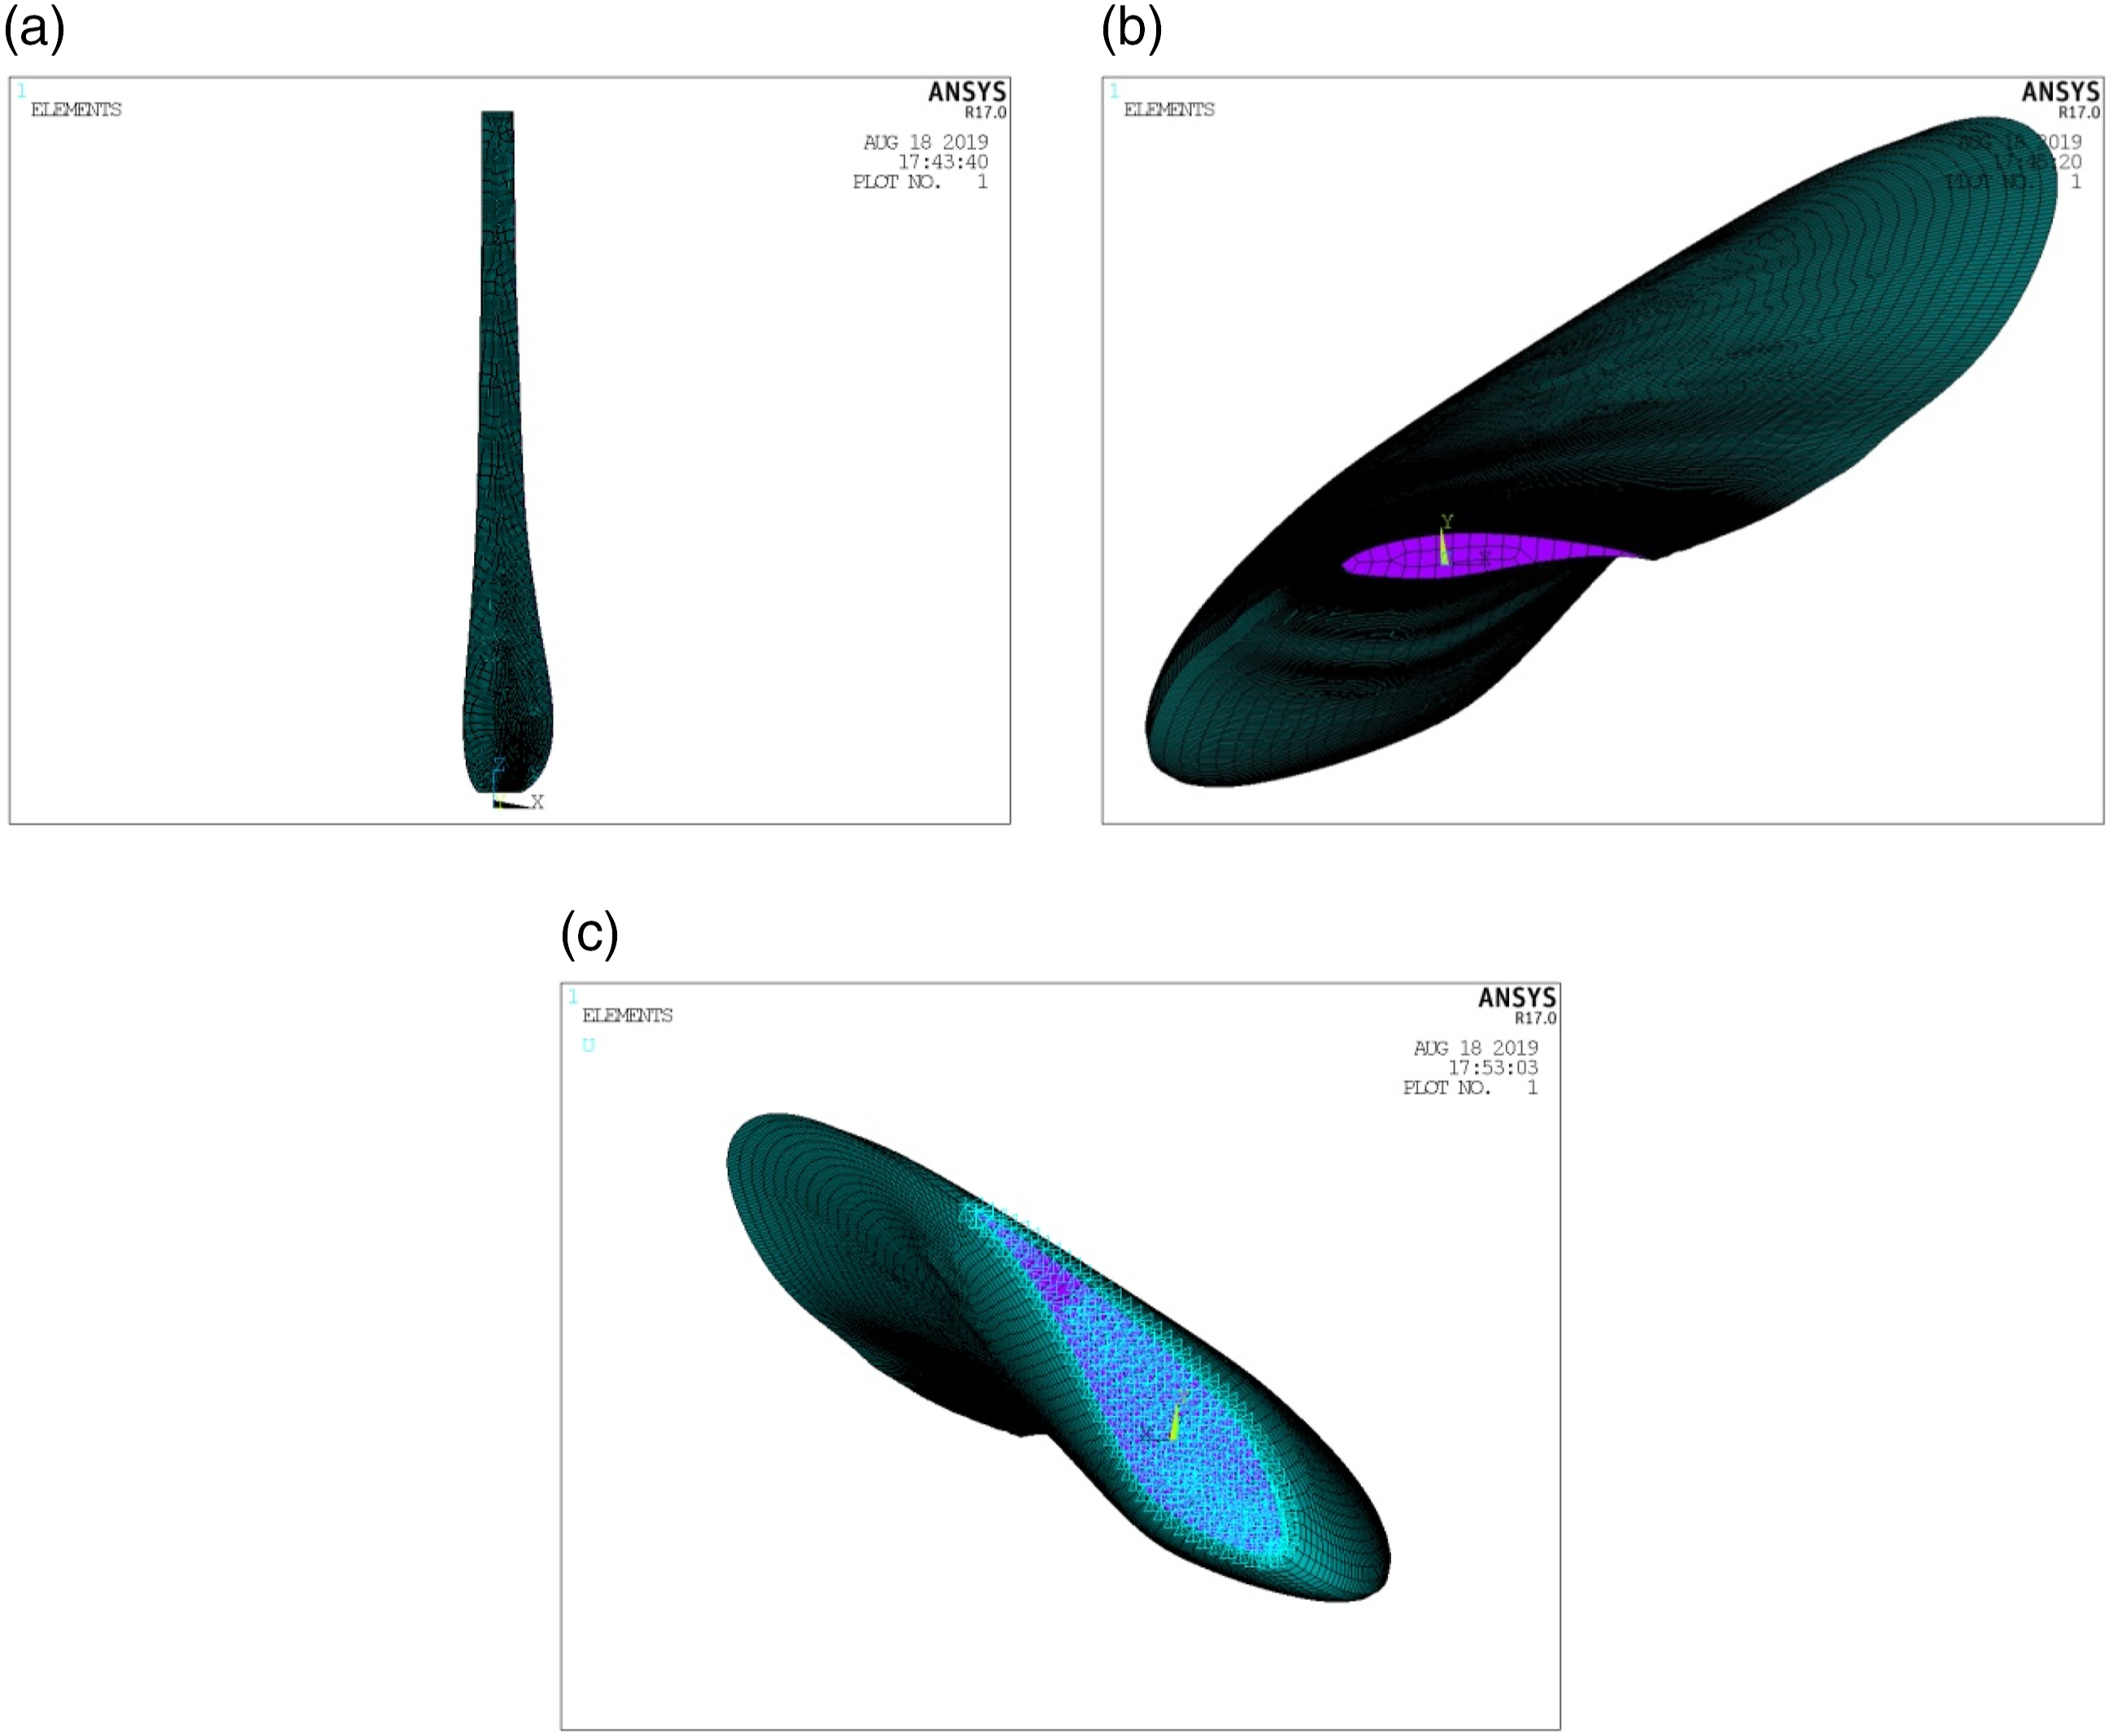
Wind-induced tip displacements
In order to qualitatively assess the wind-induced tip displacements of the blade, the design wind pressure 0.8 Variations of wind-induced tip displacements with turbulence intensity. (a) Mean displacements. (b) Root-mean-square displacements. (c) Peak displacements.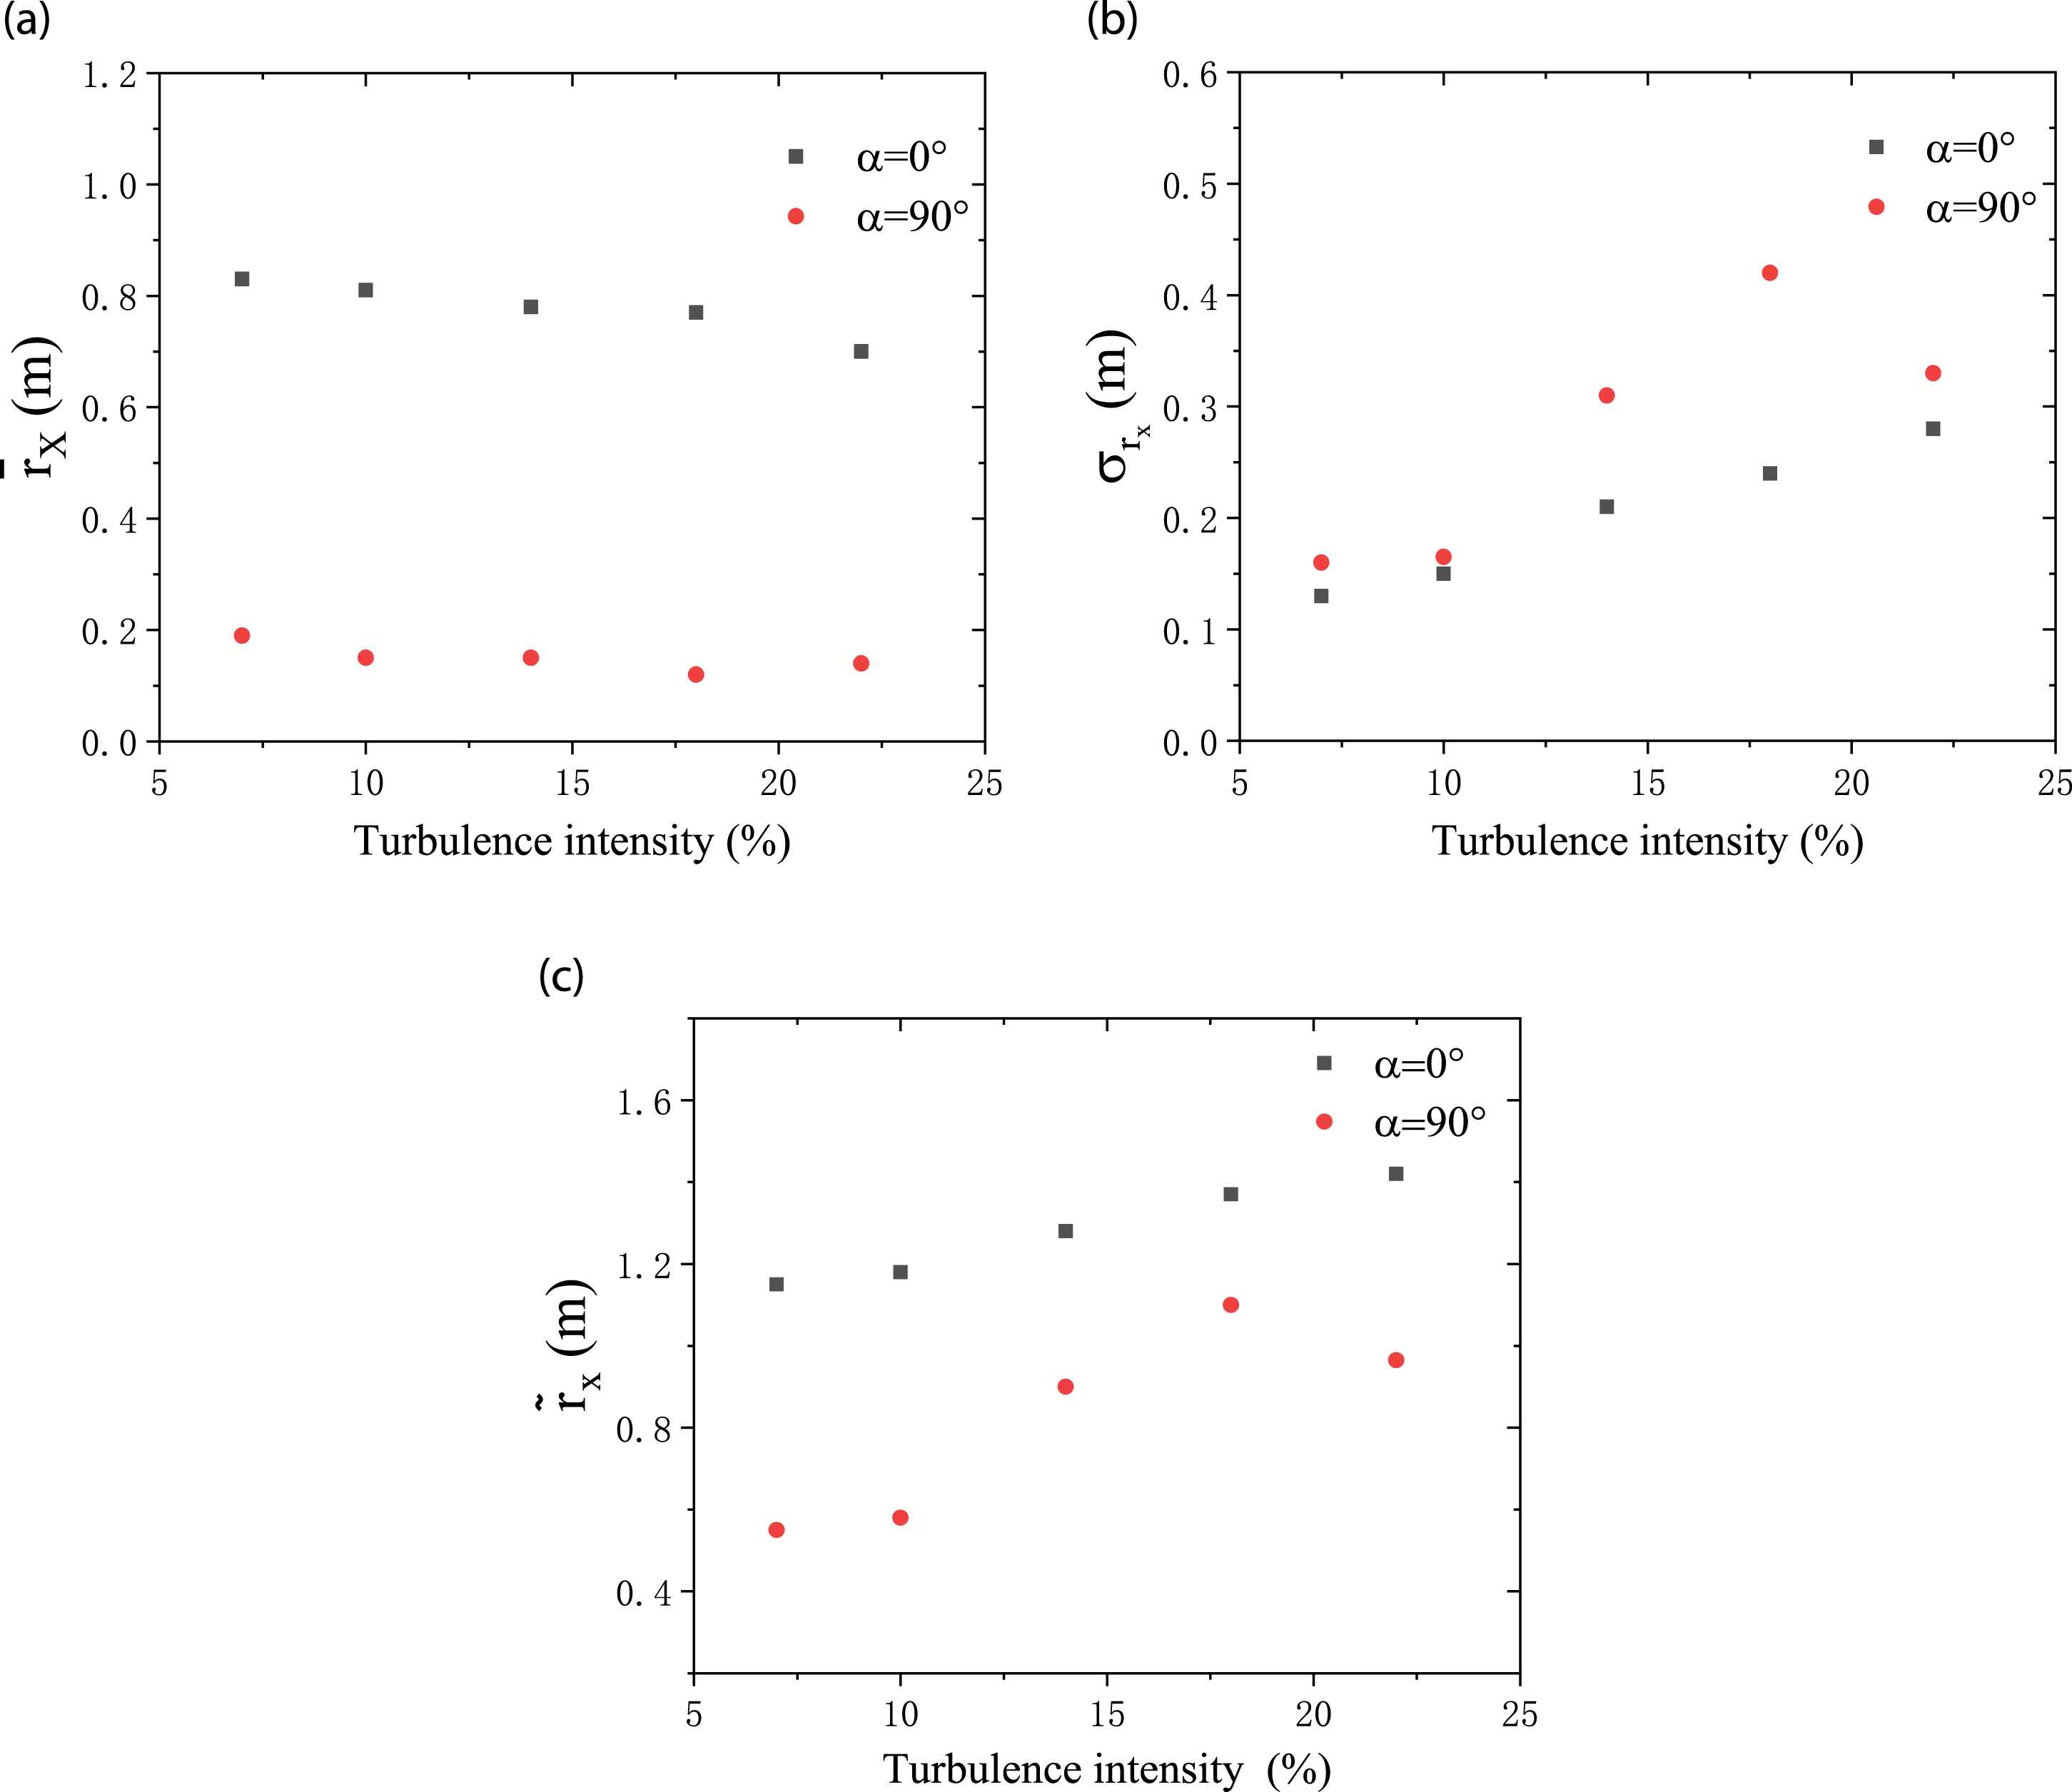
Variations of the mean and RMS wind-induced tip displacements with TI keep the same pattern as those of the bending moment coefficients. The effects of TI on the mean displacements are not evident. Mean displacements almost stay stable at 0.8 m and 0.2 m for pitch angle of 0° and 90°, respectively. It is noted that the feathering condition at pitch angle of 90° can effectively reduce the mean tip displacements of the blade. RMS displacements at pitch angle of 0° increase gradually with the TI. The maximum RMS displacement under TI of 22% is 2.39 times the minimum RMS displacement under TI of 7%. As the TI increases, the RMS displacements at pitch angle of 90° first increase to reach the maximum value under TI of 18% and then decrease. The RMS displacements at pitch angle of 90° are always larger than those at pitch angle of 0°. The peak displacements at pitch angle of 0° increase as the TI increases. The maximum peak displacement of 1.42 m occurs under TI of 22%, which is 2.63 times the minimum peak displacement under TI of 7%. For the pitch angle of 90°, variation of peak displacements with the TI keeps the same pattern as that of the RMS displacement. The maximum displacement of 1.16 m emerges under TI of 18%. Although the peak displacements at pitch angle of 0° are larger than those at pitch angle of 90° under all turbulence intensities, higher TI may result in larger wind-induced dynamic displacement and change the controlling factors during the operation and feathering status of the wind turbine blade, which should be paid more attentions by structural designers and clients of wind farms for wind turbines established in regions with high turbulence.
Conclusion
Based on extensive wind tunnel testing of a scaled model of a typical wind turbine blade under various uniform turbulent flows, the effects of TI on the wind loads on the blade were investigated in detail. The wind pressure coefficients, bending moment coefficients, power spectra of bending moment, and wind-induced tip displacements were analyzed and discussed. The main conclusions of this study are summarized as follows: The overall mean wind pressure coefficients gradually decrease as the pitch angle increases. Wind pressure coefficients at the root of the blade change dramatically with the pitch angle. TI has more significant effects on the RMS wind pressure coefficients than the mean wind pressure coefficients. The RMS wind pressure coefficients increase with the TI. The RMS bending moment coefficients increase as the TI increases for pitch angle of 0°. Large amplification of the RMS bending moment coefficients is observed when the TI is larger than 10%. For pitch angle of 90°, the RMS bending moment coefficients first increase and then decrease with the TI. The maximum value of the RMS bending moment coefficients occurs under TI of 18%, which is 2.6 times the minimum value emerged under TI of 7%. The power spectra of bending moment coefficients change gently with the reduced frequency and show obvious wide-band characteristics. The effect of TI on the power spectra is not evident. Variations of the mean and RMS displacements with TI keep the same pattern as those of the bending moment coefficients. The feathering condition at pitch angle of 90° can effectively reduce the mean tip displacement of the blade. For pitch angle of 0°, the peak displacements increase with the TI. The maximum peak displacement of 1.42 m occurs under TI of 22%, which is 2.63 times the minimum peak displacement under TI of 7%. For the pitch angle of 90°, variations of peak displacements with the TI keep the same pattern as those of the RMS displacement. The maximum peak displacement of 1.16 m emerges under TI 18%. Although peak displacements at pitch angle of 0° are larger than those at pitch angle of 90° under all the turbulence intensities, higher TI may result in larger wind-induced dynamic displacements of the wind turbine blade, which should be paid more attentions for the wind-resistant design of wind turbine blades located in regions with high turbulence.
Footnotes
Declaration of conflicting interests
The author(s) declared no potential conflicts of interest with respect to the research, authorship, and/or publication of this article.
Funding
The author(s) disclosed receipt of the following financial support for the research, authorship, and/or publication of this article: The work described in this article is fully supported by the grants from National Nature Science Foundation of China (Project No: 51708207, 51978593, 51878271), a grant from Hunan provincial Education Department (Project No: 18B206), and a grant from Fundamental Research Program of Shenzhen Municipality (Project No: JCYJ20160401100137854). The first author would also like to dedicate this article to his memorable and respectable grandfather.