
Abstract
This study examines the punching shear and deflection performance of 16 Geopolymer concrete (GC) two-way slabs subjected to monotonic and cyclic loading by considering the reinforcement material, percentage of reinforcement, type of concrete and the concrete grade. The tested specimens indicated that the crack patterns at the failure and failure modes were almost similar regardless of the type of reinforcement or their ratio. Moreover, the slabs reinforced by fibre-reinforced polymer (FRP) bars exhibited a lower punching capacity than those strengthened by steel bars, even for similar reinforcement ratios. In addition, the results showed that upon increasing the concrete strength and reinforcement ratio, a higher punching shear capacity and lower deflections were obtained under cyclic and monotonic loading. In addition, the punching shear performance of GC slabs was found to be better than that of ordinary concrete (OC), even though both were reinforced by the basalt FRP (BFRP) bar. However, the ultimate load capacity of the slabs was reduced as a result of cyclic loading according to the capacity of the same specimen, resulting from static loading. However, the reduction is very low for slabs reinforced with FRP slabs. Further, the slabs reinforced by FRP had a better fatigue performance compared with slabs reinforced by steel bars with respect to cyclic loading. The results of the tests were also used to evaluate the accuracy of the available punching shear capacity equations.
Keywords
Introduction
Cement-based concrete with internal steel reinforcement is one of the most commonly used raw materials in the field of civil infrastructure. However, different concerns have arisen regarding its application, and this has led persons in the construction industry and researchers to consider other alternatives. As a result of the increase in global warming, cement is not valued due to its production process, which requires considerable energy, leading to adverse environmental effects. Different researchers have indicated that the production of one ton of cement requires approximately one ton of materials, and it emits an increased amount of carbon dioxide (CO2) to the environment (McCaffrey, 2009; McLellan et al., 2011). Moreover, various deteriorated and substandard structures require significant rehabilitation cost, and may sometimes require total replacement. Moreover, the corrosion of steel bars is another issue which extensively impacts the performance of traditional strengthened concrete structures (Fu XD, 1997). These concerns have inspired engineers and scientists to discover other alternatives for ordinary concrete (OC) and steel reinforcement in order to increase sustainability. One of the popular solutions is the replacement of cement-based concrete with geopolymer concrete (GC) and the replacement of steel bars with fibre-reinforced polymer (FRP) bars.
Geopolymer is a friendly binder to the environment obtained by alkaline solution, which activates aluminosilicate materials including metakaolin, slag and fly ash. Therefore, geopolymers have attracted attention in recent years, and have functioned as an alternative to Portland cement (Bernal et al., 2011; Davidovits, 1989; Duxson et al., 2007b). The geopolymer binder usually reduces the emission of greenhouse gases and the requirements of energy with the efficient application of by-products from factories. Further, various eligible features were obtained using GC. Such features include dimensional stability, rapidly developed mechanical strength, and fire and acid resistance. In addition, the required cost of material for the fly ash-based GC is approximately 10–30% lower compared to that of OC (Duxson et al., 2007b).
The FRP bars are entirely corrosion-resistant, durable and nonmagnetic (GangaRao et al., 2006). FRP bars are commonly manufactured from glass (GFRP), carbon (CFRP), and aramid (AFRP). The newly produced reinforcing bars containing basalt fibre have captured the attention of many individuals as an effective alternative to other bars because of their effectiveness and reduced prices. Moreover, it is very resistant to high temperatures, has high resistance to corrosion and acids, vibration, and impact loading, and is suitable for easy processing (Li and Xu, 2009; Pavlovski et al., 2007; Shi et al., 2011). Basalt FRP (BFRP) has been preferred for new concrete structures because of its outstanding features. Even though it can replace the carbon and glass composites in RC structures, the BFRP reinforcement is not one of the already approved FRP types in most design codes because of insufficient research (El Refai et al., 2015). Therefore, it is essential to perform research into BFRP RC members.
Assembling the various beneficial properties of GC and FRP bars is critical in the field of construction. To gain acceptance in this field, there should be an investigation into the use of GC members reinforced with FRP bars.
Flat slabs supported on columns are among the most commonly applied structural systems for parking garages, offices and even industrial buildings, because they have various benefits. The slabs are usually susceptible to monotonic, cyclic or repeated loading. For instance, in parking garages and bridges, performance under cyclic loading is an essential limit state that must be considered by designers.
Various studies have been performed to investigate the behaviour of OC two-way slabs reinforced by GFRP and CFRP bars and grids under monotonic loading (El-Ghandour et al., 2003; Hassan et al., 2013a, 2013b; Kim and Lee, 2021; Lee et al., 2009; Matthys and Taerwe, 2000; Ospina et al., 2003; Zhang et al., 2005). Studies have revealed that two-way flat slabs reinforced by GFRP exhibit low punching shear capacities. Moreover, it also showed larger crack widths and minimal post-cracking stiffness compared with their counterparts which are reinforced by steel bars, even for the same amount of reinforcement. Zhang et al. (2005) explained that the type of reinforcement impacted the slabs’ punching strength. Moreover, the strength of concrete significantly impacted the load-carrying capacity as well as the post-punching capacity of the slabs. However, it was observed that it has little impact on the stiffness of the cracked slabs. Mahroug et al. (2014) indicated that the deflections of the BFRP-strengthened slab were underestimated, while the moment capacities were overestimated at mid-span as well as over support sections by ACI 440-1R-06. In contrast, little research has been performed on concrete slabs strengthened with FRP under pulsating conditions. El-Ragaby et al. (2007) tested various GFRP-strengthened slabs and observed that punching shear existed as the only failure mode in the case of fatigue loads. GFRP-strengthened decks exhibited good fatigue performance as well as an increased fatigue life compared to steel-reinforced decks. In addition, Sivagamasundari and Kumaran (2008) performed different experimental tests on 40 one-way concrete slabs strengthened by GFRP and steel reinforcements upon being subject to repeated and even static loadings. The researchers also found that the fatigue response of the sand-coated GFRP was greater than that of the other slab types.
Most of the previous studies dealt with FRP-OC slabs, with the exception of Zheng et al. (2017), which dedicated itself to this study. Self-compact concrete containing partially extra industrial by-products as well as basalt fibre-strengthened polymer bars was used to build one-way deck slabs. The results of the test indicated that the BFRP bar reinforced deck slabs exhibited greater performance in terms of deflection and durability when compared to the bridge slabs reinforced by steel. However, this study did not determine the ultimate behaviour of the slabs. Moreover, no research has been performed on BFRP-reinforced two-way slabs of GC under repeated loading and monotonic loading, which is the essential motivation of this research. Therefore, further investigation is required to establish as well as give the stress level, loading-carrying capacity and resistance of the material at the ultimate limit to maximise the designs for GC slabs strengthened with BFRP. Therefore, a series of two-way slab specimens were tested under monotonic and cyclic loads using GC and BFRP bar combinations.
The objectives of this study are to improve the available investigations and contribute to the literature on slabs reinforced by FRP and steel bars by considering GC via detailed static and cyclic loading tests which have not been carried out so far. During the experimental study, the effects of different structural variables on the slabs were also investigated. The variables comprised the concrete type, concrete compressive strength, reinforcement type and reinforcement ratio. Moreover, the structural behaviour was evaluated by considering the crack patterns, ultimate load, deflection and load-deflection relationship. The results were then utilised to evaluate the ultimate capacity and deflection of the GC slabs reinforced with FRP bars.
Experimental Program Materials
Geopolymer Concrete
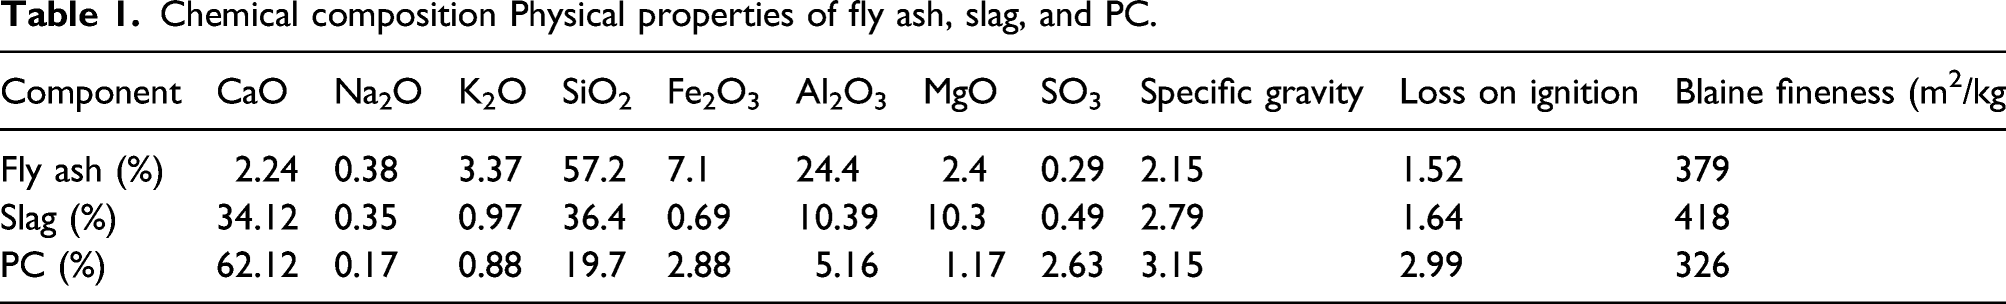
Chemical composition Physical properties of fly ash, slag, and PC.
Reinforcing Bars
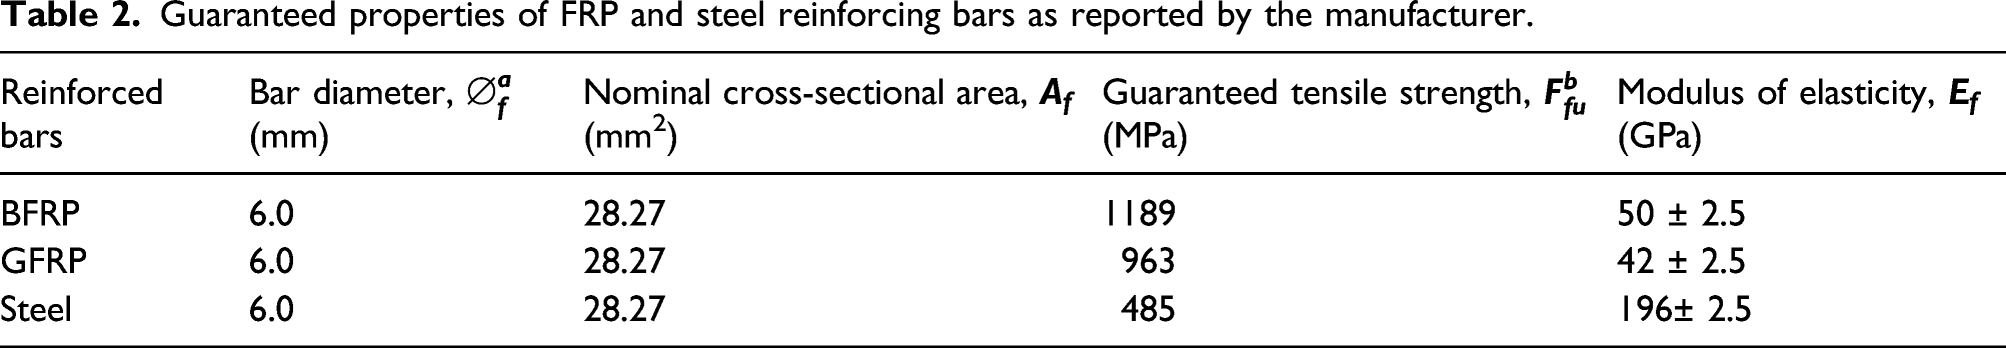
Three different reinforcing material types, that is, BFRP, GFRP and steel bars were used in this study. Both BFRP and GFRP reinforcing bars were produced through the pultrusion process of continuous fibres immersed in a vinyl resin containing a fibre volume ratio of at least 65%. For the BFRP and GFRP bars, ribbed bars with a diameter of approximately 6 mm were considered, as shown in Figure 1(a). The geometric and guaranteed properties of the FRP bars are listed in Table 2. The elastic modulus and tensile strength of the bars were determined through the use of a nominal cross-sectional area. In addition, for comparison purposes, 6.0-mm-diameter deformed steel bars were utilised, and the mechanical properties of the steel bars are presented in Table 2. Geopolymer concrete specimens preparation: (a) Different reinforcement bar (b) Assembly of cages and mould; (c) dry mixing and addition of activator; (d) filling and vibrating; (e) surfacing; and (f) slab specimens with cylinder. Guaranteed properties of FRP and steel reinforcing bars as reported by the manufacturer.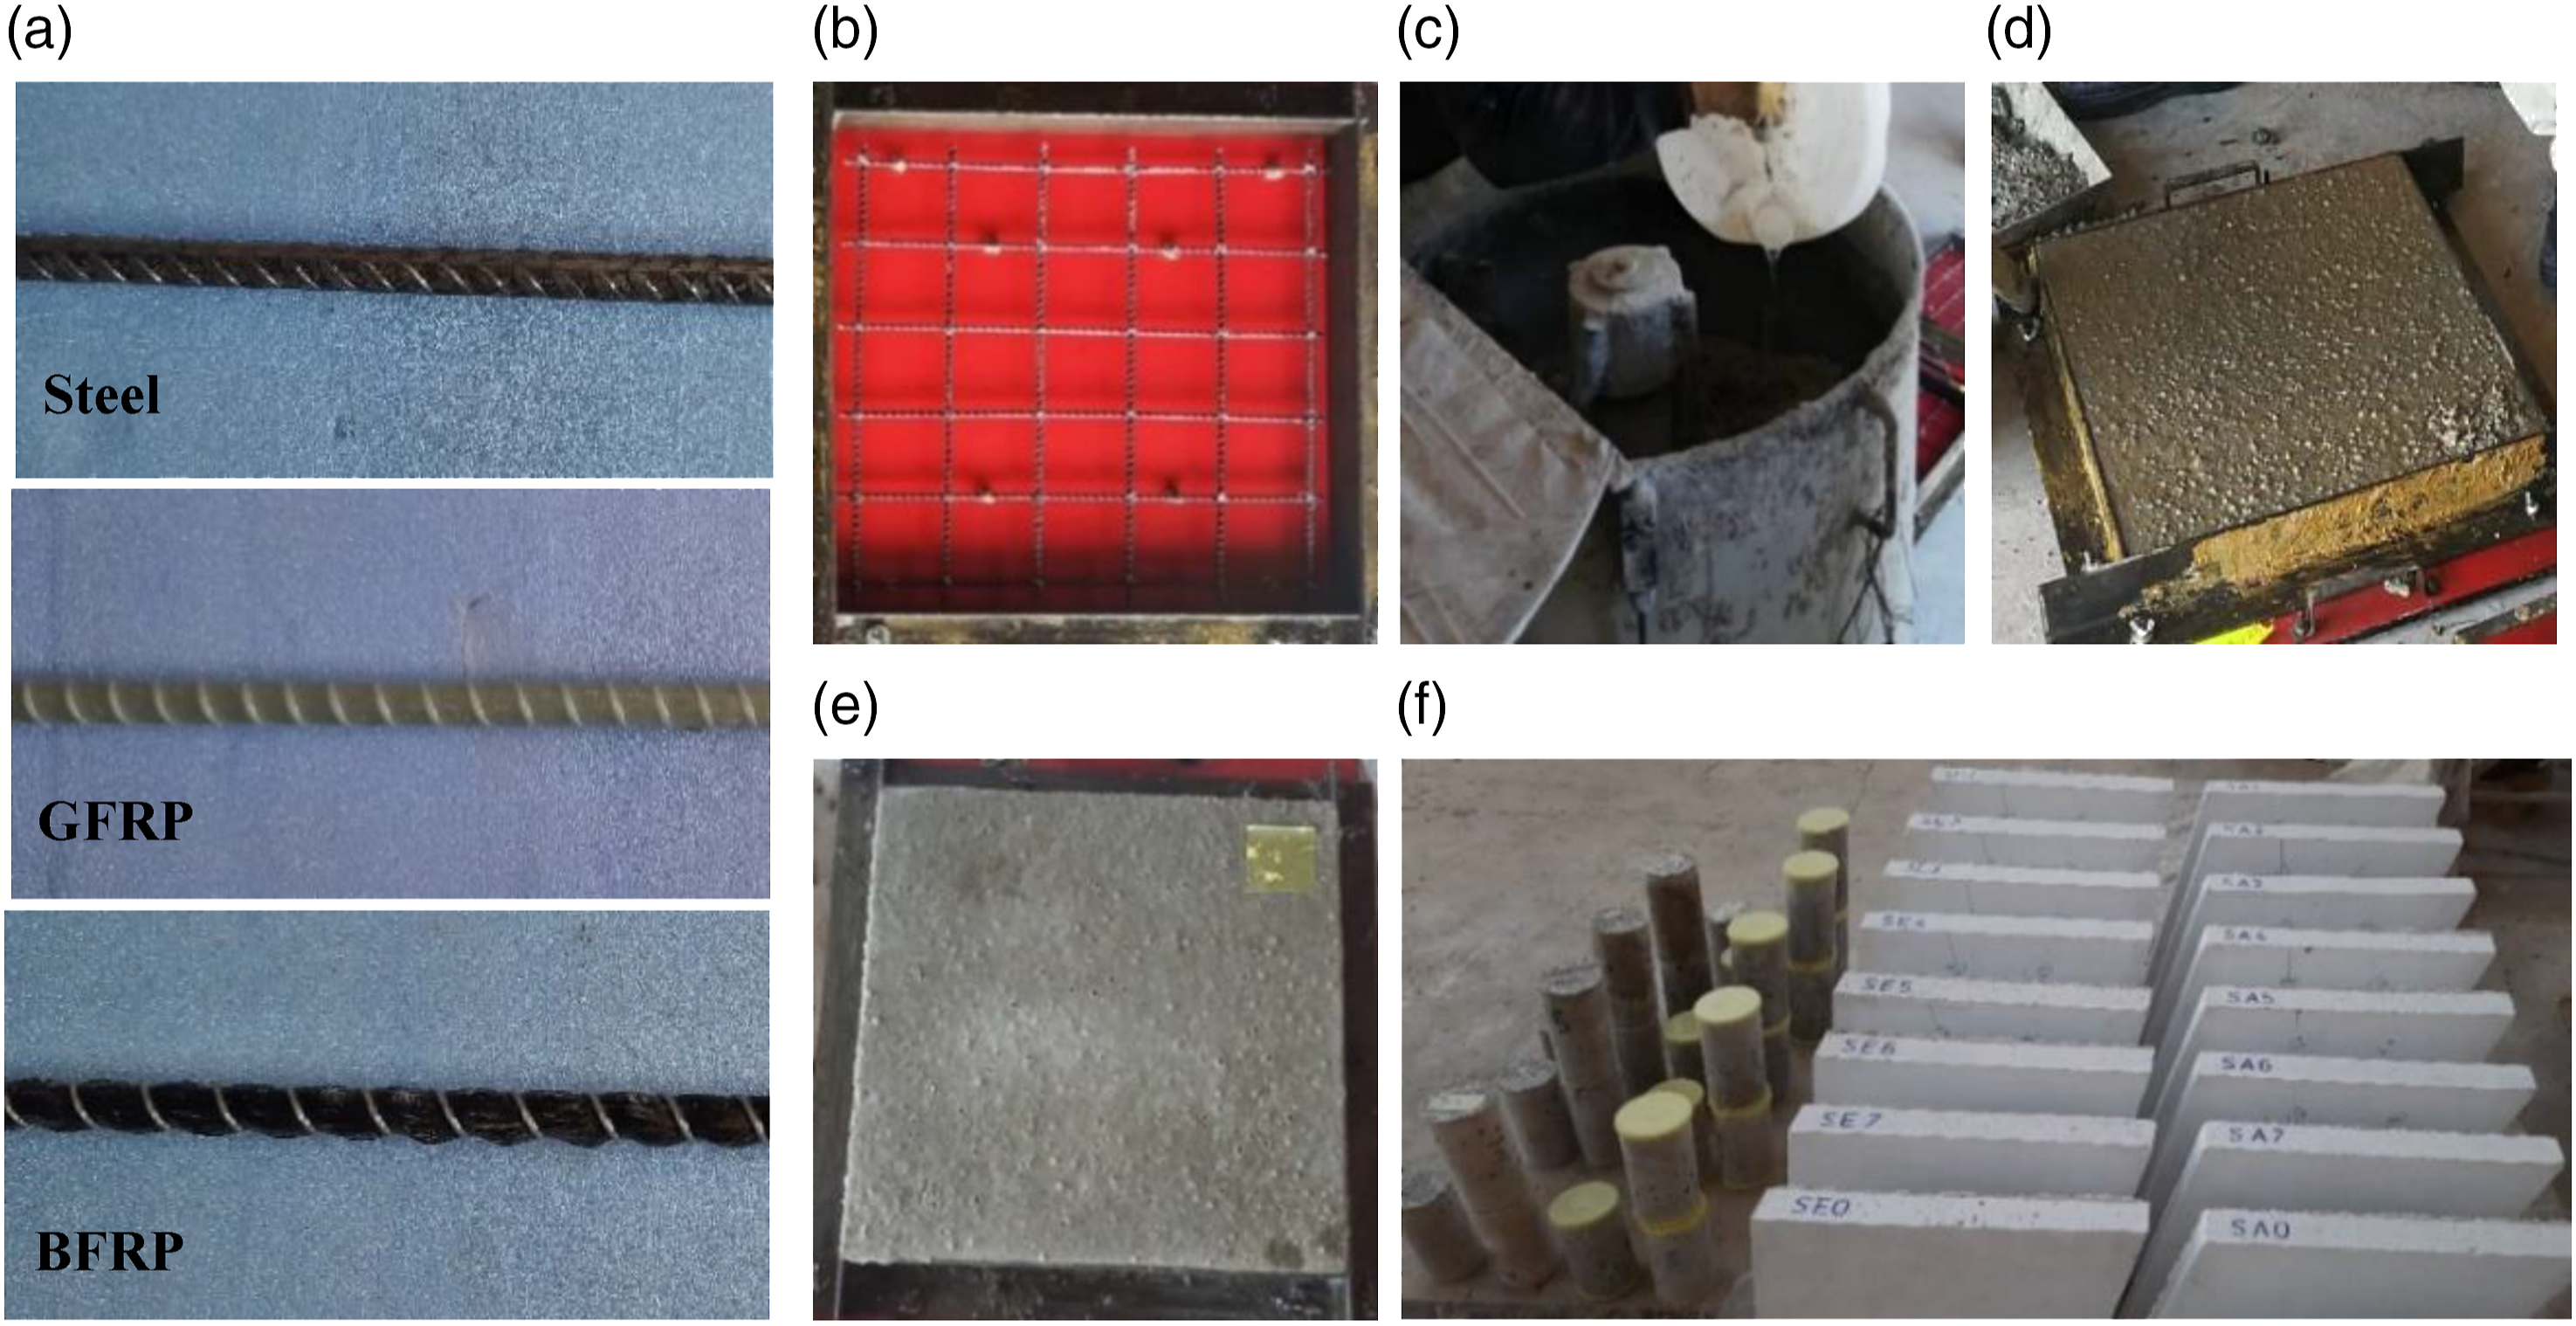
Mix Proportions
Mix proportion of the concrete and concrete strength.
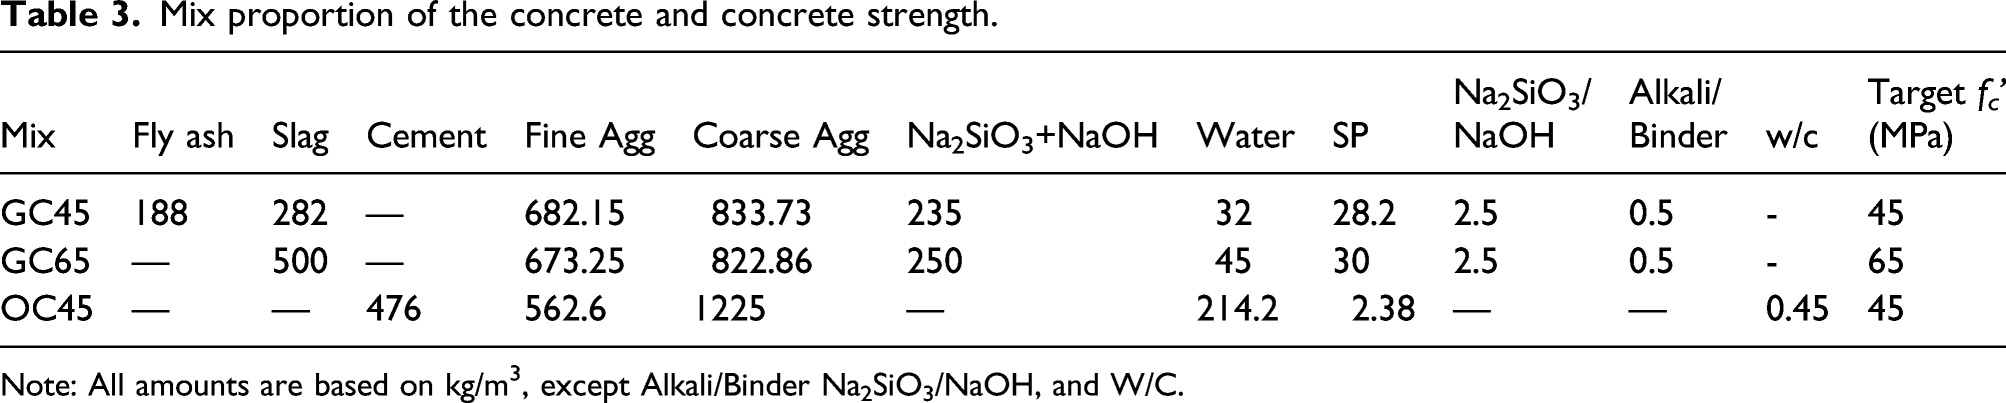
Note: All amounts are based on kg/m3, except Alkali/Binder Na2SiO3/NaOH, and W/C.
Experimental Matrix
Detail of slab specimens and Test Results under static and repeated loading.
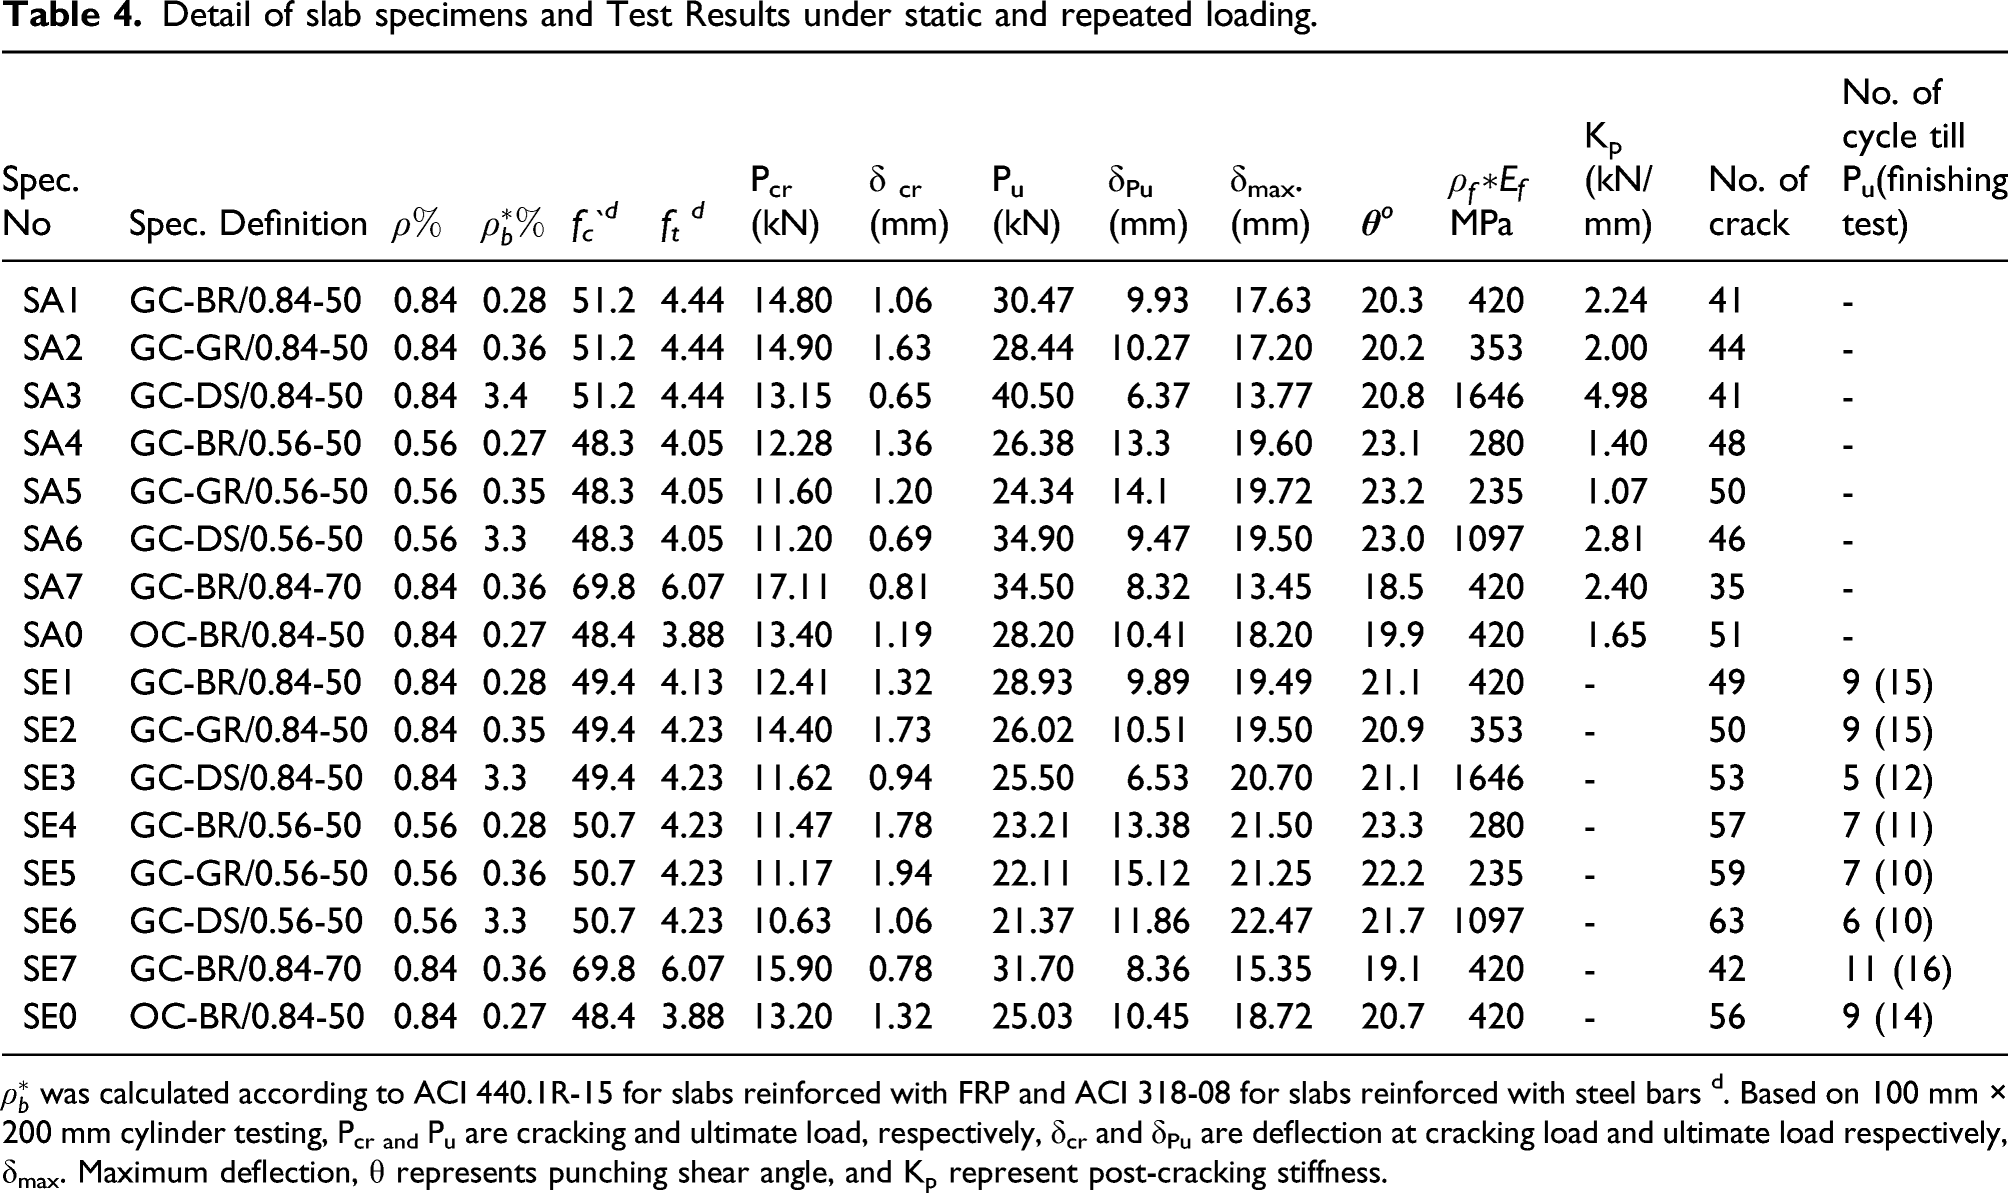
The different parameters used in the study included three different types of bars: BFRP, GFRP and steel bars. Other parameters include the reinforcement ratio (0.84% and 0.56%), type of concrete (OC or GC), and compressive strength of the concrete (C50 and C70 Mpa).
In each group, GC was cast for all slabs, except that a single slab was produced from OC. Moreover, all of the slabs were produced from normal compressive strength concrete, except for one which was fabricated from high compressive strength concrete. Furthermore, four slabs were reinforced using ribbed basalt FRP bars of 6.0-mm diameter in two directions, with three of them having a reinforcement ratio of 0.84%, and the remaining one possessed a ratio of 0.56%. Two slabs were reinforced by ribbed glass FRP bars with a diameter of 6 mm and reinforcement ratios of 0.84 and 0.56%. The remaining two slabs were orthogonally reinforced using 6.0-mm-diameter deformed steel bars with reinforcement ratios of 0.84% and 0.56%.
Different specimens were labelled and identified uniquely. The first two letters represent concrete types, for example, GC denotes geopolymer concrete, whereas OC represents ordinary concrete. The next two letters represent the surface configuration as well as the type of reinforcement. For example, BR stands for basalt-ribbed FRP bars, while SD and GR stand for steel-deformed and glass-ribbed FRP bars, respectively. These two letters are followed by a number which specifies the reinforcement ratio of the bars. Then, the last number indicates the compressive strength of the concrete. For instance, the specimen GC-BR/0.84-50 indicates a GC slab reinforced by basalt-ribbed FRP bars with a reinforcement ratio of 0.84 and compressive strength of 50 MPa.
Production of Slabs
Details regarding the manufacture of GC and the preparation of the slabs are shown in Figure 1. The slabs' dimensions were all selected according to the relative size observed in the literature (Annerel et al., 2013; Ghoreishi et al., 2015; Kordina, 1997; Liao et al., 2014; Salem et al., 2012) The sizes varied from 1.39 to 3.87, from 10.5 to 45 and from 0.085 to 0.15 for c/d, b/d and c/b, respectively. The geometry of the slab specimens is displayed in Figure 2(a) and (b). (a) Slab reinforcement details; (b) slab geometry details; (c) rigid steel frame support of eight half -balls; and (d)setup of specimen’s test diagram and actual photo. (dimensions are in mm).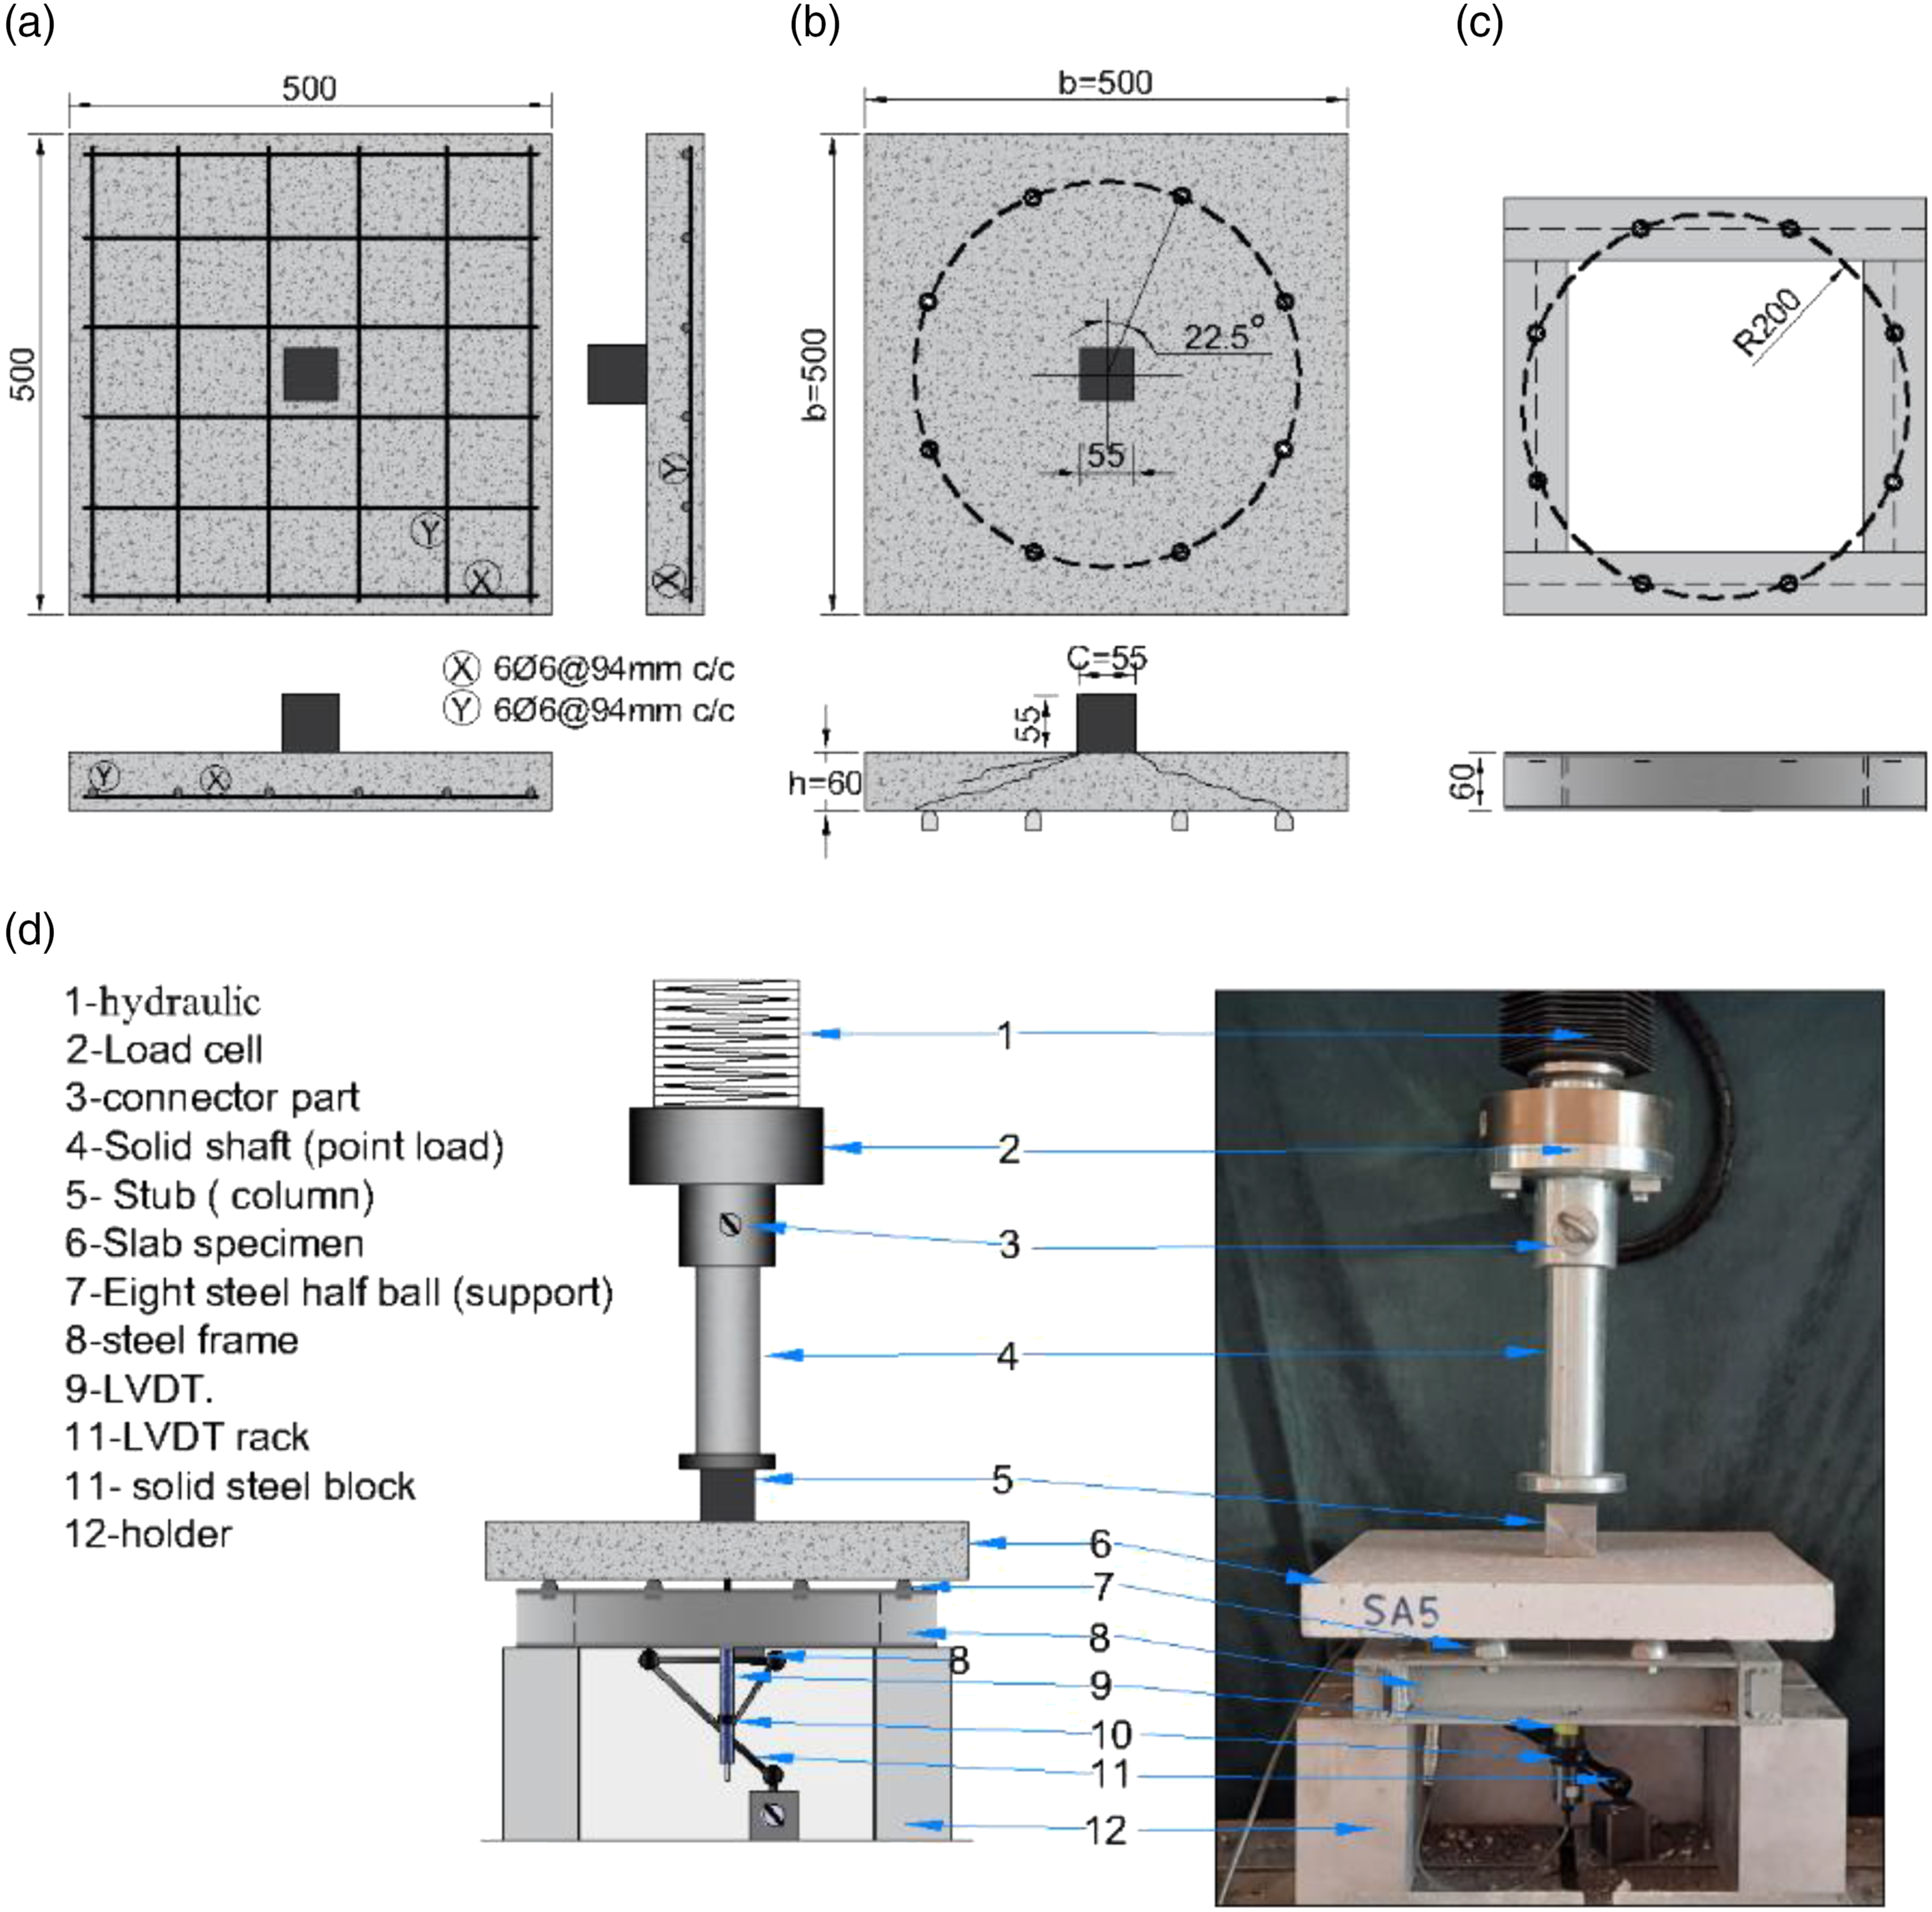
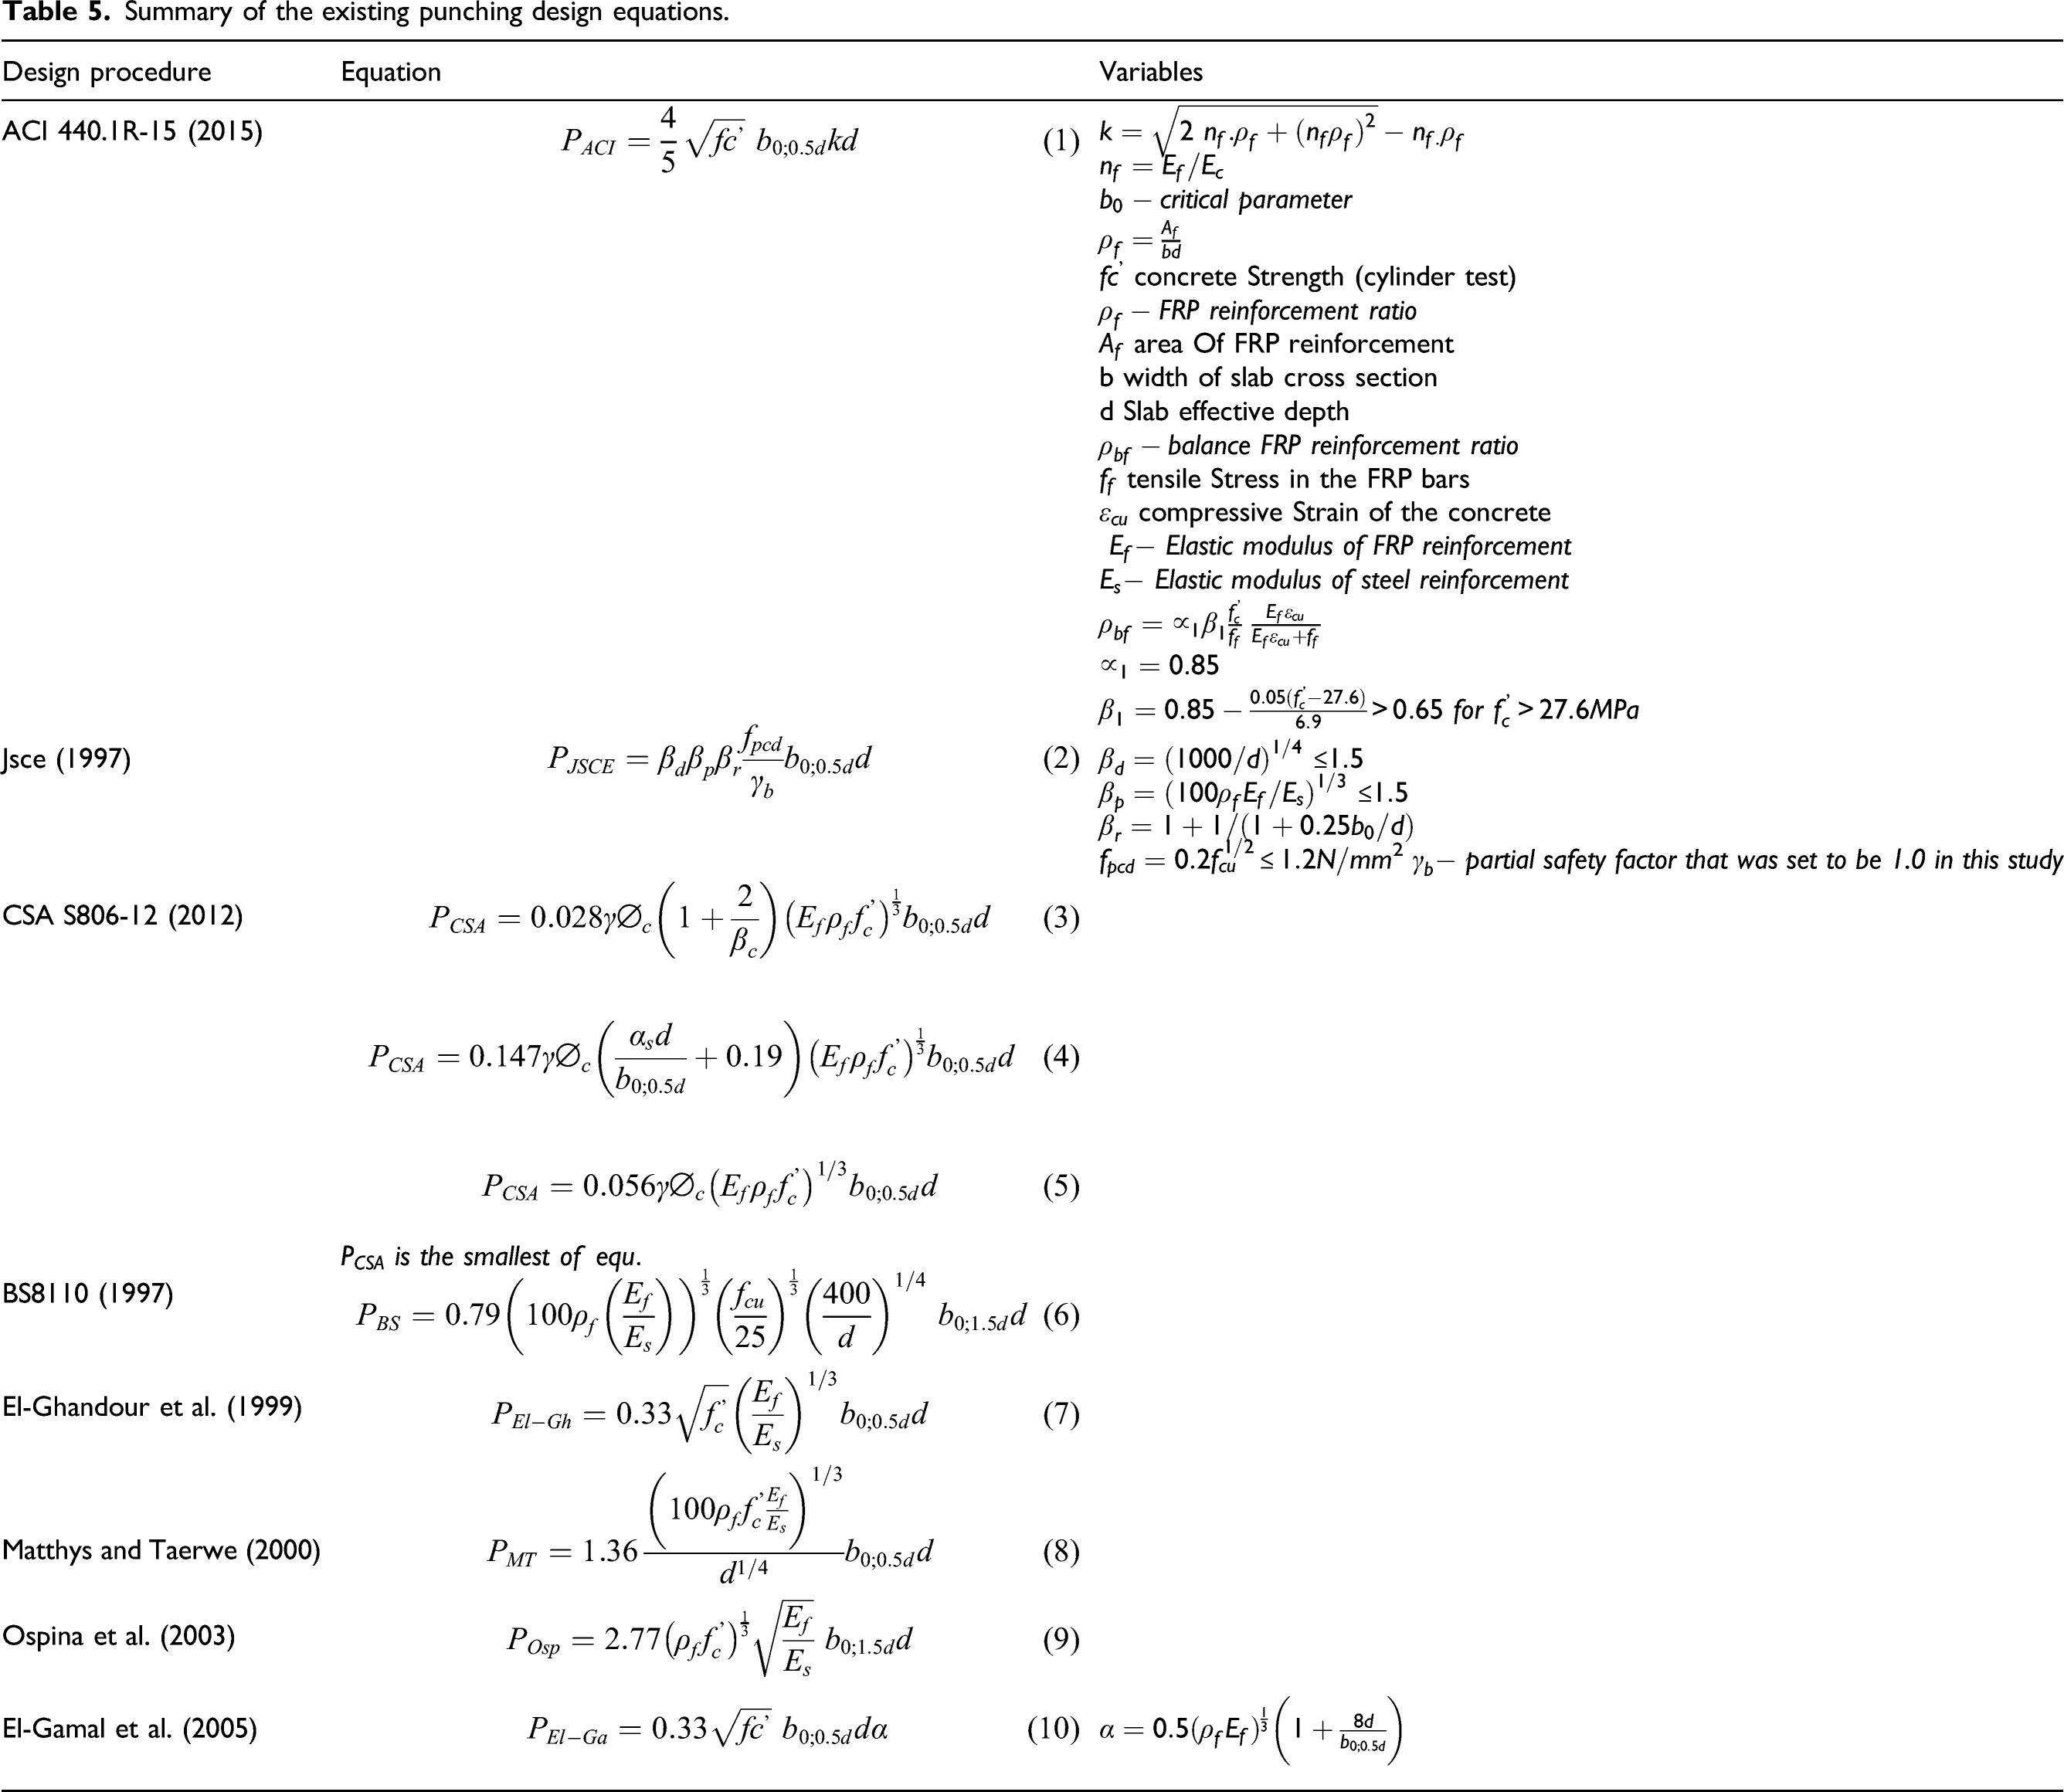
Summary of the existing punching design equations.
Test Setup
Standard cylinders and slabs of similar age were simultaneously tested. In the different tests, the loading process was performed monotonically or cyclically until failure. The arrangement of the specimens is shown in Figure 2(d). In the case of slabs, loading tests were performed using a displacement-controlled servo-hydraulic flexural testing machine with a capacity of 500 kN. For convenience, a unique steel support, in which eight steel half balls were placed, was fabricated, as indicated in Figure 2(c). The initiation and propagation of cracks were monitored using a mini camera placed at the base of the testing machine and connected to a computer. The deflection of the slabs under loading was controlled by a linear variable differential transformer (LVDT) gauge kept beneath the slab centre. The cyclic or monotonic loads were transferred from the hydraulic jack via the load cell to a 55 mm hardened steel cube which represented the column stub, and was transferred the load to the slabs during the tests. The mushroom shape of half balls is essential to enable the slab to rotate freely in all directions. In addition, the curvature of the half balls was made to avoid premature failure of slabs as a result of stress singularity in the contact place. The balls were placed uniformly with a central angle equivalent to π/4 and radius (rq) equivalent to 200 mm, as shown in Figure 2(b).
Loading Scheme
In this study, monotonic or cyclic loading tests were conducted. To stabilise the testing system, a pre-loading of approximately 5% of the predicted ultimate load was used at the start of the tests. In the case of monotonic loading, a displacement control method with a speed of 0.75 mm/min was applied. The loading process was completed until the concrete specimens failed. In the case of cyclic loading, various specimens were tested according to the loading scheme shown in Figure 3, using a hierarchical loading method with a controlled displacement, where each cycle comprises loading and unloading processes. For each cycle, the displacement increment was approximately 1.0 ±0.2 mm at a speed of 0.75 mm/min at the beginning of the tests (in the pre-peak region (phase 1)). After the peak load (In the post-peak region (phase 2)), the displacement was adjusted to 1.5 ± 0.2 mm and 2.0 ± 0.2 mm with a speed of 1.0 mm/min. Furthermore, the process of unloading was load controlled at a speed of 1.0 kN/s, and the test was continued until failure of the specimens. Schematic sketch of the cyclic loading method.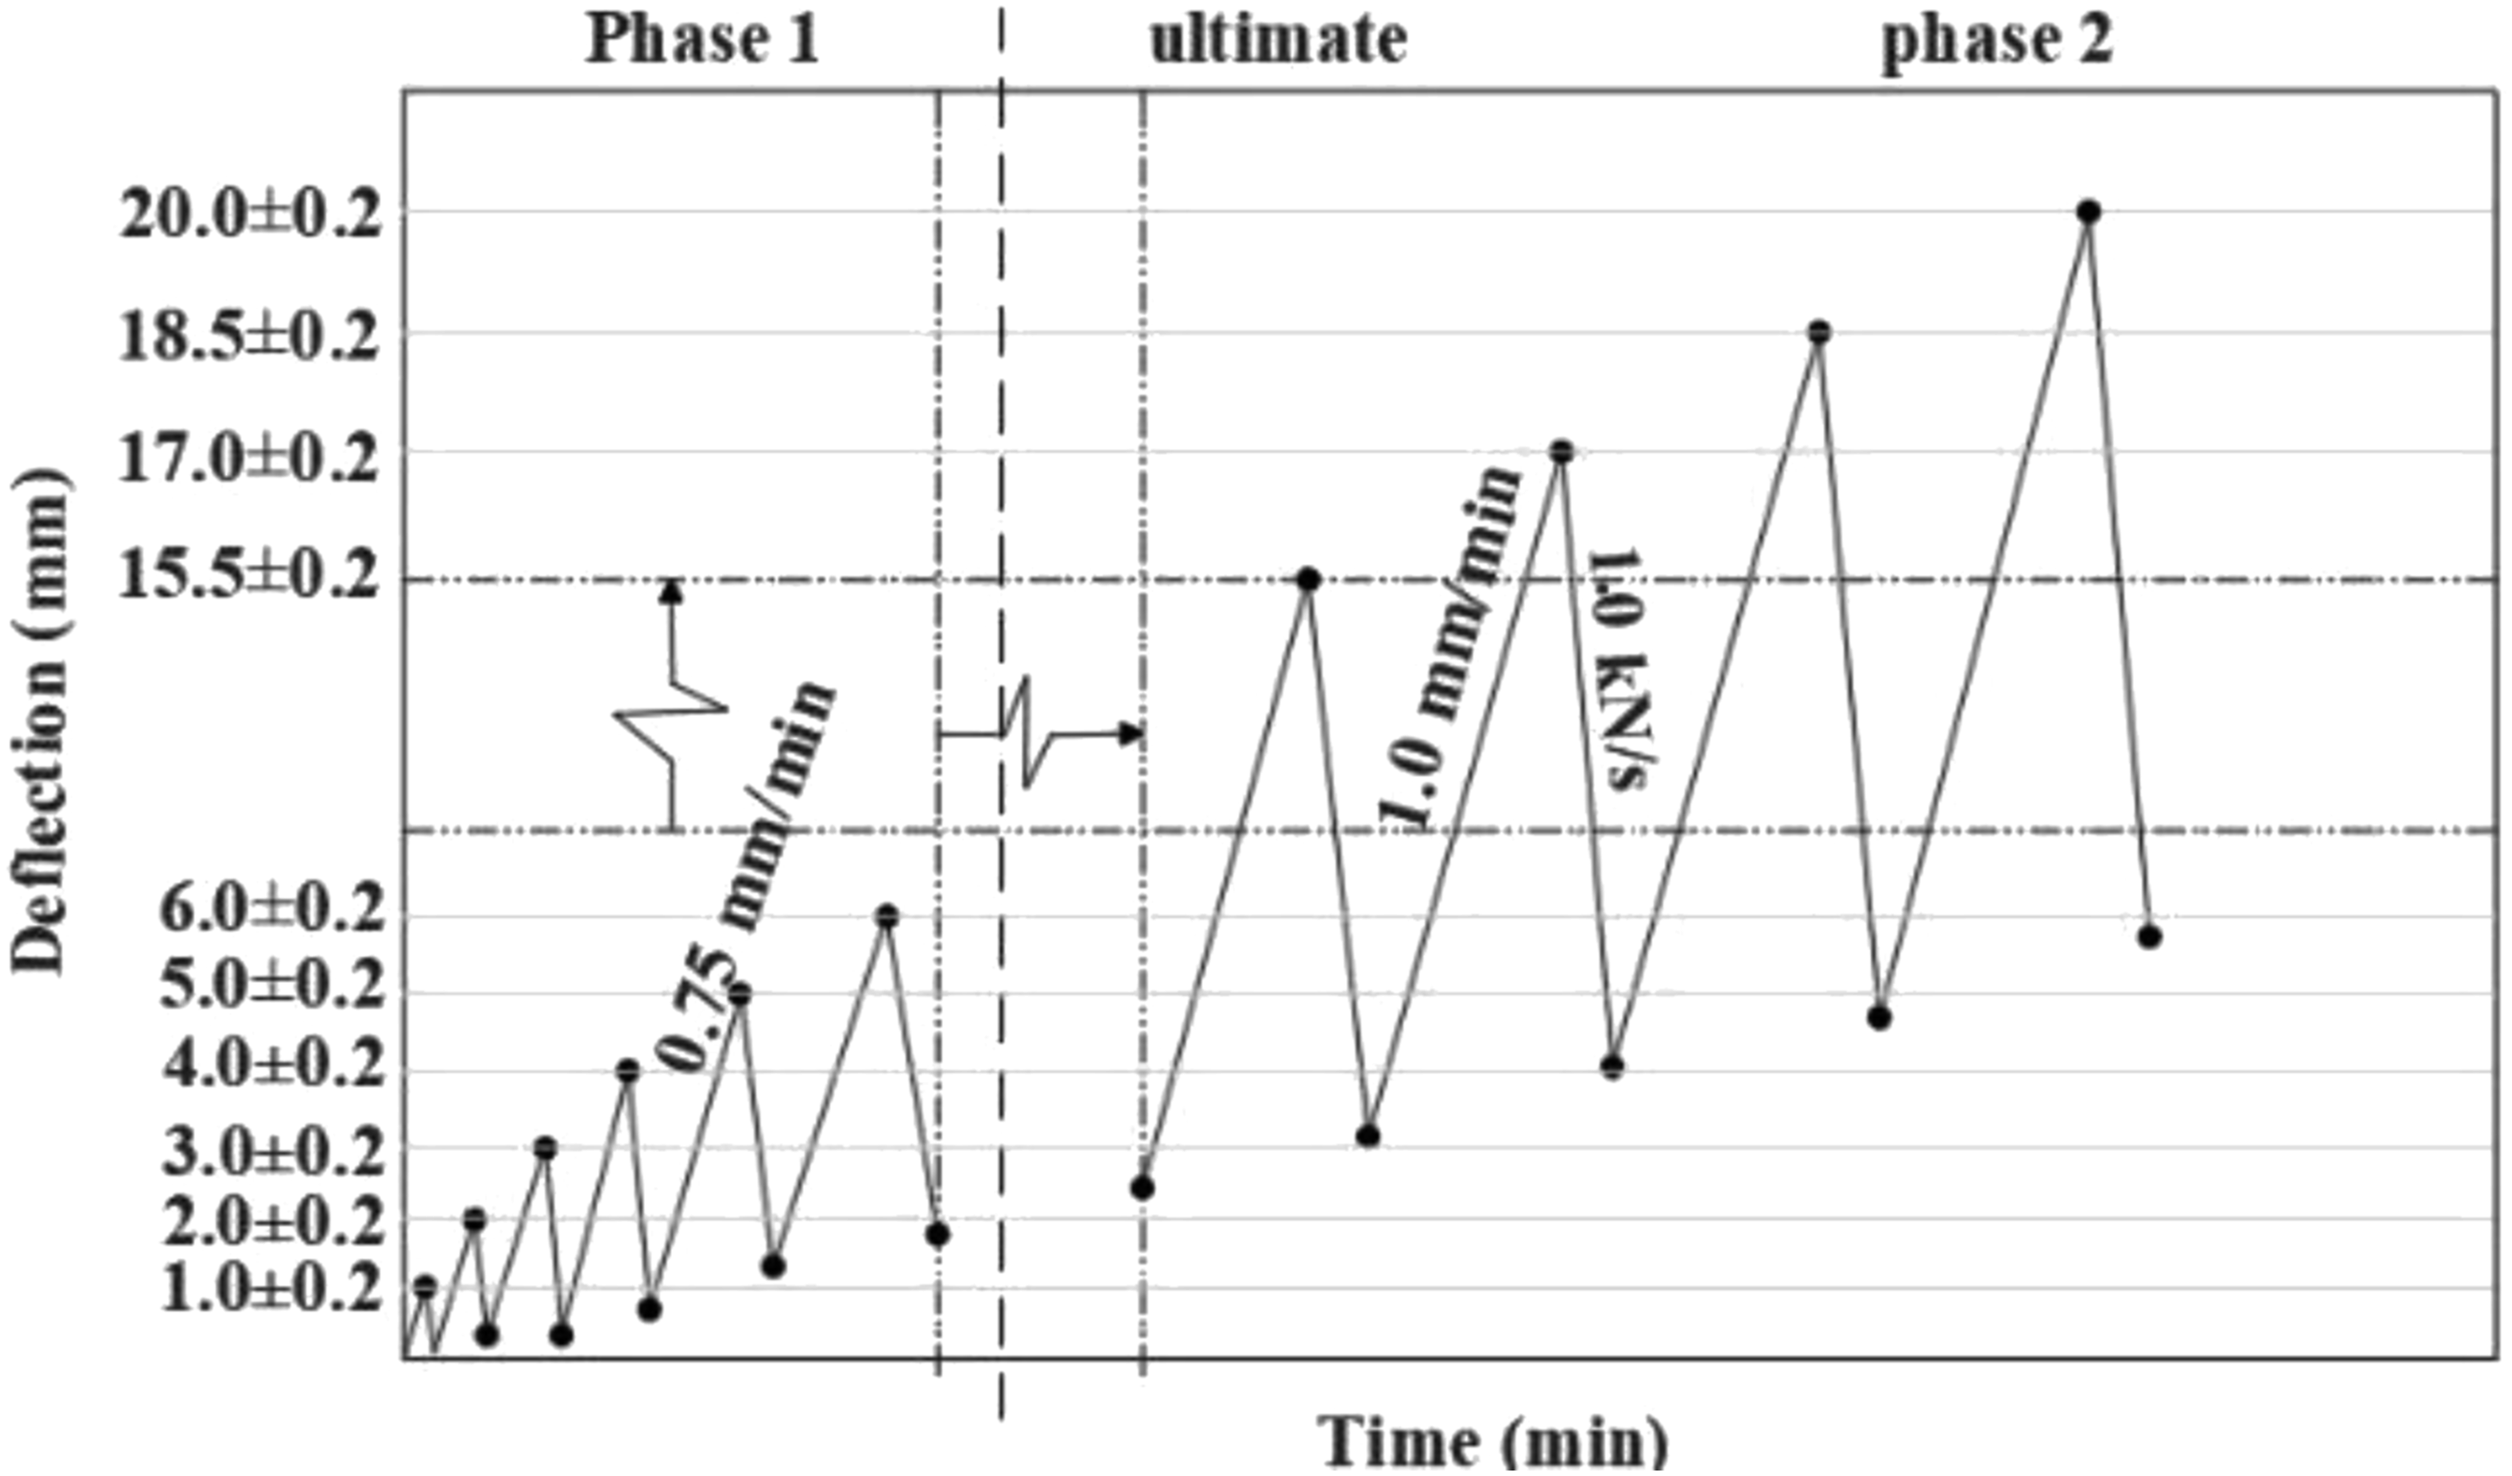
Results and Discussion
Crack Patterns and Failure Mode
As expected, cracks occurred at the bottom surfaces of the slabs when the force exceeded the maximum tensile strength. It was observed that the crack patterns of the specimens subjected to the cyclic load were almost the same as those obtained from the static load. However, based on Figure 4 and Table 4, more and wider cracks were formed for the specimens tested under cyclic loading. Punching-shear failure and Crack patterns at bottom surface.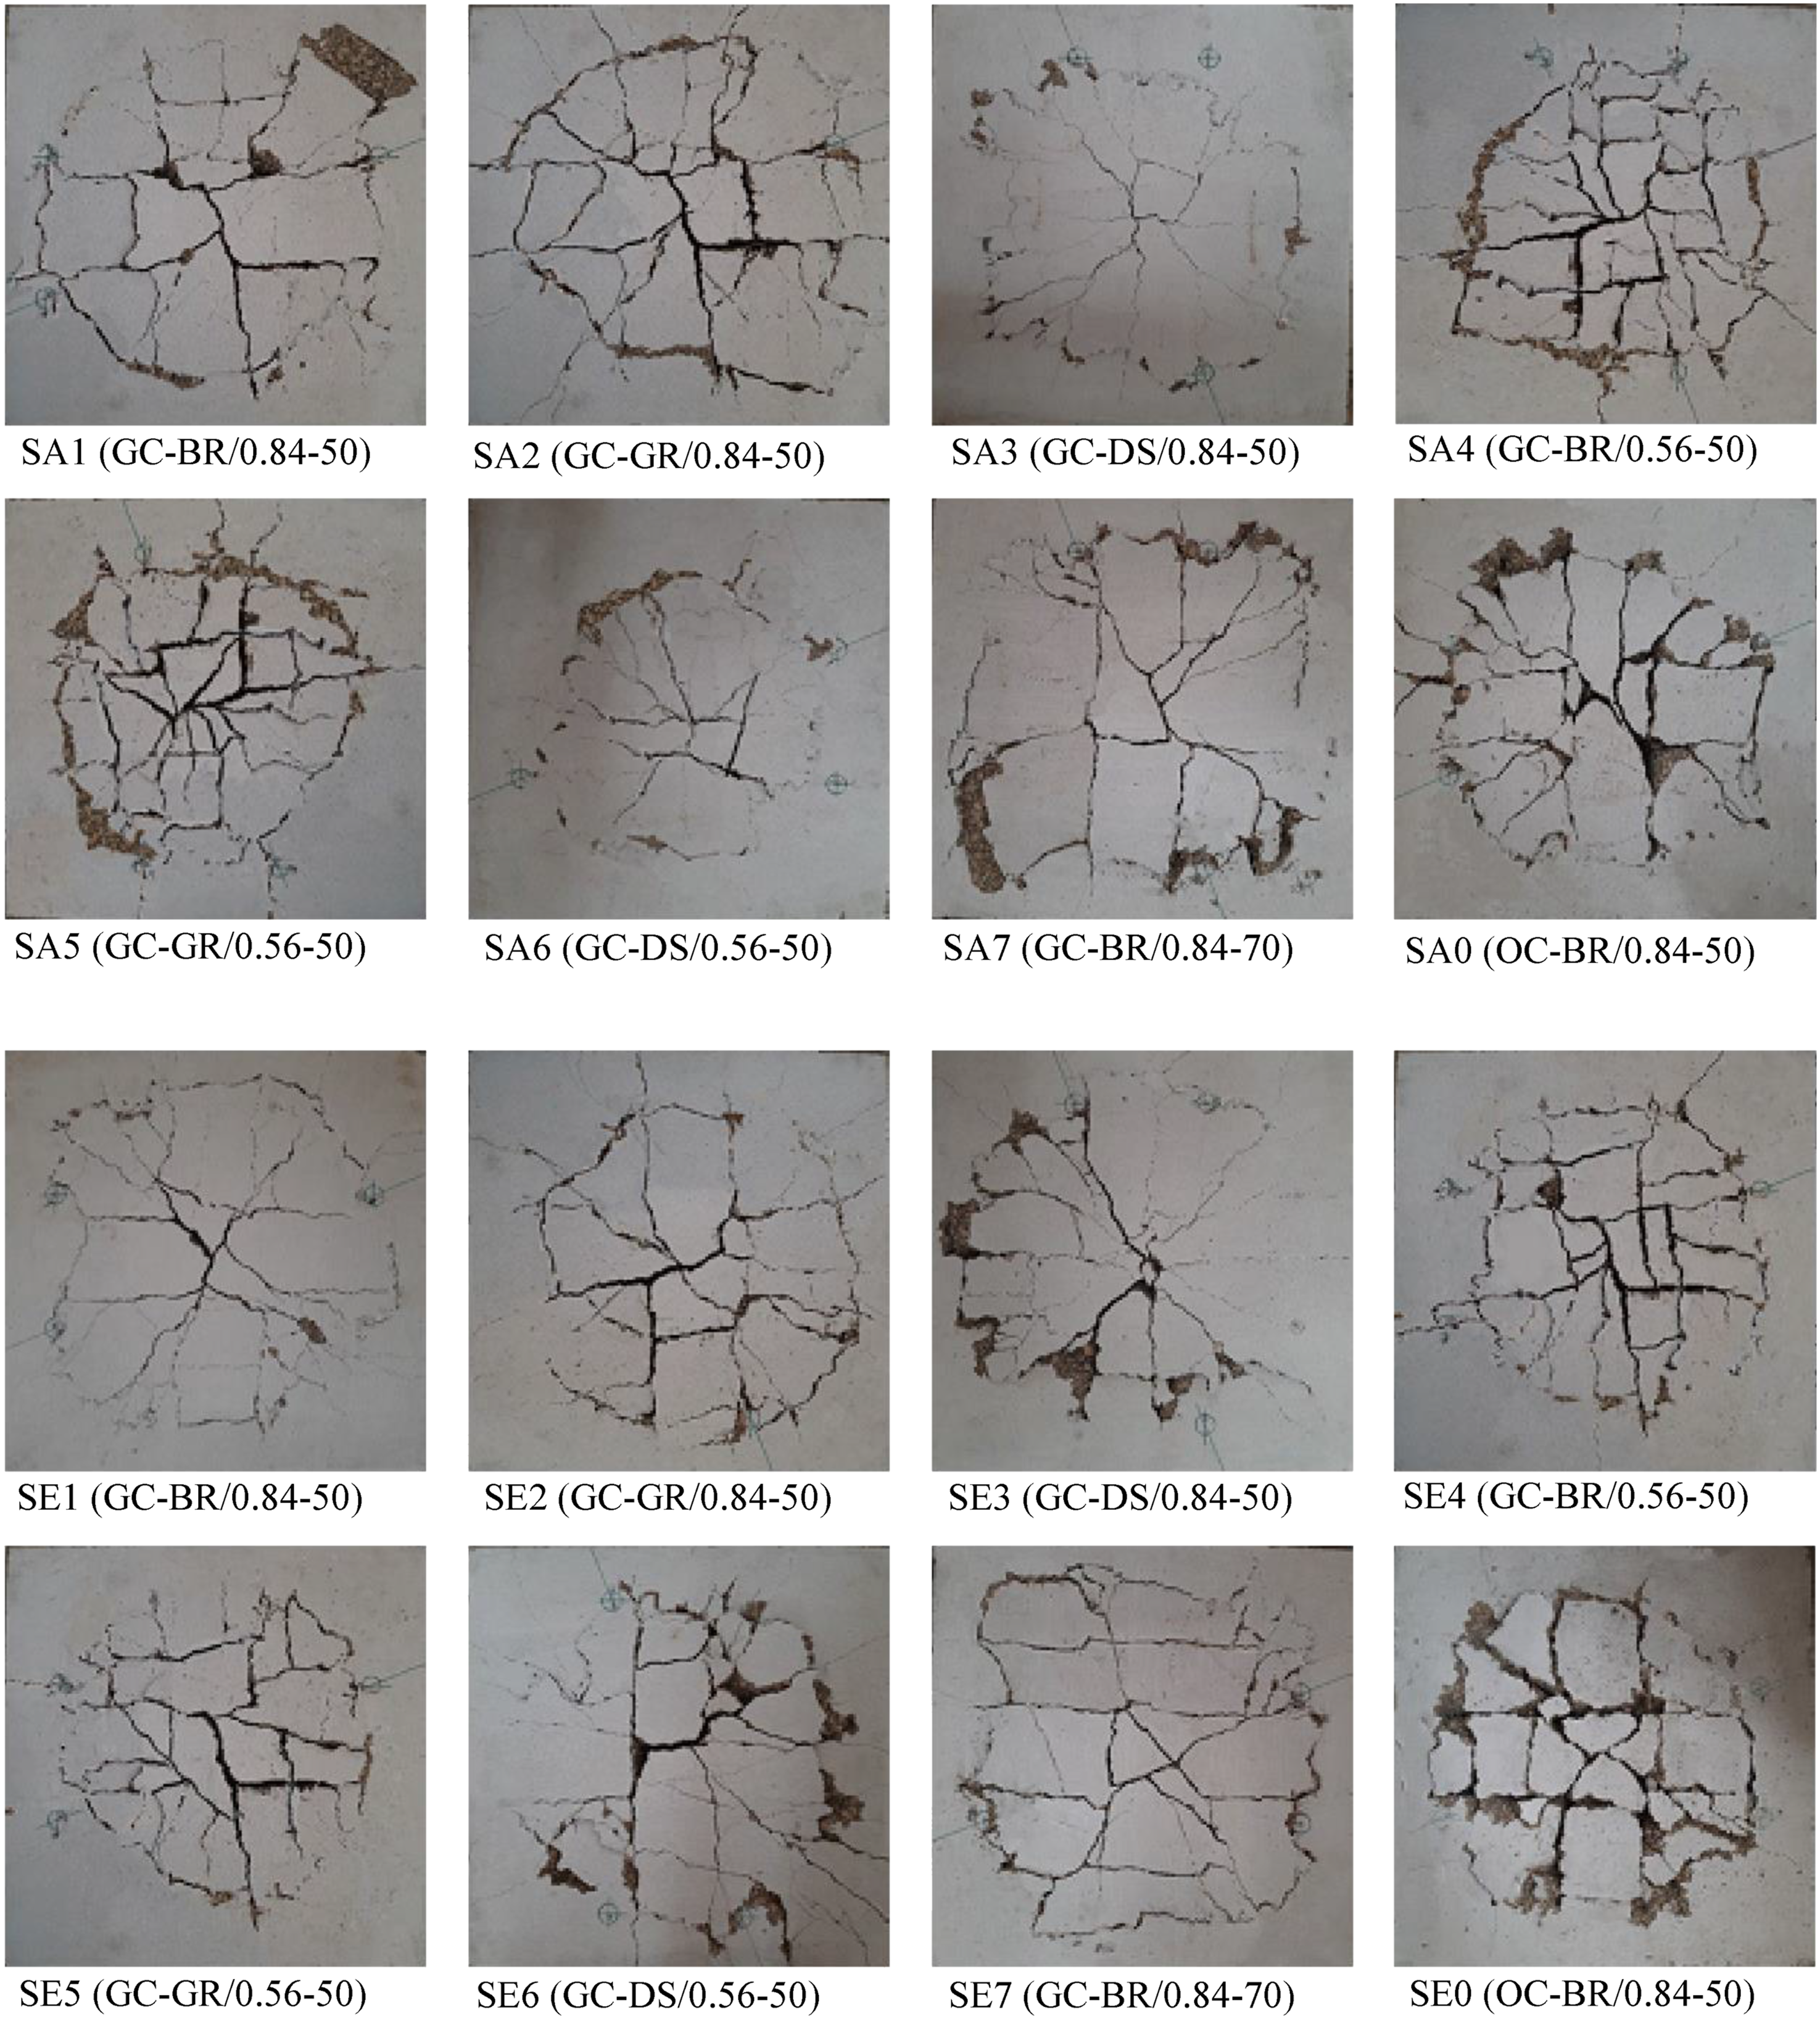
The initial cracking load varied from 11 kN to approximately 17 kN, as indicated in Table 4. In the various tested specimens, the initial longitudinal crack on the bottom surface of the slabs (tension side) occurred under the loaded area. It oriented toward the longitudinal direction parallel to both the Y-and X-axes, and it then propagated and moved radially to the edges of the slabs. Upon increasing the monotonic load or load cycles, the subsequent cracks moved toward the radial direction far from the loaded area. Finally, a punching shear crack which developed the punching cone dominated the circumferential cracks.
Moreover, it can be observed that the general crack patterns at failure for the different tested slabs were comparable, despite differences in concrete type, reinforcing materials and reinforcement percentages. The punching shear was the final mode of failure for the different test specimens, as shown in Figure 4. An almost rapid drop in the applied load confirmed the punching shear failure, which was accompanied by a broad clear crack which defined the failure surface of the specimens at the loaded area.
During the test process under monotonic loading, it was observed that the smallest width of cracks was observed in the slab strengthened by steel bars (SA3) when compared to those strengthened by BFRP and GFRP bars (SA1 and SA2), as shown in Figure 4. This resulted from a greater elastic modulus (higher axial reinforcement stiffness
It can be seen from the results of the tested specimens that the complete yielding of the tensile reinforcement cannot be obtained for reinforcement ratios higher than 0.5% for punching behaviour of two-way slabs, as also stated in the studies performed by Kinnunen and Nylander (1960) and Guandalini et al. (2009). 0.54% was an intermediate reinforcement ratio and even some yielding could be present in the immediate vicinity of the column, punching failure occurred in a brittle manner before yielding of all slab tensile reinforcement. Since, 0.84% was larger ratio, the same result was observed with higher brittleness. The similar behaviour was also observed by Hassan et al. (2013a, 2013b) who studied punching of steel-reinforced two-way slabs with reinforcement ratio of 0.8%. As illustrated in Figure 4, a similar structural performance was also observed during the comparison of the crack patterns of the SE1, SE2 and SE3 slabs owing to cyclic loading. In general, however, the samples subjected to cyclic loading were more damaged than the specimens subjected to static loading, which could be attributed to the closure and opening of cracks due to loading and unloading consecutively, which in turn led to the loss of concrete pieces. In addition, the loss increased as the number of cycles increased.
Before the punching shear failure, the specimens with low reinforcement percentages presented more flexural cracks and ductility. In contrast, an increase in the reinforcement percentage resulted in smaller crack widths and reduced crack numbers for GC slabs strengthened by various bar types, such as steel, BFRP, and even GFRP, as shown in Figure 4 and Table 4. The observation was because of the maximized axial reinforcement stiffness
Furthermore, the crack patterns of the OC (SA0 and SE0) and GC (SA1 and SE1) slabs were compared as a result of static and cyclic loadings. Generally, GC slabs have smaller crack widths and reduced numbers of cracks as a result of both types of loading because of the differences in bond performance between various concrete types (Mousavi et al., 2016). The GC possesses a greater bond strength when compared to that of OC. Moreover, an increase in the bond strength led to homogenous finer cracks along the length of the bar (Golafshani et al., 2014; Mousavi et al., 2016). In addition, the two specimens with higher compressive strengths (SA7 and SE7) exhibited the highest cracking loads for both loading schemes because of the increase in the tensile strength of the GC. It can be observed that an increase in compressive strength from 50 to 70 MPa led to an increase in the first cracking loads by 14.6% and 21% for SA7 and SE7, respectively. The concrete strength notably affected the first cracking load as an increase in the concrete strength increased the tensile strength of the GC. Moreover, the specimens with higher compressive strengths exhibited narrower and fewer cracks. This behaviour is the same as that of RC slabs reinforced by GFRP bars, which was studied by Hassan et al. (2013b).
Load Deflection Relationship under Static Loading
The load–deflection relationships of the various tested specimens are illustrated in Figure 5, the ascending branch until the ultimate load can be approximated as a bilinear load response up to sudden failure as a result of punching. The initial part of the ascending segment is a steep linear branch, in which the deflection increases linearly with the load. This part represents the elastic behaviour and shows the stiffness of the uncracked slabs, and is almost the same for different tested slabs. This is because in this phase, the slab’s load-carrying capacity was mostly controlled by the properties of the GC. The first cracks occurred at the bottom of the loaded areas, leading to a decrease in the stiffness of the slabs whenever the applied load was higher than the tensile strength of the GC. The relationships after the first cracks were represented by the second part of the ascending branch. The second part shows the reduction in post-cracking stiffness up to failure. The post-cracking stiffness was calculated from the slope of the second part of the ascending branch of the load–deflection response, and is presented in Table 4. After the ultimate load, there was a rapid drop in the load, which signified concrete crushing. The nonlinearity in the relationships resulted from an increase in cracks at the bottom, and/or crushing of the concrete, and was not related to FRP bars. A similar behaviour has been reported by (Razaqpur et al., 1995) for OC. Load–deflection behaviour: (a) different bar types; (b) different reinforcement ratio; (c) compressive strength grades; and (d) different concrete types.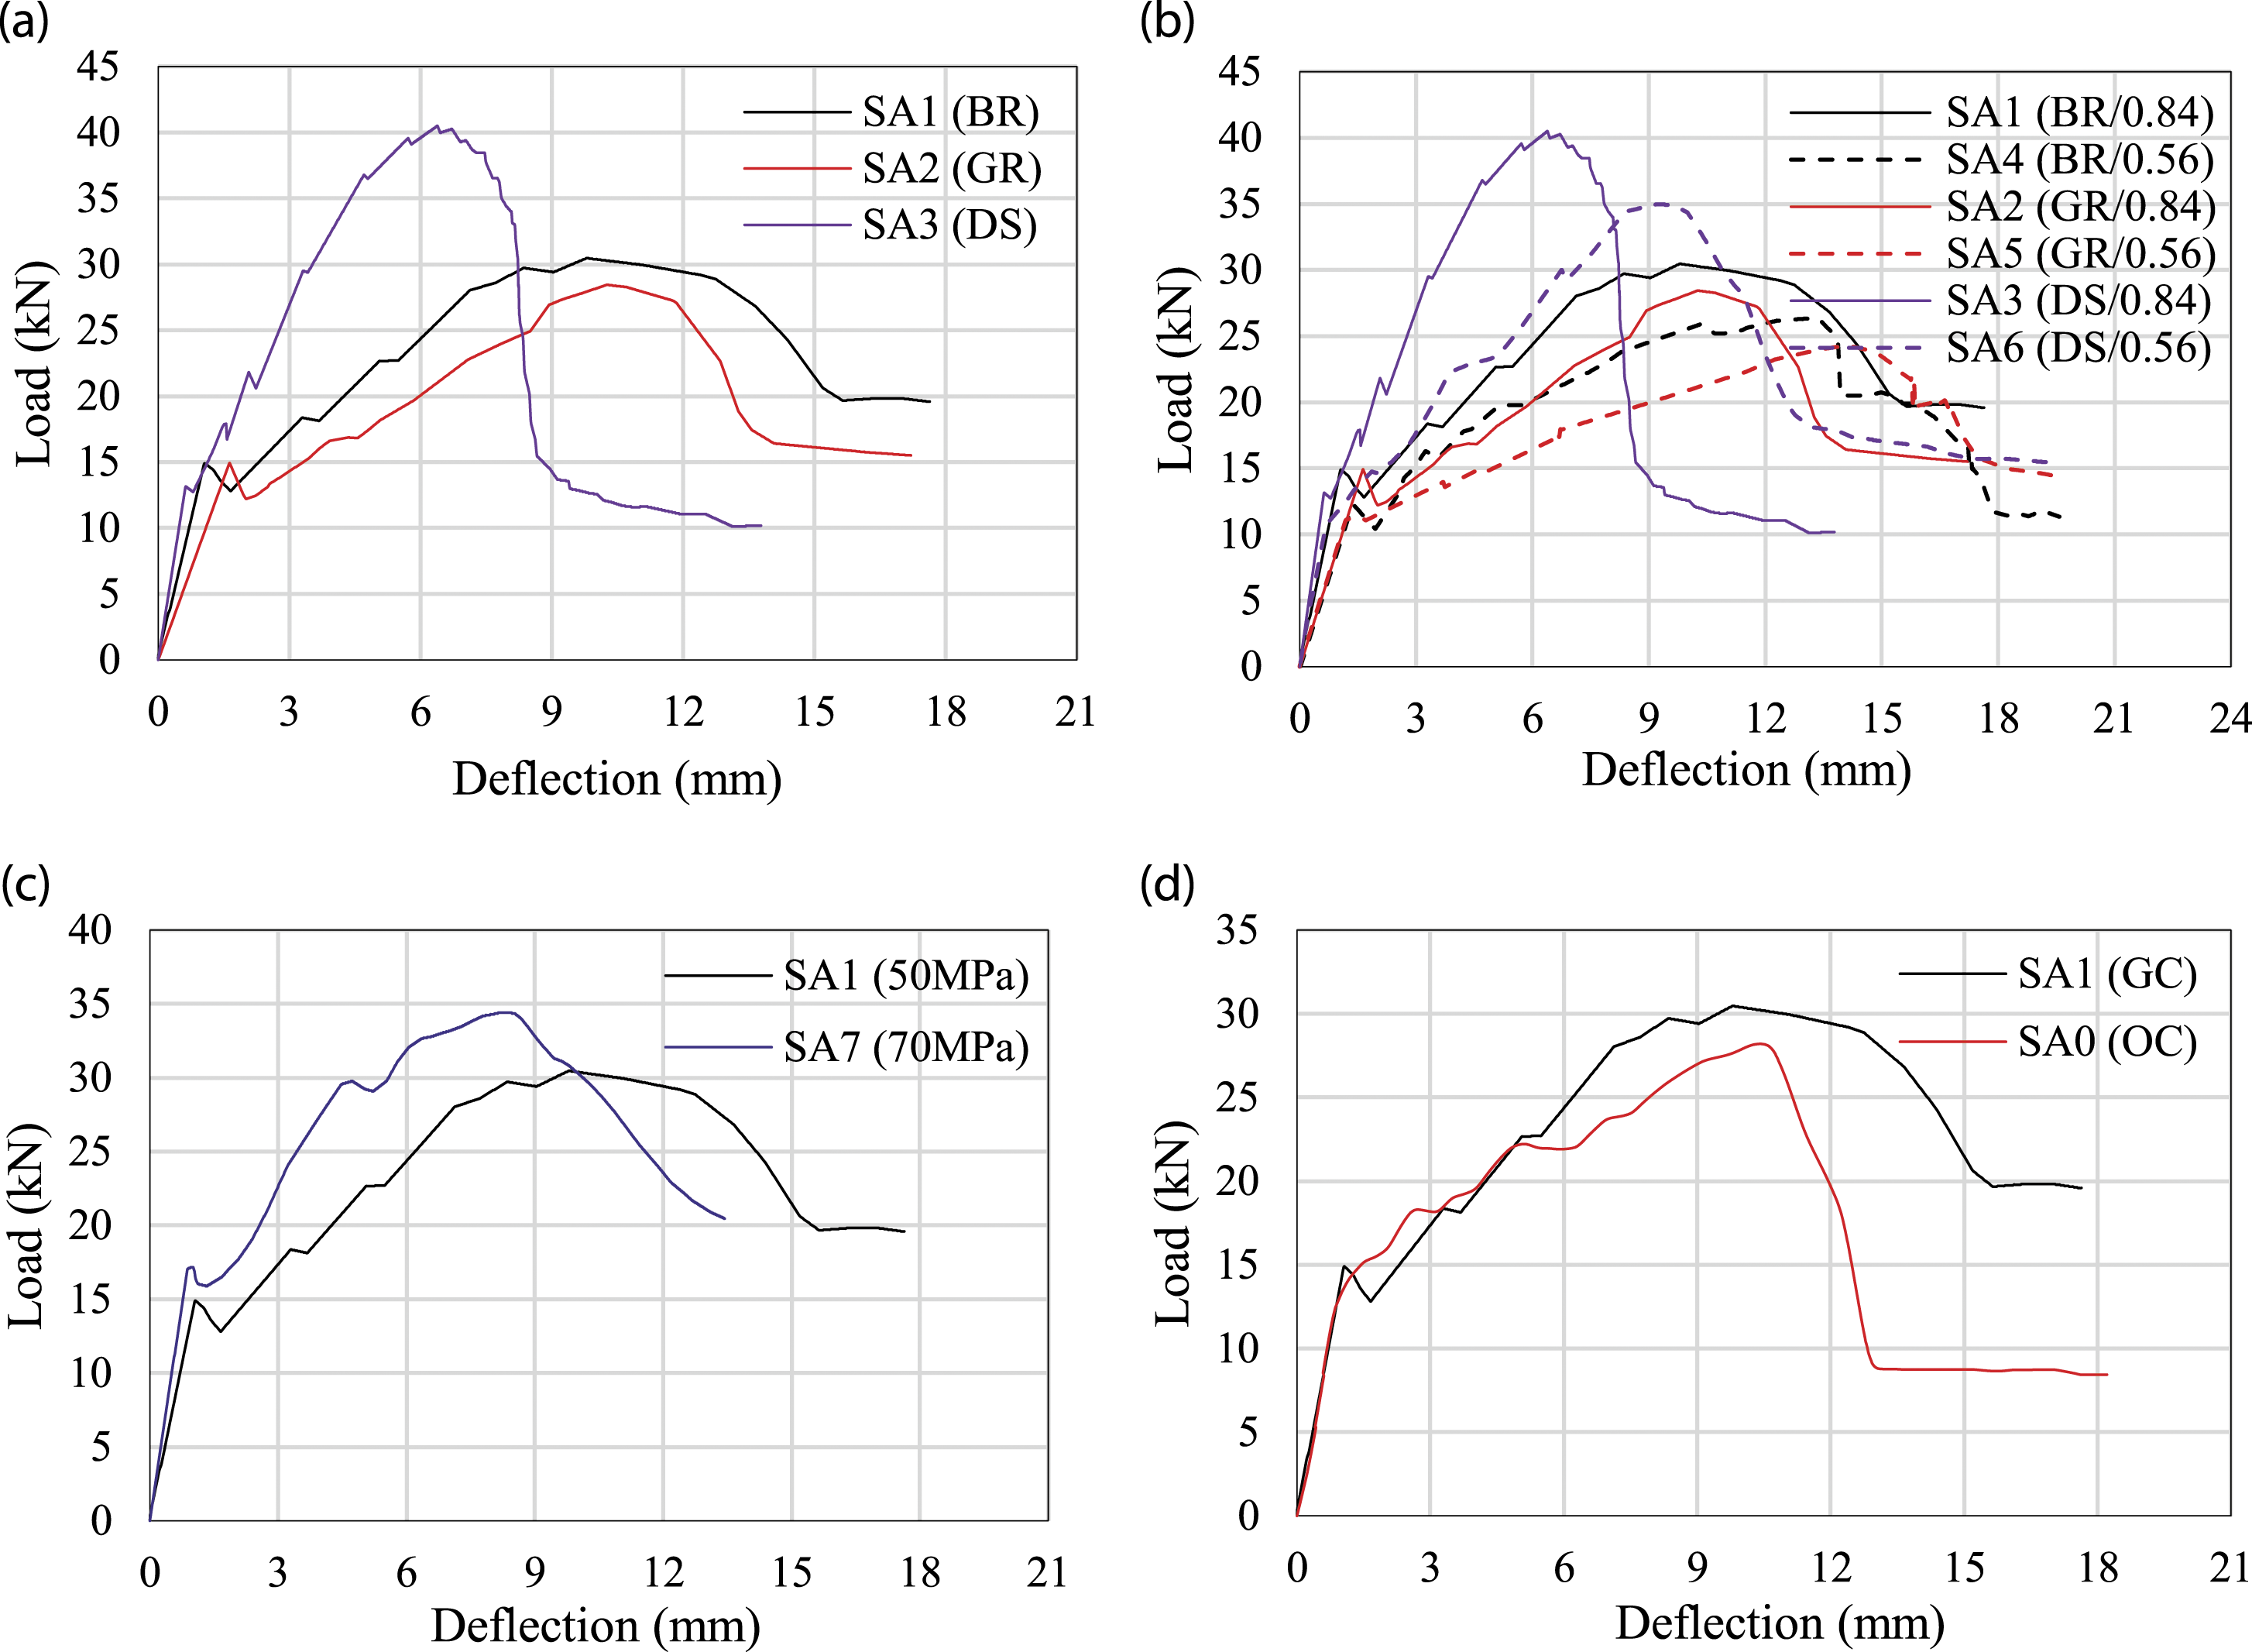
All slabs exhibited almost the same pre-cracking behaviour regardless of the reinforcement type and reinforcement ratio. This behaviour was due to the negligible effect of the reinforcements on the slab’s gross moment of inertia. The post-cracking response depended on the stiffness of the axial reinforcement, unlike in the case of pre-cracking. A greater axial reinforcement stiffness led to a greater post-cracking stiffness and smaller deflection values for the slabs, as shown in Figure 5. For similar reinforcement ratios, the SA1 and SA2 specimens reinforced by BFRP and GFRP bars possessed axial reinforcement stiffness values of approximately 420 and 353 MPa, respectively, exhibited smaller post-cracking stiffness and higher deflection values when compared to the SA3 specimens reinforced by steel bar, which possessed an axial reinforcement stiffness value of approximately 1646 MPa at similar load levels, as shown in Table 4. The ultimate deflections of SA1 and SA2 increased by 55% and 61%, respectively, when compared to the deflection of SA3, while the post-cracking stiffness of SA1 and SA2 decreased by 55% and 60%, respectively, compared to the post-cracking stiffness of SA3. This is a result of the lower elasticity moduli of the FRP bars compared to that of the steel bars. However, this led to a decrease in the effective moments of inertia of the slabs. In addition, because of the similar material features of GFRP and BFRP bars, such as the modulus of elasticity and surface treatment, the structural response of the SA1 slab was similar to that of SA2, as shown in Figure 5(a) and Table 4.
As presented in Figure 5(b) and Table 4, reducing the ratio of reinforcement from 0.84% to 0.56% led to an increase in the ultimate deflections by approximately 34, 37, and 48% for the specimens coded by SA4, SA5 and SA6, respectively, owing to the reduction in the axial reinforcement stiffness by approximately 33%; as a result, there was a reduction in both the aggregate interlock and compression zone of the concrete (uncracked concrete). Therefore, the specimens containing lower reinforcement ratios had a wider and greater number of cracks, leading to greater deformation before punching shear failure. Moreover, reducing the reinforcement ratio resulted in a smaller post-cracking stiffness by approximately 37%, 46% and 43% for SA4, SA5 and SA6, respectively, as a result of the smaller axial reinforcement stiffness.
Moreover, the ultimate deflection of the SA7 specimen was 17% lower than that of SA1, as shown in Table 4. However, the post-cracking stiffness depended largely on the reinforcement type and ratio (axial reinforcement stiffness) rather than the concrete strength. The stiffness of the SA7 slabs was 8% higher than that of the SA1 specimens. This result indicates that the higher compressive strength resulted in an increase in the slab stiffness, leading to smaller deflections before failure for the GC slabs reinforced by the BFRP bar, as shown in Figure 5(c).
The effect of the concrete type on the load-deflection relationship was not significant, Moreover, it can be observed that the GC slab reinforced by the BFRP bar, which was coded by SA1, possessed a 5% lower deflection than that of the OC slab (SA0). However, the post-cracking stiffness of the GC slabs was higher than that of the OC specimens by approximately 35%, as shown in Figure 5(d) and Table 4. This may be associated with the difference in bond features between these concrete types (Mousavi et al., 2016), because GC strengthened by FRP bars exhibits a greater bond performance than OC, as illustrated in a previous study performed by Maranan et al. (2015).
Punching Shear Strength under Static loading
The punching shear capacities of the various tested slabs are given in Table 4, and the highest punching shear capacity was observed for the SA3 slab (40.56 kN), because it possessed the highest axial reinforcement stiffness, the punching capacities of SA1 (BFRP bars reinforced slabs) and SA2 (GFRP bars reinforced slabs) were approximately 25% and 30% lower than those of the SA3 slab reinforced with steel bars. This was related to the lower modulus of elasticity (axial reinforcement stiffness) of the BFRP and GFRP reinforcing bars compared to that of steel (Ef/Es = 0.2-0.25 approximately). The use of a BFRP and GFRP reinforcement ratio similar to the steel reinforcement ratio produced smaller neutral-axis depth and higher strains, which in turn caused a reduction in the compression zone, leading to deeper and wider cracks at the same load level. Therefore, both the contributions of the uncracked concrete zone (compression side) and the aggregate interlock reduced, which in turn produced a lower punching-shear capacity (Dulude et al., 2013; Hassan et al., 2013a, 2013b). Moreover, because the axial reinforcement stiffness of SA1 was similar to that of SA2 and even has the same concrete strength, the punching shear capacities were almost similar, where the capacities of SA1 and SA2 were 30.47 kN and 28.44 kN, respectively, as presented in Table 4.
The results also showed that reducing the reinforcement ratio from 0.84% (SA1, SA2 and SA3) to approximately 0.56% (SA4, SA5 and SA6) reduced the punching shear capacity by approximately 13%, 11% and 14%, respectively. Increasing the reinforcement ratio controlled the crack width, developed aggregate interlock, and increased the compression zone of the concrete.
Compared with the ultimate capacity of the OC slab (SA0), the GC test specimens (SA1) possessed a higher capacity of 8%. This may explain why GC was more efficient in terms of the bond behaviour, the aggregate interlock and control of the crack width relative to OC. Therefore, the height of the compression zone can be increased by the application of GC. Increasing the concrete’s compressive strength from approximately 50 MPa to approximately 70 MPa led to a 13.5% increase in the punching shear capacity. Therefore, it can be concluded that an increase in the concrete’s compressive strength results in an increase in the punching shear strength at failure.
Treatment of Available Punching Shear Capacity Equations for GC slabs
The equations of the punching shear strength for the concrete slabs strengthened with FRP are forms of the original equations for steel, which are modified to account for the mechanical property differences in steel as well as FRP reinforcement, particularly the lower modulus of elasticity. In this section, the equations which have been proposed for the punching shear capacity of OC slabs, including FRP reinforcements, were also treated for the capacity of GC slabs reinforced by FRP slabs. Table 5 summarises the existing equations of punching shear capacity of two-way slabs given by several codes and researchers.
Comparisons of the predicted punching shear capacity from literatures with the experimental results of FRP reinforced slabs.
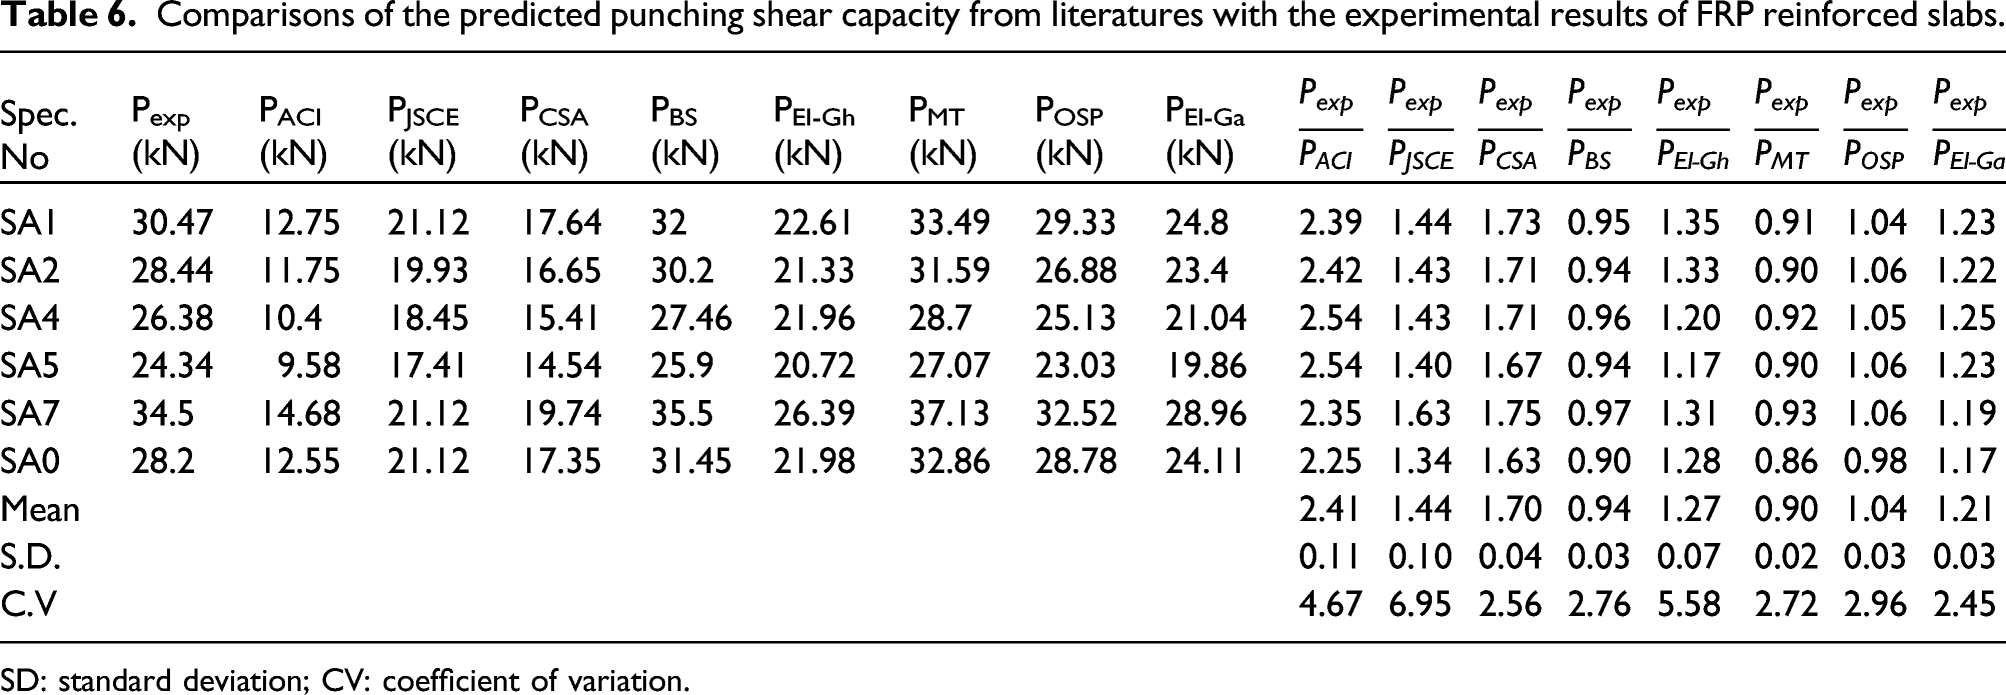
SD: standard deviation; CV: coefficient of variation.
Pexp/Ppred of 2.41 ± 0.11, with a 4.67% corresponding coefficient of variation. The ACI 440.IR-15 equation is known to produce very conservative predictions because it uses the ratio of FRP reinforcement to determine the neutral-axis’ depth. Moreover, the punching shear strength was determined from the compression area of the cross section. However, the contribution of the compression area depends on the axial reinforcement stiffness. Therefore, the absence of the reinforcement’s axial stiffness from the equation of the punching shear may be the reason for the high level of conservation. The other remaining equations possess the effect of axial stiffness, which include
In addition, El-Ghandour et al. (1999) produced a 1.27 ± .07 average Pexp/Ppred containing a 5.58% CV. However, the ratio of reinforcement omitted here equation (8) and El-Gamal et al. (2005) indicated predictions that were conservative and reasonable possessing a 1.21 ± .3 and 2.45% corresponding CV.
The direct implementation of the FRP axial stiffness into the BS 8110 (1997) punching shear equations by substituting
The equation proposed by Matthys and Taerwe (2000) was refined by Ospina et al. (2003) through the use of the modular ratio’s square root in place of the cube root to produce good results. Moreover, the equations also produced good results on average, with Pexp/Ppred values of .9 ± .02 and 1.04 ± .03, corresponding to CV values of 2.72% and 2.96%, respectively.
It is important to note that the Pexp/Ppred values of the equations producing more conservative results for GC slabs than for OC slabs. These outcomes can be explained by the better bond performance between GC and FRP bar when compared to OC, as illustrated in a previous study performed by Maranan et al. (2015).
Load Deflection Relationship under Cyclic Loading
From the load-deflection relationships shown in Figure 6, it was also noticed that the deflection corresponding to the peak load obtained from cyclic loading was slightly higher than that obtained from static loading. The maximum deflection values and number of loading cycles are listed in Table 4. As expected, an increase in the load cycle number reduced the stiffness of the slabs and increased the residual deflections, as can be seen in Figure 6. Moreover, it was noticed that the effects of various parameters on slab specimens with respect to cyclic loading were almost the same with respect to monotonic loading. Load-deflection curve for different slab specimens subjected to static and repeated loading. More effective for specimens tested under monotonic loading than cyclic loading.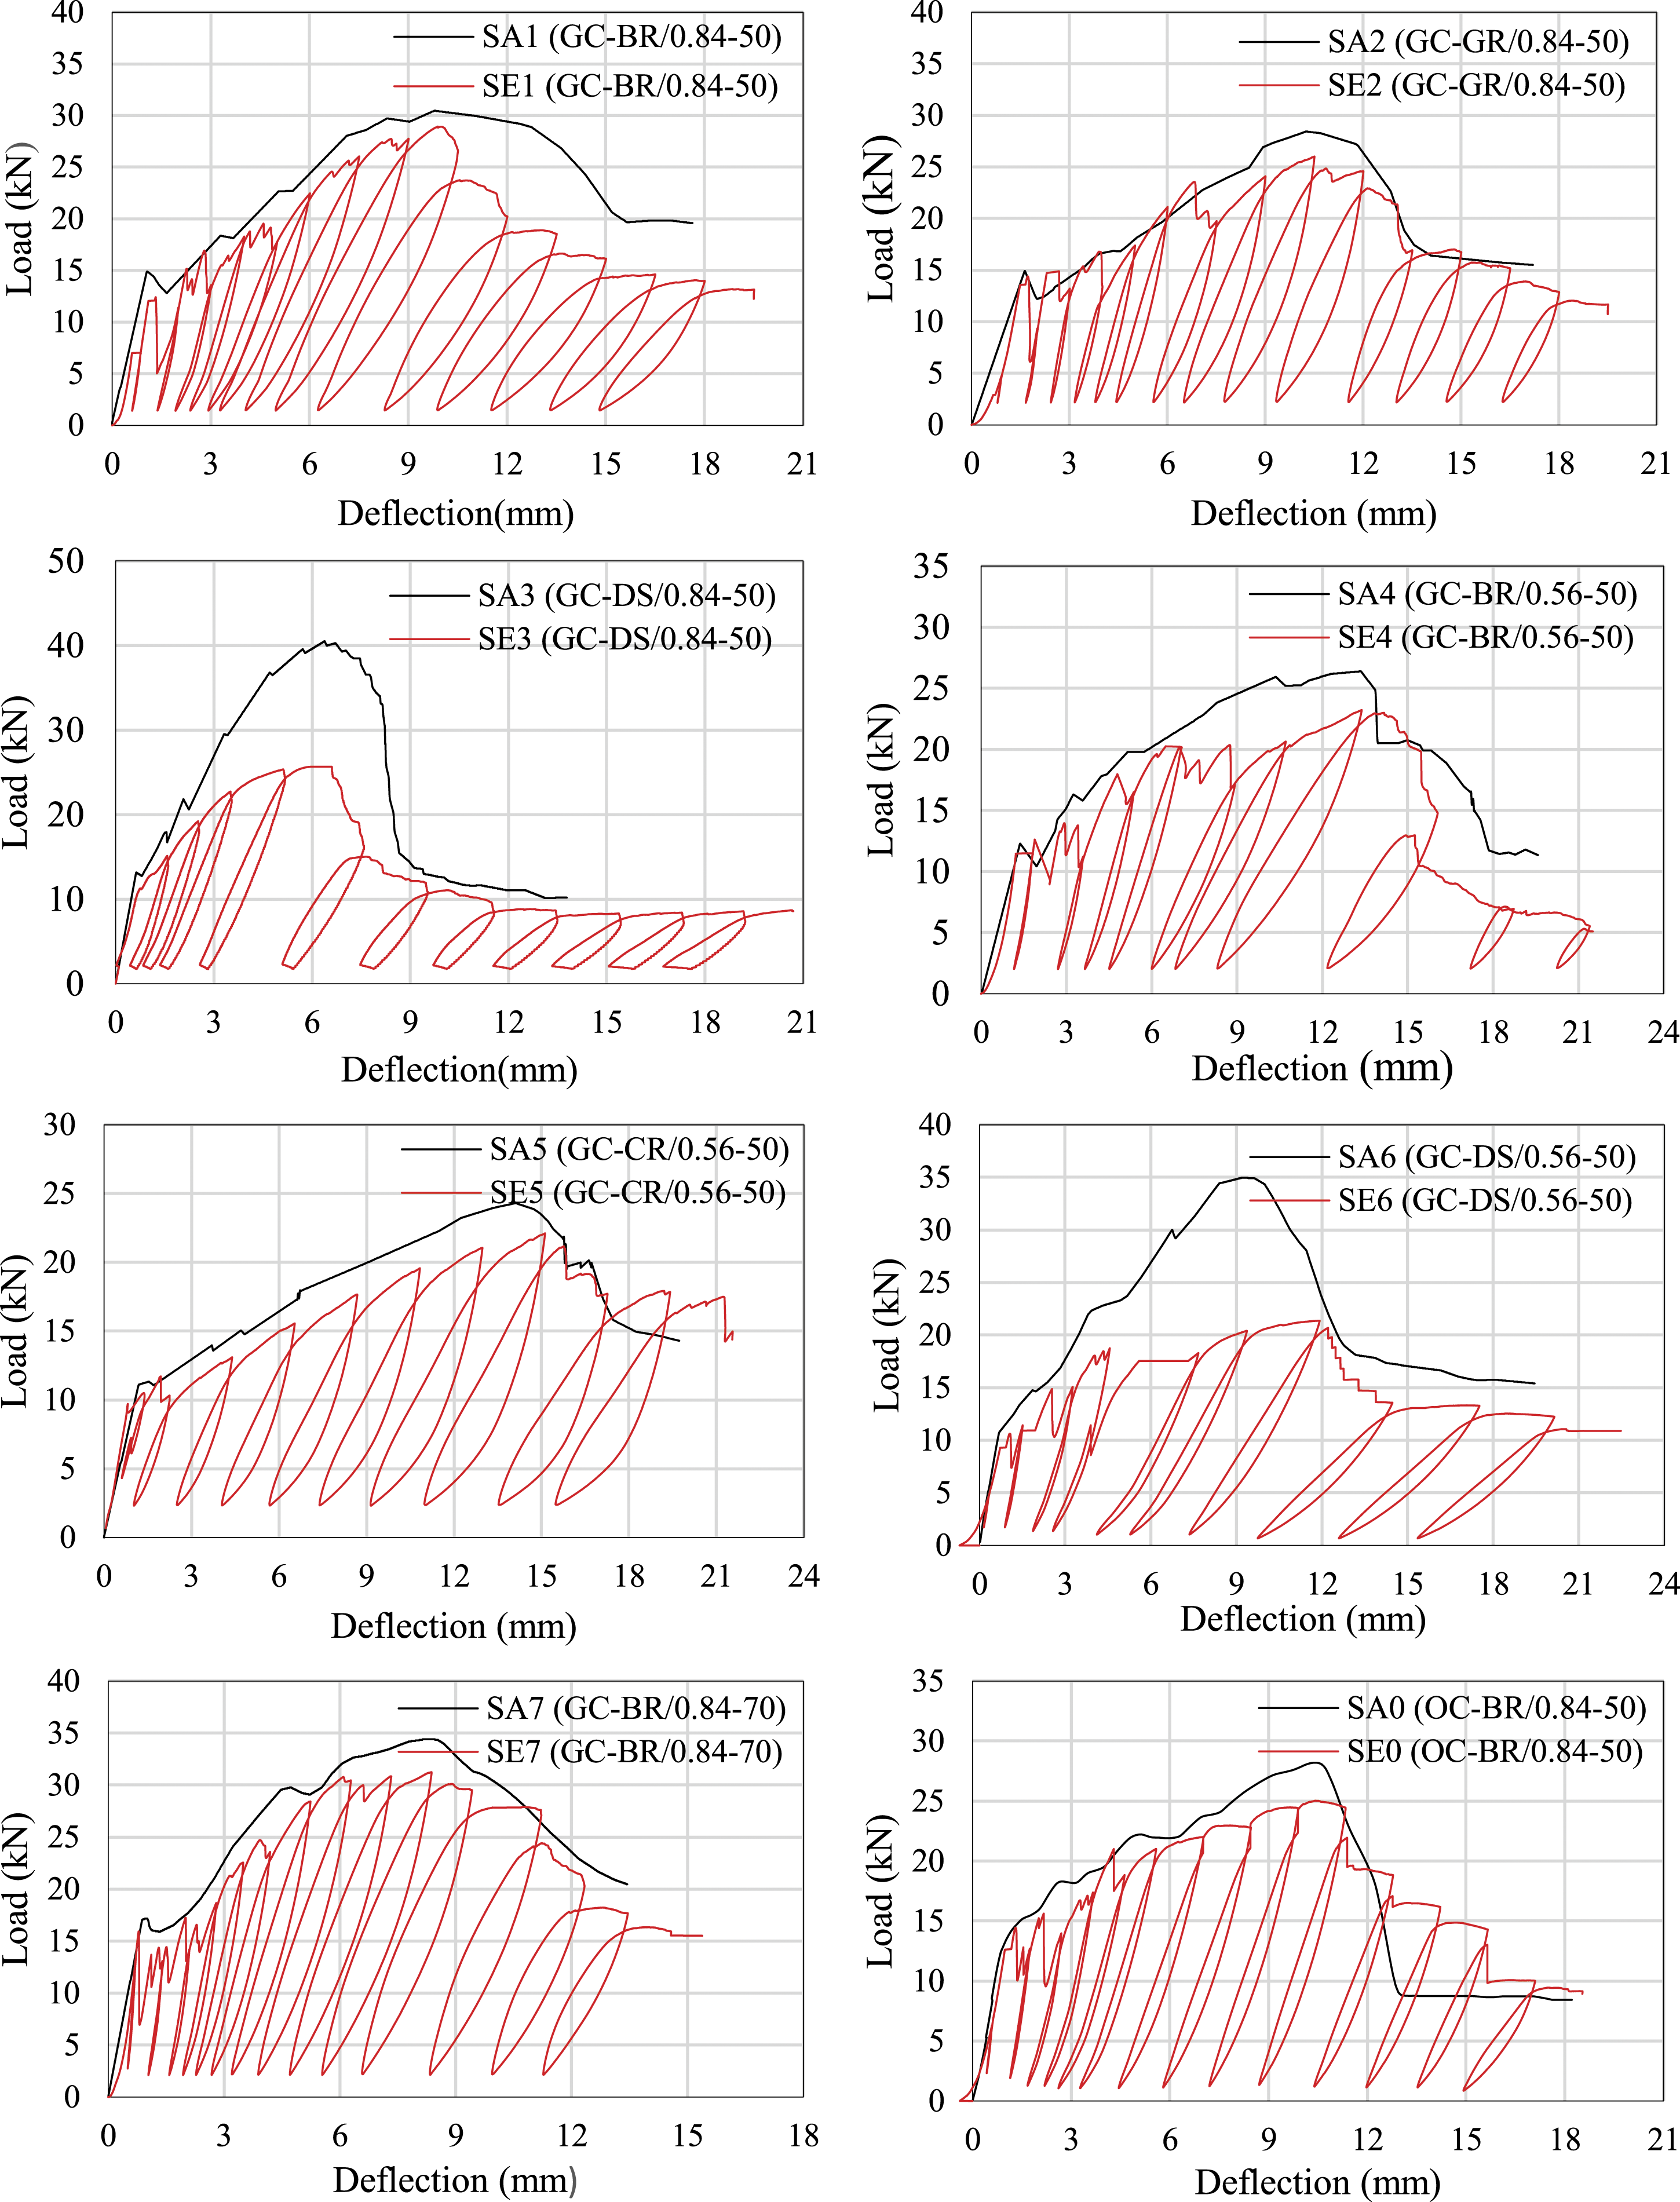
In addition, it can be observed that despite the almost identical reinforcement ratios, the slabs reinforced by FRP bars exhibited greater deflection values when compared to the specimens reinforced by steel bars at a similar load level. For example, SE1 and SE2, which were strengthened by BFRP and GFRP bars, possessed a greater deflection and lower stiffness when compared to SE3, which was strengthened by steel bars. As indicated in Table 4, the ultimate deflections of the SE1 and SE2 specimens exceeded the deflection of the SE3 specimen by approximately 49% and 60%, respectively. Further, the slabs reinforced by the BFRP bar had higher stiffness and lower residual deflection values than those reinforced by GFRP slabs. Moreover, the obtained results also indicated that cyclic loading caused an increase in the ultimate deflections for SE1, SE2 and SE3 by approximately 0.4%, 2.33% and 2.5% compared with specimens SA1, SA2 and SA3, respectively, under monotonic loading, as presented in Figure 6 and Table 4.
Moreover, it can be noticed that the reduction in the reinforcement ratio from 0.84 in the SE1, SE2 and SE3 specimens to approximately 0.56% in the SE4, SE5 and SE6 specimens increased residual deflection by 35%, 43% and 80%, respectively, as presented in Table 4. Although the increasing rates were smaller for the specimens tested under static loading, the increasing deflections of SA4, SA5 and SA6 specimens were 33, 37 and 48, respectively, compared with SA1, SA2 and SA3. This implies that GC slabs with a smaller ratio of reinforcement possessed greater deflection, and were more influenced under cyclic loading, as shown in Figure 6 and Table 4.
In addition, an increase in the compressive strength of the GC from approximately 50 MPa (SE1 specimen) to approximately 70 MPa (SE7 specimen) led to a decrease in the maximum deflection by 15%. However, this reduction for specimens tested under monotonic loading was higher, and the decreased rate of the SA7 specimen with a compressive strength of 70 MPa was 16.2% compared with SA1 with a compressive strength of 50 MPa, as shown in Figure 6 and Table 4 this outcome showed that the compressive strength was more effective for specimens tested under monotonic loading than cyclic loading.
From the load-deflection curves and Table 4, it was also observed that the ultimate deflections (SE0) of the OC slab specimens were 6% higher than those of the GC slab (SE1) tested under cyclic loading. However, the GC slabs possessed a higher stiffness compared to that of the OC specimens. However, the increasing deflection rate was smaller for the SA0 specimen tested under static loading, and the ultimate deflection of the OC specimen SA0 increased by approximately 4.8%, compared with the GC specimen SA1 tested under monotonic loading. This means that OC slabs have more deflection, and are thus more sensitive to cyclic loading.
It is essential to state that the reinforcement ratio, concrete and bar type and the concrete’s compressive strength affect the number of cycles needed to cause failure or fatigue performance. Slabs reinforced with GFRP and BFRP exhibited better fatigue performance than slabs reinforced with steel bars under cyclic loading, and from Table 4, it was observed that specimens SE2 and SE1 reached the ultimate load at nine cycles. This number exceeded the required number of cycles for specimen SE3 to fail, which was five cycles, and as a result, the fatigue performance of SE1 and SE2 slabs was 1.8 times better than that of SE3, and this result was attributed to the closer elasticity modulus values for the GC, GFRP and BFRP reinforcements. Although it was subjected to a similar cyclic loading scheme, the slab strengthened by the steel bar, SE3, exhibited more damage as shown in Figure 4. This was mostly due to the substantial difference in elastic modulus between concrete and steel, and was even due to the mechanical bond performance that increased damage to the concrete during cyclic loading. Since the ribs of steel bar are stiffer and stronger as compared to ones of BFRP and GFRP (as shown in Figure 1(a)), the concrete around the steel bars could be further damaged leading to more damage during the cyclic loading process. This result was also observed in the study implemented by El-Ragaby et al. (2007).
Furthermore, it can be concluded from Table 4 that the capability of the slabs to withstand cycles was reduced by approximately 22%, 22% and 16% when the reinforcement ratio was reduced from 0.84% (SE1, SE2 and SE3) to approximately 0.56% (SE4, SE5 and SE6) for BFRP, GFRP and steel bars, respectively. Moreover, the number of cycles in specimen SE7 increased by approximately 22% upon increasing the compressive strength of the GC slab from approximately 50 MPa–70 MPa. Furthermore, the performance of the SE1 slab was slightly better than that of SE0.
Punching Shear Strength under Cyclic Loading
According to the test results obtained, the efficiency of the different parameters on the punching shear capacity under cyclic loading was observed to be almost similar to that obtained under monotonic loading. The results in Table 4 reveal that the GC slabs reinforced by BFRP and GFRP bars possessed higher ultimate punching shear loads of approximately 13% and 2%, respectively, compared to the slabs reinforced by steel bars with similar reinforcement ratios. Therefore, it can be concluded that slabs reinforced by FRP bars had a better load-carrying capacity than slabs reinforced by steel bars under cyclic loading. In addition, the obtained outcomes show a very small loss in the ultimate loads of SE1 and SE2 under cyclic loading compared with the ultimate load capacity of specimens SA1 and SA2 tested under monotonic loading. However, the highest reduction was observed in the SE3 specimen, which was reinforced by steel bar, with a reduction of 37%. Meanwhile, in the case of SE1 and SE2, the ultimate loads reduced by about 5.1% and 8.5%, respectively. This may be attributed to a higher rate of stiffness deterioration due to cycle loading when compared to monotonic loading
Moreover, the results indicated that with a similar type of reinforcement, the punching shear capacity increased with an increase in the reinforcement ratio. Enhancing the reinforcement ratio from 0.56% in SE4, SE5 and SE6 to approximately 0.84% in SE1, SE2 and SE3 for BFRP, GFRP and steel bars increased the punching shear loads by approximately 25%, 18% and 19%, respectively. The increasing rates were smaller for specimens tested under monotonic loading, and the increasing rates of SA1, SA2 and SA3 were 15.5%, 16.8% and 16%, respectively, compared with SA4, SA5 and SA5, as shown in Figure 6 and Table 4. This indicated that the reinforcement ratio was more active for the punching shear capacity in the specimens tested under cyclic loading. An increase in the reinforcement ratio led to an increase in the uncracked depth of concrete, which significantly contributed to the concrete. Moreover, it resulted in smaller crack widths at a similar load level, which in turn promoted the aggregate interlock. As a result, the capacity of the punching shear increased developed with an increase in the reinforcement ratio.
The compressive strength also affects the punching shear capacity. It was found that increasing the compressive strength of the GC slab from 50 MPa for specimen SE1 to approximately 70 MPa for specimen SE7 tested under cyclic loading resulted in an increase in the ultimate repeated capacity by approximately 9%, as illustrated in Table 4. Although the increase rate was higher for the specimen tested under monotonic loading, the increased rate of the SA7 specimen possessing 70 MPa was 13.2% compared with SA1 obtained for a compressive strength of 50 MPa, this result proved that for punching shear capacity, the compressive strength was
A comparison of the punching shear behaviour of GC and OC with similar parameters subjected to cyclic loading showed that the BFRP-reinforced GC specimen (SE1) had a greater punching shear capacity compared to the OC slab specimen (SE0), as shown in Figure 6 and Table 4, it can be noted that the peak load of GC under cyclic loading possessed a 15.5% higher ultimate load compared to that possessed by OC under the same cyclic loading. Although the rate of increase was smaller for the specimens tested under monotonic loading, the capacity of the ultimate load of the geopolymer specimens SA1 increased by approximately 8% compared with SA0 tested under monotonic loading. It can be observed that the GC slabs exhibited better punching performance than OC under both types of loading; however, its efficiency was better under cyclic loading. The results are related to the lower deterioration of GC and has an even less effect on mechanical properties under both types of loading; moreover, the GC possessed greater bearing forces, friction and chemical adhesion than ordinary cement concrete. Maranan et al. (2015) and Tekle et al. (2016) also observed a better bond performance of GC compared to OC. The results confirmed that the punching-shear capacity could be proportional to the good bond performance between the bar and concrete, the better bond performance, the higher the punching-shear capacity. This is because good bond controls crack width and depth, enhances aggregate interlock and increases the concrete compression zone (uncracked concrete) which, in turn, produced higher punching-shear capacity. The increase in the bond strength of GC was due to a complex interfacial transition zone (ITZ) between the aggregate, bar and concrete. Furthermore, it was reported that sodium silicate usage leads to a dense ITZ with no difference in the microstructure compared with the geopolymer matrix (Sarker, 2011). However, the ITZ was filled with crystalline phases comprising ettringite and portlandite with higher porosity in OC (Duxson et al., 2007a).
It is interesting to note that there is some compatibility between the static and cyclic load-deflection relationships of the slabs reinforced by the BFRP and GFRP bars. When the highest point of each cycle is connected, a load-deflection relationship similar to the corresponding static relationship is obtained, as shown in Figure 6. However, this situation does not exist for slabs reinforced by steel bars. This result is related to the degree of degradation of stiffness for the slabs reinforced by steel bars under cyclic loading compared to monotonic loading. Since the slabs reinforced by steel bars were exhibited more damage under cyclic loading due to the ribs (as explained in Load Deflection Relationship under Cyclic Loading), The stiffness of these slabs decreased significantly and the deterioration level increased. Therefore, the punching capacity obtained from cyclic loading cannot reach the capacity obtained from monotonic loading. However, the deflection corresponding to the ultimate load was very close for both types of loading. Furthermore, it was observed that the failure pattern in both cases was punching shear failure, as explained in the previous sections.
Ductility and Punching Shear Angle Evaluation
Punching Shear Angle
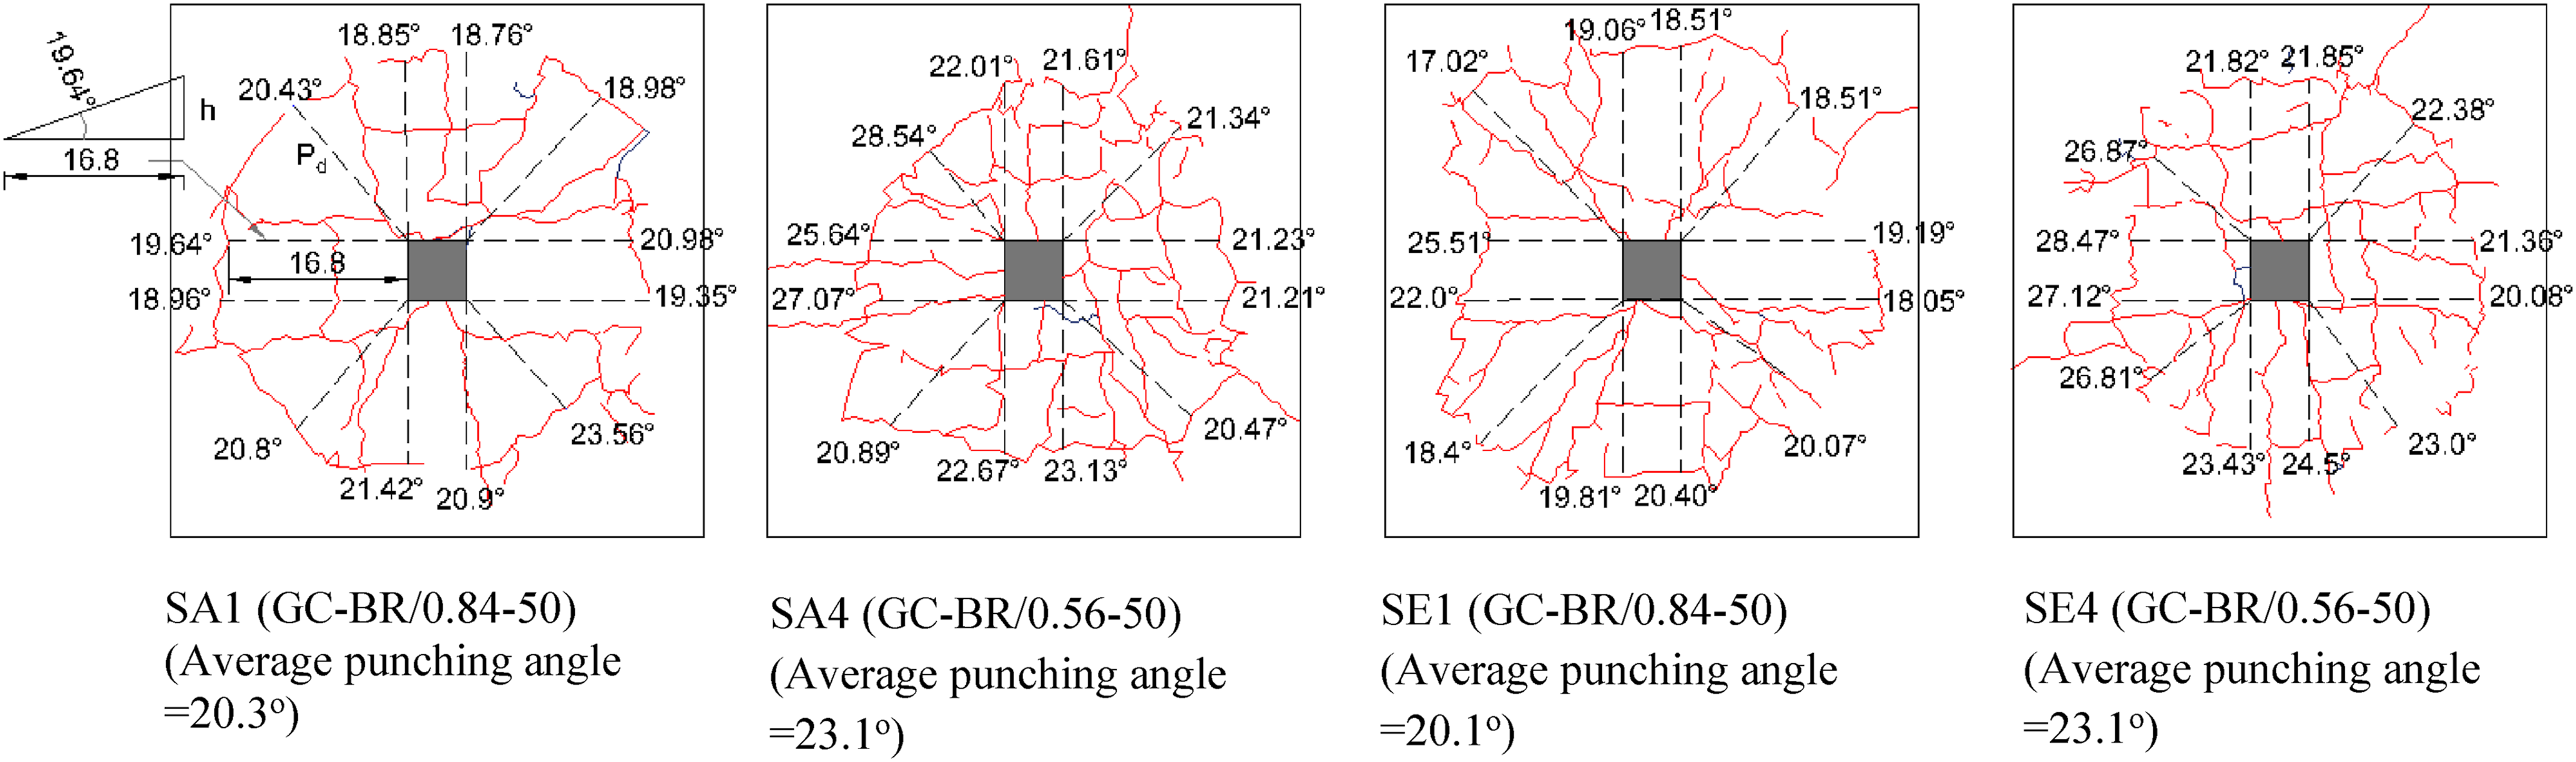
The punching shear angle was determined using the relation between the depth of the slab and the projective distance from the stub face to the perimeter of the punching shear, as shown in equation (11) Measured punching angle for some tested slabs.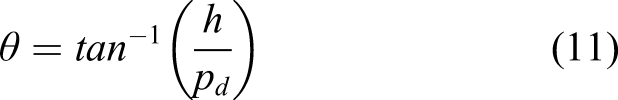
Ductility Index
The ductility of a member can be defined as the ability to maintain inelastic deformation with no significant loss in the load-carrying capacity before failure. With this definition, the ductility can be given in terms of the energy absorption or deformation. In the case of members strengthened with steel, where there is obvious plastic steel deformation at yield, the ductility is determined as the ratio of the ultimate deformation to the deformation at yield. But there is no yield point for the FRP-strengthened members. Therefore, this simple definition cannot be used directly for concrete structures strengthened with FRP reinforcements. Over the past few decades, there has much effort to assess the ductility of FRP-strengthened members. The energy-based approach has been broadly applied to these various approaches.
In the energy-based approach, the ductility can be described as the capacity to absorb energy. Therefore, ductility is expressed as the ratio of the total energy to the elastic energy. The equation (12) was proposed by Naaman and Jeong (1995) is used to compute the ductility index New definition of ductility index (Naaman and Jeong, 1995).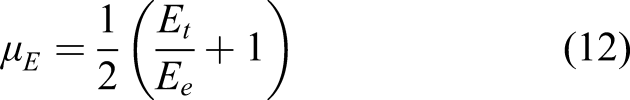
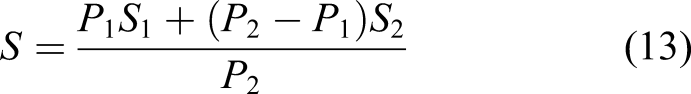
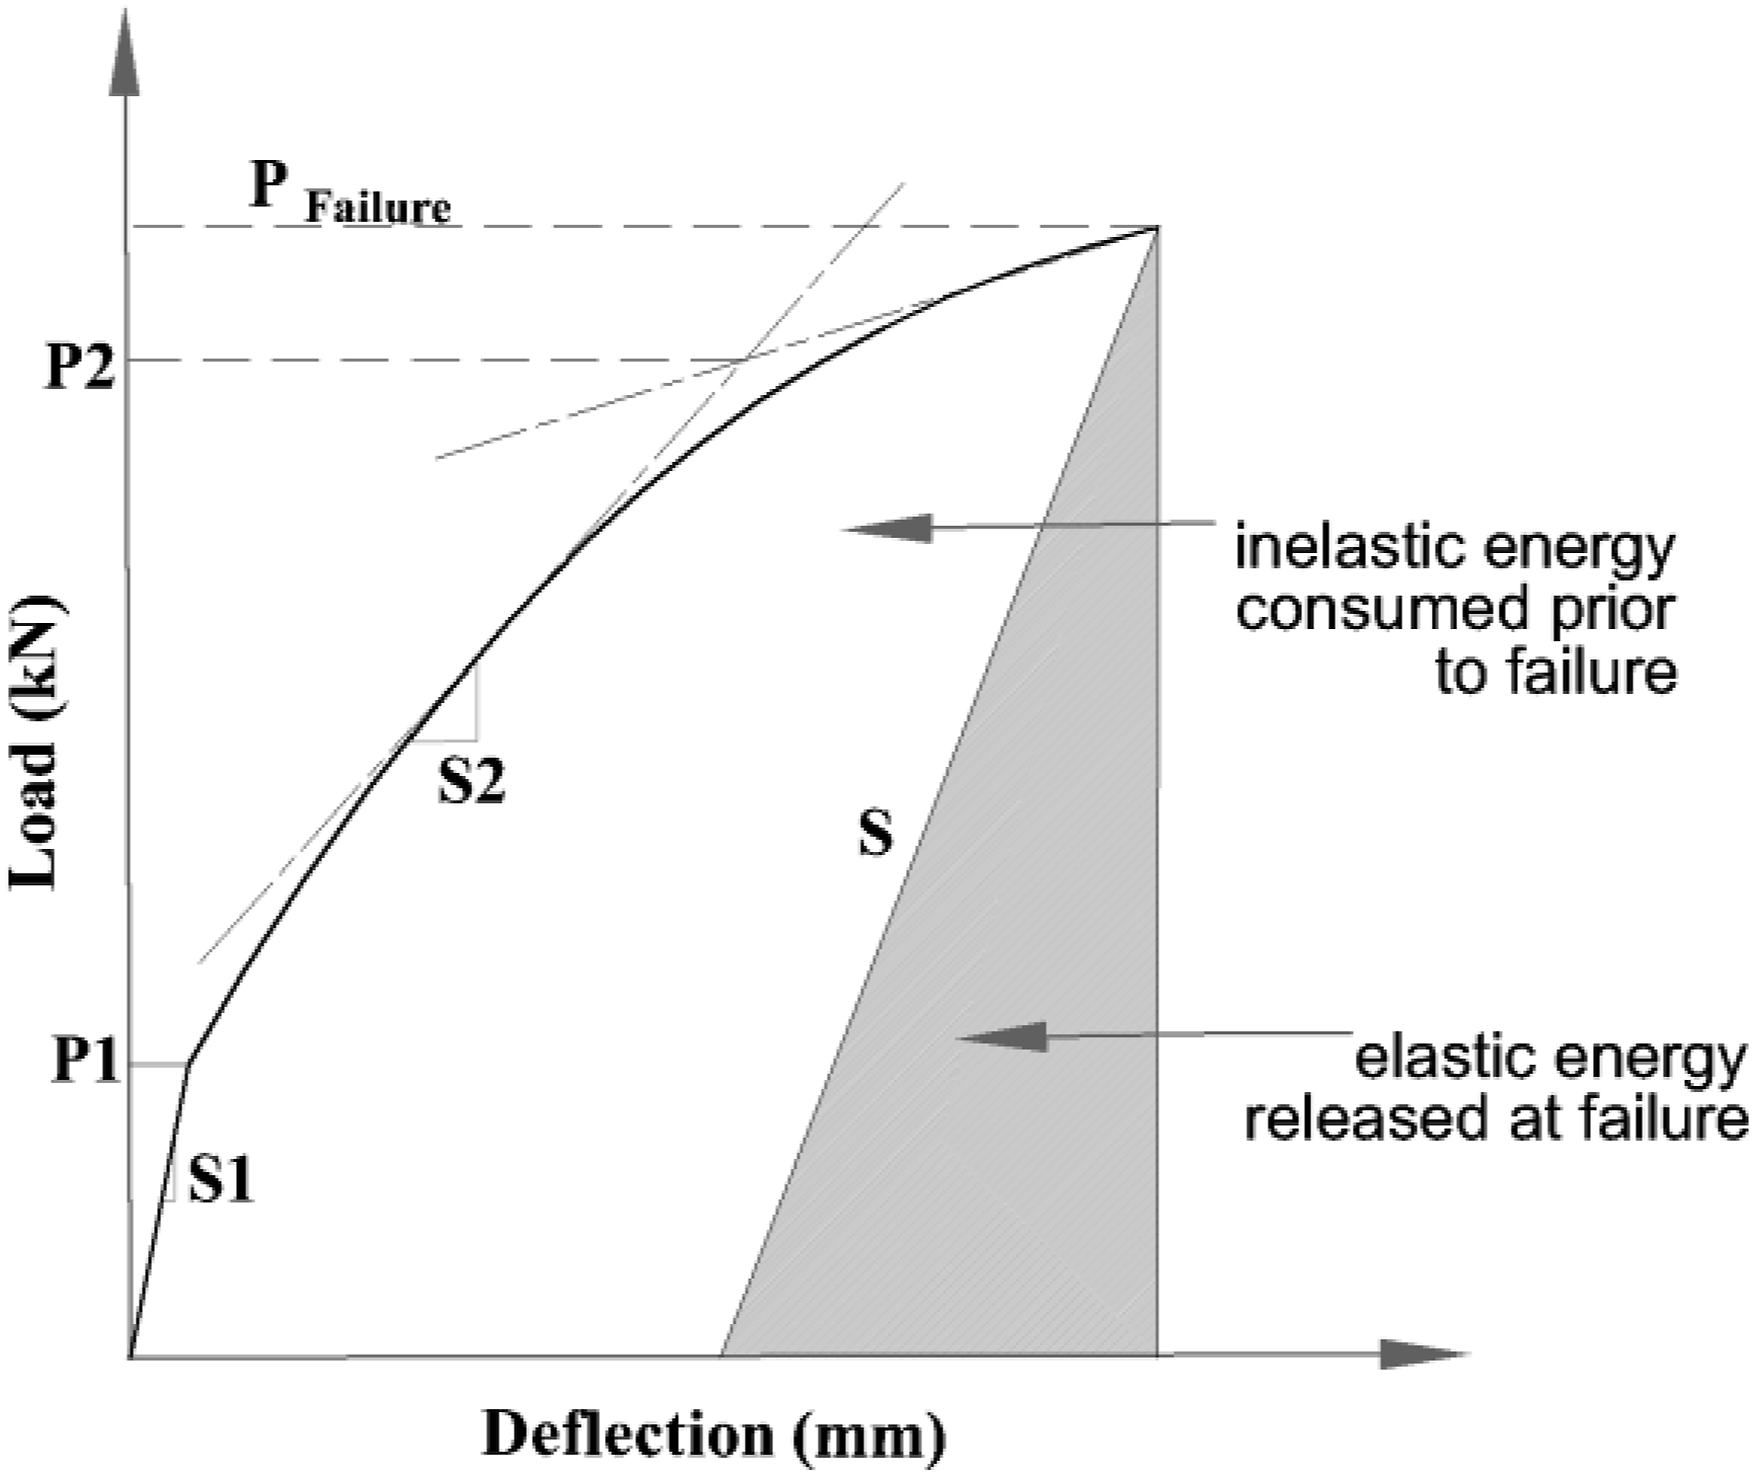
P1 and P2 refers to the cracking load and the yielding load, respectively. However, S refers to the slope of the unloading branch, where S1 is the initial line slope and S2 is the second line slope. The elastic energy was determined as follows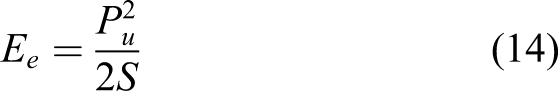
Ductility index for FRP bars reinforced geopolymer concrete slabs.
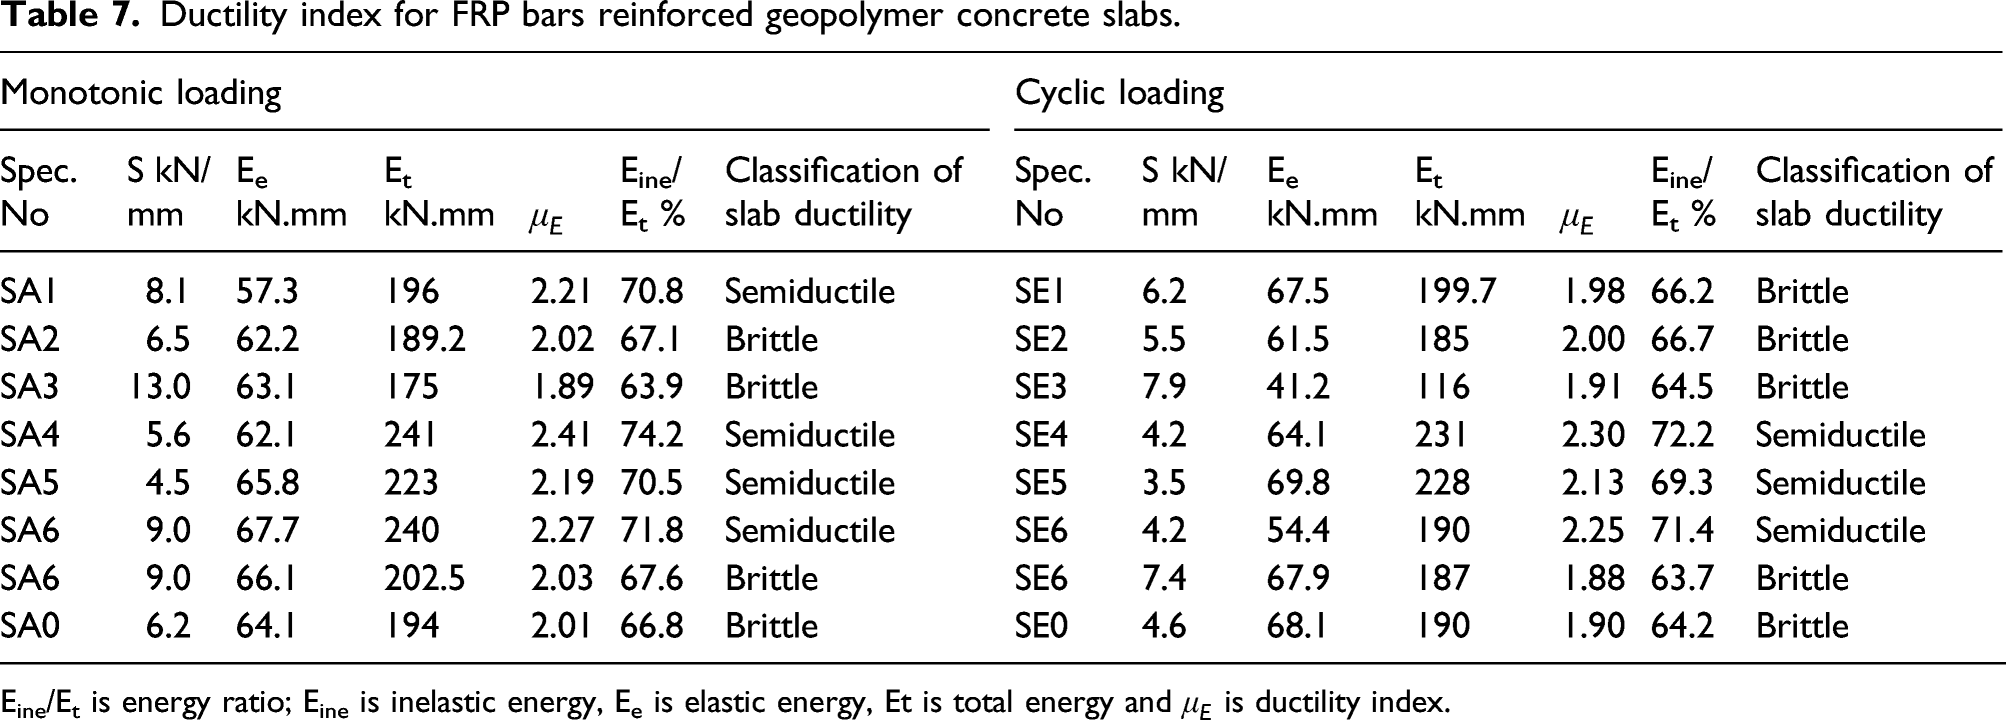
Eine/Et is energy ratio; Eine is inelastic energy, Ee is elastic energy, Et is total energy and
The energy ratio, which is expressed as the ratio of the inelastic energy to the total energy, is proposed as a suitable measure to classify members based on ductility, as explained by Grace et al. (1998). However, if the energy ratio is more than 75%, the member will exhibit ductile failure. On the other hand, if the ratio of energy lies between 70% and 75%, it is considered to be semiductile. If the ratio of energy is lower than 69%, the member may exhibit brittle failure. The tested slabs were classified according to their energy ratio. However, a minimum ductility index value of 4 is required to have a ductile failure mode according to the Canadian Highways Bridge Design Code (CSA S6, 2014). Based on this, as shown in Table 7, all FRP reinforced slabs had ductility indices below 4, indicating nonductile failure mode.
Ductility Index and Punching Shear Angle
As shown in Table 7, for the same reinforcement ratio, the highest ductility index was observed in the SA1 specimen which was reinforced by the BFRP bar, and it was higher than SA2 and SA3 by about 10% and 18%, respectively. It should be noted that specimen SA3 reinforced by steel bar failed before yielding the reinforcement, and consequently possessed a low ductility index when compared with specimens reinforced by the FRP bar. However, as shown in Table 4, the average punching shear angle of those specimens was almost the same, especially for GC slabs reinforced by BFRP and GFRP. Compared to that of GC slabs reinforced by steel bar, they were slightly lower, and it can be seen that the punching shear angles of SA1 and SA2 had lower values of 2.4% and 2.8%, respectively, when compared to SA3. This indicated that the diameter of the punching cone of the GC slabs was not affected significantly by the reinforcing materials, although there was a noticeable effect of reinforcing materials on punching shear capacity; however, further study is required in this field. In addition, all of these specimens exhibited brittle failure, with the exception of SA1, which failed in the semiductile mode, as shown in Table 7, according to the classification by Grace et al. (1998).
The obtained results indicated that with the same reinforcement type, the ductility index increased with a decrease in the ratio of reinforcement. Decreasing the ratio of reinforcement in SA1, SA2 and SA3 from approximately 0.84% to approximately 0.56% in the SA4, SA5 and SA6 specimens resulted in an increase in the ductility index by approximately 10.4%, 8.4% and 20%, respectively; therefore, the failure mode changed from brittle to semiductile failure for the mentioned specimens, as shown in Table 7, and the punching shear angle increased by about 13.7%, 14.8% and 10.5%, respectively, because decreasing the flexural reinforcement ratio reduced the observed failure surface and led to a slightly flatter inclination of the critical shear crack. This in turn increased the angle of the punching-shear cone. The same behaviour was observed for the specimens subjected to cyclic loading, as shown in Table 4.
A comparison of the ductility index of GC and OC specimens with similar parameters subjected to monotonic or cyclic loading showed that the GC specimens SA1 and SE1 had slightly greater ductility compared to the OC specimens SA0 and SE0, as shown in Table 7. It can be noted that the ductility index of OC when tested under monotonic and cyclic loading were 9% and 4% lower compared to that possessed by GC under the same loading. Furthermore, both GC and OC specimens (SE1 and SE0) with similar parameters exhibited brittle failure under cyclic loading, whereas under monotonic loading, the GC specimen SA1 failed in the semiductile mode, and the OC specimen SA0 failed in the brittle mode, as shown in Table 7. Moreover, the punching angles of the OC and GC slabs were almost the same, the punching shear angle of SA0 and SE0 was 2.0% and 1.9% lower when compared to that of SA1 and SE1, respectively. This outcome can be attributed to the developed bond behaviour between GC and BFRP (Golafshani et al., 2014; Mousavi et al., 2016).
As shown in Table 7, the increase in the concrete compressive strength decreases the ductility index of the slabs. It can be seen that the SA7and SE7 specimens with high compressive strength obtained lower ductility index values of 8.1% and 5% when compared with SA1 and SE1 specimens having normal compressive strength subjected to monotonic and cyclic loading, respectively, and the results showed that the failure of high concrete strength was slightly more brittle than normal strength. Moreover, the diameter of the punching cone of the GC slabs with high compressive strength was larger than that of the GC slabs with lower compressive strength, and the position of the critical shear crack at the tension surface was further from the face of the column. The high-strength GC slabs had a lower punching cone angle compared with those of normal-strength GC slabs. It can be seen that with an increase in concrete strength from 50 to 70 MPa, the punching shear angle decreased by 9.7% and 5.2% for the SA7 and SE7 specimens, respectively.
As presented in Table 4, the cyclic load generally did not transform the position of the failure surfaces and punching cone angle of the diagonal cracks; however, it increased the number of cracks. The number of radial cracks in the SE specimens was greater than that in the SA specimens. As shown from Table 7, owing to cyclic loading, there was a decrease in the ductility indices of different specimens.
Conclusion
This study investigated the load deflection relationship and punching strength of 16 two-way GC slabs subjected to static and cyclic loading by considering several reinforcing materials, such as BFRP, GFRP and steel bars. Moreover, the ratio of reinforcement, type of concrete and concrete compressive strength were also considered. Various structural responses, such as deflection, crack pattern, the punching shear capacity and ductility index under static and cyclic loading were examined experimentally. Based on the experimental results obtained, it can be concluded that 1. All tested slabs resulted in punching shear failure, and the crack patterns were similar regardless of the type of reinforcement and reinforcement ratio. The slabs with small reinforcement ratios exhibited greater ductility and larger deformation before punching shear failure. 2. As a result of the lower elasticity modulus and weaker bond performance of FRP reinforcements, the GC slabs reinforced by FRP exhibited higher deflections than those reinforced by conventional steel. 3. The uncracked response of the tested slabs was almost the same because, at this phase, the slab’s performance was governed by the properties of the GC. 4. The axial stiffness of the reinforcement effectively affected punching shear behaviour. An increase in the axial stiffness of reinforcements 5. Upon increasing the concrete grade, the ultimate load-carrying capacities of the GC slabs strengthened by the BFRP bars increased. At the same time, the ductility index, deflection and crack width decreased for both loading types. 6. The punching shear capacity and ductility index of the GC slabs reinforced with BFRP bars appeared to be higher than those of OC slabs. This is because of the developed mechanical features of GC compared with OC having the same grade. 7. Cyclic loading decreased the load capacity of the GC tested slabs compared to the capacity resulting from static loading. However, this reduction is very small for slabs reinforced with FRP slabs. Furthermore, when the highest point of each cycle was connected, a load-deflection relationship similar to the corresponding static relationship was obtained. 8. It was found that the deflection that results from cyclic loading was usually higher at a similar load level when compared to the deflection due to static loading. With an increase in the load cycles, the stiffness of the GC slabs decreased, while the residual deflections increased. 9. The GC slabs strengthened by BFRP and GFRP bars exhibited a better punching performance than the GC slabs strengthened by steel bars in the case of cyclic loading.
Footnotes
Declaration of conflicting interests
The author(s) declared no potential conflicts of interest with respect to the research, authorship, and/or publication of this article.
Funding
The author(s) received no financial support for the research, authorship, and/or publication of this article.