
Abstract
This study presents an investigation to quantify the aerodynamics of truss bridge-girders via wind tunnel test and kriging surrogate model. Currently, the conventional methods documented in design specifications only take into consideration the mean drag force at null attack angle. To gain an in-depth understanding on the aerodynamics of truss bridge-girders, experiments on simplified bridge-girder models with various geometric parameters were carried out in uniform flow. A total of 15 truss bridge-girder models with aspect ratio (the ratio of width to height) B/D = 1.0, 1.3, 1.6, 1.9, and 2.2, solidity ratio (the ratio of projected to envelope areas) Φ = 0.20, 0.25, 0.30, 0.35, and 0.40, and two typical truss topologies (Warren and Pratt trusses) were examined in the most concerned range of wind angle of attack α = [–6°, 6°]. These truss bridge-girder models cover most of the high-speed railway bridges widely used in China. Experimental results show that the truss topology has limited effects on the aerodynamics of truss bridge-girders, whereas the effects of α, B/D, and Φ are significant. Based on these wind tunnel results, the ordinary kriging surrogate model was utilized to approximate the aerodynamics of truss bridge-girders. In using this model, aerodynamic force values for test cases can be interpolated with zero variance and uncertainties in unsampled design zones where geometric parameters can be quantified with Gaussian variance.
Keywords
Introduction
Truss is one of the most widely used structures in bridge engineering around the world, especially for high speed railway (HSR) bridges in China, such as Wufengshan and Hutong Yangtze River Bridges both with the main span of 1092 m (He et al., 2017a). Generally, these long-span truss bridges are very sensitive to crosswinds, and bridge-girder geometries play an important role in determining their aerodynamic properties (Miyata and Yamaguchi, 1993; Miyata et al., 1992; Ueda et al., 1990). Thus, in order to predict and optimize wind resistence of such long-span truss bridges, crosswind aerodynamic properties of their main bridge-girders with various geometry parameters should be fully investigated in advance.
Truss is a complex structure with many structural members and various topologies. To quantify the crosswind aerodynamics of such structure is quite difficult. In the past decades, three methods have been proposed by previous researchers to evaluate wind loads acting on such structure: (1) Using empirical formulas (ASCE, 2010; Fujino et al., 2012); (2) Summing up wind loads acting on each truss members (chords, verticals, and diagonals, etc.) and deck furniture (handrails, wind shields, etc.) (BS 5400, 2000; GB50009, 2012; JTG/T D60-01-2004, 2004) which has been widely used in bridge engineering; (3) A local approach to calculate aerodynamic forces on each member and corrected by taking into account the effects of shielding and angle of attack (Prud’homme et al., 2014).
In general, the above methods have three obvious shortcomings in all, which hinder their extensive applications in practice. Firstly, all the above-mentioned specifications can only be used to evaluate the mean drag force at null wind angle of attack (α = 0°). To the best of the authors’ knowledge, there is no effective way to calculate other forces, such as lift and moment. Secondly, for BS 5400 (2000) and JTG/T D60-01-2004 (2004), the drag coefficient is only a function of solidity ratio (the ratio of projected to envelope areas, Φ) and global shielding factor (a scale ratio caused by the shielding effect of windward structures, η). The influences of other important factors, such as wind angle of attack, truss topology, and aspect ratio (width to height ratio), are usually ignored. Finally, for the local method proposed by Prud’homme et al. (2014), though taking into consideration the issues of wind angle of attack, shielding effect, and aspect ratio, it is still in its initial stage and needs further development to adequately address the interference effects from steel angle members and deck constructions.
In designing a truss girder bridge, especially in the initial design stage, a full understanding of the associated aerodynamics, as well as its geometric configurations, is extremely important. However, the above addressed shortcomings exhibited in the reviewed three methods pose difficulties for engineers to apply in configuring a rational truss structure with “optimized” aerodynamics. Aiming to obtain adequate knowledge on the quantification of the aerodynamics of truss bridge-girders and successfully choose an appropriate structure configuration, this study, on the one hand, systematically conducts wind tunnel tests on a series of truss bridge-girders with various geometric configurations and, on the other hand, utilizes the ordinary Kriging, a Gaussian process machine learning technique, to approximate and extrapolate the aerodynamic features of truss bridge-girders based on wind tunnel experiments.
Due to the complex geometries of the truss structure, wind tunnel test, deemed as a valid and efficient method, is adopted in the current study, as to quantify the wind loads on truss structures (Boonyapinyo et al., 1999; Ge and Xiang, 2008; Miyata and Yamaguchi, 1993; Miyata et al., 1992; Ueda et al., 1990). Currently, machine learning models, such as support vector regression (Smola and Scholkopf, 2004), radial basis functions (Park and Sandberg, 1991), polynomial regression (Lesh, 1959), artificial neural networks (Xu et al., 2018), and kriging (Jones et al., 1998; Sacks et al., 1989) have been successfully used in many engineering problems. Among these machine learning models, kriging is featured with engineering optimization, uncertainty quantification, sensitivity analysis, and design exploration. Because of the excellent features equipped with the kriging model, it is thus used in the current study to expand the findings by wind tunnel experiments. A brief review of the kriging model will be given later.
The presentation of the study is organized as follows. In section 2, a review of the truss bridge-girders used in Chinese HSR is conducted. The detail statistics of structural topologies and key geometric parameters of truss bridge-girders, and some typical long-span truss bridges are tabulated, concreting to the parameter ranges of solidity and aspect ratios for designing the truss bridge-girder models to be used in wind tunnel tests. Section 3 presents the wind tunnel tests and the effects of wind attack angle, solidity ratio, and aspect ratio on the aerodynamic characteristics of truss bridge-girders. The wind tunnel results are also compared with those from the current specifications. In section 4, a review and a numerical calibration of the kriging model are given and the uncertainties in the aerodynamic properties of truss structures are quantified by using this Gaussian process model. Concluding remarks are given in section 5.
Truss bridges in Chinese high-speed railway
In order to satisfy the strict requirements of rail track deformation so as to ensure the running safety of high-speed train, truss bridge-girder is widely used in China. An example of the truss bridge-girder utilized in long-span railway bridges could be simplified as shown in Figure 1, which is primarily characterized by three geometric parameters in the chordwise direction (cross-section), that is, b, B, and D are the full widths of upper and lower decks, and the height of the bridge-girder, respectively. The truss member width t in the spanwise direction and truss topology (Warren and Pratt trusses, as shown in Figure 1(b)) are the other two main parameters. Thus, using aspect ratio B/D (or b/D), solidity ratio Φ, amount of main planar trusses (as shown in Figure 1(a)), and truss topology can clearly define a truss bridge-girder.
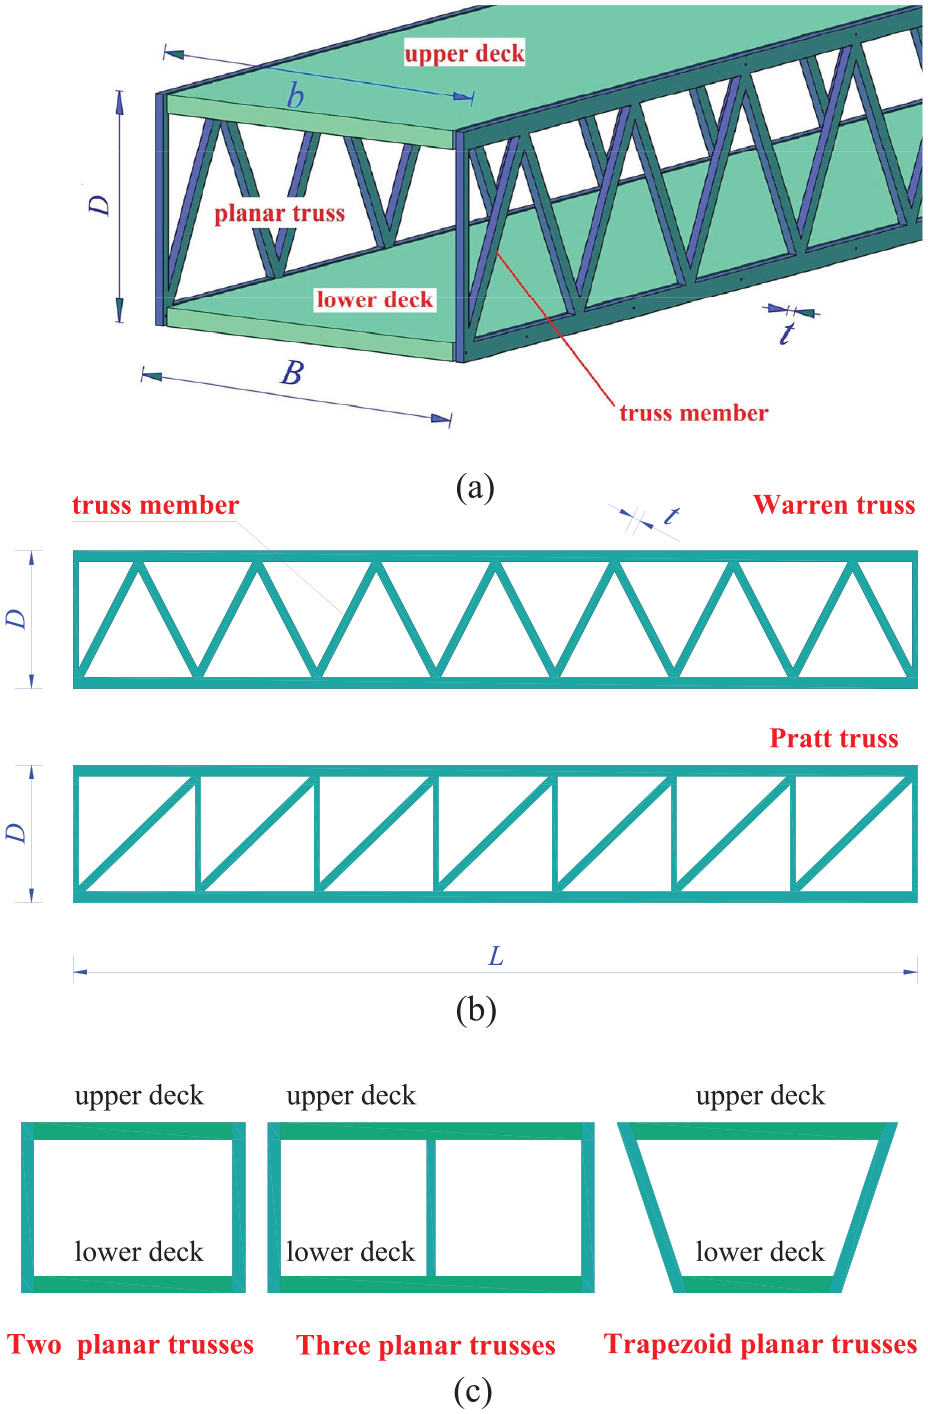
Primary characteristics of a truss bridge-girder: (a) overview, (b) span-wise direction, and (c) chordwise direction.
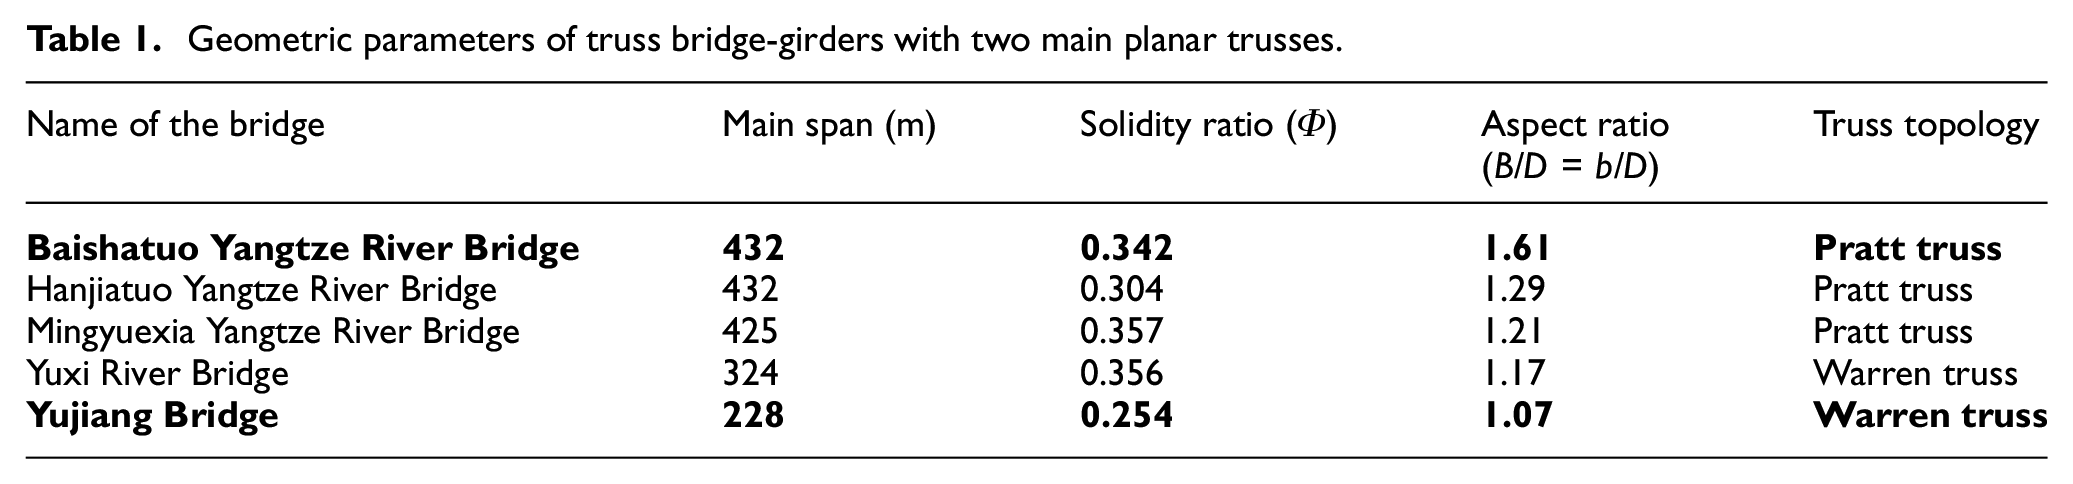
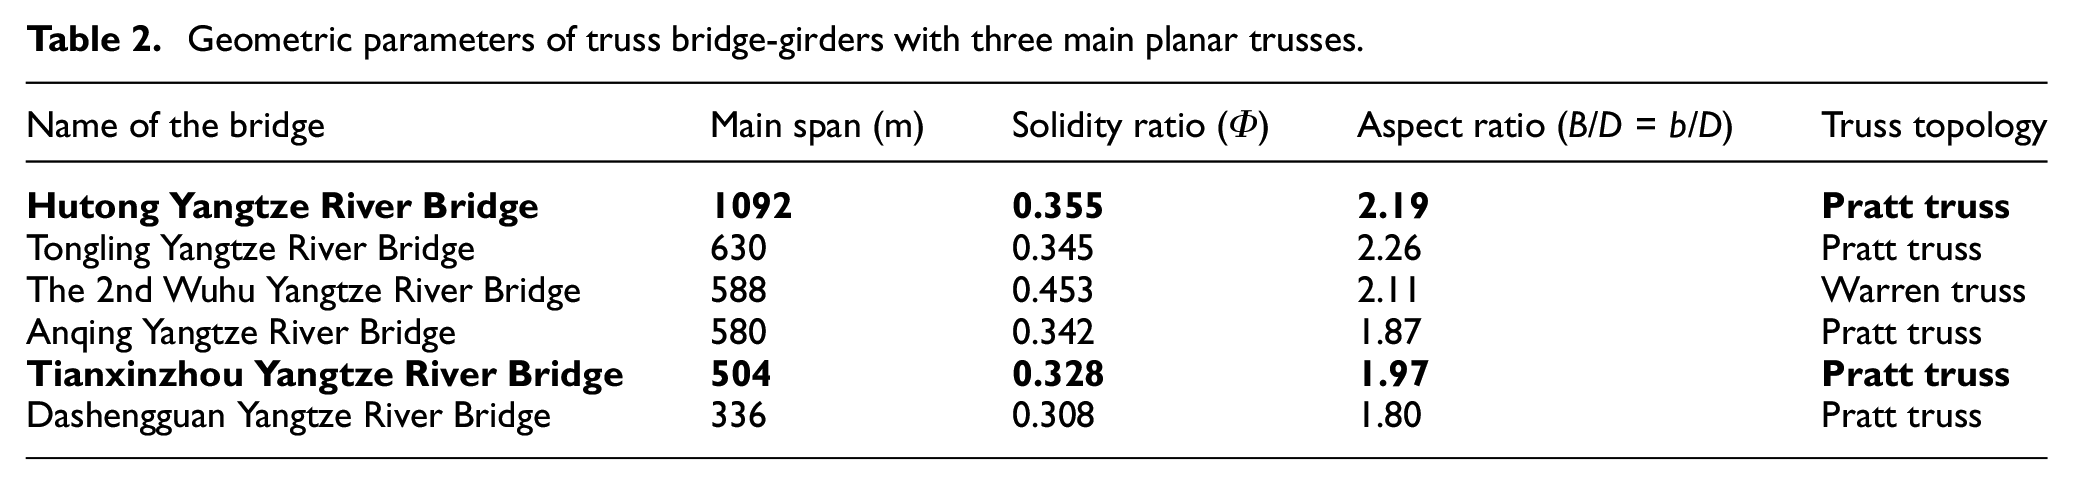
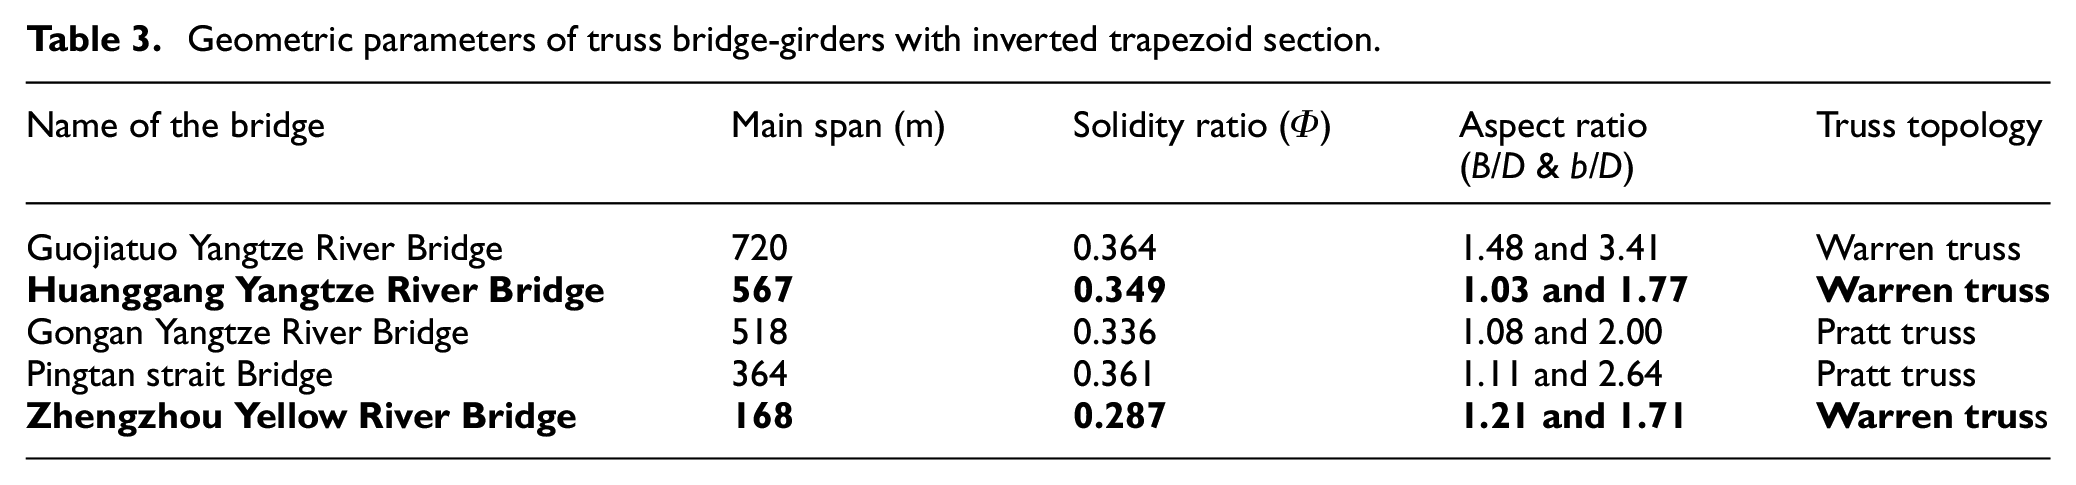
Based on the cross-section topology of bridge-girders, truss bridges can be classified into three categories, namely, bridge-girders with two main planar trusses, bridge-girders with three main planar trusses, and bridge-girders with inverted trapezoid cross-section, as shown in Figure 1(c). A summary of truss bridges used in Chinese HSR is listed in Tables 1–3, where Tables 1 and 2 list the primary geometric parameters of bridge-girders with two and three main planar trusses, respectively. Table 3 provides geometric details for bridge-girders with an inverted trapezoid cross-section. The representative long-span railway bridges with truss girder, highlighted with bolded texts in Tables 1–3, are presented in Figure 2.
Geometric parameters of truss bridge-girders with two main planar trusses.
Geometric parameters of truss bridge-girders with three main planar trusses.
Geometric parameters of truss bridge-girders with inverted trapezoid section.
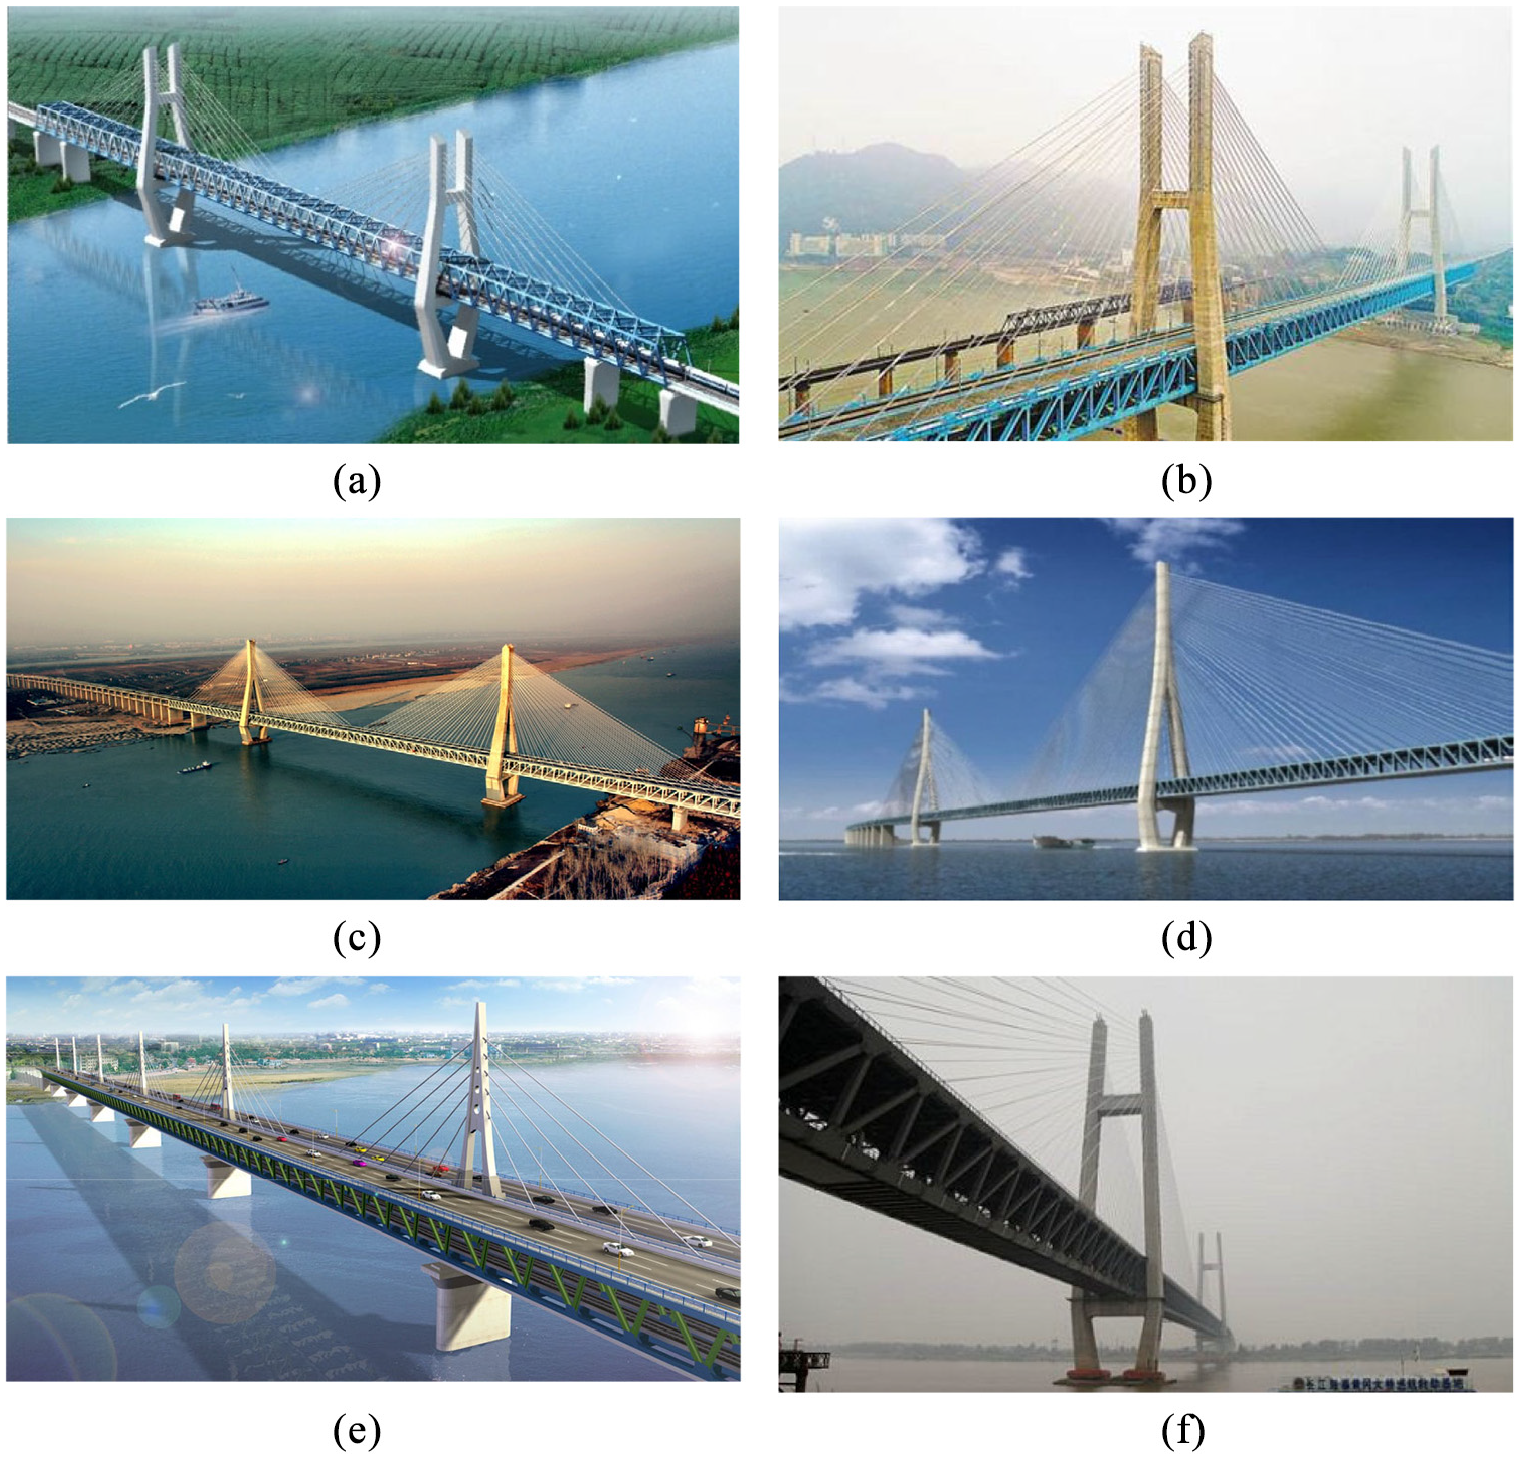
Long-span truss girder railway bridges: (a) Yujiang bridge, (b) Baishatuo Yangtze river bridge, (c) Tianxinzhou Yangtze river bridge, (d) Hutong Yangtze river bridge, (e) Zhengzhou yellow river bridge, and (f) Huanggang Yangtze river bridge.
For bridge-girders with two main planar trusses, Yujiang and Baishatuo Yangtze River bridges are two important projects (He et al., 2016, 2017a; Hu et al., 2014). As shown in Figure 2(a), the Yujiang Bridge, one of the control projects of the Nanning-Guangzhou HSR segment, has a span arrangement of (36+96+228+96+36) m with a uniform truss segment of 12 m. The two main planar trusses are distanced by 15 m in the chordwise direction (perpendicular to the bridge axis) with a uniform-depth of 14 m. As shown in Figure 2(b), the Baishatuo Yangtze River Bridge, with a main span of 432 m, is characterized by a total of six rail tracks with four passenger dedicated lines on the upper deck and double rail-tracks for freight transportation on the lower one.
In general, long-span railway bridges with three main planar trusses exploit their double decks with highway vehicles running on the upper deck and rail vehicles riding on the lower one. The width of a six-lane highway can exceed 30 m, so that the B/D of a truss bridge-girder with three main planar trusses is usually larger than 1.80. The representative bridges are Tianxinzhou and Hutong Yangtze River Bridges, as shown Figure 2(c) and (d). The Tianxinzhou Yangtze River Bridge, built in 2008 with the span arrangement of (98+196+504+196+98) m, is a milestone project of long-span railway bridges in Chinese HSR. Three uniform planar trusses all with the depth of 16 m are used for this bridge, and the distance between any two adjacent planar trusses is 15 m. On the other hand, the Hutong Yangtze River Bridge, still under construction now, is the first high-speed railway bridge with the main span (1092 m) exceeding 1000 m around the world. The same uniform truss depth of 16 m used in Tianxinzhou Yangtze River Bridge is also adopted here, whereas the distance between any two adjacent planar trusses is increased to 17.5 m so as to improve the torsional stiffness of the cross-section and reduce the average tensile stress acting on each truss member.
In less developed areas, the demand of urban rail transit is relatively weak. Under this circumstance, the inverted-trapezoid-truss-bridge-girder with two rail-tracks on the lower deck is a popular choice, such as Zhengzhou Yellow River and Huanggang Yangtze River Bridges, as shown Figure 2(e) and (f). For the Zhengzhou Yellow River Bridge, the length of the main bridge is 1080 m with the span arrangement of (120+5 × 168+120) m. The widths of the upper deck designed for highway vehicles and the lower deck designed for high-speed trains are 24 m and 17 m, respectively. The height of the uniform truss is 14 m. The Huanggang Yangtze River Bridge, supporting two rail-tracks on the lower deck and four-lane highway on the upper one, is a vital project of the Wuhan-huanggang intercity railway. This cable-stayed truss bridge has a span arrangement of (81+243+567+243+81) m with a uniform truss depth of 15.5 m. The widths of the upper and lower decks are 27.5 m and 16 m, respectively.
In summary, key parameters B/D, b/D, and Φ of long-span truss railway bridges with two truss topologies (Pratt and Warren trusses) used in Chinese HSR range from 1.0 to 2.2, 1.0 to 3.5, and 0.20 to 0.40, respectively. Based on these statistical results, the further refinements of design specifications, such as BS 5400 (2000) and JTG/T D60-01-2004 (2004), may be carried out in the near future.
Wind tunnel test
Experimental details
The present truss bridge-girder models were examined in a closed-circuit atmospheric boundary layer wind tunnel belongs to the National Engineering Laboratory for High-speed Railway Construction. The detailed information of this wind tunnel is available in Li et al. (2019). To eliminate the effects of supporting frameworks, two 1200 × 2500 mm rectangular plates were vertically installed in the test section of the wind tunnel, as shown in Figure 3. Due to the variation of wind angle of attack, the blockage ratio caused by the bridge-girder model and supporting frameworks ranges from 2.5% to 3.8%.
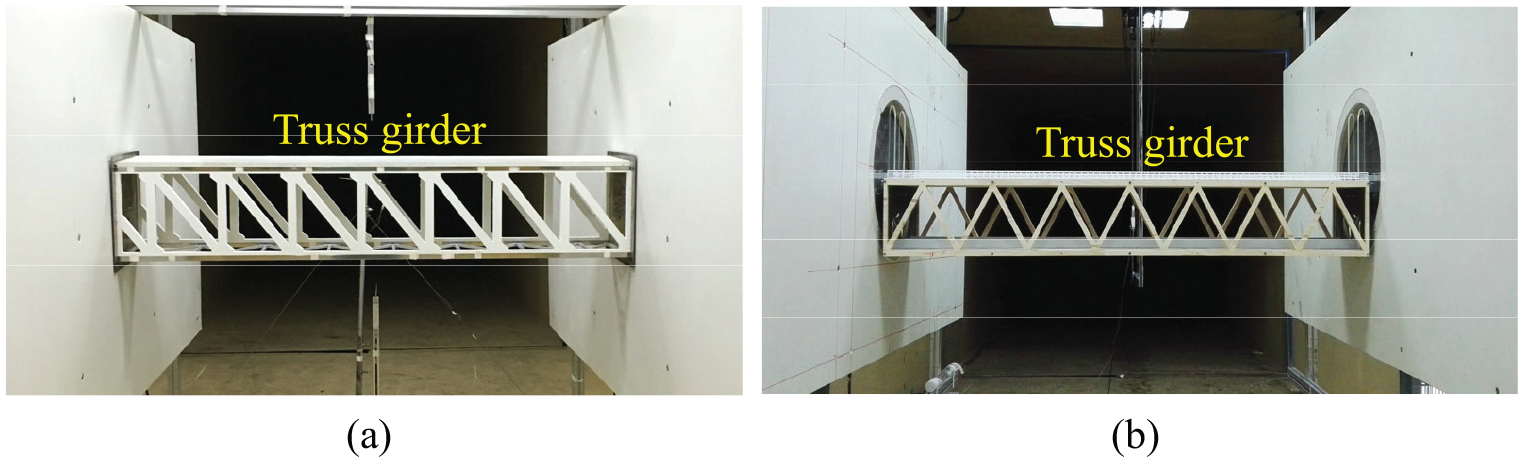
Truss bridge-girder models installed in wind tunnel: (a) model used to study the effects of truss topology and (b) model used to study the effects of aspect ratio, solidity ratio, and angle of attack.
As listed in Table 4, the present wind tunnel test totally examines 15 truss bridge-girder models with various Φ, B/D, and truss topologies, which are assembled based on the above mentioned statistics of the geometric parameters of truss bridge-girders used in engineering practices. Models 1–6 are designed to study the effects of truss topology on the aerodynamics of truss bridge-girders. Where the truss topologies of Models 1–3 and Models 4–6 are Warren truss and Pratt truss, respectively. The test range of wind attack angle α of Models 1–6 is [–12°, 12°] with an interval of 2° (JTG/T D60-01-2004). In addition, the effects of wind attack angle, solidity and aspect ratios are addressed by Models 7–15. For Models 7–11, the only variable is the solidity ratio Φ, which ranges from 0.20 to 0.40 with an interval of 0.05; while for Models 9 and 12–15, the only variable is the aspect ratio B/D, which ranges from 1.0 to 2.2 with an interval of 0.3. But the above models are tested in α = [–6°, 6°] with an interval of 3° (Tang et al., 2017; Zhu, 2015). The variations of Φ and B/D were realized by adjusting the width of the truss member t (as defined in Figure 1) and the height of the truss girder D, respectively. The truss member with square cross-section was adopted here. All parts of truss bridge-girder models were made of wood with aluminum skeleton embedded to provide desired stiffness. Moreover, the aerodynamics of truss bridge-girders with three main planar trusses and inverted trapezoid cross-section is more complex, which will be studied in the near future.
Truss bridge-girder models.
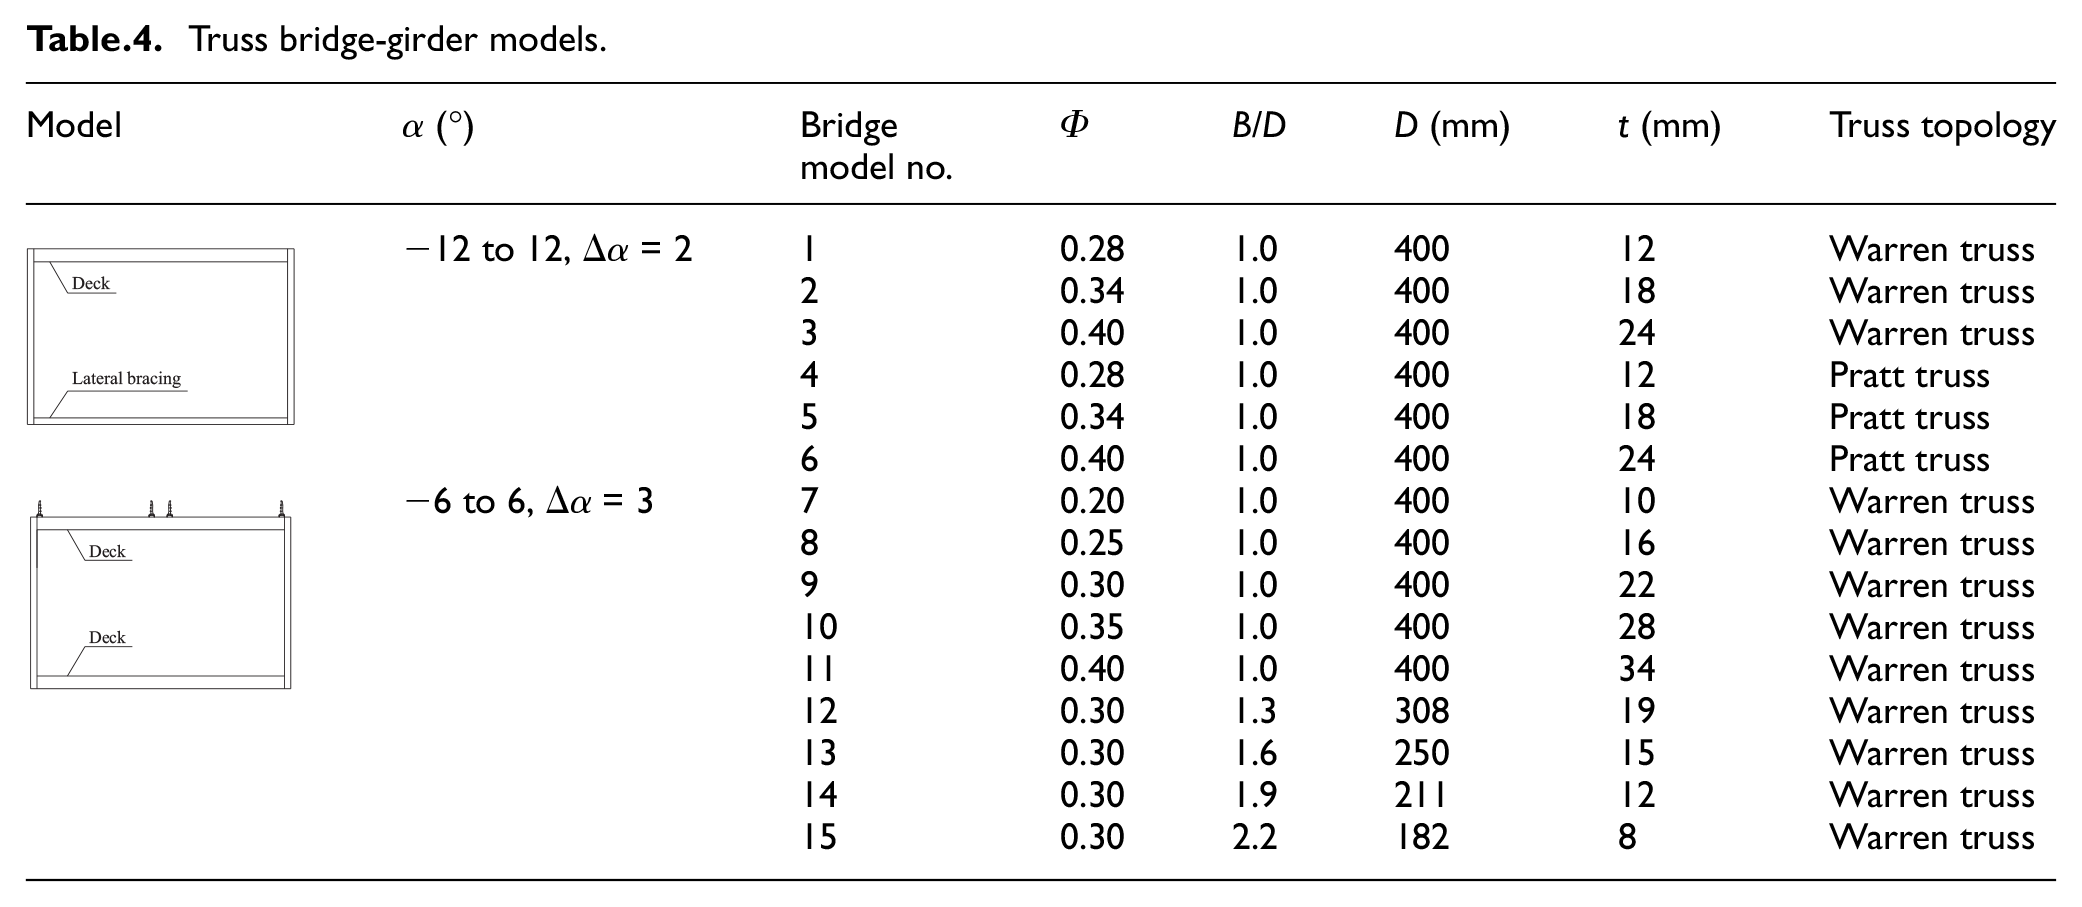
Figure 4 presents the coordinate system of truss bridge-girder models. The origin point of this coordinate system is set at the centroid of the model cross-section. Since truss bridge-girders are not sensitive to the Reynolds number effect (Li et al., 2018, Wang et al., 2018), the oncoming flow velocity U∞ shown in Figure 4 is set at 10 m/s. Moreover, this oncoming flow is also monitored by a Cobra probe produced in Australia. As illustrated in Figure 4, FD, FL, and MT are the drag, lift, and moment acting on the bridge-girder model in wind axis, respectively. To control vibrations caused by the interaction between oncoming flow and bridge-girder model into an acceptable level, two IFS-type six-component dynamic balances (with a force resolution of 0.02 N), produced by the NITTA Company of Japan, were mounted at the both ends of the bridge-deck model. The above aerodynamic forces were synchronously measured by these two balances. The sampling frequency and duration of these two balances are modulated at 1 kHz and 30 s, respectively.
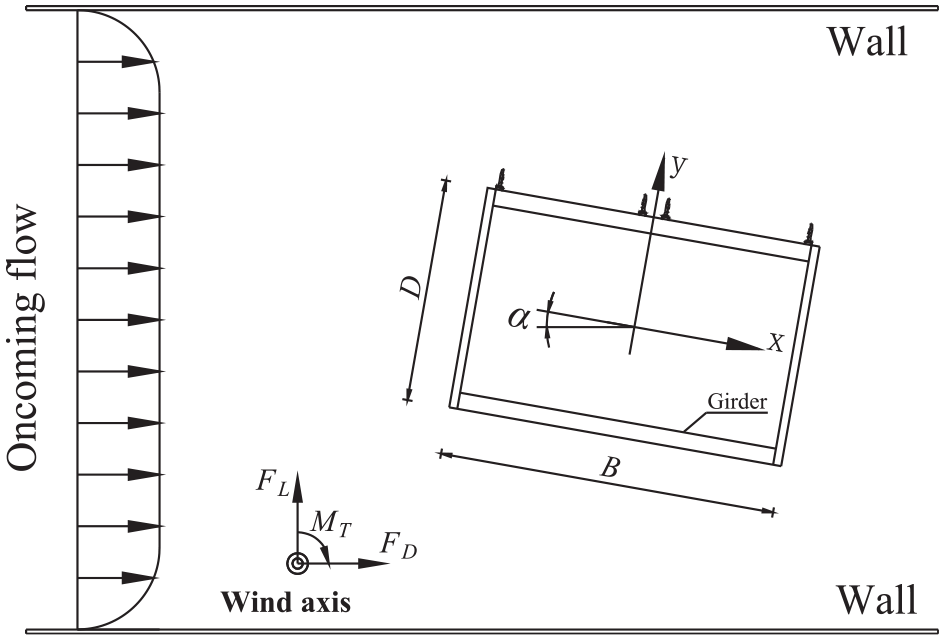
Coordinate system of the bridge-girder model.
Data processing method
The mean aerodynamic coefficients of the bridge model (CD, CL, and CM) in wind axis (Figure 4) can be expressed as:


Where
Aerodynamics of truss bridge-girder models
This section is focused on the aerodynamic results of truss bridge-girders with variations in truss topology, wind angle of attack, truss solidity ratio, and girder aspect ratio. By comparison, the effects of the above geometry parameters on bridge-girder aerodynamics can be roughly specified.
Effects of truss topology
The mean aerodynamic force coefficients of Models 1–6 are shown in Figure 5. The three columns in Figure 5 correspond to Φ = 0.28, 0.34, and 0.40, respectively. Obviously, CD, CL, and CM of the models with two different truss topologies, namely, Warren and Pratt trusses, largely coincide with each other. Moreover, this consistency has nothing to do with other factors, such as angle of attack and solidity ratio. To some extent, one may conclude that the effects of the truss topology on the mean aerodynamic force coefficients of truss bridge-girders are very limited. Thus, only the Warren truss is considered in the following discussion.
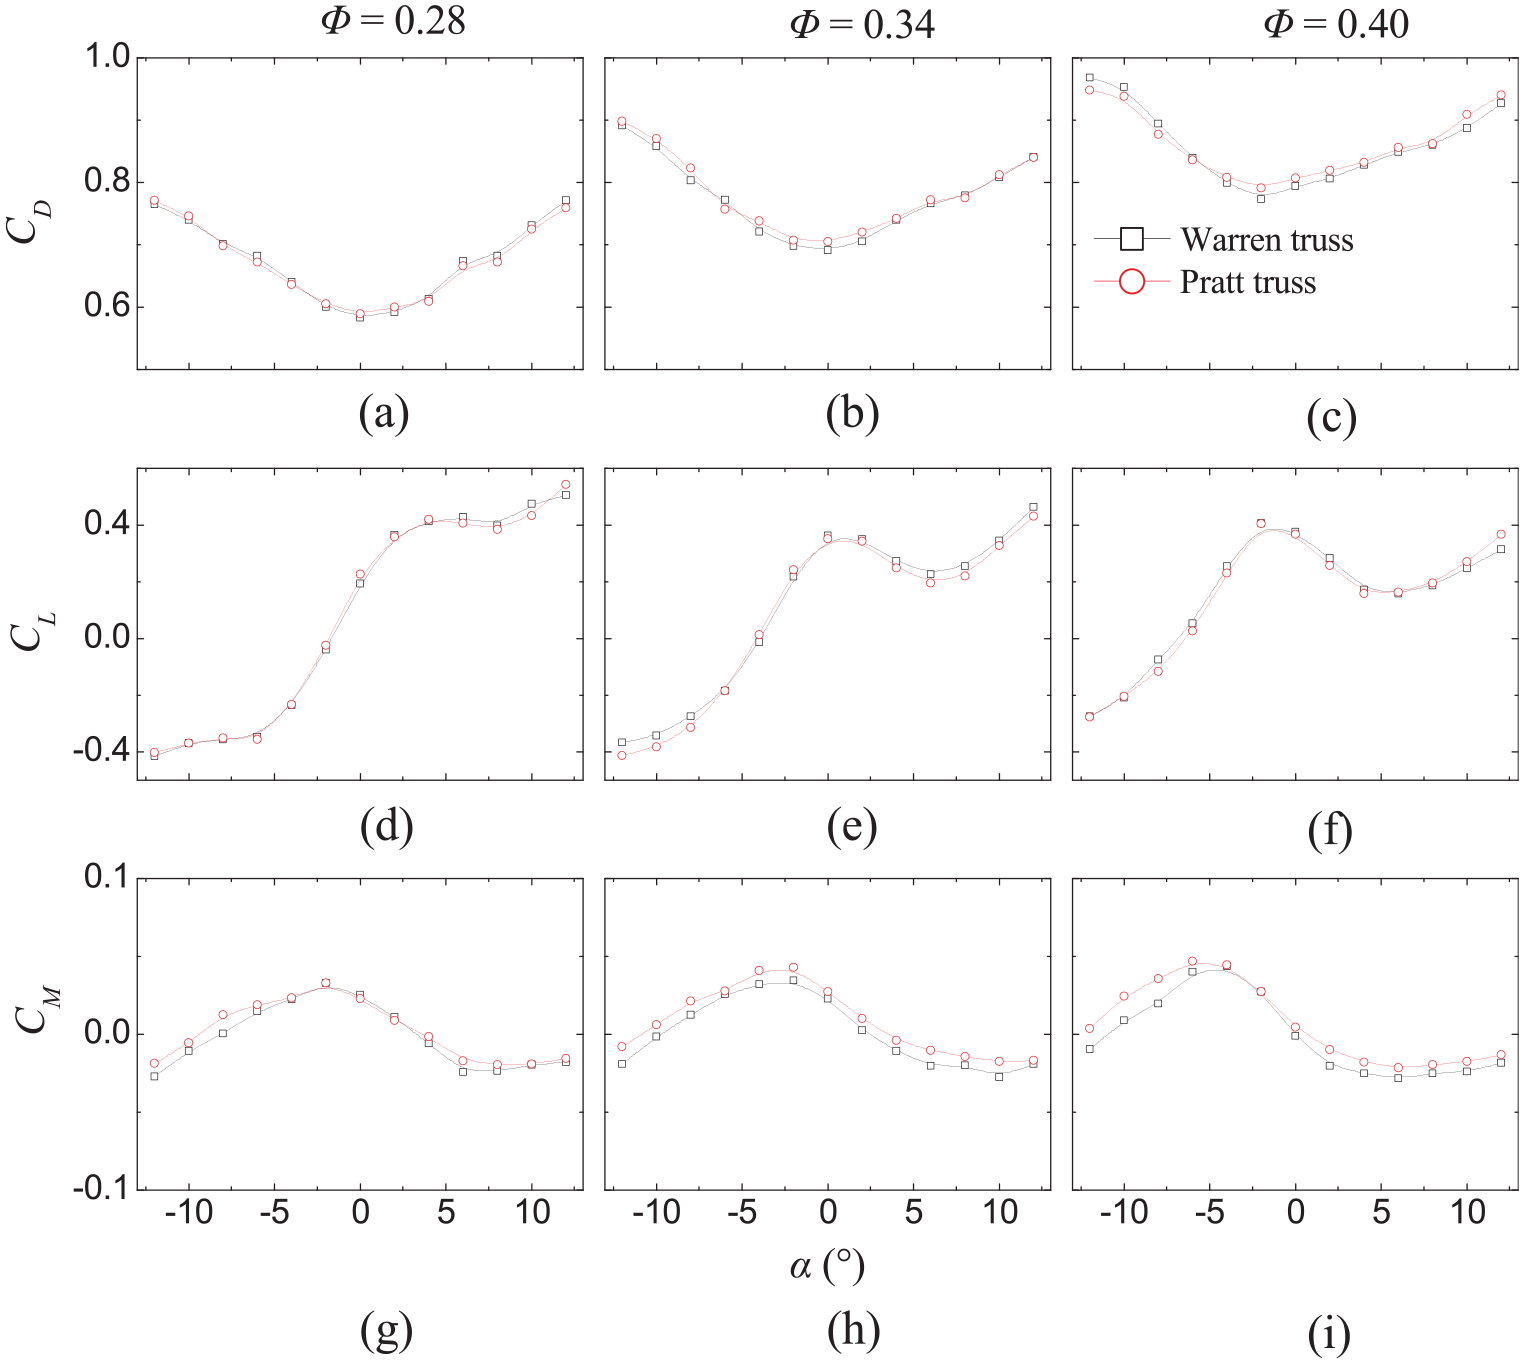
Mean aerodynamic force coefficients of truss bridge-girder models with B/D = 1.0, Φ = 0.28, 0.34, and 0.40 (a) Mean drag coefficient with
Effects of wind angle of attack
Figure 6 shows the effects of wind angle of attack α on the mean aerodynamic force coefficients of truss bridge-girder models with B/D = 1.0. For comparison, the aerodynamic force coefficients of Yujiang bridge, Tongling Yangtze River bridge, and Hutong Yangtze River bridge measured by wind tunnel test and numerical simulation (Liu and Lei, 2019) are also depicted in Figure 6. Generally, the present wind tunnel test results are reasonably good compared with these previous studies, which suggests a validation of the present experiment.
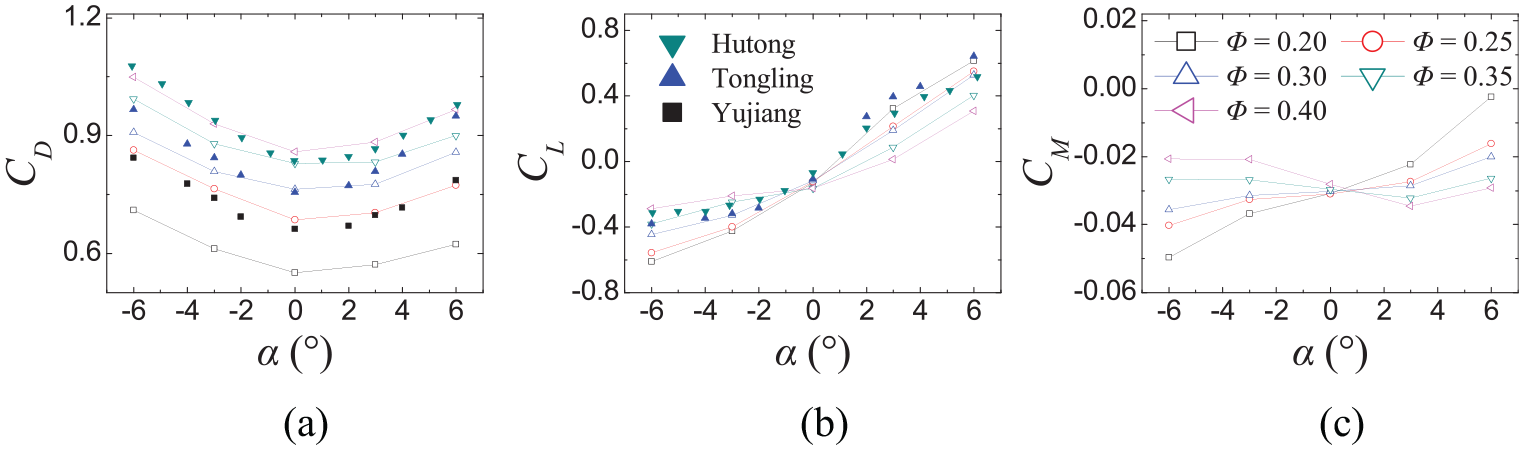
Effects of angle of attack on the mean aerodynamic coefficients of truss bridge-girder models with B/D = 1.0, Φ = 0.20, 0.25, 0.30, 0.35, and 0.40. (a) Mean drag coefficient, (b) Mean lift coefficient, and (c) Mean moment coefficient.
As shown in Figure 6(a), the minimal values of all the drag coefficients always occur at α = 0°, which is expected for the projected areas of truss bridge-girder models in the streamwise direction are the smallest at α = 0°. Then, CD rises generally with α departing from 0°. However, with an increase in |α|, the increase rate of CD in the negative range of α is larger than that in the positive range, resulting in asymmetric CD curves along the centerline of α = 0°. This phenomenon may be caused by upper deck constructions (handrails and central barriers) and truss member topology, which leads to asymmetric aerodynamic shapes of bridge-girder models with respect to the streamline direction, as shown in Figure 3.
For lift coefficients, they all gradually grow with an increase in α. However, the increase rates of CL of bridge-girder models with small Φ are larger than those with large Φ, as shown in Figure 6(b). Thus, all CL curves intersect at α ≈ 0°. Note that, the CL at the intersection point is negative. Based on the numerical results of Tang et al. (2017), the negative CL of all truss bridge-girder models at α ≈ 0° is partially attributed to the upper deck constructions, such as handrails and central barriers.
Similar to CL, the moment coefficients of all cases also intersect at α ≈ 0°. It is worth pointing out that CM of all bridge-girder models in the tested range of α = [–6°, 6°] is negative. This behavior would also be mainly due to the upper deck constructions.
Effects of solidity ratio
Effects of solidity ratio on the mean aerodynamic force coefficients of bridge-girder models with B/D = 1.0 are shown in Figure 7. The corresponding results of the design specification BS 5400, 2000, shown here for comparison, are calculated by three steps. Firstly, splitting the simplified truss bridge-girder (Figure 1) into three parts, that is, windward and leeward planar trusses, and deck constructions. Secondly, evaluating the aerodynamic forces of each part based on the given tables in the design specification. Note that, for different design specifications, the drag coefficients of deck constructions are distinct. For example, in BS 5400 (2000) the drag coefficient of deck constructions is 1.1, but this coefficient changes to 1.3 in JTG/T D60-01-2004 (2004). Finally, adding the aerodynamic forces of all the three parts together, and normalizing through equations (1–3) given in section 3.2. Note that, only CD at α = 0° can be obtained via the current design specifications. As shown in Figure 7(a), it is obvious that the CD obtained through wind tunnel is about 60% of that evaluated by the BS 5400 (2000), suggesting the design specification is on the safety side. On the other hand, further improvements of the current specifications are still required. Generally speaking, CD of all the tested truss bridge-girder models could be characterized by a slow rising with an increase in Φ, which shows a fair consistence with the CFD results performed by Nakayama et al. (2010). However, the increase rate of CD tends to gradually decay with an increase in Φ.
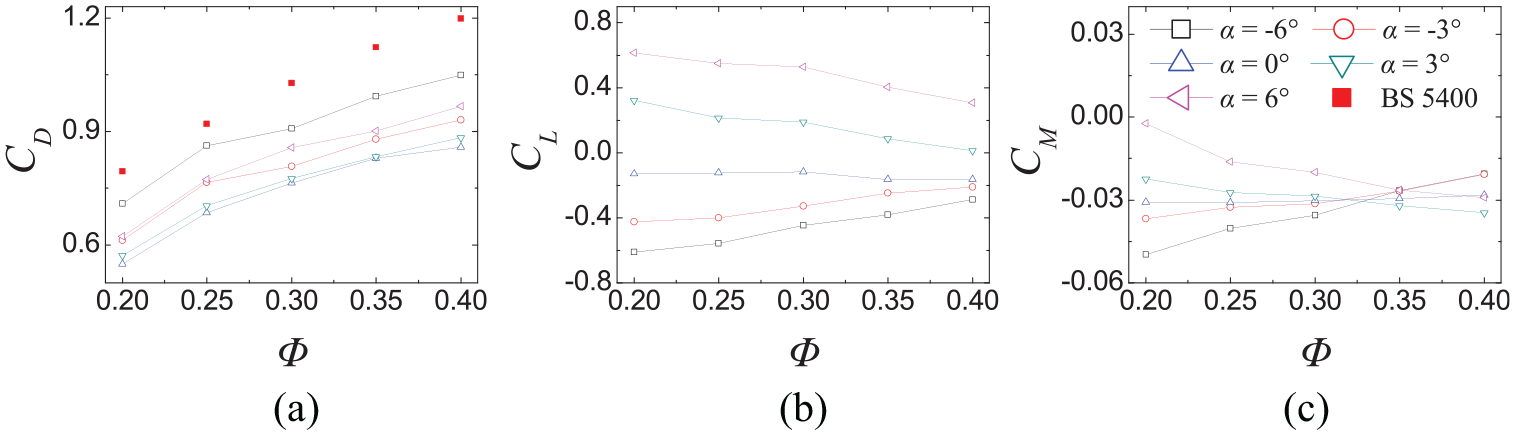
Effects of solidity ratio on the mean aerodynamic force coefficients of truss bridge-girder models with B/D = 1.0, α = −6°, −3°, 0°, 3°, and 6°. (a) Mean drag coefficient, (b) Mean lift coefficient, and (c) Mean moment coefficient.
Three behaviors of CL of truss bridge-girder models can be identified from Figure 7(b). For α being in the range of [–6°, –3°], the negative CL increases almost linearly with an increase in Φ. When α = 0°, the negative CL is non-sensitive to the variation of Φ. However, when α = 3°–6°, CL, being positive, decreases steadily with an increase in Φ.
For moment coefficients, the three typical behaviors, identified from CL discussed in the preceding paragraph, can also be observed in Figure 7(c), while all the CM are negative and almost all the curves of CM versus Φ intersect together at Φ ≈ 0.33.
Effects of aspect ratio
It is reported that flow structure around elongated bluff bodies are highly sensitive to their aspect ratio B/D, such as rectangular, hexagon, and octagon prisms, and flat box bridge-girder. With an increase in B/D, three typical flow patterns, that is, fully separated regime, intermittently reattached regime, and fully reattached regime around rectangular, hexagon, and octagon prisms, and flat box bridge-girder can be concluded (He et al., 2017b; Ito et al., 2014; Naudascher and Wang 1993; Shimada and Ishihara, 2002). Similarly, the effects of the aspect ratio B/D on the aerodynamics of truss bridge-girder models shall not be ignored.
The effects of aspect ratio on mean aerodynamic force coefficients of truss bridge-girder models with Φ = 0.30 are presented in Figure 8. Within the tested range of α, CD gradually increases and reaches its maximum value at B/D = 1.9; while with a further increase in B/D, CD falls again. The asymmetric CD curves along the centerline of α = 0° observed in Figure 6 can also be detected here, for example, the CD at α = –3° and ‒6° is smaller than those at α = 3° and 6°, respectively.
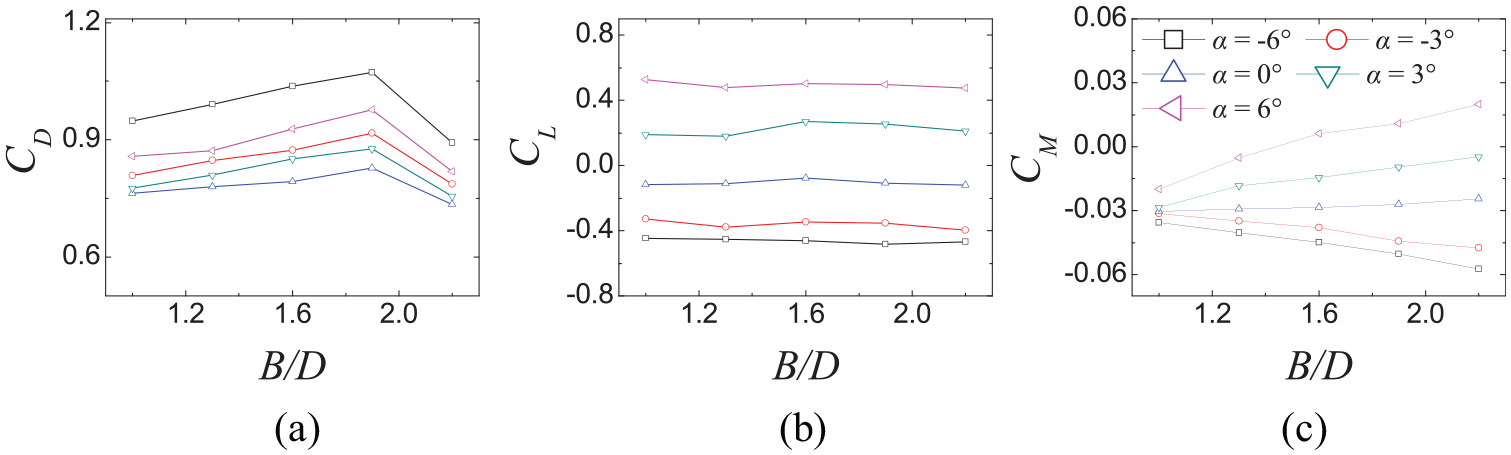
Effects of aspect ratio on the mean aerodynamic force coefficients of truss bridge-girder models with Φ = 0.30,B/D = 1.0, 1.3, 1.6, 1.9, and 2.2. (a) Mean drag coefficient, (b) Mean lift coefficient, and (c) Mean moment coefficient.
For lift coefficients, CL is non-sensitive to the variation of B/D, as shown in Figure 8(b). While for the moment coefficient CM, three typical behaviors can be identified, as shown in Figure 8(c). In the range of α = [3°, 6°], CM rises almost linearly with an increase in B/D, whereas CM at α = 6° turns into positive at B/D ≈ 1.6. For α = 0°, the negative CM is also non-sensitive to the variation of B/D. When α = [–6°, –3°], the linear relationship between CM and B/D reappears, but CM changes slower relative to that of α = 3°–6°.
Quantification of aerodynamics with Kriging
Review of Gaussian Kriging surrogate model
The effects of geometrical parameters on the aerodynamic properties is quantified using the Gaussian kriging surrogate model, a stochastic-process model, which is furnished with feature of uncertainty quantification. The kriging model has been widely applied in many engineering disciplines, other than geostatistics, as initiated by Sacks et al. (1989). Provided that a deterministic function to be approximated has a design plan with n sampled points and k variables,
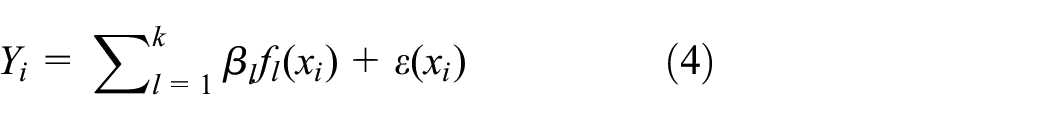
Where each
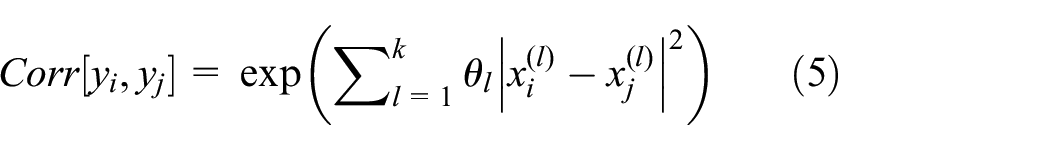
Where

Where
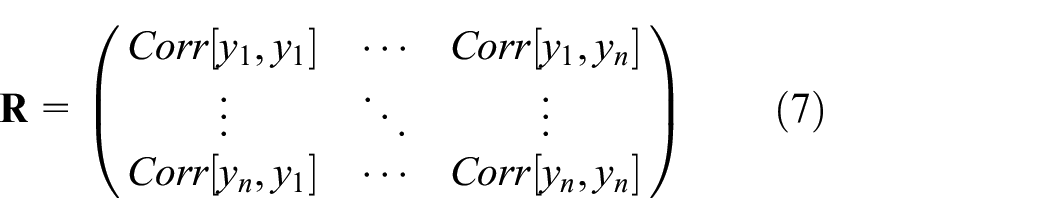
To determine the values of
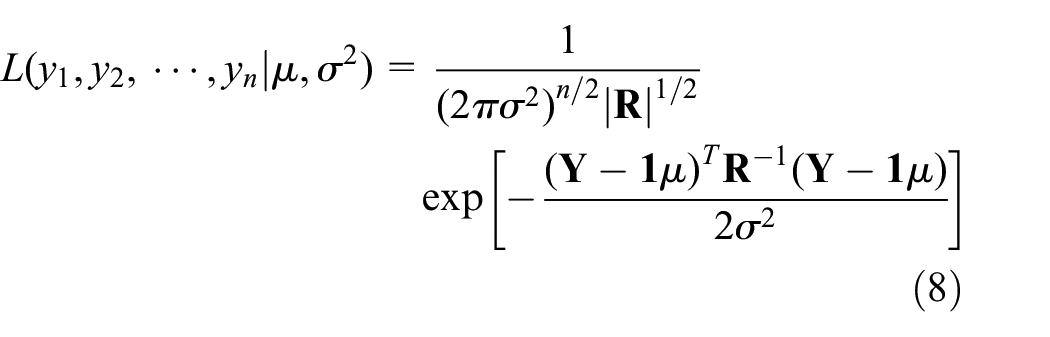
In practice, the natural logarithm of the likelihood function is desired, which is (by removing the constant terms)
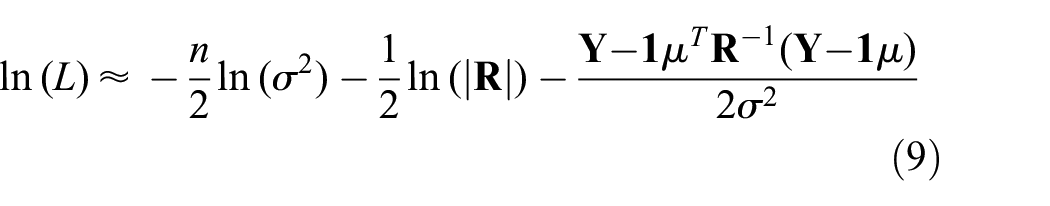
The derivations of equation (9) with respect to
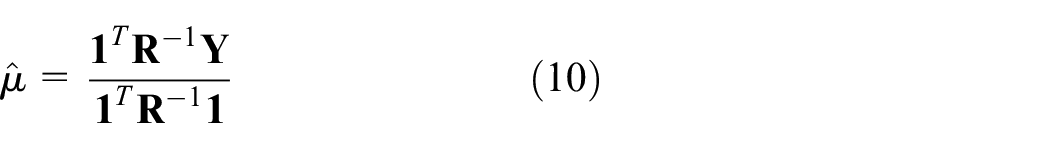
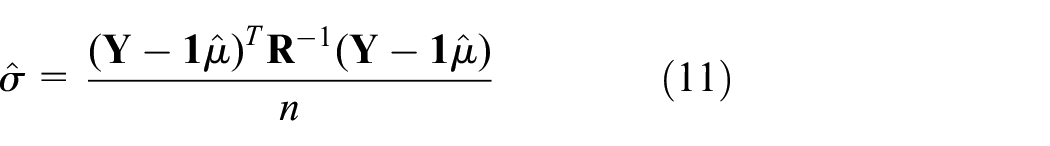
Substituting equations (10) and (11) into equation (9) results in the “concentrated ln-likelihood function”:
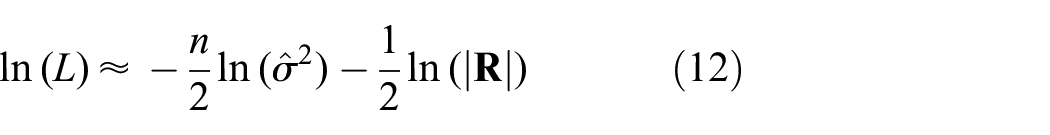
The concentrated ln-likelihood function only depends on

Where
It is noteworthy that the constructed kriging surrogate model goes through all the sampled data points. For example, to predict the response at point
The mean squared error (MSE) of the predictor is defined using the stochastic process approach, furnished in kriging as an approach of uncertainty quantification, expressed as follows (Sacks et al., 1989)
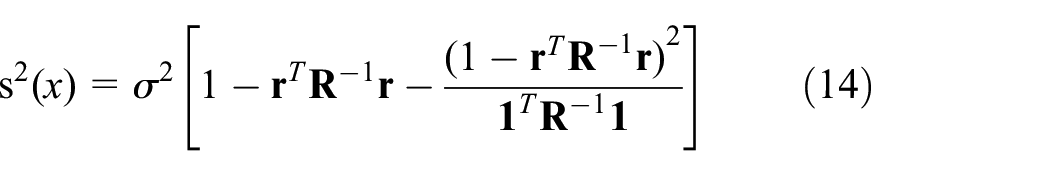
Where the term
Numerical tests
To demonstrate the surrogate model construction and its feature of uncertainty quantification, two benchmark functions with two different sets of sample points for each function are employed here and the results are shown in Figures 9 and 10, respectively (Viana et al., 2010). Function I is expressed as
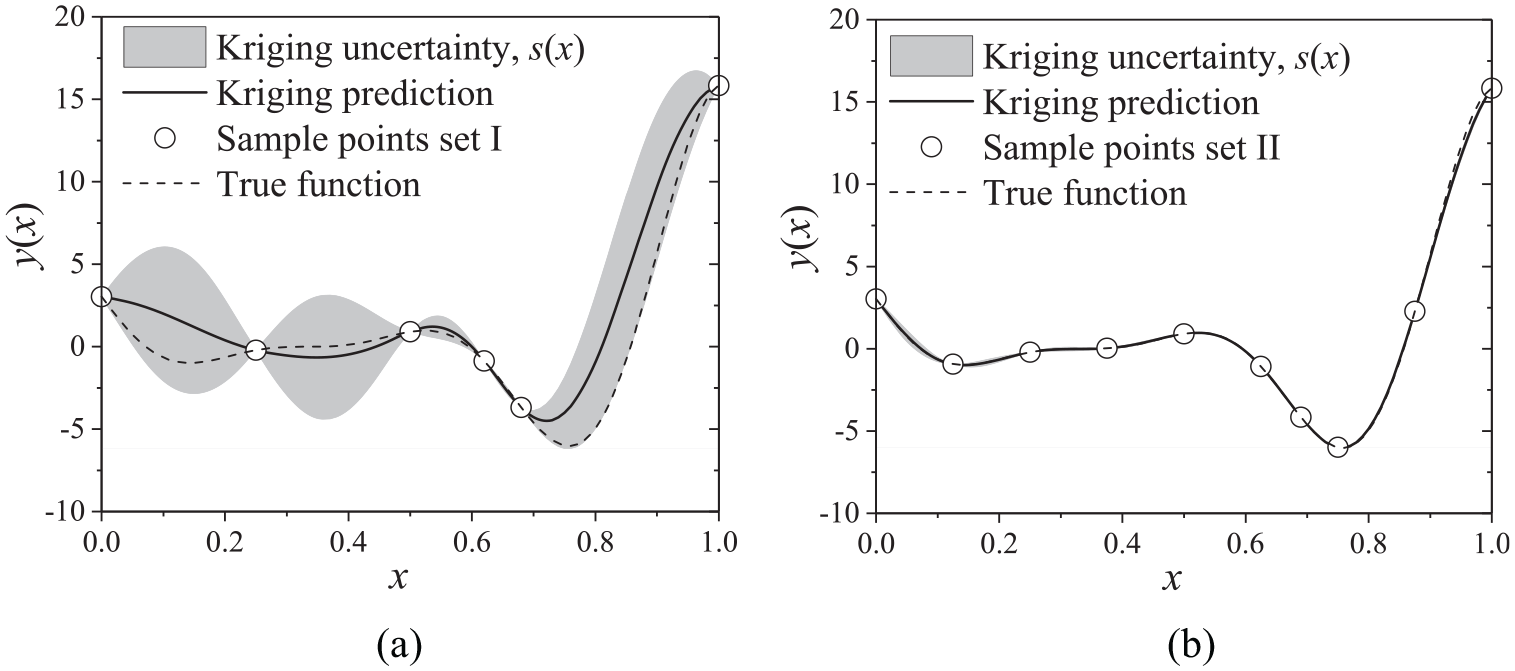
Function I: (a) results associated with sample set I and (b) results associated with sample set II.
Function II: (a) results associated with sample set I and (b) results associated with sample set II.

Where
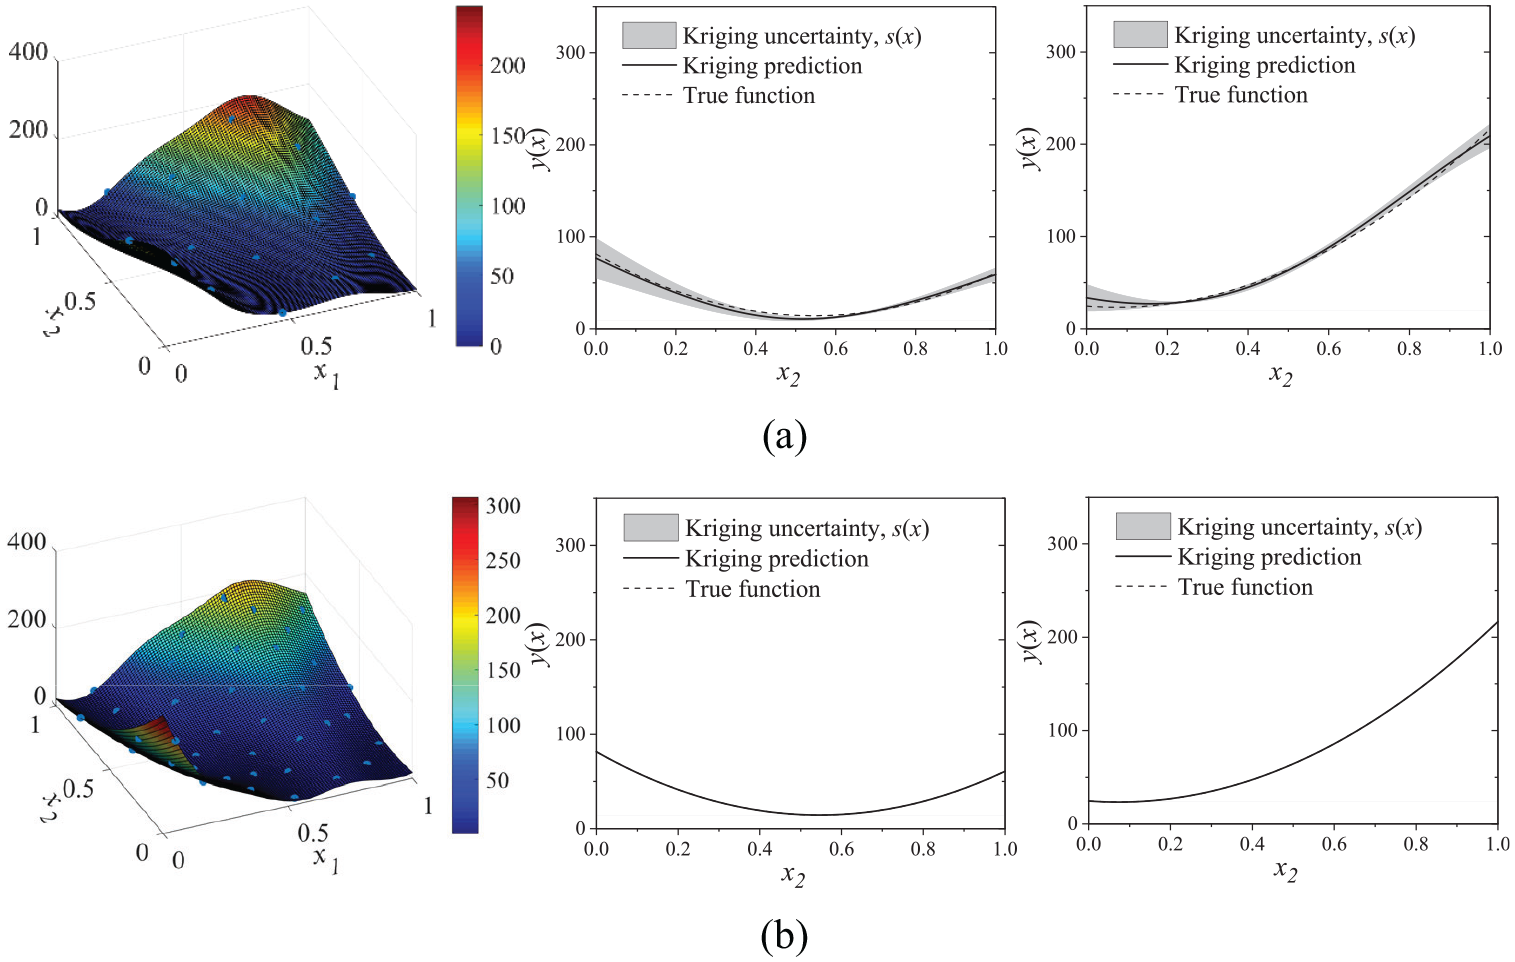
Function II is the Branin-Hoo function, expressed as
Where
For Function I, the sample points along their function values are plotted using hollow circles in Figure 9, where the kriging prediction and true functions are given. The uncertainty, s(x), predicted by kriging varies along the parameter domain of x and the bounded uncertainty zones by the upper and lower boundaries along with the prediction curve are hatched with grey, which indicates that the approximated value by the kriging surrogate model is largely positioned in this uncertainty zone. It is noteworthy in Figure 9 that: (1) The uncertainty at the known sample points is zero based on its definition in equation (14); (5) The surrogate model constructed based on a larger data set (set II) has a higher accuracy level than that based on a smaller data set (set I); (3) With sufficient data points, the approximated surrogate model can well catch the nonlinearity of the true function; and (4) As shown in Figure 9(a), the true function may lie along the boundary of the uncertainty zone and it is possible that the true function would go out of the uncertainty zones; however, more data points would ensure a more accurate surrogate model.
For Function II, the two data sets, with data sizes of 16 and 40, are obtained using the optimal Latin Hypercubus method (the criterion is to maximum the minimum distance between points) and marked in the left panel in Figure 10(a) and (b) as blue dots. The middle and right panels in in Figure 10(a) and (b) show the sectional results with x1 = 0.25 and x1 = 0.75, respectively. It is clearly observed that: (1) The uncertainty associated with the data size of 40 is much smaller than that with the data size of 16; (2) The true function lies within the uncertainty zones as expected; and (3) The prediction power equipped by kriging model is well exhibited in this case such that the nonlinearity of Function II can be largely captured.
Surrogate model construction
As demonstrated in the tested benchmark functions, the uncertainties between the Gaussian model prediction and corresponding true function are successfully calibrated by the constructed surrogate model. Therefore, it is highly desirable to utilize the kriging model to quantify the effects of geometrical parameters on the aerodynamic properties.
Based on the summarized key parameters of the truss structures, B/D and Φ, in Tables 1–3 and the experimental cases in Table 4, the ranges of the parameters are determined from 1.0 to 2.2 and from 0.20 to 0.40, respectively. In addition to the experimental results conducted in this study, the aerodynamic coefficients with the wind attack angle α = 0° for two more cases, Yujiang bridge and Mingyuexia bridge, are included and they are CD = 0.612, CL = ‒0.263, CM = ‒0.042, and CD = 0.674, CL = ‒0.124, CM = ‒0.022, respectively (He et al., 2016). The main spans of the two bridges are 228 m and 425 m as described in Table 1, respectively. Both of them belong to the category with two main planar trusses.
To facilitate the surrogate model construction, the parameters of B/D and Φ are normalized as (B/D–1)/1.2 and (Φ–0.2)/0.2, respectively. The drag coefficient surrogate model is constructed, whose surface is mostly blue, as shown in Figure 11(a). The results provided by BS 5400 (2000) are also shown in Figure 11(a) for comparison, which is well above the model surface of the drag coefficient by the experiments. Figure 11(b)–(d) show the sectional results with B/D = 1, 1.3, and 1.6, respectively, where the restricted upper boundary given by BS 5400 (2000) is marked as a dash line in each panel. It is noteworthy that the uncertainty provided by the surrogate model in Figure 11(b) is much smaller than that presented in Figure 11(c) and (d). The reason is that there are five data points with B/D = 1, whereas only one data point is available from the experimental scheme with B/D = 1.3 and 1.6. It is also noted that the uncertainty zone occasionally surpasses the prescribed boundary by BS 5400 (2000), see the marked red circle in Figure 11(c). However, as more data points, either from computational or experimental results, are available, the uncertainty zones would shrink toward the true function, leading to more accurate predictions by the approximated surrogate model
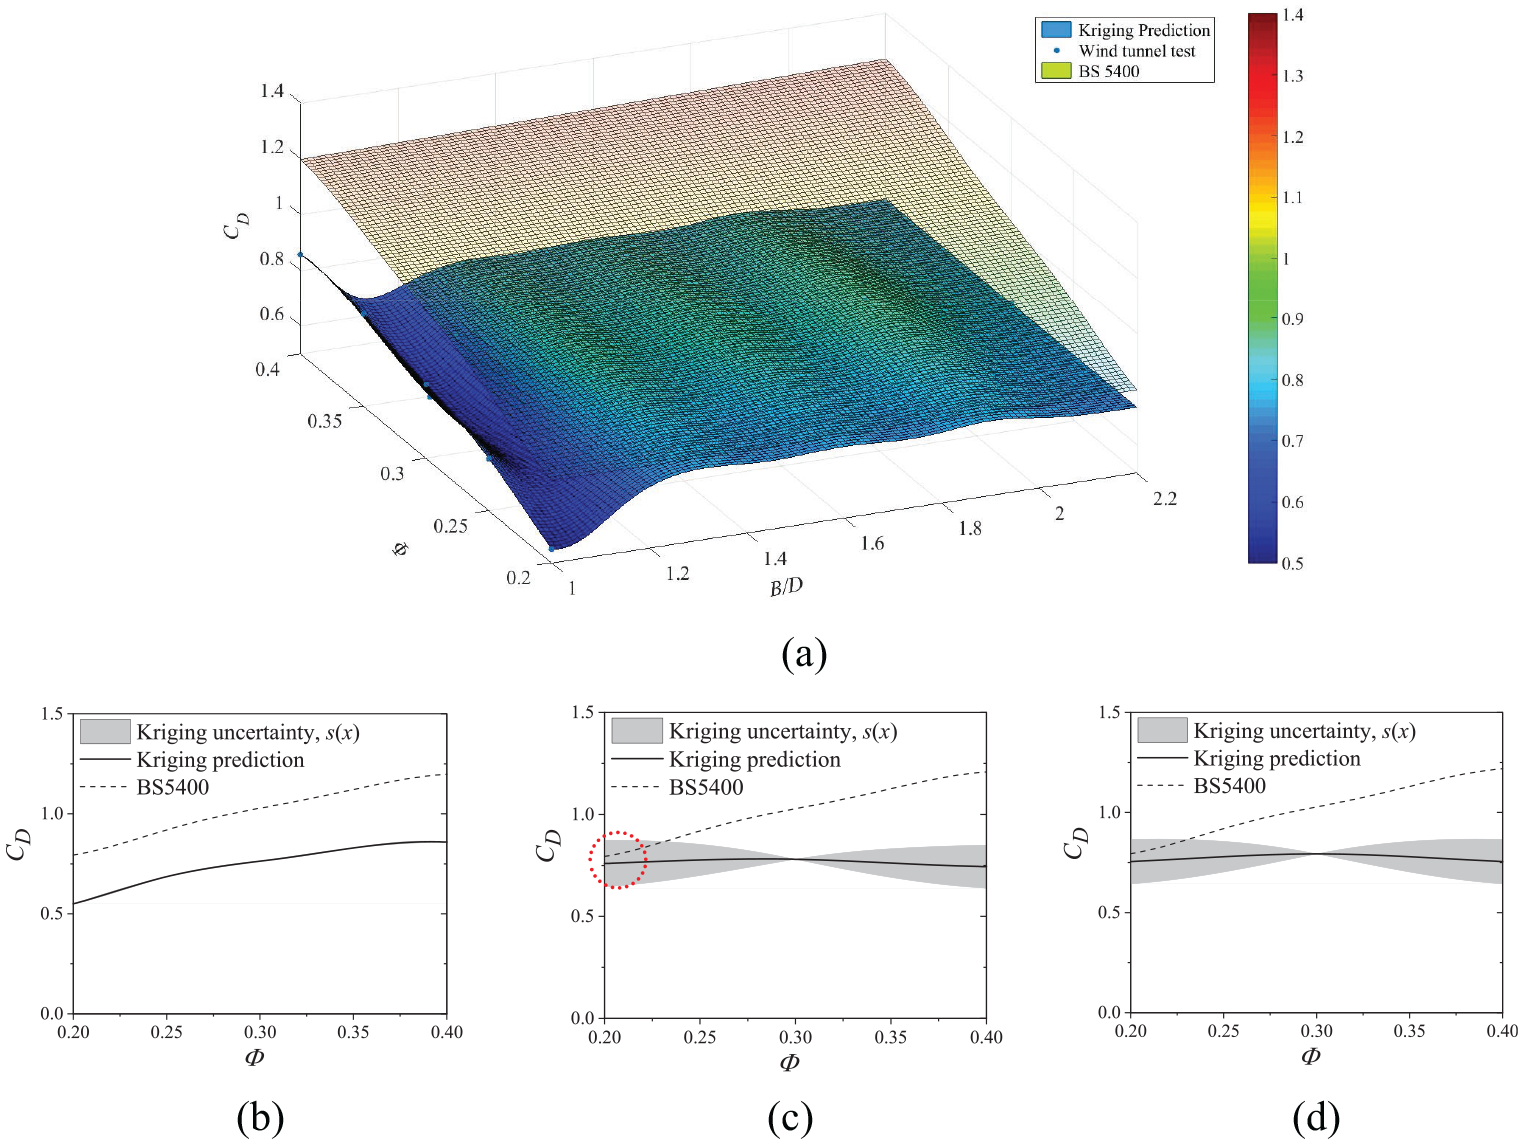
Approximated model for CD: (a) overview of the comparison between constructed surrogate based on available dataset and results from BS 5400, (b) sectional results with B/D = 1, (c) sectional results with B/D = 1.3, and (d) sectional results with B/D = 1.6.
Similarly, the lift and moment coefficient surrogate models constructed based on the integrated data set are shown in Figures 12 and 13, respectively. Comparisons between the latter two surrogate models with the drag coefficient model show that the uncertainties vary more largely in zones far from the sample points with B/D = 1. One reason is that the predicted curves shown in Figures 12(b) and 13(b) are featured with more nonlinearity, see a clear trough near the position Φ = 0.32. In addition, the predictions shown in Figure 12(b)–(d) share similar nonlinearity as they exhibit the similar trough in each curve. This indicates that the prediction power, along with its uncertainty, at unsampled zones may inherit the features provided by zones with denser sample points. However, this would not be the case when data points with more fluctuating quantities of interest are incorporated in the surrogate model construction.
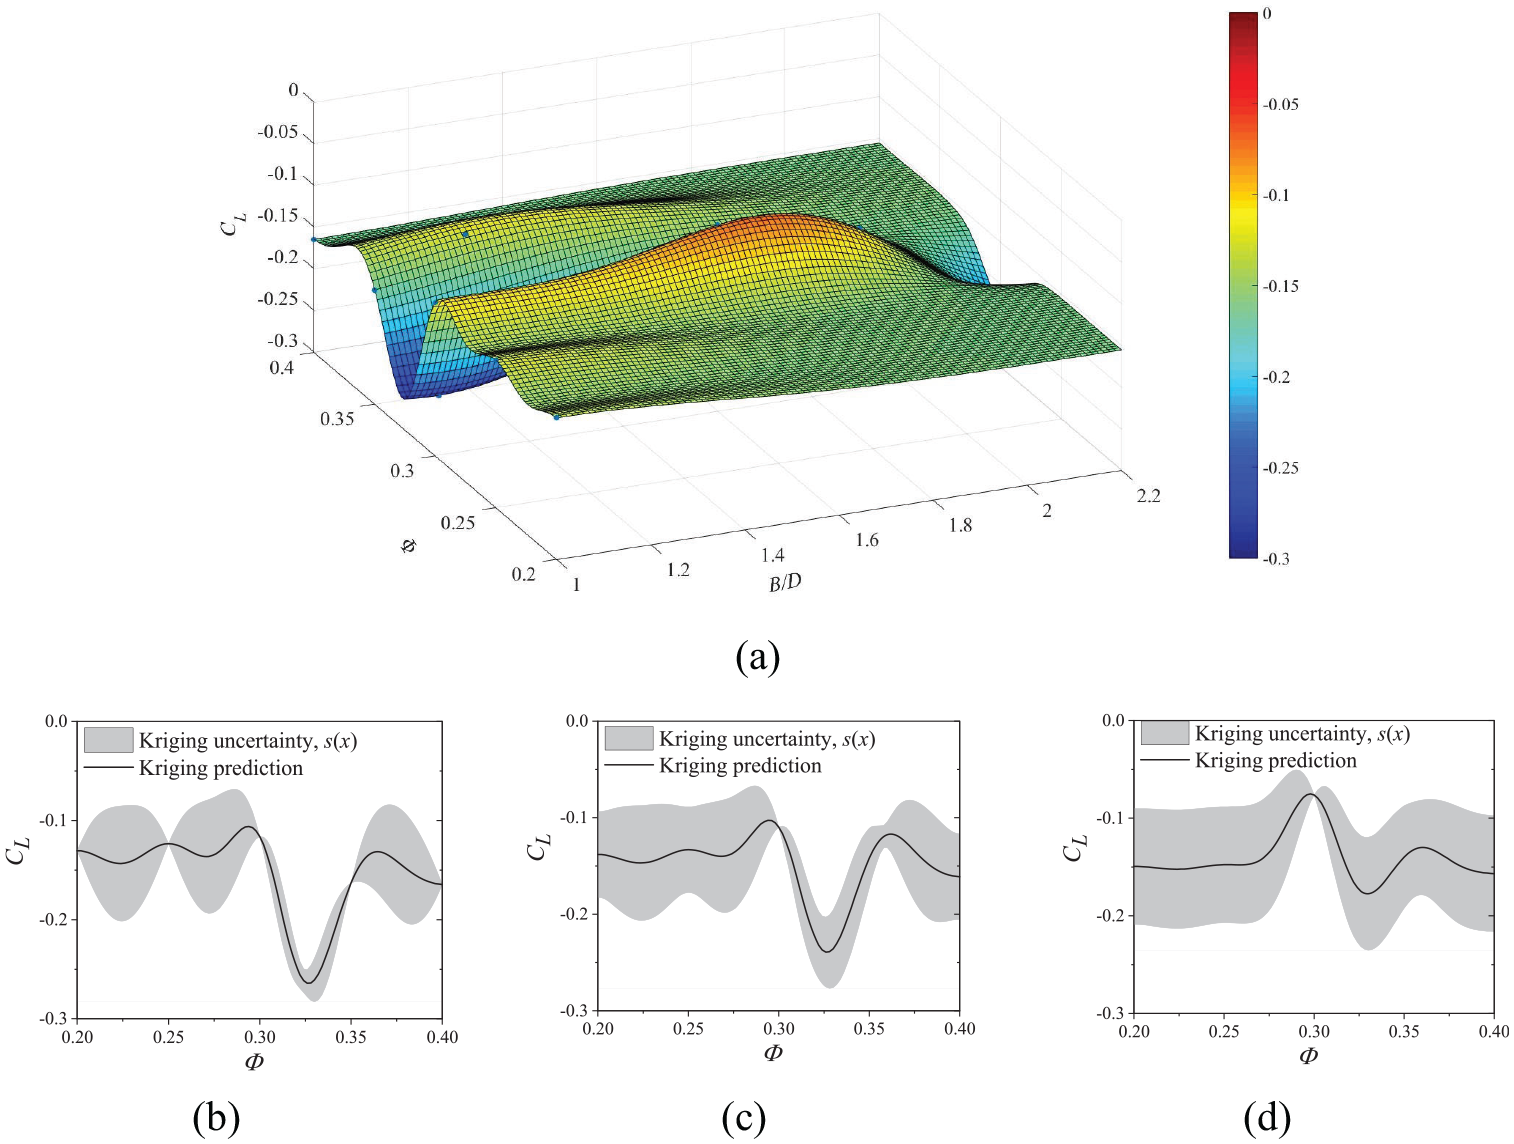
Approximated model for CL: (a) overview of the constructed surrogate model for CL, (b) sectional results with B/D = 1, (c) sectional results with B/D = 1.3, and (d) sectional results with B/D = 1.6.
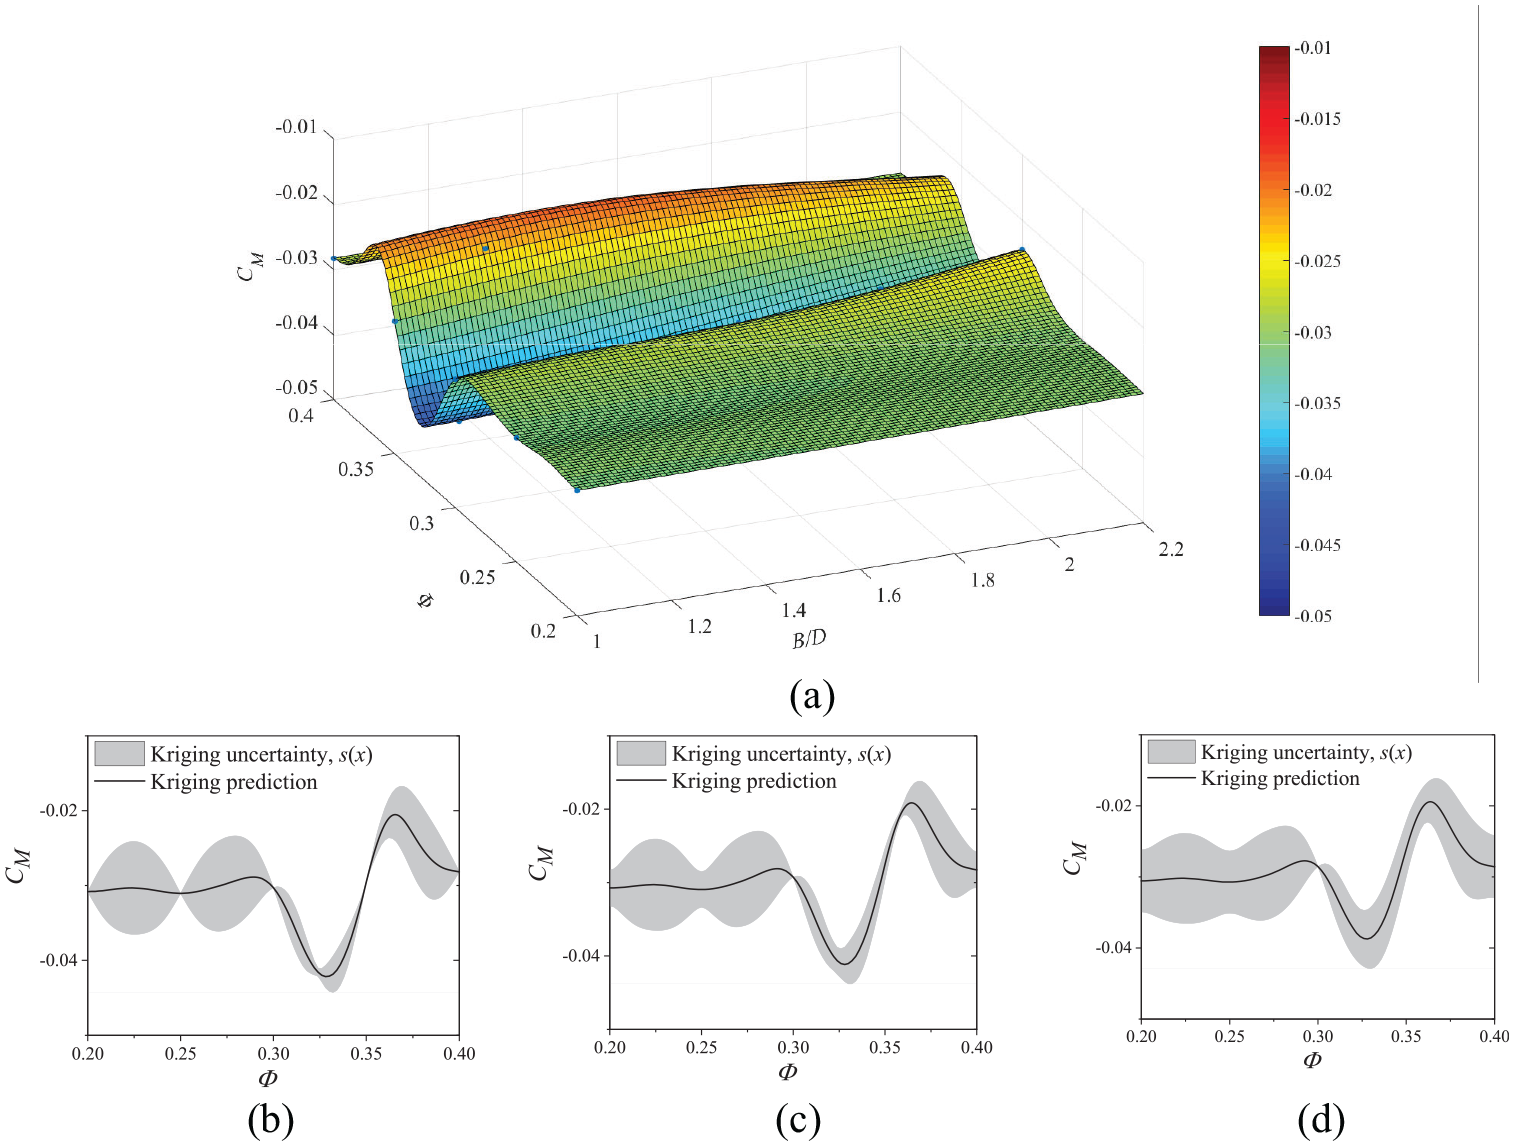
Approximated model for CM: (a) overview of the constructed surrogate model for CM, (b) sectional results with B/D = 1, (c) sectional results with B/D = 1.3, and (d) sectional results with B/D = 1.6.
Currently, the envelopes with upper and lower bounds for the aerodynamic coefficients can be roughly determined by the uncertainty predictions of the approximated surrogate models. This, however, can still provide some highlights for the current codes. As more data points are incorporated in the data set, based on which the surrogate model is constructed, the approximated model surface would be closer to the true function, leading to smaller uncertainties for the surrogate models. Therefore, based on the improved prediction capability and reduced uncertainties by the surrogates, the reliability analysis and future probabilistic analysis on the bridge infrastructures can be quantitatively conducted.
Concluding remarks
In this study, the effects of truss topology, aspect ratio B/D, solidity ratio Φ, and wind angle of attack α on the aerodynamics of truss bridge-girders widely used in Chinese high-speed railway were experimentally investigated and quantified. The tested ranges of truss topology, B/D, and Φ cover almost all the long-span railway bridges in reality. Based on the results of wind tunnel experiments, the Kriging surrogate model was adopted to approximate and extrapolate the aerodynamic features of truss bridge-girders. Based on the results of wind tunnel tests and surrogate model construction, the following conclusions can be drawn:
(1) A review of truss girder railway bridges, widely used in Chinese high-speed railway, is conducted, indicating that the ranges of aspect and solidity ratios are 1.0–3.5 and 0.20–0.40, respectively. Pratt and Warren trusses are two most encountered truss topologies in current engineering practices.
(2) For a truss bridge-girder with two main planar trusses, the effects of truss topology, Pratt and Warren trusses, on its aerodynamics are very limited.
(3) The wind angle of attack, solidity ratio, and aspect ratio have significant effects on the aerodynamics of truss bridge-girders. Within the most concerned range of α = [–6°, 6°], CD minimizes at α = 0°, and generally rises with α departing from 0°. With an increase in Φ, CD grows up highly coincided with the design code BS 5400 (2000). The influences of α and Φ show similar effects on CL and CM, while the effects of the aspect ratio show a strong dependence on the range of α.
(4) The Kriging surrogate model is successfully applied in the quantification of aerodynamics for truss bridge-girders and is proven to be an efficient tool in aiding engineering problem-solving processes. Uncertainties can be provided by this surrogate model, allowing comparison and validation with the current specifications.
In the future study, more wind tunnel experiments are needed for supplying sufficient data input to feed the surrogate model construction, leading to smaller uncertainties in the quantification of aerodynamics for truss bridge-girders.
Footnotes
Declaration of conflicting interests
The author(s) declared no potential conflicts of interest with respect to the research, authorship, and/or publication of this article.
Funding
The author(s) disclosed receipt of the following financial support for the research, authorship, and/or publication of this article: The support of National Key R & D Program of China (2017YFB1201204), Project of Science and Technology Research and Development Program of China Railway Corporation (2015G002-C, K2018G058), and National Natural Science Foundations of China (51925808, U1934209) are gratefully acknowledged.