
Abstract
The main objective of the transverse joint between prefabricated full-depth precast concrete deck panels is to prevent the relative vertical movement between the panels and to transfer the loads between adjacent panels without cracking. The most common failure mode for these types of joints during their service life are the interface cracks. Such cracks serve as a conduit for ingress of water into the superstructure, leading to further deterioration requiring frequent maintenance. UHPC is known for its high tensile and bond strengths and is often considered as a joint fill material that has the potential to make this connection more durable. This research has been initiated to investigate if closure joints cast using UHPC material can compete with the performance of monolithic deck systems. The experimental program consisted of two full-scale concrete bridge decks that were statically tested until failure. One bridge deck was a jointed panel deck (JPD) consisting of two half-size panels connected by UHPC closure joint, while the control deck was a full panel deck (FPD) cast as one monolithic specimen. Both decks were connected to the steel girders with UHPC shear pockets that contained four to six shear studs welded to the girder flange. The JPD had rectangular tapered shear pockets and the FPD had circular shaped pockets. The results indicated that the JPD and FPD reached the same ultimate loads, and both failed via concrete punching at the load point situated adjacent to the closure joint of JPD. The results demonstrated that using UHPC closure joint resulted in similar performance and behaviour under loading as the monolithic deck. The interfacial failure was not indicated even at ultimate loads. This confirms the ability of the UHPC closure joint to transfer the load to the adjacent panel. The results also indicated the use of circular or rectangular pockets led to similar behaviours.
Introduction
Cast in place (CIP) concrete bridge deck is widely used due to its low cost and ease of construction. Meanwhile, CIP is susceptible to degradation in strength and low durability over time, which increases the cost of repair and replacement (Abo El-Khier and Morcous, 2021; Abokifa and Moustafa 2021). The most efficient method of bridge construction with minimal traffic closures is known as Accelerated Bridge Construction (ABC). It utilizes precast concrete bridge components cast in advance of onsite assembly (Culmo 2009; Graybeal 2014; Yamane et al., 1995). ABC designs save valuable time in the project schedule and improve casting conditions since the major concrete elements are cast in environmentally controlled concrete plants, independent of the onsite work (Ma et al., 2016). The full-depth precast concrete deck panels involve design of several components: deck panels, longitudinal and transverse joints, and shear pockets (Shahrokhinasab and Garber, 2021). The transverse joint is more critical as it is subjected to shear and tensile stresses in the longitudinal direction (Liu and Schiff 2016). The main design challenge in ABC system is to make sure that the cast in place connections between the precast concrete components will result in fully composite system. Therefore, the weakest link in ABC systems is the construction joint which can affect the overall bridge performance (Abokifa and Moustafa 2021). The typical connection is grout filled accompanied with/without post tensioning using hooped or straight bars. The post tensioning is typically used for the transverse joints only (Shahrokhinasab and Garber, 2021).
Recently, ultrahigh performance concrete (UHPC) has been proven to be a successful joint fill material due to its outstanding mechanical properties, low permeability, and high durability (Haber et al., 2018). UHPC is fiber reinforced cement composite material that provides a superior mechanical property such as compressive strength over 125 MPa, cracking tensile strength at least 5.2 MPa and a sustained post cracking tensile strength at strain at least 0.0025 (Muzenski et al., 2023). Use of UHPC also enables the reduction of the width of the joints and simplifies the reinforcement details. Since UHPC has fine aggregates, the mixture has high flowability and ease of placement, which is critical to minimizing voids in connections. The use of UHPC facilitated the reduction in the width of the joint to 102-203 mm along with straight or looped splices to enhance the performance. Several researchers investigated the UHPC performance for precast bridge decks (Graybeal 2010; Verger-Leboeuf et al., 2017; Semendary et al., 2022). Graybeal (2010) experimentally investigated the fatigue performance of both longitudinal and transverse UHPC joints with the diamond shear key shape. The test results demonstrated that the UHPC joint performed well with no interface cracking or debonding. Verger-Leboeuf et al. (2017) experimentally and numerically investigated the behavior of UHPC joint. The results demonstrated that the slab with UHPC joint had the same stiffness and strength as an equivalent monolithic one with no crack at a load level corresponding to twice the service load. Sayed-Ahmed and Sennah (2015) investigated the performance of the transverse UHPC joint reinforced with glass fiber reinforced polymer (GFRP) bars under cyclic load followed by monotonic wheel load that was applied adjacent to the joint until failure. The results indicated that the transverse joint was effective in transferring the load to the precast panel and the specimens failed in punching shear under loading that exceeded the design load. Recently, Abokifa and Moustafa (2021) investigated the performance of UHPC transverse joints using both proprietary UHPC and non-proprietary UHPC (NP-UHPC) mixes. The load was applied adjacent to the interface at one location. Straight and looped spliced rebars were used and the results were compared. The results demonstrate that NP-UHPC provide comparable results to proprietary UHPC joints. Furthermore, the use of loop spliced rebar enhanced the load distribution across the UHPC joint.
The finding from the previous studies depended on the performance of the UHPC connection using scaled specimens and not the entire system with shear pockets and joints. To the best of our knowledge, the performance of the full scale full-depth precast concrete (FDPC) deck panels with UHPC joints has not yet been investigated. Furthermore, Seibert et al. (2019) inspected some bridges that used UHPC connections in North America over the past 10 years. The authors reported that some bridges that utilized precast concrete deck panels experienced cracks either beside the UHPC connection or in the UHPC connections. This indicates that more research is still needed. This research program focuses on the use of UHPC as the connection fill material in precast bridge deck slab-to-slab joints and slab-to-girder shear pockets. To test the interface bond behaviour and interface shear strength at the joint, an experimental program was developed to compare one bridge deck constructed of two half-size panels and a control bridge deck cast as one full-size panel instrumented and tested statically until failure. Both experimental bridge decks were supported on steel girders. The slab panels were cast as part of real bridge construction projects, and their thickness as well as the joint and the shear pocket details were similar to the real bridge. The panel-to-panel joint experiences two types of forces under traffic load: (1) a vertical shear force that tries to break the bond between the panel and the grout filling the joint, and (2) a bending moment that puts the top half of the joint in compression and the bottom half in tension. In this study, the load transfer was assessed through applying the load on one side of the joint and measure the interface capability to transfer the load to the unloaded side. This type of load configuration represents the first case to assess the capacity of the interface to transfer the load.
Experimental program
The experimental program consisted of monotonic testing of two large scale bridge decks. The control bridge deck will herein be referred as the Full Panel Deck (FPD) since it was cast as one slab. The second bridge deck was constructed of two half-sized panels connected with a UHPC joint and will therefore be called the Joint Panel Deck (JPD). The panels were designed to replicate the bridge deck slab of Eden Lake Bridge in Manitoba and were cast at the same time as the bridge. The Eden Lake bridge is a 35 m single simply supported span bridge with steel I girders and precast prestressed concrete deck panels. The bridge consisted of five steel I-girders supporting 250 mm thick precast panels with a transverse joint and one longitudinal joint over the middle girder as shown in Figure 1. The same transverse joint details utilized in the bridge were used in the experimental program. Eden lake bridge: (a) Bridge cross section; (b) View of bridge deck panel with connections.
Precast deck details
The dimensions of the FPD measured 4890 × 2965 × 250 mm. The individual panels of the JPD measured 2380 × 2965 × 250 mm, and the dimensions of the full JPD deck were identical to the FPD. The concrete used for the bridge decks had a compressive strength of 45 MPa. Figure 2 shows the deck slab casting at the precast plant. The decks had bottom and top mats of 20M and 25M bars as the main reinforcement spanning between shear pockets, and 15M bars in the longitudinal direction. The shear pocket blockouts had bent bars surrounding the openings for support. Exposed aggregate surface preparation was used for both the shear pockets and the joints because it was proven to enhance the bond with cast in place UHPC (Semendary and Svecova 2020). A retarder was placed first on the wooden form before casting concrete and later pressure washed after demolding. JPD half panel: (a) formwork with shear pocket blockouts and reinforcement; (b) finished JPD half panel.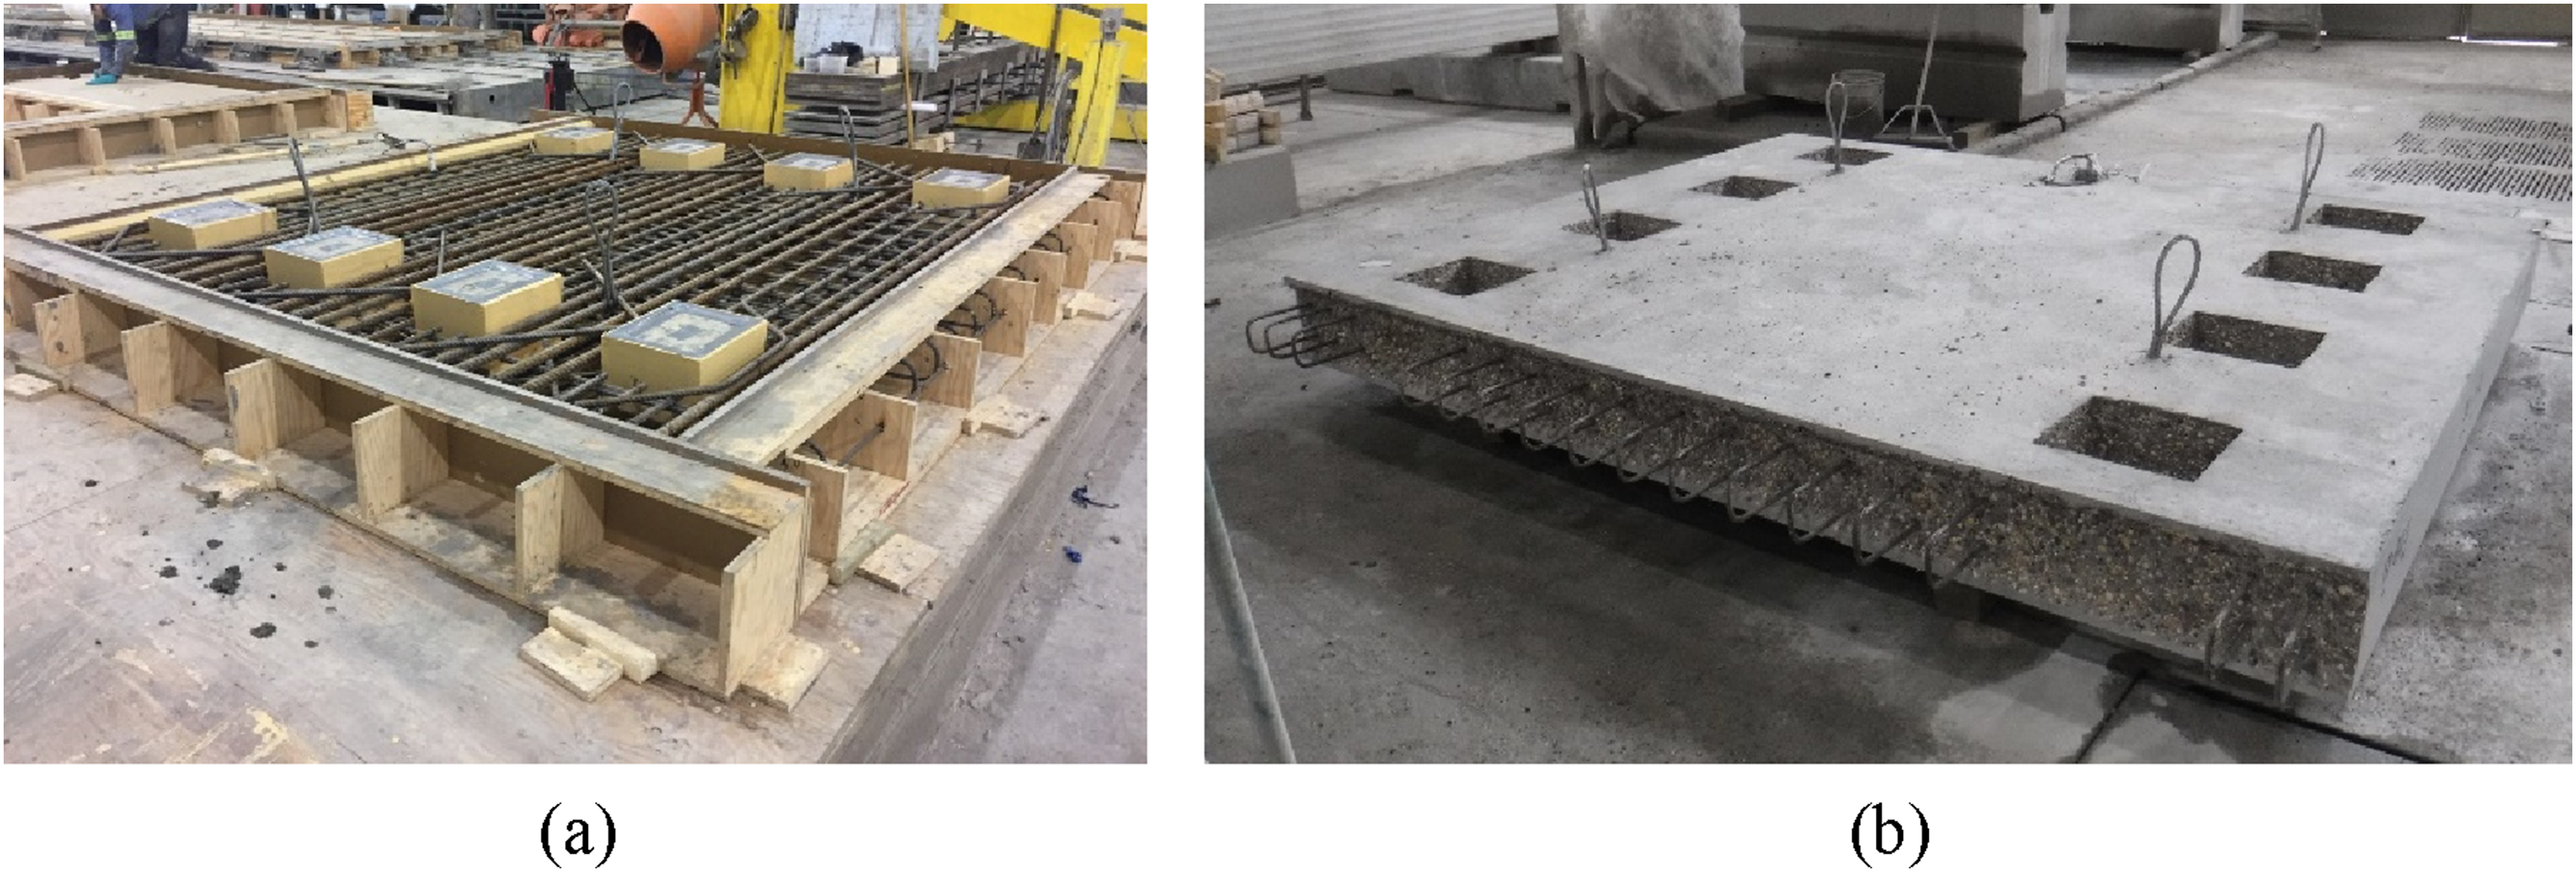
The transverse deck-to-deck joint layout was the same as one used at the Eden Lake Bridge. Figure 3(a) shows the geometry of the joint. The joint was reinforced with 10M hooked bars that were extended in the joint 150 mm. The lap splice length was 120 mm. There were 25M and 20M bars placed on top and bottom which was used to enhance the flexural capacity in the transverse direction. In addition to these bars,15M bars were placed between the end of the hooks, as shown in Figure 3(b). The 10 M hooked bars were spaced at 150 mm on-center (o/c), with an offset between panels such that the bars ended up having a spacing of 75 mm o/c in the joint. The hooked bars were placed at depth of 78 mm and 171 mm from the top respectively. For simplicity Figure 3(b) only shows the spacing of the 10M hooked rebar. JPD transverse deck joint dimensions and reinforcement details: (a) Shear key; (b) Reinforcement.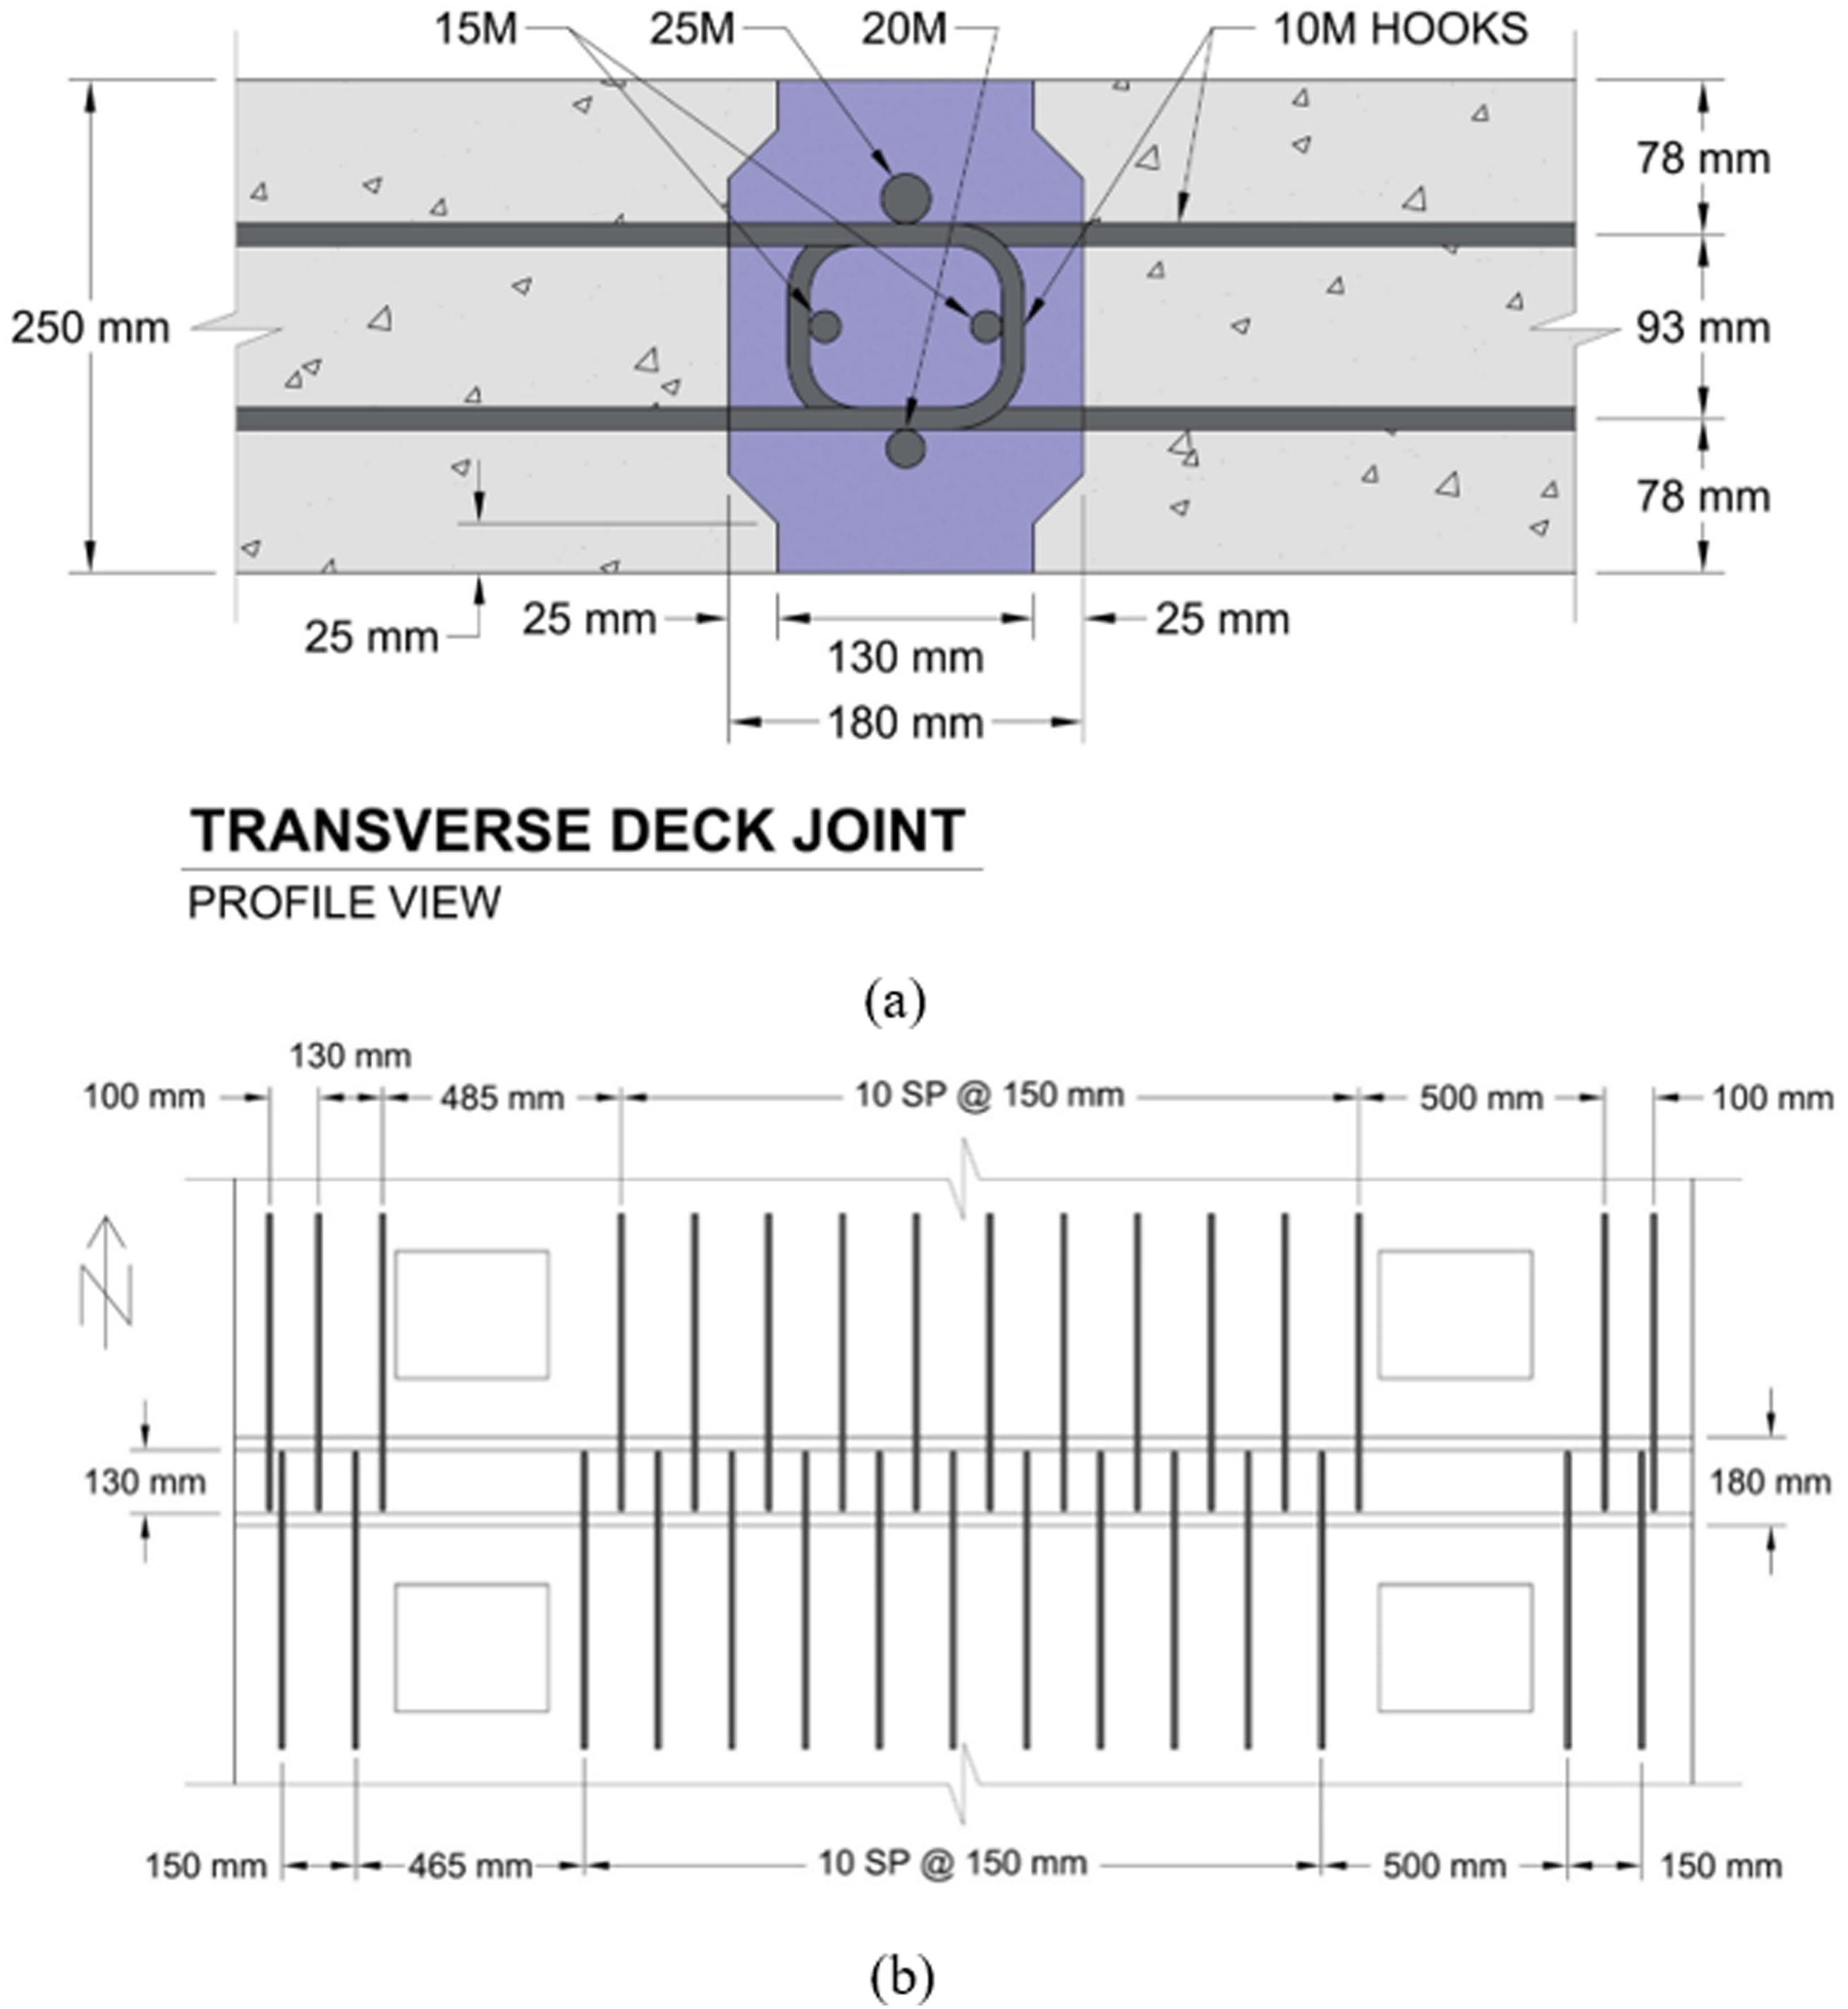
Figure 4(a) shows the shear pocket dimensions for the JPD specimen. The shear pocket was tapered for design requirements from one side only and had a cross section of 310 mm × 260 mm at the top of the slab. Foam with the exact dimensions of the shear pocket was glued to the formwork, to create a void in the precast specimens. In the FPD slabs the step of blocking out space for the shear pocket was regretfully omitted. To provide a connection between the support girders and the FPD slab, circular shear pockets were cut after casting the slab. The shear pocket diameter was determined based on spacing of the deck reinforcement so that no rebar was cut by coring the shear pockets. The shear pockets were cut to be 260 mm, the same width as the rectangular ones. Figure 4(b) shows the circular pocket shape with the 4-shear stud grouping. Note that the surface of the pockets was smooth due to cutting but its effect should be minor as other failure modes will likely prevail. The inside surface of the rectangular pockets in the JPD specimen had exposed aggregate preparation that was achieved by using retarder on the formwork that was pressure washed after demolding. The shear pocket layout details including their spacing in two perpendicular directions for both specimens can be seen in Figure 5. The rectangular shear pockets were reinforced with six stud groupings. Studs used in this experimental program had a head with a diameter of 38 mm, a 25 mm shank diameter and total height of 208 mm. The aspect ratio for these studs was 8.32, compared to the value of 4.0 recommended in AASHTO LRFD (AASHTO LRFD 2017). The layout details are shown in Figure 4. Shear pocket layout: (a) Rectangular pockets in specimen JPD; (b) Circular pockets in specimen FPD. Bridge deck shear pocket layout: (a) Specimen JPD; (b) Specimen FPD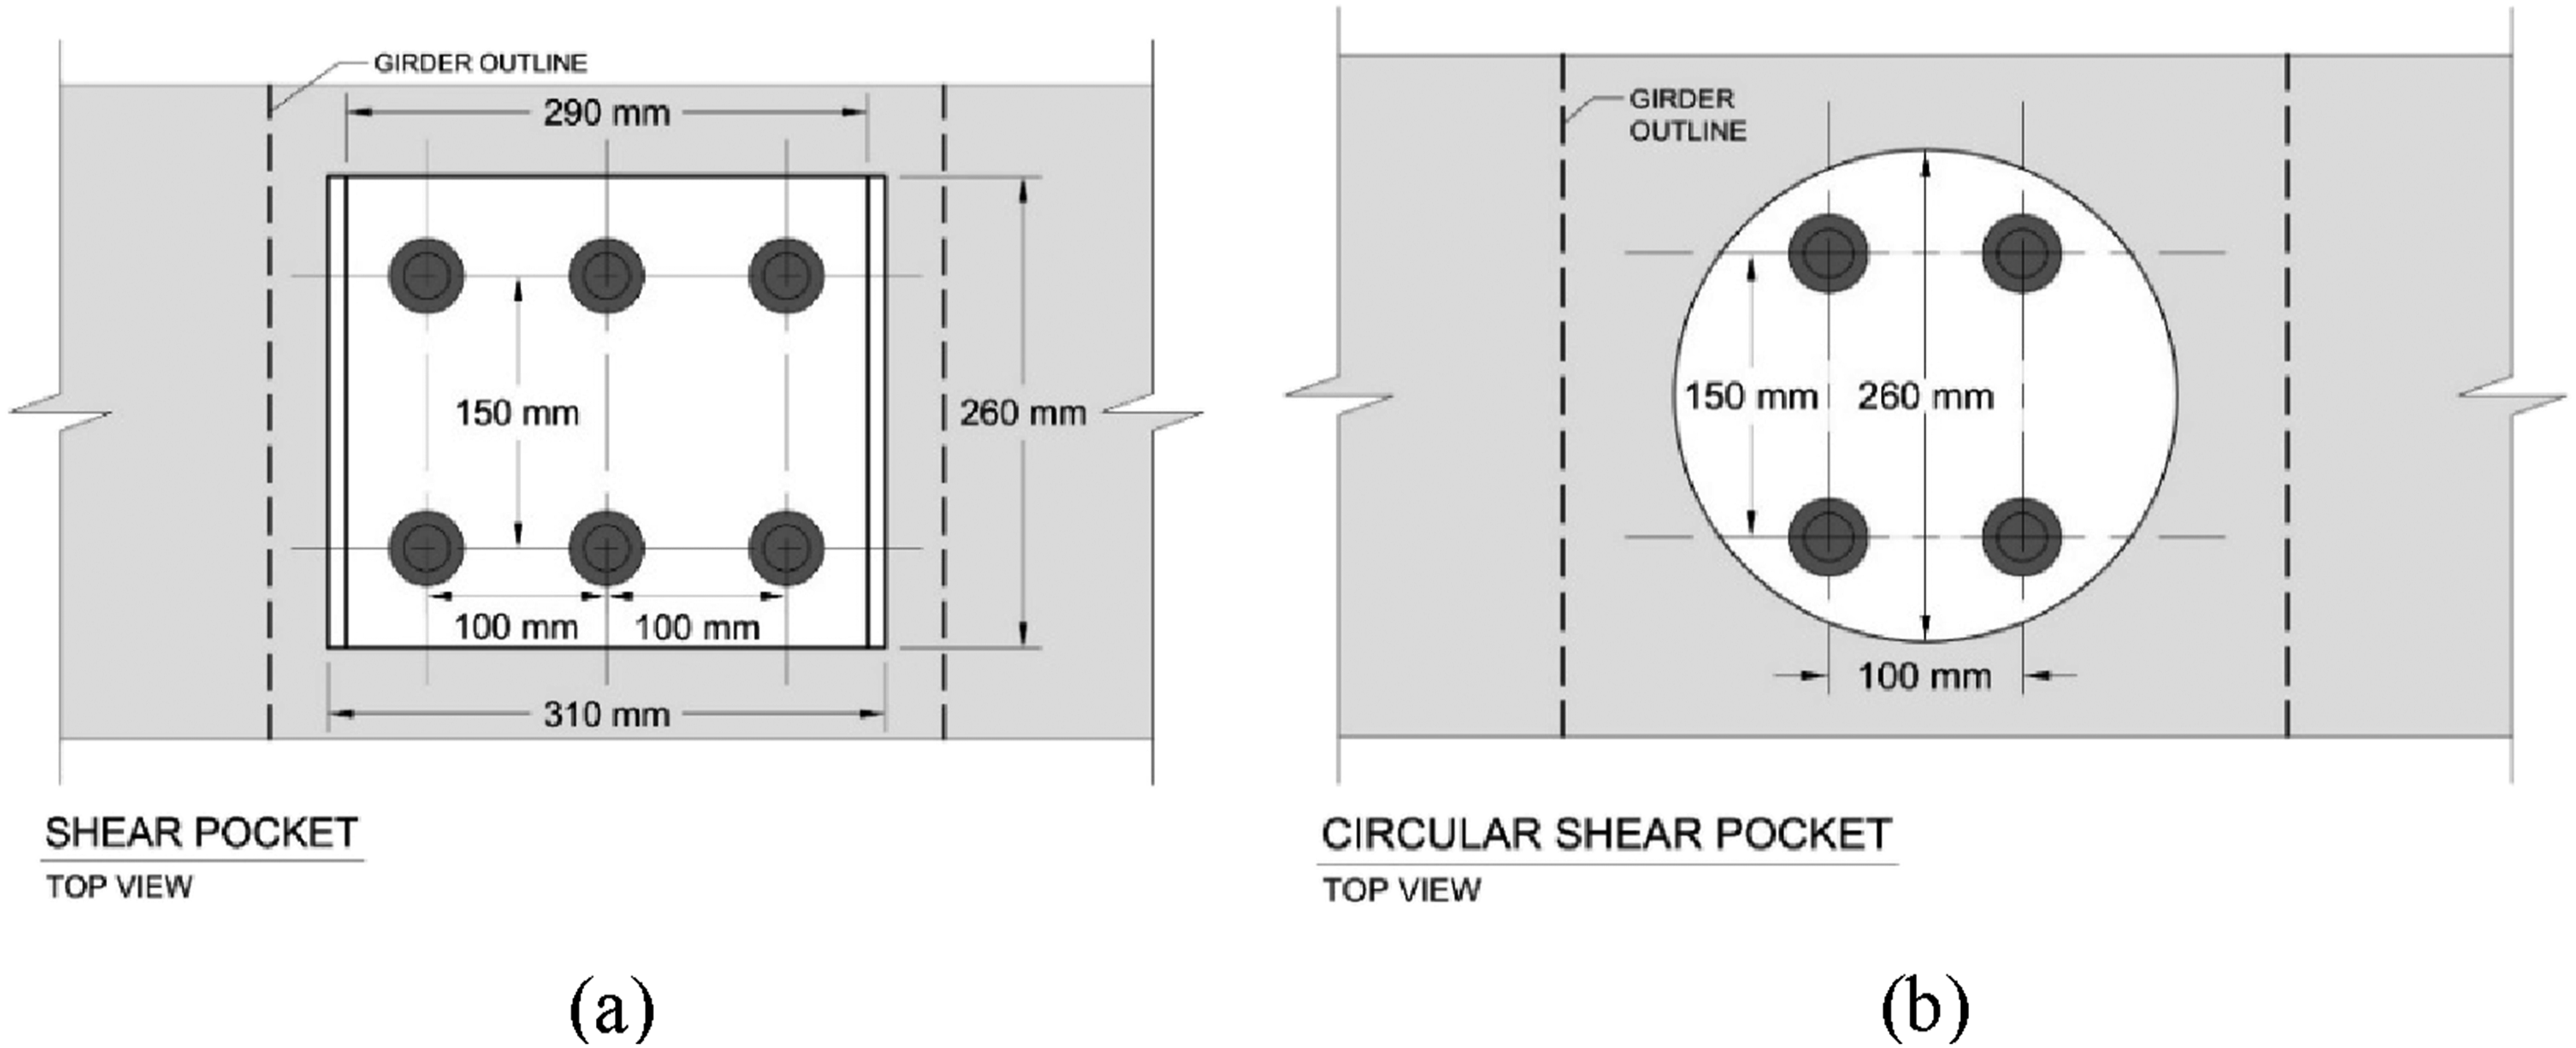

Test preparation and set Up
The slabs were tested monotonically in the structures laboratory at the University of Manitoba. The slabs were supported on a set of simply supported built-up steel beams which were not a part of the investigation and were used for support purposes only. The steel beams were placed on the concrete blocks at each end in order to allow some deformation under loading and to reduce the effect of the rigidity of the support system. The shear studs for each slab were welded on the top of the girders to support the specimens through the UHPC shear pocket. The studs were removed after the testing of the first specimen and new studs were rewelded for another specimen. The girder end diaphragms were designed as required by the geometry of the slabs. The girder spacings were selected based on the locations of the shear pockets of the panels. The diaphragms were used to support the girders during the testing. A point load was applied to each specimen using a built-up load frame in the mid span between the two girder centrelines, as depicted in Figure 6(a) and (b)To maximize the effect of the load on the joint, the loading plate was placed adjacent to the joint interface on one side. The bridge was designed with a 50 mm haunch for leveling between the top of the girder flanges and the bottom of the precast concrete decks. To achieve the haunch, foam was glued to the edges of the girder flanges to contain the UHPC during the shear pocket casting. The foam was 75 mm thick x 50 mm wide, allowing 25 mm of vertical compression to create a tight seal upon deck placement, preventing leakage of the wet UHPC during casting. As the foam would not be able to support the deck slabs unaided, four nuts were welded along the centerline of both girder flanges and A325 bolts were screwed into the nuts to a height of 50 mm from the top of the girder. The UHPC connections were cast in the structural laboratory and a paddle mixer was used to mix the UHPC. Once mixed, the UHPC was transferred into the large concrete crane bucket and the overhead crane lifted it to the bridge deck. The main goal in the bridge deck testing was to understand how the load transfers across the UHPC deck-to-deck joint, therefore, the load plate representing dual tire footprint with dimensions of 610 mm by 305 mm was placed adjacent to the joint interface. The load plate was aligned with the inner face of the joint, rather than the opening as shown in Figure 6(c). A neoprene pad was used underneath the plate to reduce the friction. The bridge decks were tested monotonically until failure. Following the onset of first cracking, crack progressions was marked each 200 kN until a load of 1400 kN for both specimens. Once the load of 1400 kN was reached, it was deemed unsafe to mark the crack propagation and the slabs were loaded to failure. Load setup for deck testing: (a) overall test setup; (b) close-up of load cell and load plate and (c) load plate location.
Instrumentation details and layout
The deck displacements, crack development, concrete strains, internal strains on the rebar in the joint, and the internal strains on the shear studs were measured during testing and recorded using a data acquisition system. Linear Variable Differential Transformers (LVDTs) were placed in two orthogonal directions in each test specimen. Two rows of LVDTs were used along the joint-deck interfaces, seen in Figure 7. Though the figure shows the JPD specimen, the LVDT locations on the FPD specimen are at the same locations. A perpendicular line of LVDTs was mounted along the centreline of the two specimens to monitor the deformation along the line of application of the load. LVDT setup for JPD and FPD.
Pi-gauges were used to read the crack widths on the tension surface of the bridge decks. Two pi-gauges staggered at 20 mm were installed across the joint-deck interfaces on the JPD specimen, as shown in Figure 8. The same layout was used for the FPD specimen for ease of comparison. Once the first crack occurred, a third pi-gauge was placed perpendicular to the first crack. The first crack on both decks occurred underneath the load plate, therefore the pi-gauges are in similar locations as shown in Figure 8. The pi-gauge nomenclature that was used for the program is “PGN” and “PGS” to refer to the gauge across the northern and southern joint-deck interface, respectively. This instrumentation reflects the width of the separation at the interface. The pi-gauges added at the first visible crack are referred to as “PGFC”. Pi-gauge instrumentation layout for test specimens. Sketches are showing the bottom surface of the deck.
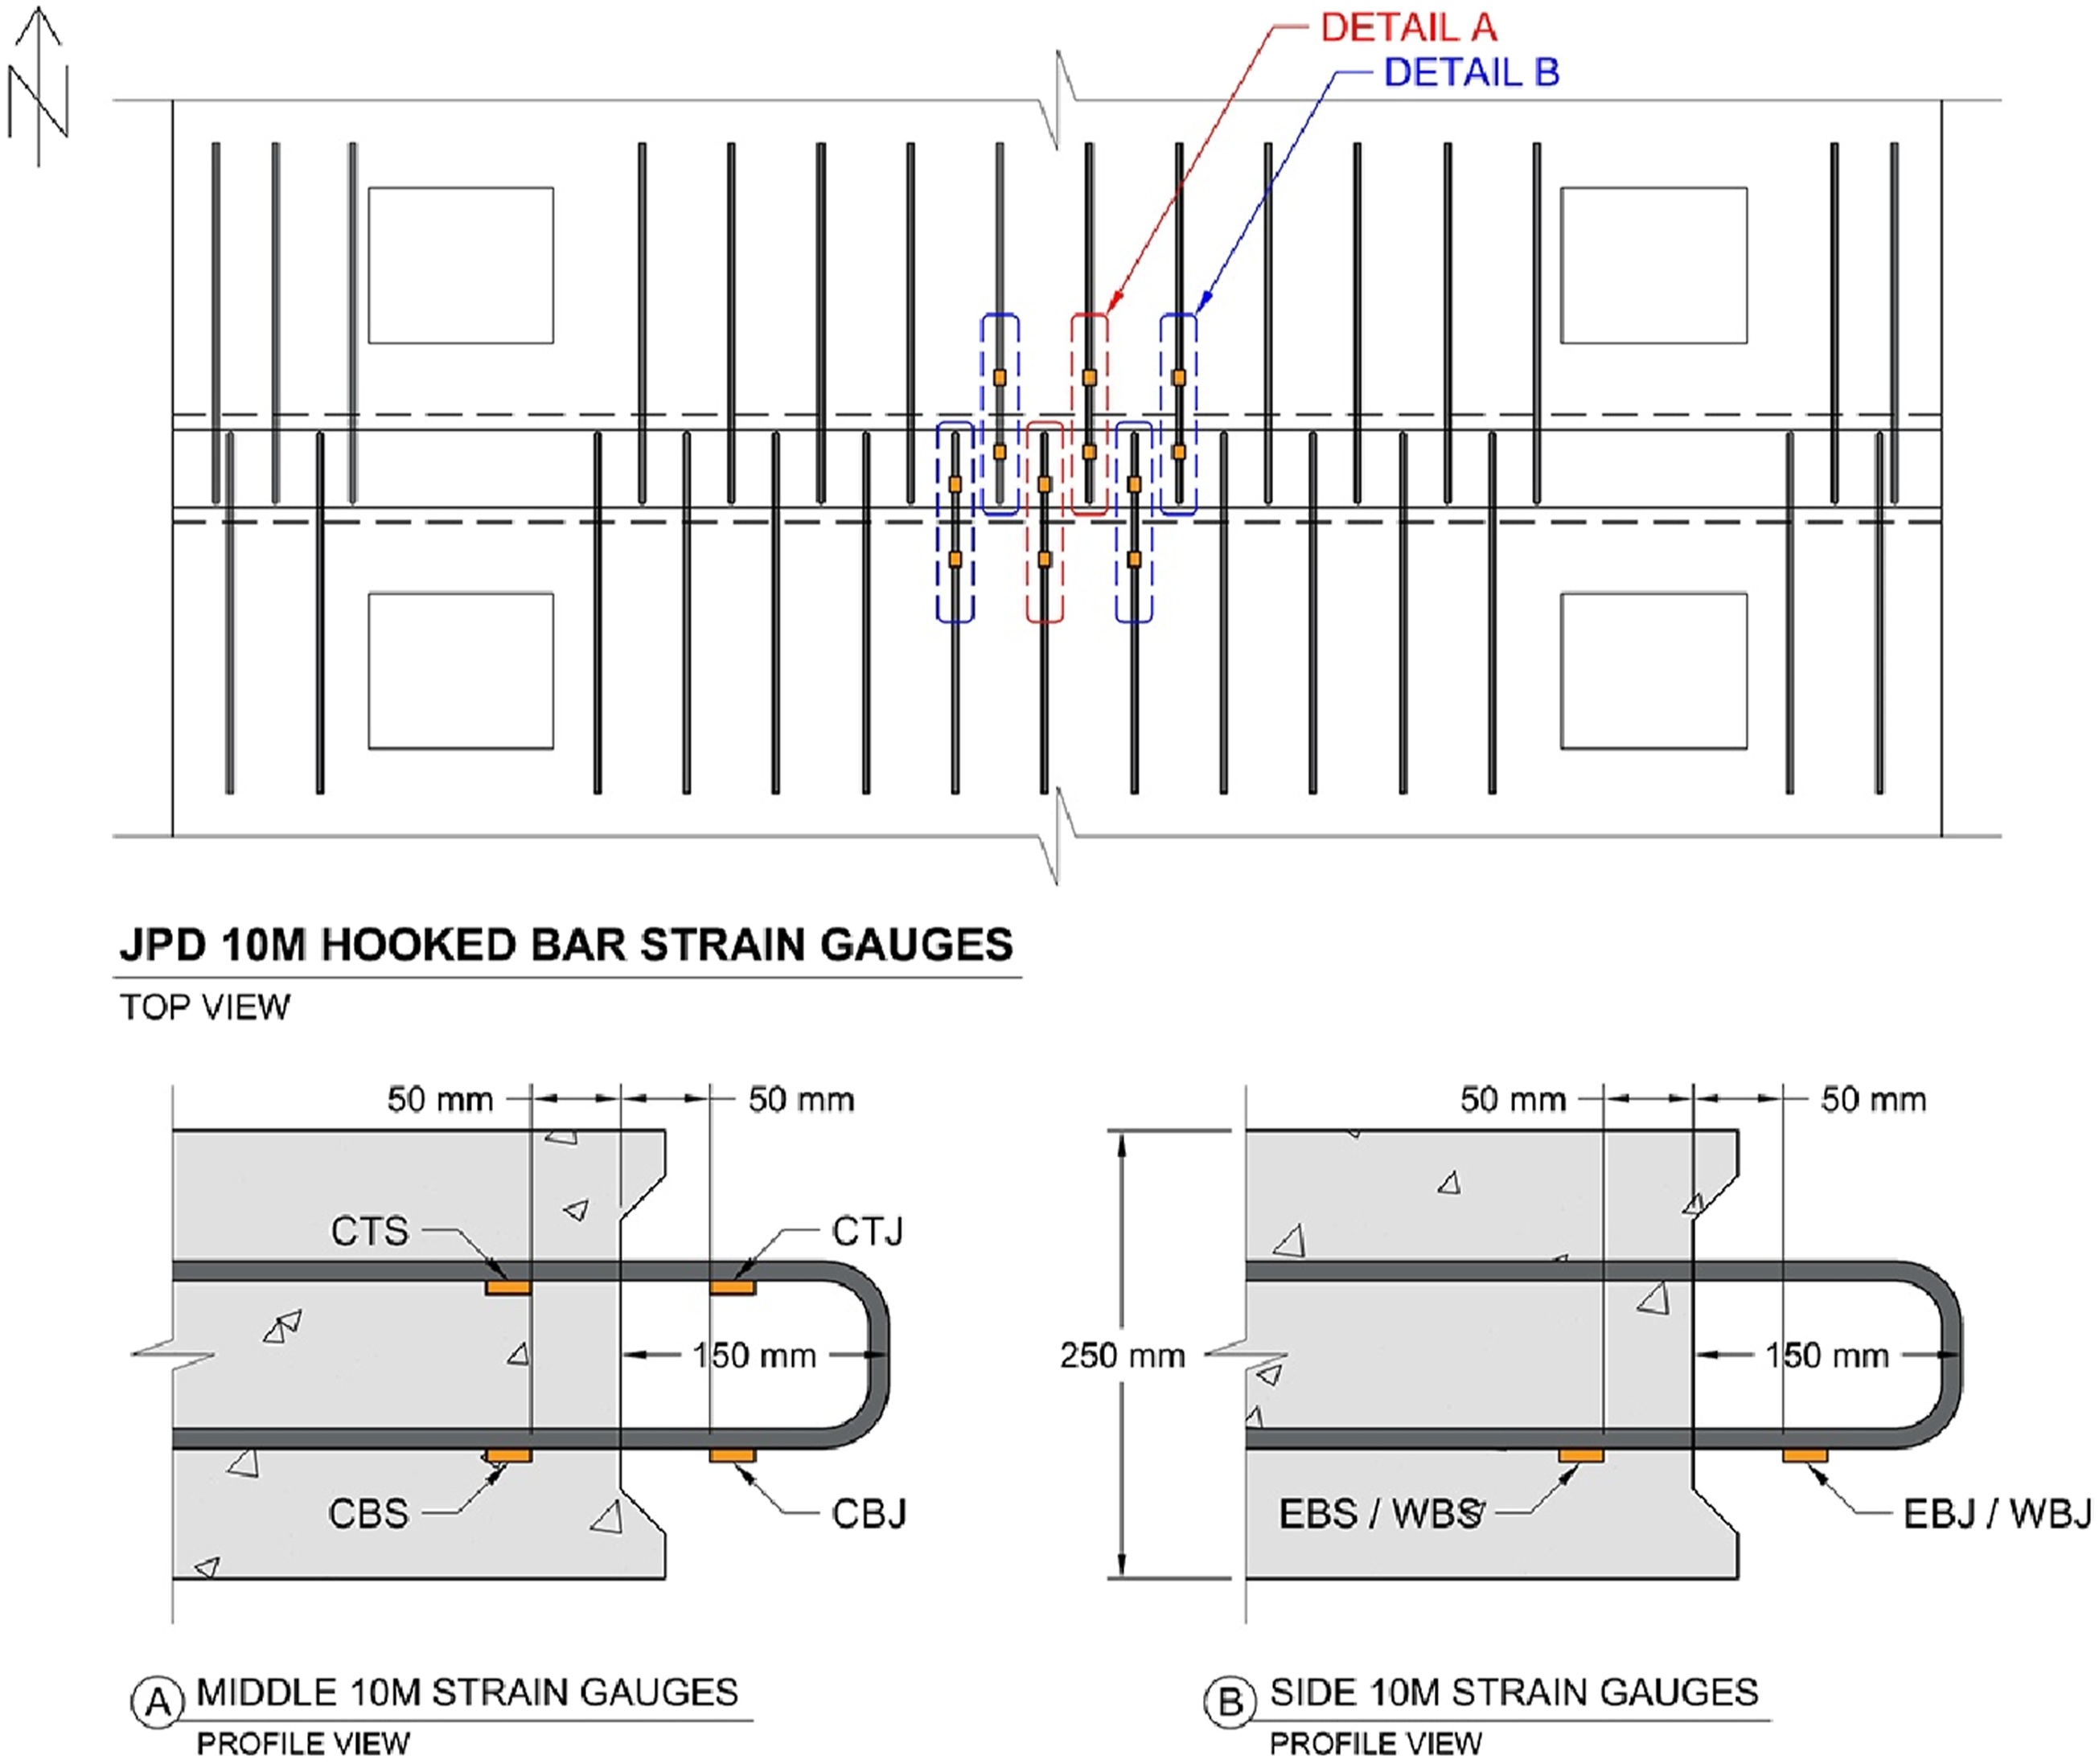
The concrete strains were measured at the surface of the bridge deck with three 200 mm long strain gauges. The gauge locations are shown in Figure 9 and were chosen to monitor the strain adjacent to the joint in the concrete panels and in the middle of the UHPC joint. The same layout was used for both test specimens. Figure 9 illustrates the concrete gauge locations for both decks, including the LVDTs. The concrete strain gauges CSG-N, J, and S are referring to their locations on north panel, joint and south panel, respectively. Three center most 10M hooked bars from each JPD specimen panel were instrumented. The gauges were installed 50 mm from the joint interface within the reinforced concrete (RC) for both JPD panels, and 50 mm into the joint. Detailed locations of the strain gauges are shown in Figure 10. Concrete strain gauge locations on the top surface of the deck. JPD internal rebar strain gauge instrumentation.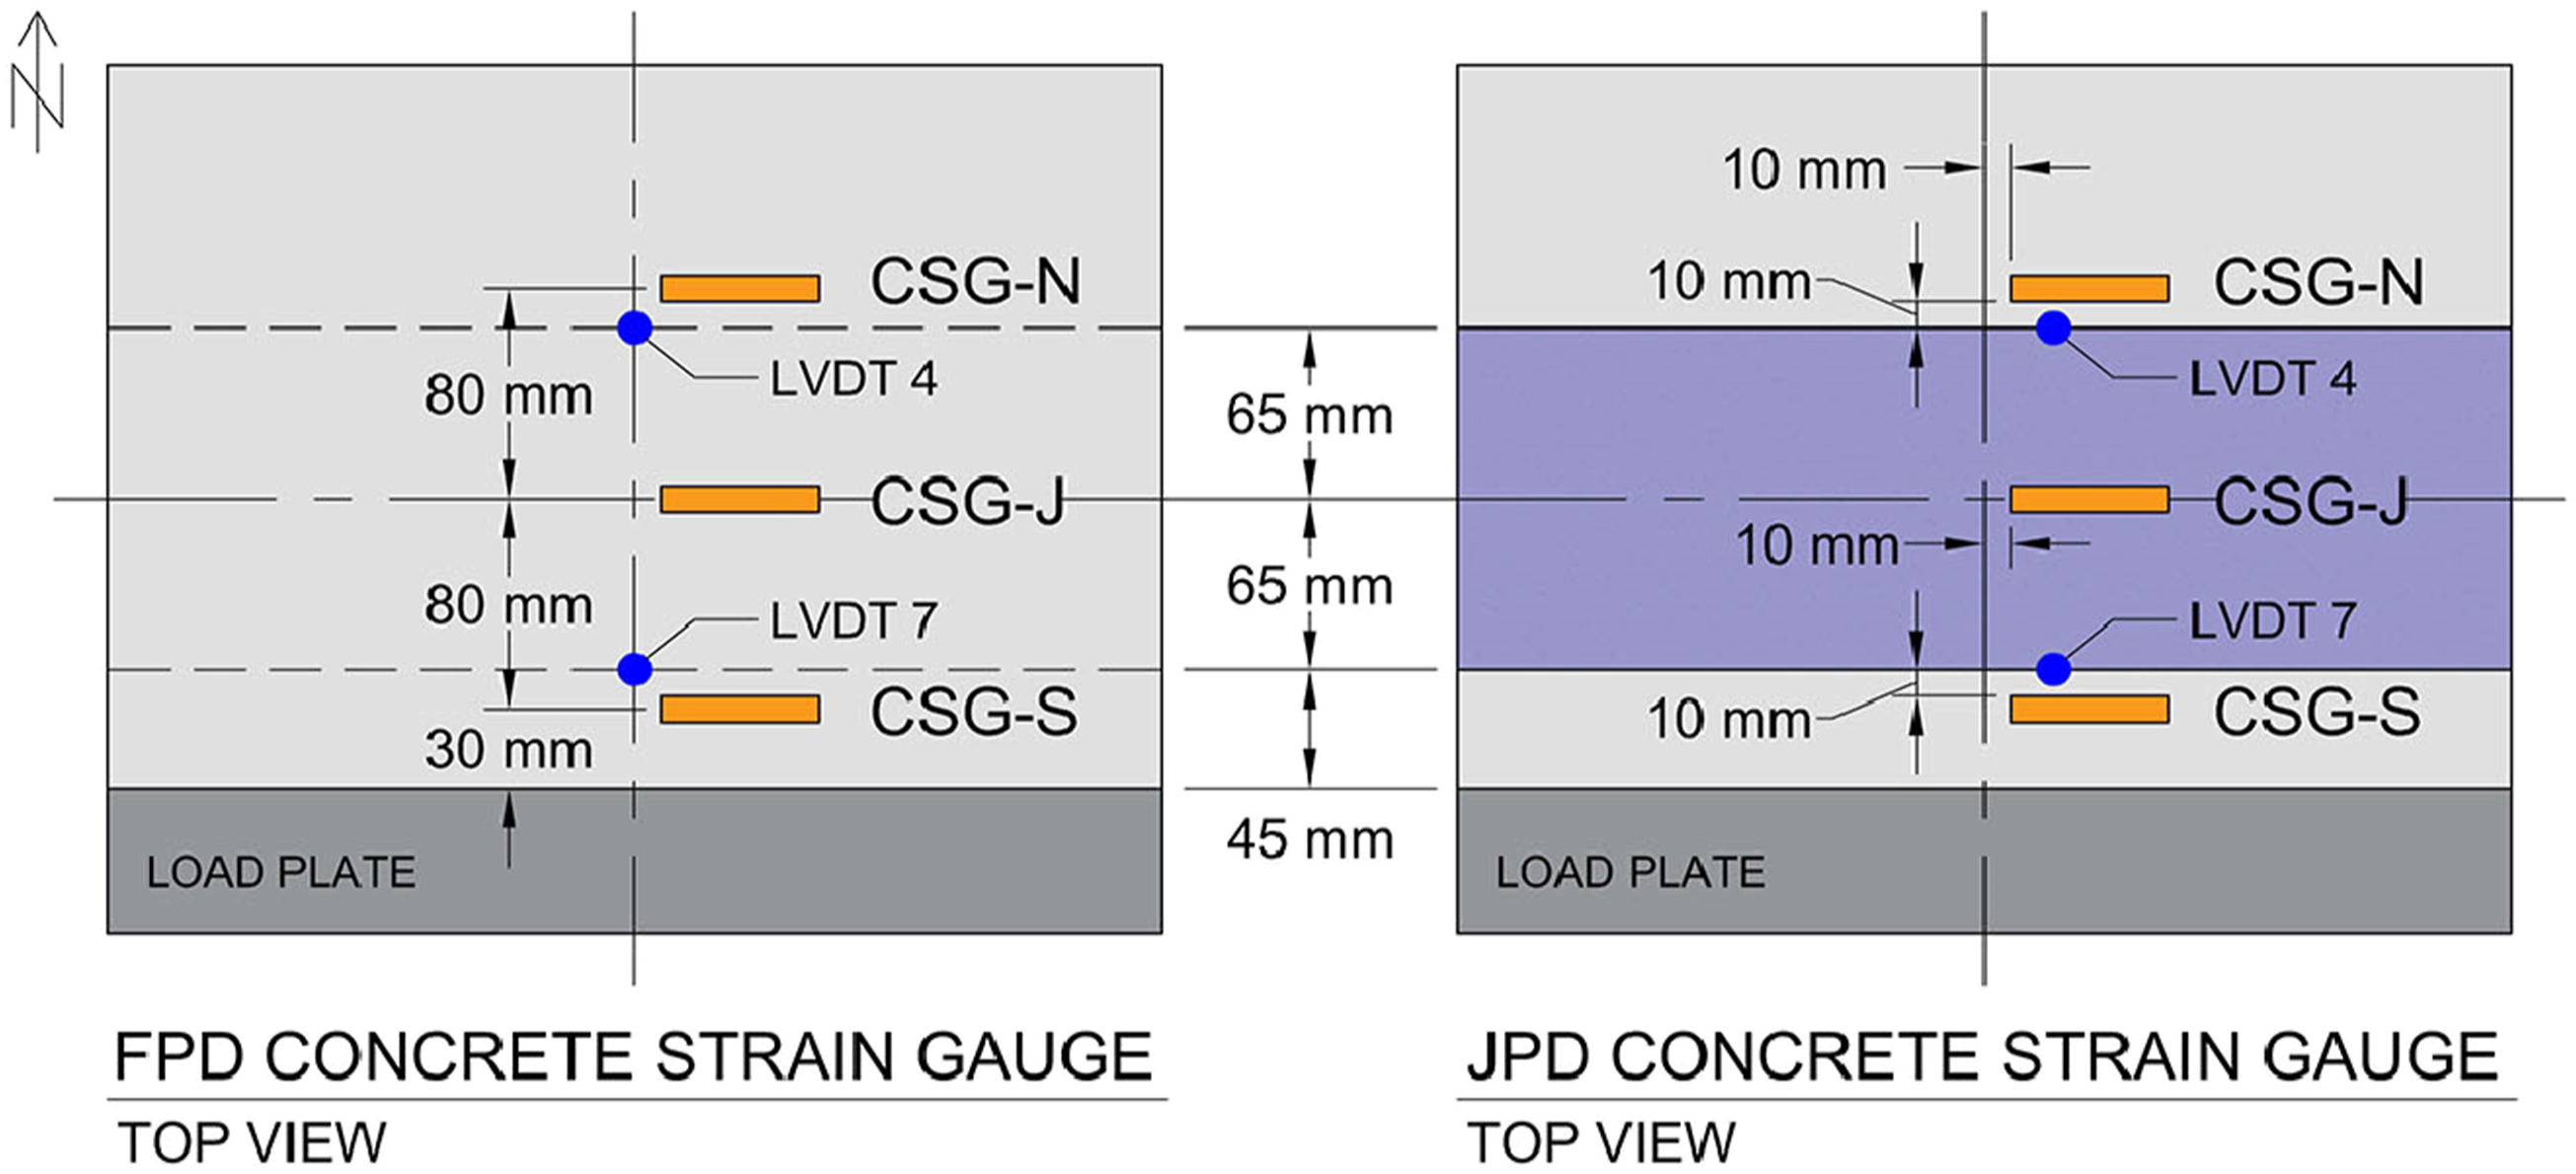
The 4 centrally located shear pockets had each shear stud instrumented with one strain gauge. The gauges were adhered to the surface of the stud facing inwards towards the loading point; the west girder had gauges on the east face of the studs and those on the east girder had gauges on the west face of the studs as shown in Figure 11. The shear studs were instrumented in this manner to face the direction of the applied load. In the results section, the shear stud strain gauges will be referred to by their pocket nomenclature and the stud’s label, as seen in Figure 11. For example, the gauges of the studs in the shear pocket P1 will be P1NE, P1NW, P1SE, and P1SW. Layout of FPD shear stud instrumentation.
Results and discussions
The experimental program test results are analysed and compared to understand the capacity and performance differences between the full panel and UHPC jointed half panels. The results of the individual material testing are also discussed. The results are presented in both graphical and tabulated format.
Material testing
The concrete strength at 28-days was 84.27 MPa, 81.17 MPa, and 84.30 MPa for the FPD, and the JPD North and South panels, respectively. The UHPC from the JPD specimens had an average 3-days and 7-days and day of testing compressive strengths of 105.49 MPa and 132.05 MPa, and 178.43 MPa, respectively. The UHPC from the FPD specimens had an average 3-days and 7-days and day of testing compressive strengths of 60.44 MPa and 72.34 MPa, and 118.26 MPa, respectively. The same mix design was used in both specimens and the low compressive strength that was achieved during the first cast was caused by using a mix that was old. The slightly low UHPC compressive strength in the FPD had a minor effect as the UHPC was used in the shear pockets only. The shear stud strength under both direct shear and direct tension were also measured (Semendary et al., 2022). Three studs were tested in direct shear, and the average shear strength was 319.3 MPa. The failure mode was shearing off the studs. Five studs were used in tensile strength test. The average ultimate tensile strength was 520 MPa. The diameter of the studs was reduced from 25 mm to 17 mm at failure. The resulting yield strength was 433 MPa and corresponding yield strain was 3,840 µε. Therefore, the modulus of elasticity of the shear studs was found to be 112,715 MPa.
Failure modes
To evaluate the performance of the joint during testing, the flexural behaviour was monitored, to evaluate if the bond on the interface between the joint and the precast deck was compromised. The hypothesis was that if the bond was compromised during the test, then the flexural behaviour-in particular the crack pattern, deflections along the joint and failure load and mode would differ between JPD and FPD. The experimental testing confirmed that the flexural behaviour during load application was very similar between the two decks. The JPD specimen and the FPD specimen both failed in punching shear outside the joint. However, a full punch cone was not observed, only large transverse cracks along the underside of the deck, spanning between girders. Figure 12 is a section view along the deck centerline of the main crack of the failure punch cone. The location of the crack was measured, and the angle was determined based on the location of the load plate. The FPD specimen failed within the north half of the deck slab and the JPD specimen failed within the south panel, avoiding the UHPC joint. This shows that UHPC strength and bond with precast concrete was strong enough to shift the failure cone to the adjacent panel. The top of both bridge decks did not show any cracking during testing. - The effect of restraint in the transverse direction may have encouraged the prevalence of punching crack propagation in the longitudinal direction. After testing, the bridge decks were cut for safe removal from the structural laboratory. Two transverse cuts were made to separate the deck into 3 pieces. The transverse cuts were made on either side of the load plate to observe the top of the punching cone. The cut around the load plate location, clearly shows the shape of the top of the failure cone in the transverse direction. The cracking appears to continue over top of the girders, since the cracking does not terminate at the bottom edge of the section on either face as shown in Figure 12(b) and (c). However, there was no cracking seen on the bottom face of the deck on the outside of either support girders, thus it is assumed the width of the crack ends over top of the girders. The same deck cuts were made to the JPD. Comparing the opposing faces of the deck section, there are fewer cracks in the UHPC than the reinforced concrete (RC), and they generally appear to be shorter and wider, whereas the cracks in the RC are all interconnected. There are minimal cracks seen throughout the joint. This behaviour confirms that the jointed deck had comparable performance to the solid deck, as far as the mode of failure and cracking pattern in concerned. (a) Failure crack along longitudinal centerline for FPD and JPD (b) FPD cut section around load plate; (c) JPD cut section around load plate (cut through UHPC joint).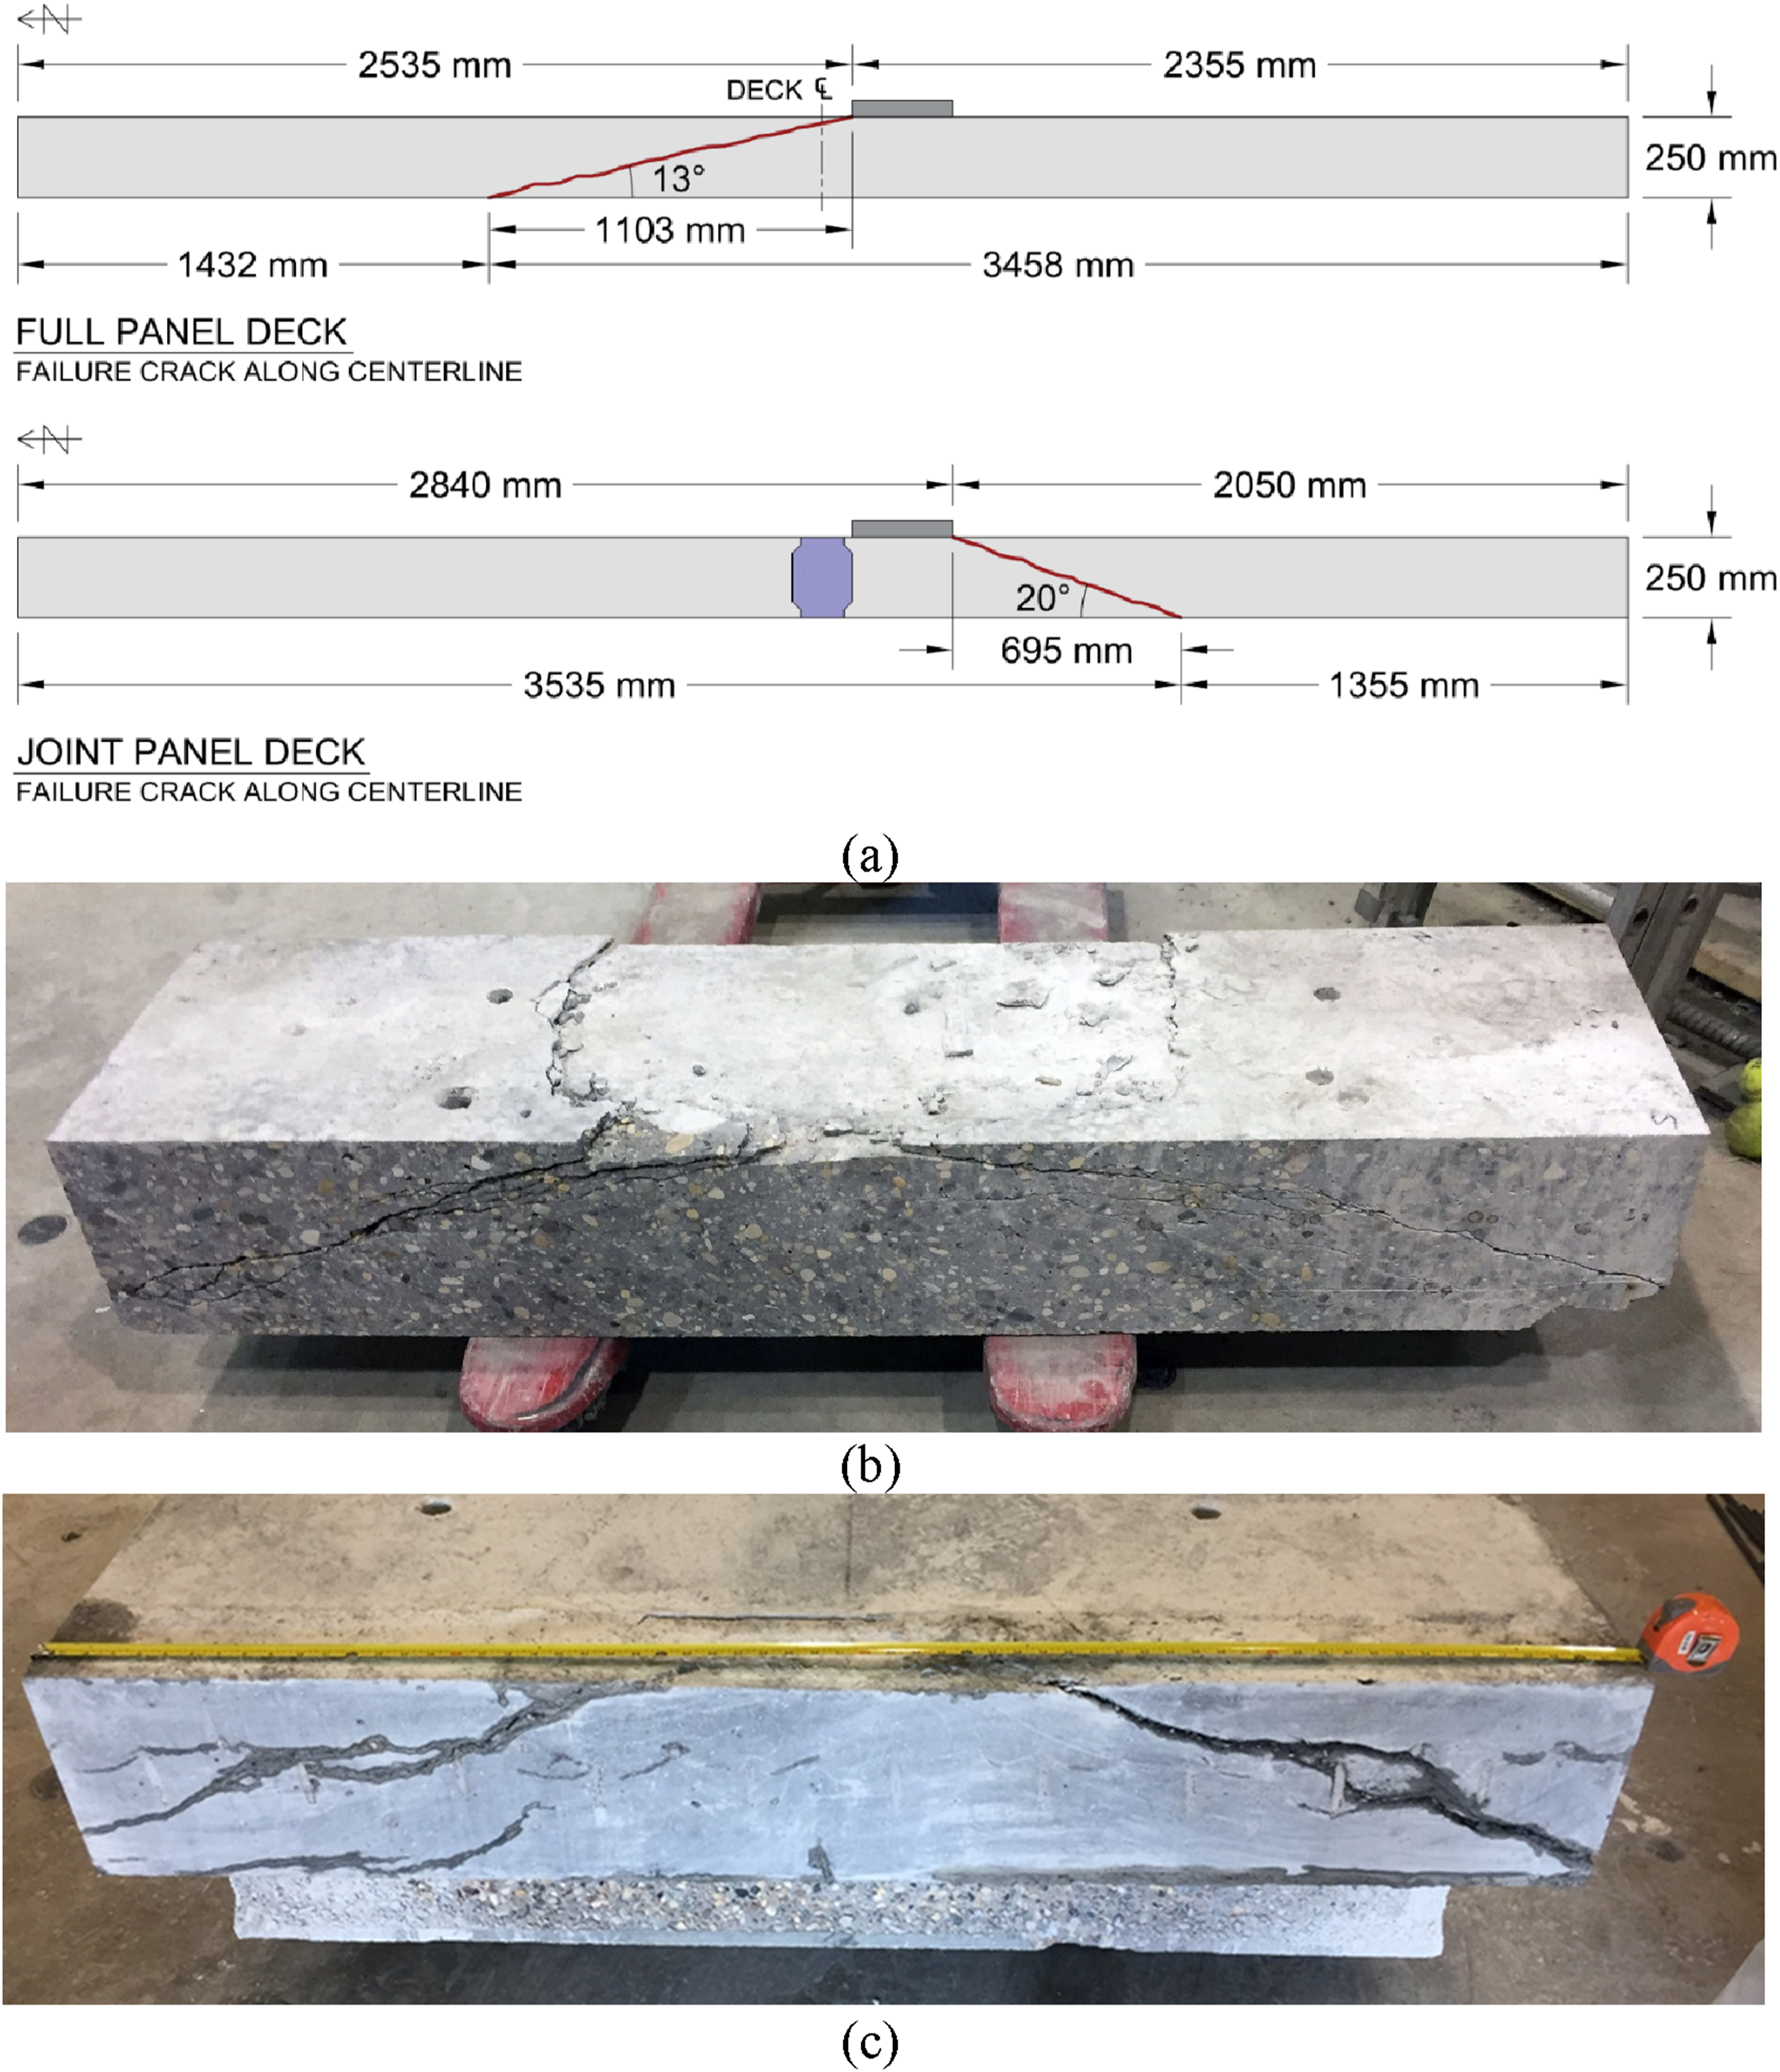
Load deflection behaviours
The deflection results are presented for both bridge decks. A computer software was used to estimate the punching failure loads prior to casting the bridge decks. The values for the geometric properties of the bridge deck, support girders, and load are input into the program. A computer software PUNCH was used to estimate the failure loads prior to casting the bridge decks (Newhook et al., 2016). PUNCH was one of several computer programs in a series of bridge analysis tools developed by team at the University of Manitoba. It is designed to predict the behaviour and failure load of laterally restrained concrete slab-on-girder bridge decks. The PUNCH program applies truck wheel loads from the CHBDC CL-625 design vehicle or the AASHTO HSS design vehicle. The geometric properties of the bridge deck, support girders, and design vehicle are inputted into the program and its algorithm loads the theoretical bridge to failure. The calculated failure load was determined to be punching shear failure at load of 1537 kN. The FPD deck reached an ultimate load of 1926 kN prior to its punching failure with the main cracking plane breaking through the north half of the bridge deck. The JPD deck reached an ultimate load of 1878 kN and failed by punching with the main cracking plane breaking the surface of the south deck panel.
The Canadian Highway Bridge Design Code (CSAS6)(CSA-S6, 2019) code provides relationships between moments (transverse, longitudinal) and the maximum wheel load from the CL-625 truck (Pwheel = 87.5 kN Clause 5.7.1.2 CSA S6-19). The maximum wheel load that can be applied to the deck panels were 539.8 kN to 665.3 kN when the moments and shear forces in the transverse and longitudinal axes were considered. These values are unfactored but much larger than 87.5 kN. This is because the overhang governs the design with impact loads on the traffic barriers. The resulting moments over the exterior girders are large and these moments dissipate in the first interior panel, which requires substantial reinforcement. These values are still much lower than those that were obtained during testing. The punching shear load however was close to the experimental failure load, as stated above.
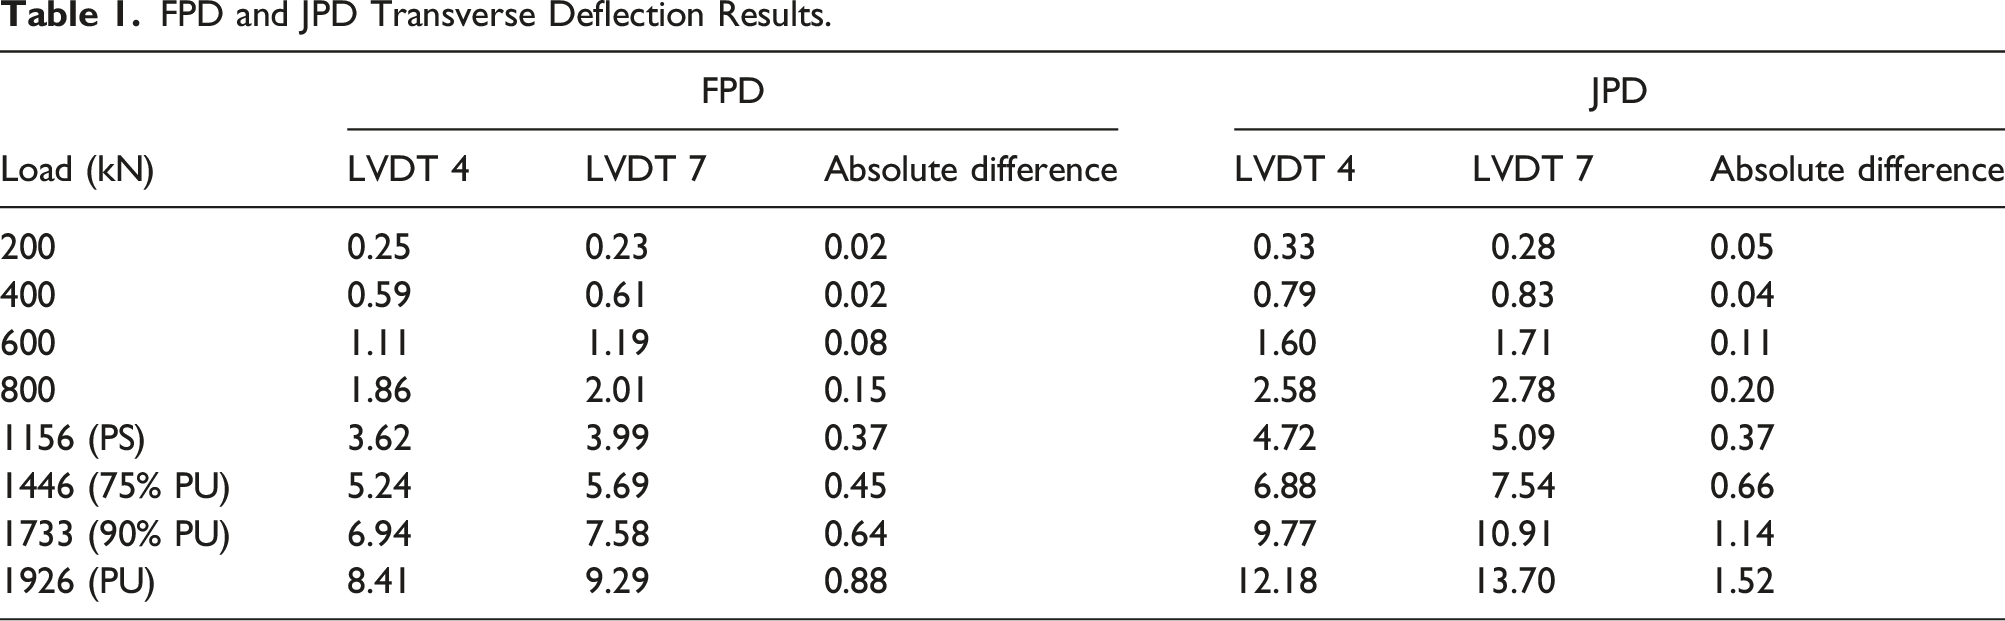
Both decks experienced similar cracking patterns throughout testing, with cracks reaching the full extent of the deck length. The FPD experienced deflections up to 9.29 mm at LVDT 7 at the deck center while the JPD had greater deflections with 13.70 mm at the same location, as shown in Figure 13(a). It must be emphasized that despite having smaller deflection, the FPD slab reached a 2.5% higher ultimate load than the JPD slab. This load was just over 20% greater than the estimated punching failure from the computer software. (a) Deflection comparison between JPD and FPD; (b) Centerline longitudinal deflection profiles during testing in FPD; and (c) Centerline longitudinal deflection profiles during testing JPD.
The full results are graphed to show the deflection development for the LVDTs longitudinally across the deck-joint interface in Figure 13(b) and (c). These profiles at select loads reflect the conditions at various stages of testing: before or at the first crack, at a few intermittent loads, at 60% of the ultimate load, that corresponds to service load, 75% of ultimate, 90% of ultimate, and the ultimate load. Though the LVDT data is reported in positive values, the deck displacement was in the downward direction. The deflection behaviour for both bridge decks is similar; the largest deflections are seen at the center and on the south side of the load plate, at LVDTs 4, 7 and 9 in both specimens. From there the deflections decrease longitudinally along the deck centerline. Since the free ends of the decks are nearly 5 m long, whereas the span between the inside edges of the girders is 1.625 m, the decks were quite restricted in the transverse direction. It should be noted, however that the supporting girders were allowed to deform under load with the slabs. LVDT 1 was the farthest from the load plate and therefore has the lowest displacement values, followed by LVDTs 2 and 10. The FPD deflections were smaller than those recorded in the JPD. The FPD displacements ranged from 4.5 mm to 9.5 mm and the JPD displacements were between 6 mm and 14 mm as shown in Figure 13(b) and (c). In Figure 13 the steeper angle between LVDTs 4 and 7 across the joint is more evident than comparing the numerical values. The deflection was increasing more rapidly closer to the load point. Despite the fact that the load plate is offset from the center of the bridge decks, the largest deflections are still seen on the north side of the plate at the center.
FPD and JPD Transverse Deflection Results.
The JPD specimen was cut during demobilization and the incision revealed that there did not appear to be internal cracking past the deck joint along the inside face of the west girder. However, the inside face of the east girder had 855 mm long crack running through the north panel at the bottom side. The deflection results reflect the deck cracking, since the reading from LVDT 3 was 0.24 mm larger than the LVDT 5 reading on the other half of the deck. To summarize the deflection behaviour, Figure 13 a indicates that until the load of 250 kN, the two systems displayed the same stiffness and deformation. Following cracking in both decks, the behaviour of the JPD slab showed decreased flexural rigidity, and increased deformation compared to the FPD specimen. It needs to be emphasized that the specimens were subjected to load that was designed to fail the bond between the joint and the precast deck and is not likely to be experienced by an actual bridge superstructure. Therefore, the performance in so far as the deflections are concerned was satisfactory for the JPD specimen.
Joint performance
The results of the joint instrumentation were analyzed to determine how well the load transferred across the UHPC joint. The concrete/UHPC strain results are shown in Figure 14. Recall the concrete gauges were adhered to the top surface of the bridge decks. Strains in both decks are the same until 300 kN load followed by strain increasing at a higher pace in the JPD specimen. At service load the strains in JPD specimen were 13 % higher, indicating that the deformation of the deck is larger as well. The strains in the FPD specimen differed minimally between the three gauges (CS, CM and CN). The differences between the gauges in the JPD specimen were larger primarily because the CM gauge was on the UHPC joint. Specific values of these strains can be found in Table 2. Concrete strain development in FPD and JPD specimens. FPD and JPD Strain Results. aFor the FPD: PS = 1156 kN, 75% PU = 1446 kN, 90% PU = 1733 kN, PU = 1926 kN, For the JPD: PS = 1126 kN, 75% PU = 1408 kN, 90% PU = 1690 kN, PU = 1878 kN.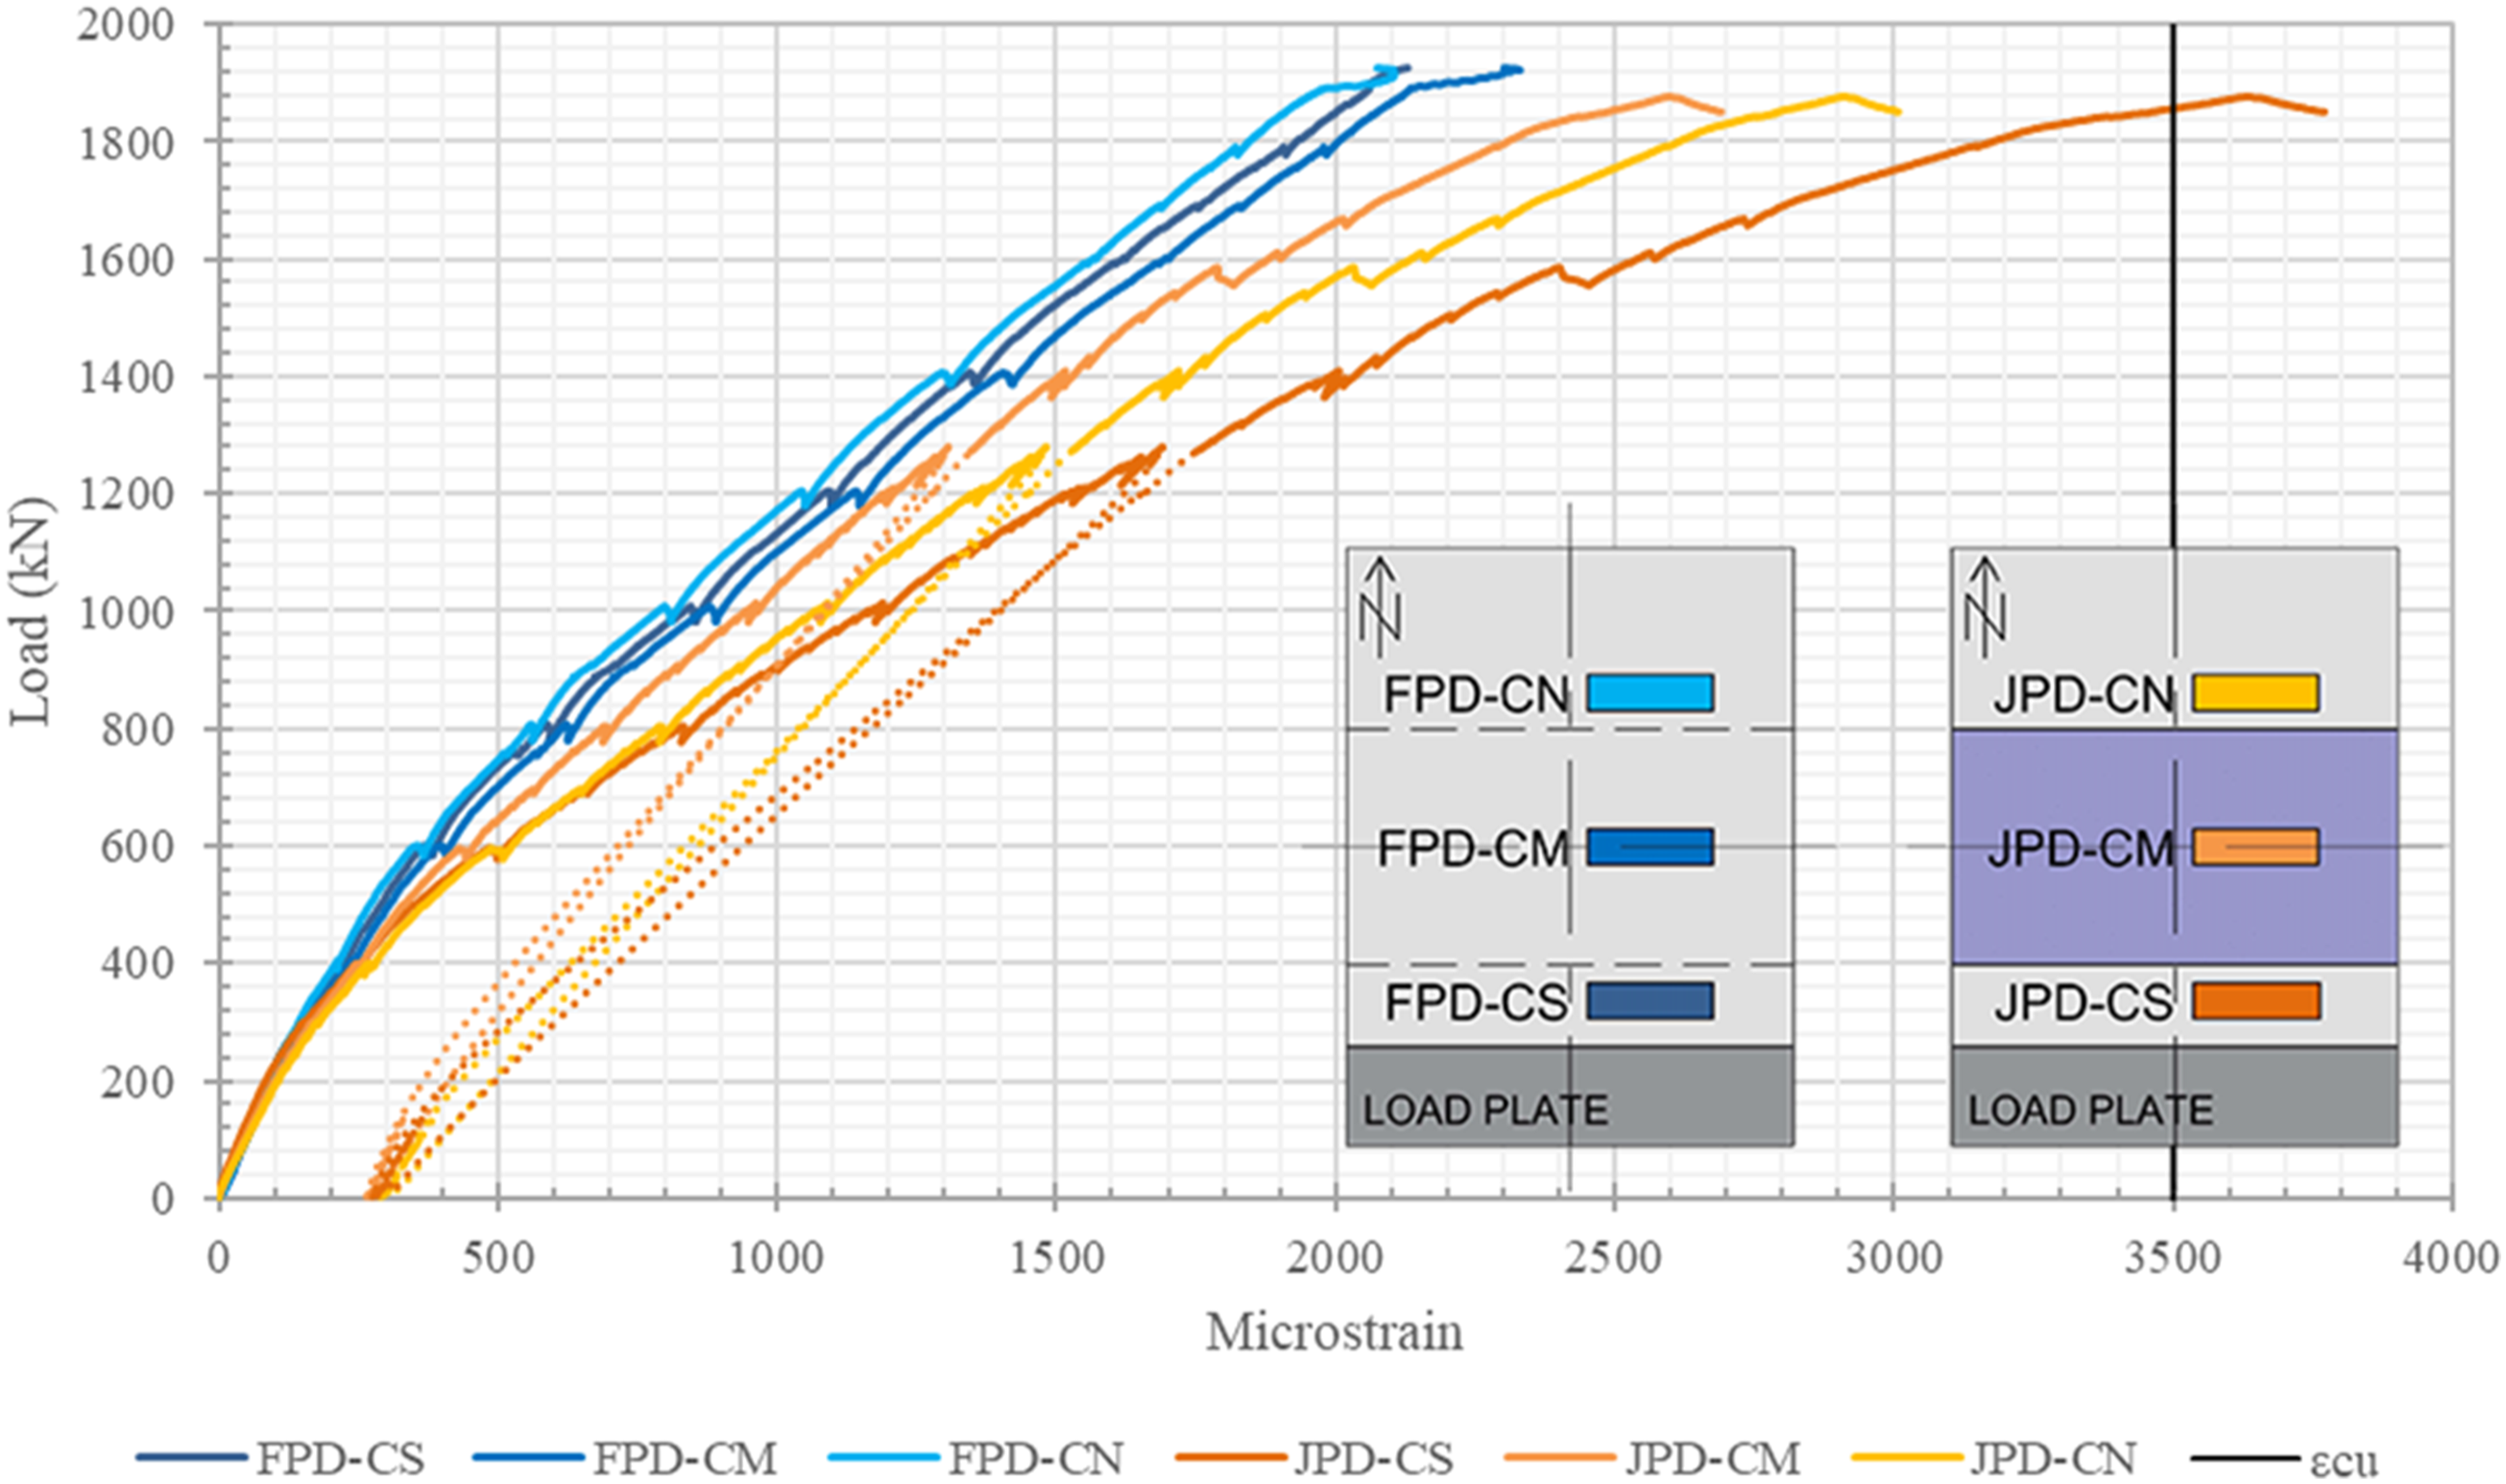
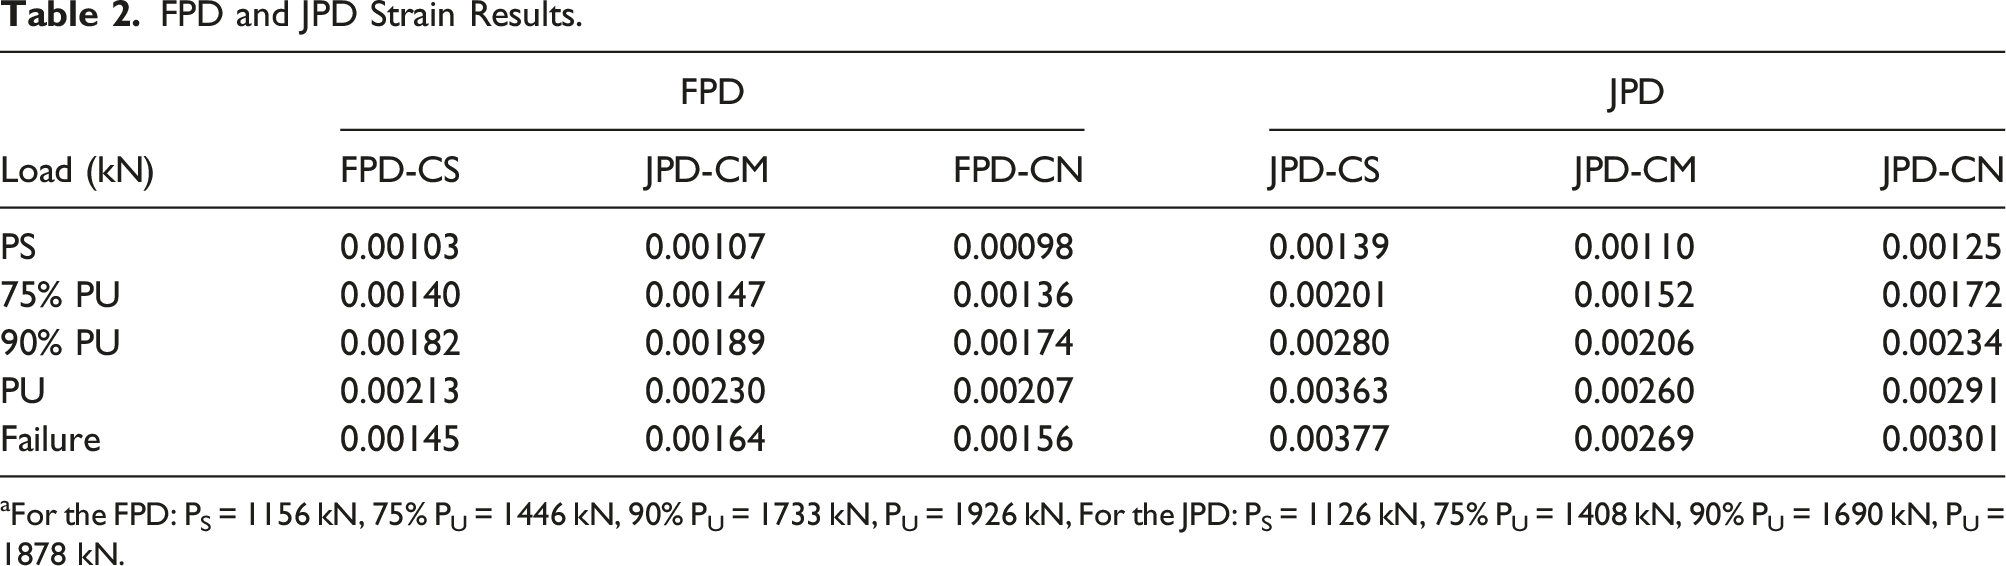
The JPD specimen strains were greater than those in the FPD specimen for most of the loading. The largest strains were measured beside the load plate in the south slab with 0.00363 and 0.00377 at the ultimate load of 1878 kN and at the JPD specimen failure, respectively. The JPD-CS reached the ultimate concrete strain of 0.0035 at a load of 1856 kN, just before the ultimate load. The strains in the UHPC, measured by JPD-CM, were the lowest for this deck due to the superior stiffness of the UHPC compared to the concrete.
Reinforcement performance
The graphed results of the strains in JPD specimen are separated by instrumented rebar sets. The north panel slab and joint gauges do not read large strains, whereas the south panel slab and joint gauges show increasing strains throughout testing. Though the joint rebar is spaced at 150 mm center to center (c/c) and is not in a direct line as the graphs suggest, the strains are still shown in this profile view for a general understanding of the strain development between panels across the UHPC joint. Figure 15 shows the east and west strain gauge profiles, distinguished by the purple versus green lines, respectively. The results are very similar for the first 800 kN of loading at all locations, but afterwards the eastern 10M bars recorded greater strains in the south panel slab and joint gauges (SS-EBS and SS-EBJ). Overall, there is a significant drop-off between the south panel slab gauges and the north panel slab gauges, indicating cracking in the south panel under the load point. Concrete strain development showed similar behaviour in Figure 14, where the strain in the JPD panel were higher closer to the load plate, and the rate of increase in concrete strain changed roughly around the 800 kN level. Note that the load point was at the south panel location, and this data indicates that the UHPC joint was capable to transfer the load to the adjacent north panel. JPD specimen strain profiles for easternmost and westernmost internal strain gauges.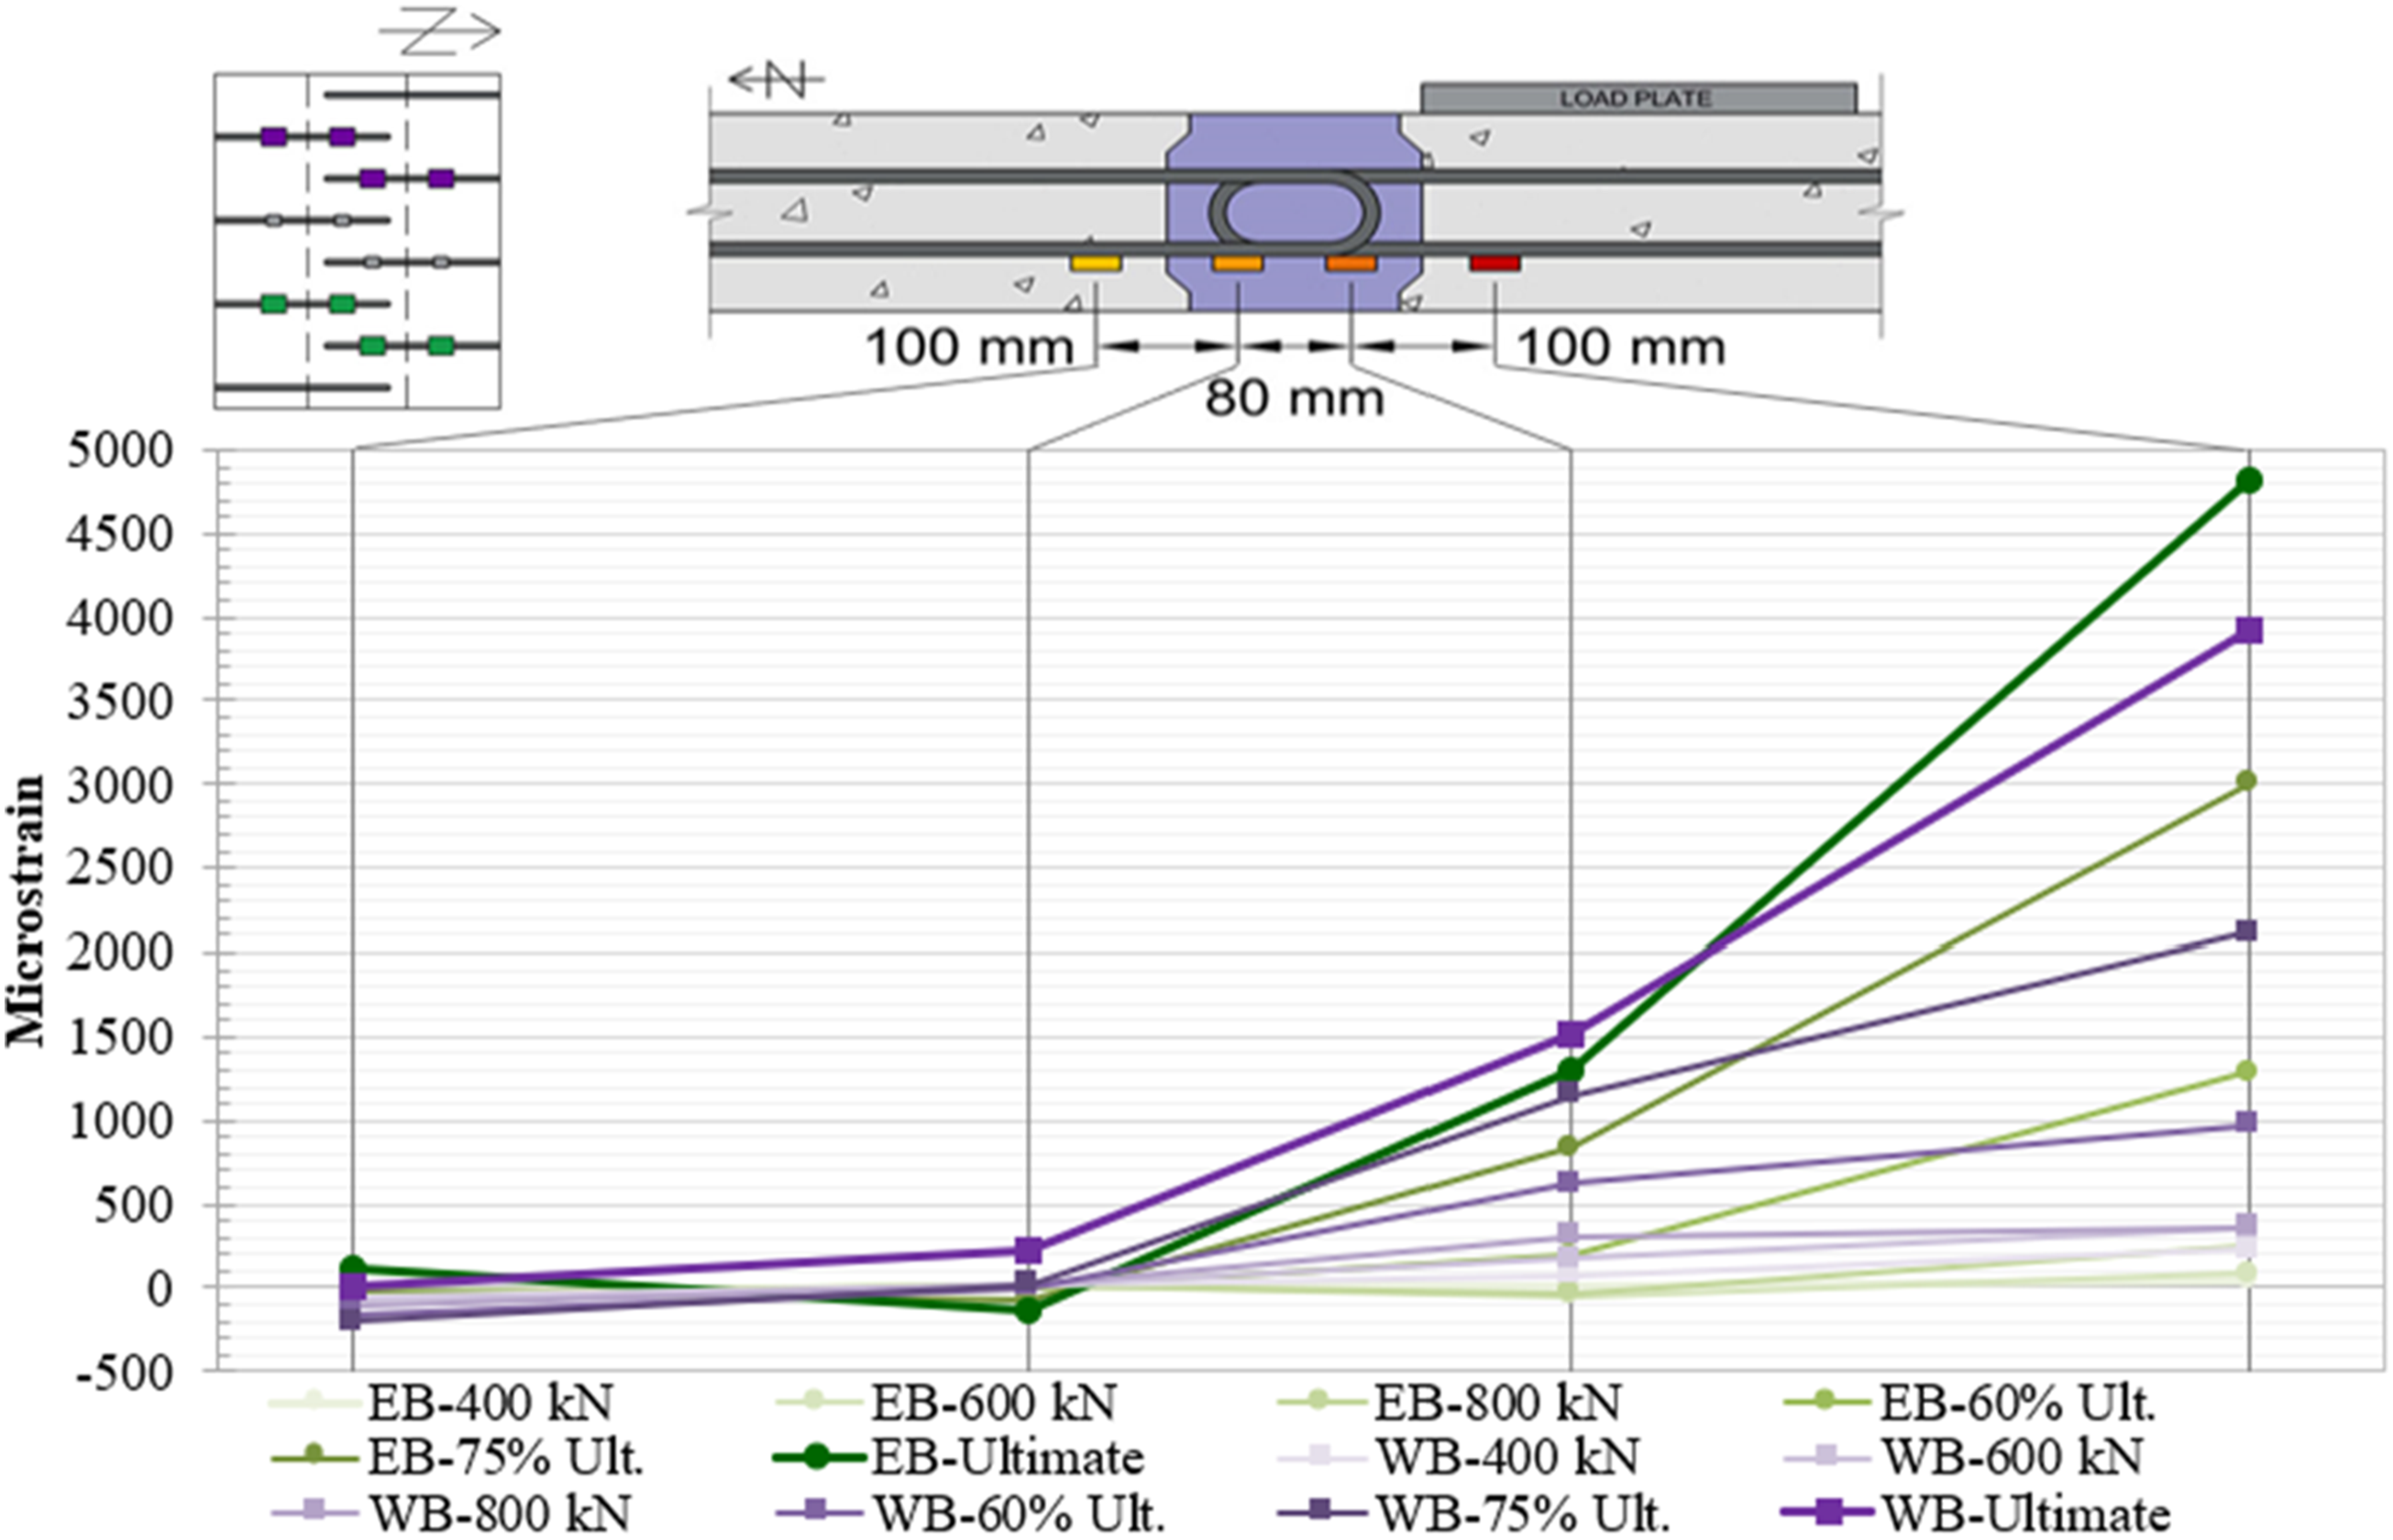
Cracking patterns
During the testing of the JPD specimen the first crack was not visible until a load of approximately 400 kN. The testing was paused every 200 kN to mark crack progression on the underside of the bridge deck. For the FPD specimen test, the first crack occurred at approximately 180 kN. The first crack was barely visible to the naked-eye and a magnification tool was used to confirm its length and measure its width. Cracks typically become visible to the naked eye around 0.05 mm, and this crack measured just below at 0.04 mm. The testing continued, marking cracking at 200 kN intervals, until 1400 kN after which the deck was loaded until its ultimate failure load of 1926 kN. The crack progression and overall pattern for both bridge decks were very similar, despite the UHPC joint connecting the panels of the JPD specimen, as shown in Figure 16. Crack development during bridge deck testing and post-failure cracking.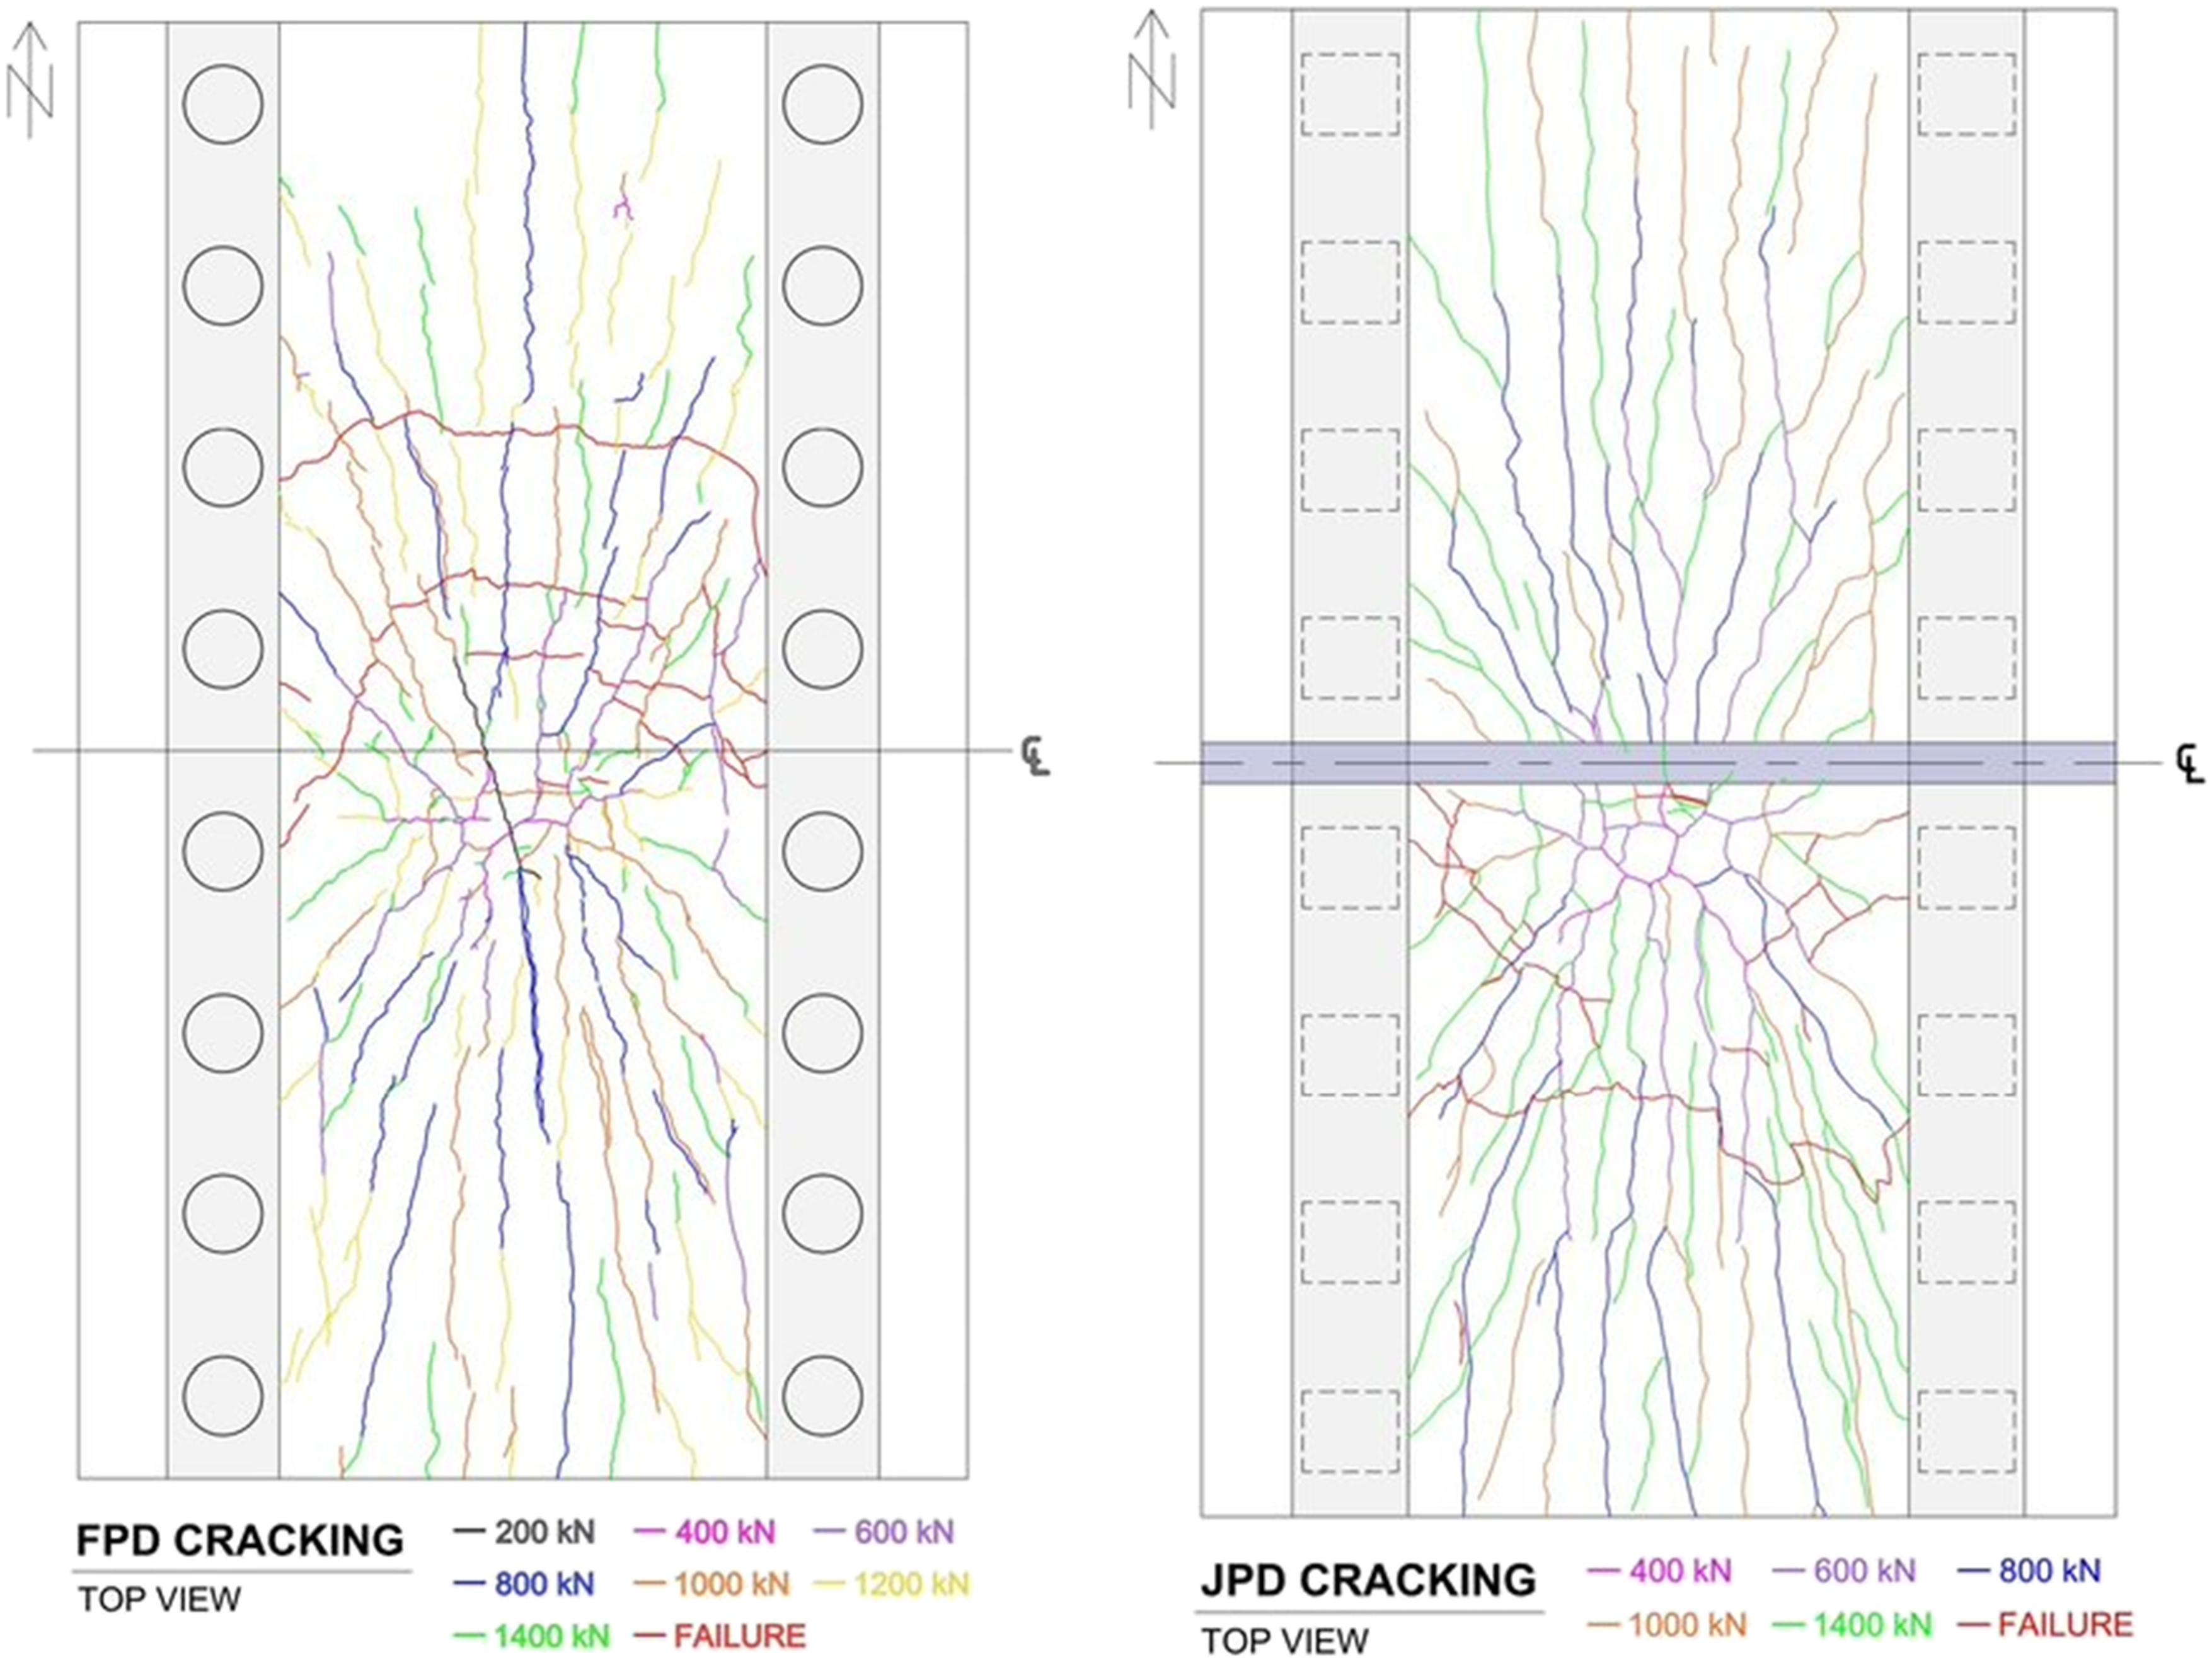
Up to 600 kN, the cracks in the JPD specimen are longer, more interconnected, and all stem from directly beneath the load plate, whereas the FPD specimen cracks are shorter and more sporadic. Not only does the number of cracks in both decks appear to be similar from 800 kN onwards, but there is equal cracking on either half of the decks. Though it is not known when cracking occurred internally in the UHPC joint, it was not visible on the deck surface until 1400 kN. The top of both bridge decks did not show any cracking during testing. Upon failure, the load plate had sunk into the deck by an average depth of one millimeter for both the FPD and JPD, and otherwise there was no visible cracking.
Pi-gauge Measurements for FPD and JPD During Testing.

aFor the FPD: PS = 1156 kN, 75% PU = 1446 kN, 90% PU = 1733 kN, PU = 1926 kN.
For the JPD: PS = 1126 kN, 75% PU = 1408 kN, 90% PU = 1690 kN, PU = 1878 kN.
Shear stud performance
The strain results from the shear studs of the FPD specimen are graphed in Figure 17. The charts are arranged in the same order as the shear pockets. The colour scheme for the graphical results is based on the tensile (negative strains) and compressive (positive strains) behaviour, represented by a green and orange lines, respectively. The P2NW and P3SW strain gauges did not work during testing and were represented by the grey lines. These two gauges either did not adhere properly to the studs and/or were accidentally damaged during UHPC casting. The shear studs were expected to show compression in the innermost studs and tension in the outermost studs, based on the location of the load point and the location of the studs on the girder flanges (i.e., tension in the westernmost studs of pockets P1 and P2, and in the easternmost studs of pockets P3 and P4, and compression in the easternmost studs of pockets P1 and P2, and in the westernmost studs of pockets P3 and P4). Figure 18 clarifies the expected forces in each pocket with a sketch, and shows the exaggerated deflected shape expected of the FPD specimen cross-section. The applied loading creates arching action within the concrete deck slab. Arching action is in the figure represented by the angled path the load takes from the top of the deck at the load application point, to the bottom of the deck at the support location. This creates an angled compression zone that starts to flatten out as the specimen deflects. The shear pocket and haunch connection resist the resulting moment created that pulls inwards, as seen in Figure 18(b). FPD specimen shear stud strain development during testing for shear pockets (a) P1; (b) P3; (c) P2; and (d) P4. (a) Expected shear stud behaviour and deck deflection (b) Arching action and load resistance and (c) FPD 1400 kN cracking and shear stud behaviour.

The results of the arching action can be seen in both bridge decks through the cracking patterns. The bridge deck’s resistance of the arching action creates the punch cone shape that eventually leads to the failure. The cracks radiate outwards from the load plate in the resulting cone shape of cracking pattern. Figure 18(c) shows the FPD specimen cracking at 1400 kN including the stud behaviour. Between the load plate and the adjacent shear pockets P2 and P4, the cracking is minimal, and the stud behaviour is responding in the expected compression and tension from the arching action. The opposite reactions occurred in the shear studs in P1 and P3. The effects of the arching action are resisted differently in these shear pockets since they are not adjacent to the load plate. Since the pockets are north of the deck center and past the lowest deflections, the innermost studs are pulling in tension to resist the deformation. The strains are all below 0.0003, or 10% of the stud yield strain.
Summary and conclusions
The experimental program consisted of regular concrete strength full-scale bridge decks with ultrahigh performance concrete (UHPC) filled connections of precast panel-to-panel joints and panel-to-girder shear pockets. Based on the study, the following conclusions can be drawn: ⁃ Both decks failed in punching shear mode that was at least 20% higher than the anticipated punching failure load. ⁃ At service load that was considered to be 60% of the ultimate load, deflections in the JPD deck adjacent to the UHPC joint were 30% larger compared to the same locations of FPD deck. At ultimate load, deflection of the deck with UHPC joint (JPD) were approximately 44% larger compared to the full panel deck (FPD) ⁃ The FPD specimen reached an ultimate load of 1926 kN prior to its punching shear failure with the main cracking plane breaking through the north half of the bridge deck. The JPD specimen reached an ultimate load of 1878 kN and failed by punching shear with the main cracking plane breaking the surface of the south deck panel, not crossing the UHPC joint. ⁃ Both decks experienced similar cracking patterns throughout testing, with cracks reaching the full extents of the deck length. ⁃ The UHPC joint showed only a few cracks on the bottom surface. The joint did not show debonding until after failure at the deck surface. ⁃ Most of the load was transferred between panels through the UHPC joint rather than the reinforcing bars because the rebar located in panel not subjected to load experienced much less strain compared with the panel with the load point. ⁃ The relative displacement between two sides of the joint was less than 0.37 mm at PC-UHPC joint interface, which indicates the ability of the UHPC joint to transfer the load with no interfacial failure.
Footnotes
Acknowledgments
The authors would like to acknowledge NSERC for their financial support, Lafarge Ductal North America for providing material for this project, and Manitoba Infrastructure for providing the deck panels. The technical support that was received from staff of W.R. McQuade Laboratory is gratefully acknowledged. The authors would like to thank Dr H. Vogel, P. Eng. (from Stantec) for information concerning the Eden Lake Bridge design and analysis.
Declaration of conflicting interests
The author(s) declared no potential conflicts of interest with respect to the research, authorship, and/or publication of this article.
Funding
The author(s) disclosed receipt of the following financial support for the research, authorship, and/or publication of this article: This work was supported by the Natural Sciences and Engineering Research Council of Canada.