



Abstract
Seismic response prediction is crucial for the safety analysis of train-bridge coupled systems. However, due to the complexity, suddenness, and high-risk nature of earthquakes, there are strong nonlinear relationships among different parts of bridges, making it challenging to express their spatial correlations using analytical models and traditional neural networks. To address this, this paper establishes a ballast track shaker scaling model and employs the grating monitoring measurement method to construct a spatial quasi-distributed monitoring system for the ballast track, thereby collecting seismic strain responses of the train-bridge coupled system under various seismic conditions. A hybrid neural network method is proposed for predicting the seismic responses of the train-bridge coupled system. This hybrid neural network integrates the features of a Convolutional Neural Network (CNN), Bidirectional Long Short-Term Memory Neural Network (BiLSTM), and the attention mechanism, thereby termed the CNN-BiLSTM-attention hybrid neural network. The model was validated using strain responses from 54 seismic scenarios. The results indicate that the model has a Mean Absolute Error (MAE) of 0.2349 and a coefficient of determination (R2) of 0.9446. Comparing the prediction results with those from RNN and LSTM models, it was found that the CNN effectively extracts features under various seismic parameters, while the BiLSTM better captures the temporal information of the strain responses, ensuring effective prediction regardless of the magnitude of strain responses. Therefore, the CNN-BiLSTM-attention hybrid neural network model is recommended for predicting seismic response.
Keywords
Introduction
To ensure traffic safety and comfort, the girders and piers of high-speed railroad bridges are designed with significant stiffness and high fundamental frequencies, making them resilient to the substantial seismic forces experienced during earthquakes (Liu et al., 2021a; Zhao et al., 2023a). Despite the challenges posed by rare seismic events, these structures typically maintain excellent seismic performance (Zhao et al., 2024). Ballastless tracks, exemplified by the CRTSII system commonly used in China, provide longitudinal restrictions that enhance bridge integrity. This system effectively transforms adjacent spans of simply supported girders into a unified structure, increasing overall stability (Shao et al., 2023; Zhao et al., 2022; Zhao et al., 2023b). Developed in response to the characteristics of numerous long bridges and a large proportion of railroad bridges, the CRTSII style has been widely implemented across major routes such as the Beijing-Tianjin, Shanghai-Hangzhou, and Beijing-Shanghai lines (Feng et al., 2019; Jiang et al., 2020a). With the expansion of construction into the seismically active western regions, including areas with high seismic intensity and fault systems in mountainous zones, China’s high-speed rail industry has seen remarkable growth (Liu et al., 2021b; Shao et al., 2024; Xiang et al., 2023a). The impact of track construction on the bridge’s seismic resistance cannot be disregarded, as the track absorbs part of the ground vibrations transmitted by the foundation during an earthquake. To ensure traffic safety, studying the track’s role under seismic loading has significant theoretical and practical engineering value (Jiang et al., 2020b; Zhang et al., 2024a).
To evaluate the seismic performance of simply supported girder bridges with CRTSII rail systems, detailed three-dimensional nonlinear dynamic models have been developed (Yan et al., 2017). These models reveal that stresses typically concentrate in the rails, track plates, and bottom plates near the bridge abutments or anchorages. Research has shown that moderate-intensity earthquakes generally do not cause significant structural damage and can be sufficiently analyzed within the elastic domain (Montenegro et al., 2016). Further studies have involved the validation of simulated axle systems using shaking table test data, leading to the development of a new safety assessment index (Zhao et al., 2023c). Additionally, the impact of ground movement duration on seismic behavior has been examined through the use of spectrally similar short- and long-period ground vibrations, enhancing the understanding of the seismic responses of reinforced concrete bridge piers (Su et al., 2023).
The shaking table test methodology, a key element in seismic testing, allows for accurate replication of earthquake vibrations in a laboratory setting (Gao and Yuan, 2019). Experiments conducted on continuous girder bridges for high-speed railroads have enabled analysis of the structural damage state and exploration of how various seismic intensities and installation orientations influence the seismic response of these structures (Jiang et al., 2019). Findings from shake-table tests on scoured pile-group supported bridge models in both saturated and dry sands have illustrated the impact of liquefaction on seismic requirements and the collapse process of scoured bridges (Wang et al., 2019). The effects of collisions on the lateral seismic response of bridge models and the dampening capabilities of rubber buffers have been explored through a series of experiments on a scaled-down version of a bridge (Yang et al., 2019).
In recent decades, Fiber Bragg grating (FBG) sensors have been increasingly used to assess the structural condition of existing infrastructure (Zhang et al., 2024b). A comprehensive and insightful conceptual study of fiber grating sensors in current infrastructures has been conducted (Chan et al., 2021), highlighting their growing relevance. Strain transfer analysis has been employed to evaluate fiber optic sensing technology for in situ monitoring of structural integrity in fully and multi-layer asphalt pavements (Wang et al., 2018a, 2018b, 2020). Furthermore, the deterioration response of asymmetric concrete reinforced structures exposed to increasing seismic stress has been tracked using fiber-optic grating sensors (Zhang et al., 2019). In bridges, using an externally attached fiber-optic grating strain transmitter (Lu et al., 2019), investigated the dynamical and stationary pressure division technique for large-scale strain gauges of substantial-span rigid bridges under vehicle loading and extracted the effective quasi-static strain components of the fluid strain signals. Based on fiber optic temperature sensor monitoring data, (Xiang et al., 2024) established a train-bridge dynamic model and studied the influence of different seismic conditions on the acceleration of trains. Based on existing fiber grating detection examples in engineering (Zhao et al., 2019), this paper employs fiber grating Wavelength Division Multiplexing technology (Chan et al., 2021) to realize a quasi-distributed fiber grating sensing system by connecting multiple FBG sensors in series on a single fiber (Jiang et al., 2021; Sasy Chan et al., 2021; Wang et al., 2018) and attaching the series fiber grating to the scaled CRTS II track model to achieve long-range multi-point acquisition.
With the emergence of developing technologies including big data, machine learning, and artificial intelligence, new concepts and methods to seismic mitigation theory and technology for bridges have emerged. Artificial neural networks (ANN) have been widely used in recent years to predict structural seismic response, damage state (Zhang et al., 2024; Mangalathu et al., 2018; Mangalathu and Jeon, 2020), and failure mode (Mangalathu and Jeon, 2019), as well as to evaluate structural seismic performance (Arslan, 2010) and damage state (Mangalathu and Burton, 2019), By demonstrating superior nonlinear function modeling capability (Chen and Billings, 1992; Wang et al., 2021), researchers have investigated machine learning (ML) methodologies for accurately estimating bearing deformation and column drift ratio responses of bridges, especially for those supported by extended pile shafts. To forecast the time series of seismic reaction of ground structures, one-dimensional convolutional neural networks (1D-CNN) and long-short term memory neural networks (LSTM) were built using extensive research on artificial neural networks (Wu and Jahanshahi, 2019; Zhang et al., 2020).
Most networks in the abovementioned studies were based on the traditional fully connected neural network (FCNN) (Müller et al., 2022) or recurrent neural network (RNN), which constructs a point-to-point mapping or only considers the variation trend in depth. These methods usually assume that data are of low dimension and are linearly correlated, and simple data-driven methods fail to identify and capture the nonlinear and complex behavior of geological data. This study proposes a novel hybrid neural network for predicting seismic response, specifically applying the CNN-BiLSTM-attention hybrid neural network to the seismic response prediction of train-bridge coupled systems, which has not been done in previous studies. We selected the CNN to capture the step change of the stress curves at a certain interval and the advanced RNN, BiLSTM network (Liu and Guo, 2019), to reflect the variation trend of the stress curves with depth and context. Combining these with the attention mechanism, we created the CNN-BiLSTM-attention hybrid neural network to predict seismic response. Additionally, we utilized data obtained from shaking table tests for model training and prediction. By leveraging the capabilities of CNNs for spatial feature extraction, BiLSTMs for temporal sequence processing, and the attention mechanism for focusing on key features, this hybrid neural network demonstrates superior performance in predicting the seismic response of train-bridge coupled systems. The successful application of this model highlights its potential for improving the accuracy and reliability of seismic response predictions in complex engineering systems.
Data gathering and processing phase
By constructing a scaled basic girder bridge on a shaker system (Yu et al., 2021), quasi-distributed fiber-optic gratings were installed at the track plates of the scaled bridge’s mid-span section, respectively, to measure strain response in various directions along the same line.
Shaking table experimental setup
In this study, we use the multi-span simply supported girders of the CRTSII plate ballastless track system as the research object, create a scaled-down model of the bridge with a similarity ratio of 1:10, and build a bridge operation test platform with four rows of shaking tables.
The prototype of the scaled-down model is a Chinese high-speed railway simple supported box girder bridge (Xiang et al., 2023b). The piers are round-end solid piers with heights varying from 3 m to 20 m, and the girders are prepared having concrete simple-supported box girders with an overall length of 32.5 m. Equal-section piers are those with a height under 14 m, whereas variable-section piers with a slope of 1:45 are those with a height over 14 m. The anti-fall girder mechanism has a trigger spacing of 20 cm. Basin rubber bearings having 5000 kN and 1000 kN maximum vertical and horizontal bearing capabilities, respectively. To create relative movement between the ceiling and the bottom basin, polytetrafluoroethylene (PTFE) plates with a low coefficient of friction may be employed. Under three-dimensional stress, the rubber is fluid and may be utilized to rotate the main beam. Seals are used to keep the rubber from deteriorating due to exposure to air.
The track is a ballastless slab-type track system known as CRTSII. To reduce the temperature stress on the track construction, a sliding layer is inserted between the box girder and the base plate. As a buffer layer between the filler materials, a layer of CA mortar is installed between the base plate and the track plate. Fasteners hold the rail to the track plate; transverse blocks are installed on both sides of the bottom plate and the track plate to limit their lateral movement; shear reinforcement is installed between the bottom plate and the track plate at the ends of the girder joints; and shear grooves are installed on the surface of the box girder above the fixed supports to limit the movement of the bottom plate. Blocks and fasteners are separated by 0.65 m and 6.5 m, respectively.
Figure 1 depicts the model installation. The scaled-down bridge is a steel bridge with a 1:10 scale, each span is 3.25 m long, and there are a total of 11 spans. Table 1 shows the model similarity coefficients. Steel plates were used for fasteners; rails, track plates, base plates, girders, and piers were made based on equivalent bending stiffness; shear bars, shear gears, lateral blocks, and bearings were experimented for different sizes of specimens based on the principle of equivalent effectiveness and displacement, and the most suitable size was selected based on the experimental results; One 4 m by 4 m six-degree-of-freedom fixed table and three 4m by 4m six-degree-of-freedom movable tables make up the slide of the shaker test system. There is an adjustable separation of 625 m between the table array. Device model diagram. Scaled-down model similarity coefficients (Zhou et al., 2023). A parameter with * means the parameter is a basic parameter.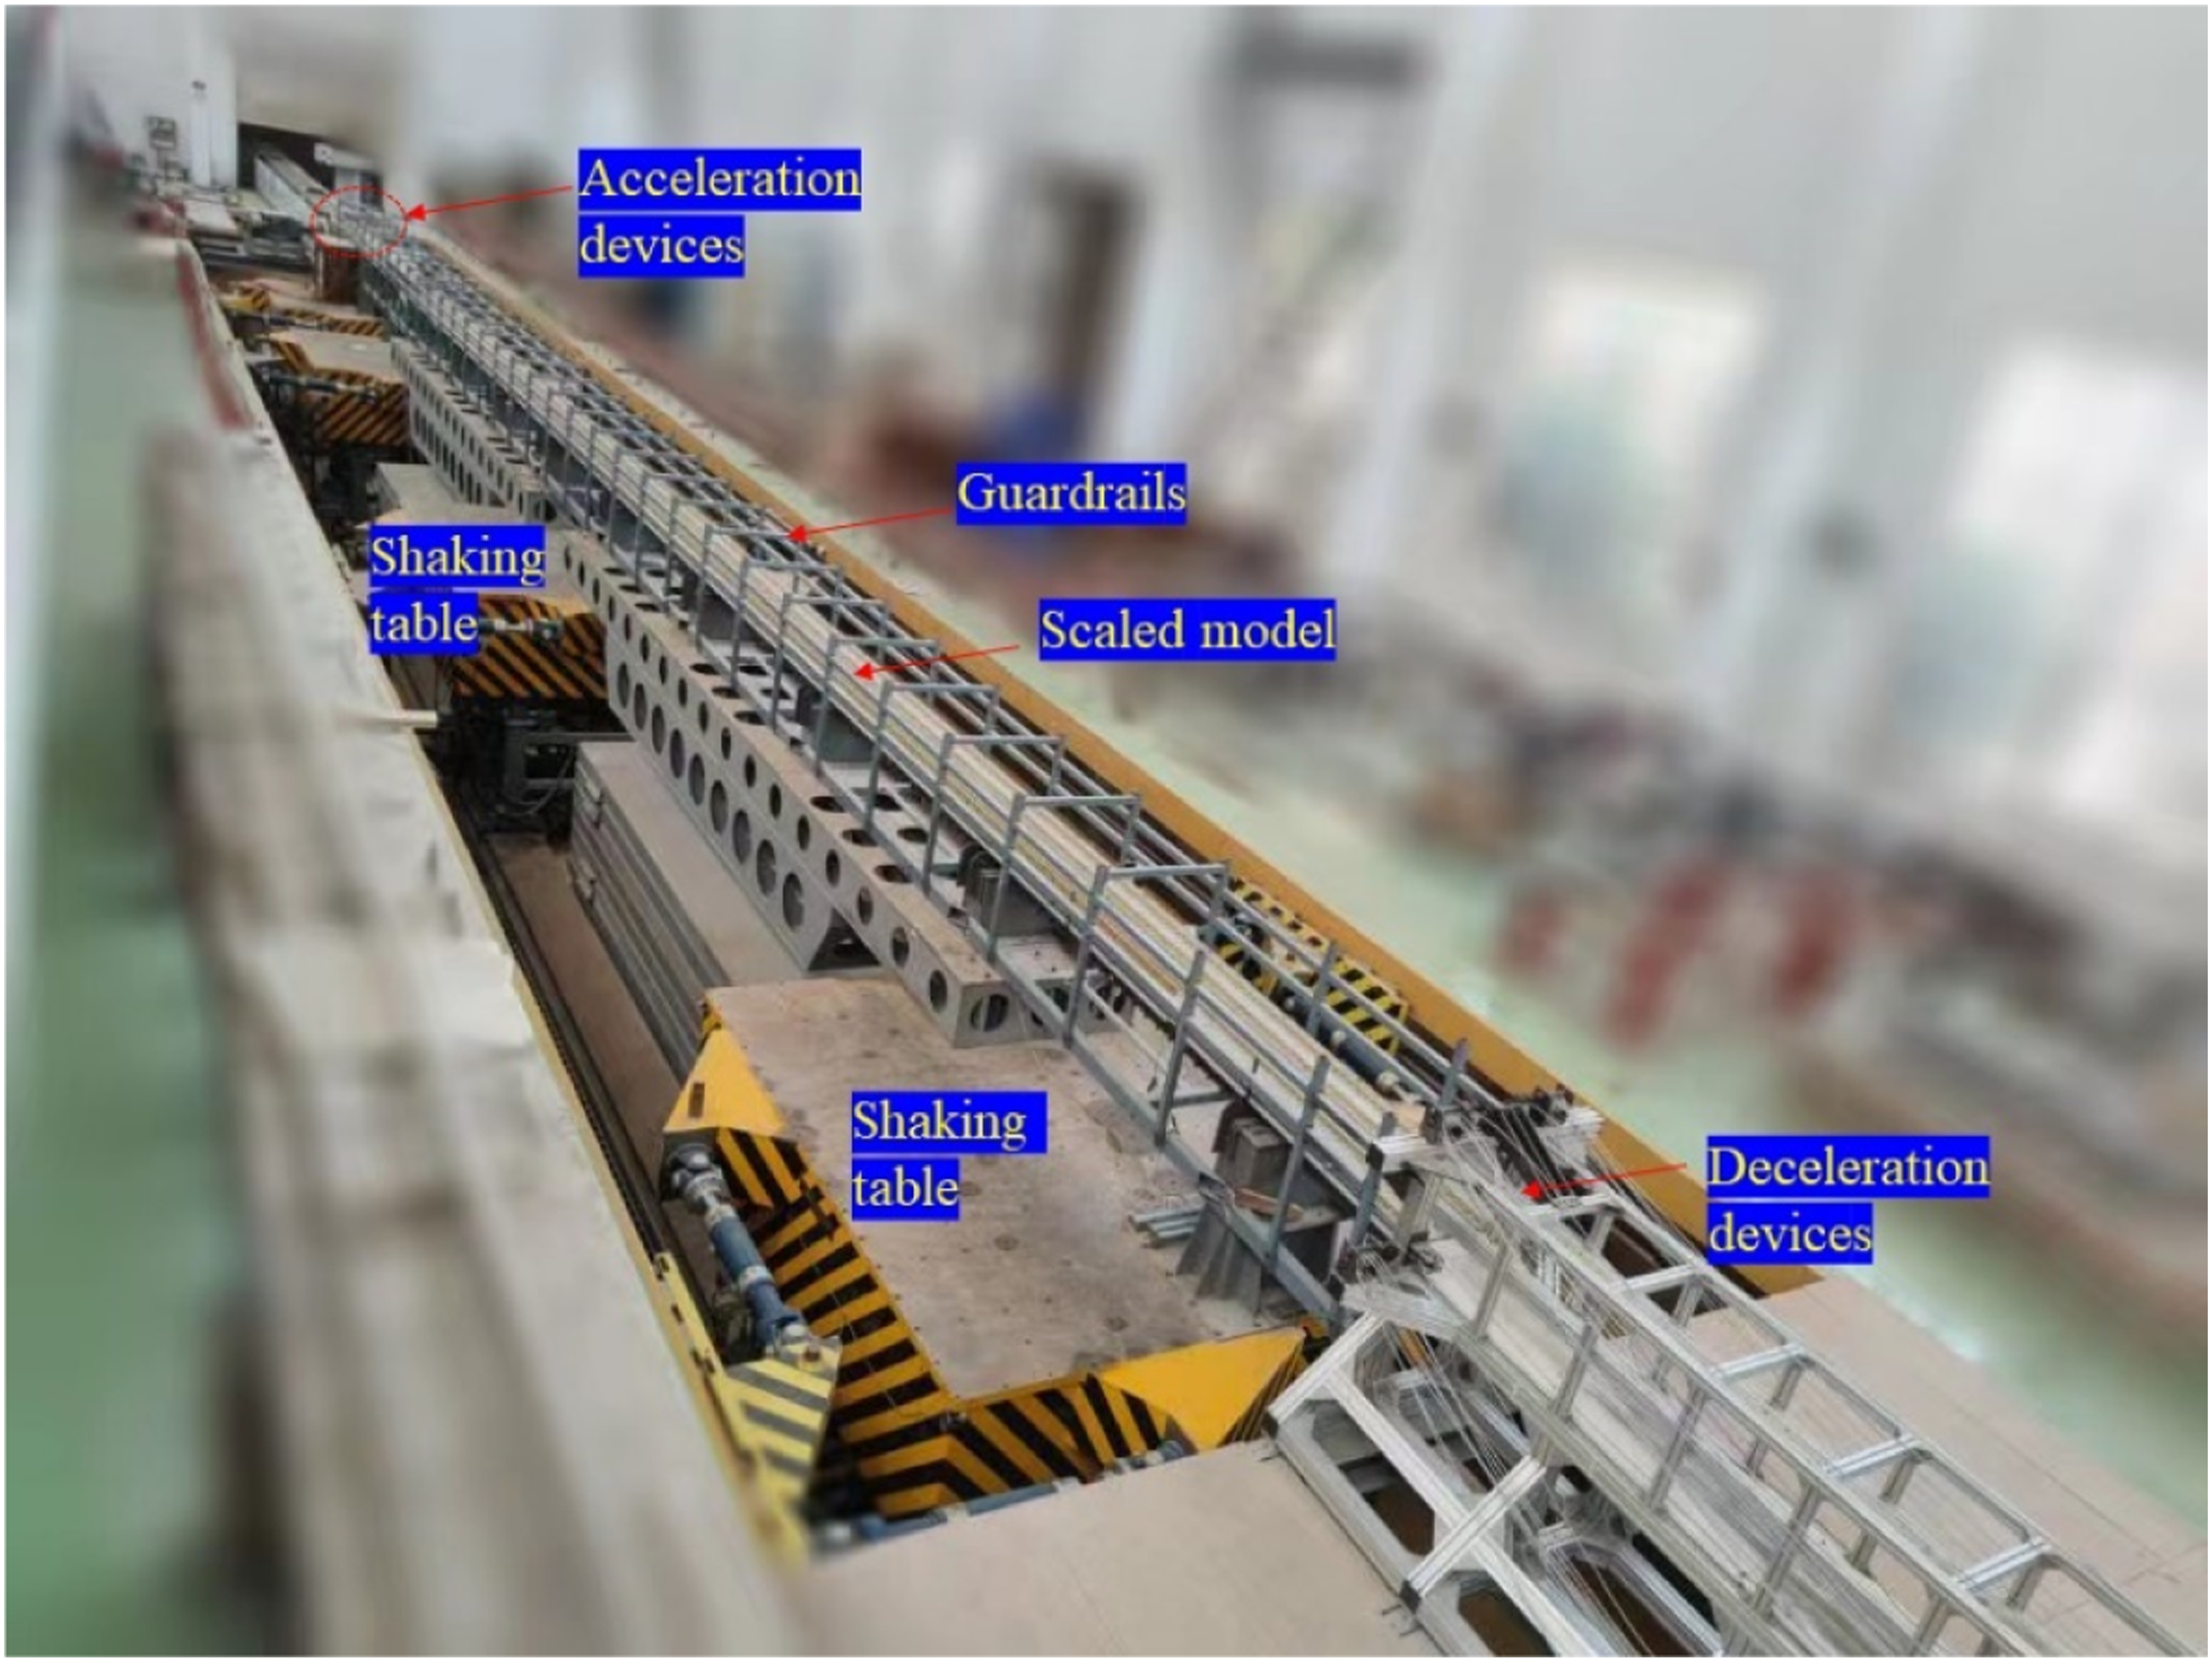

Data capture device with a fiber grating
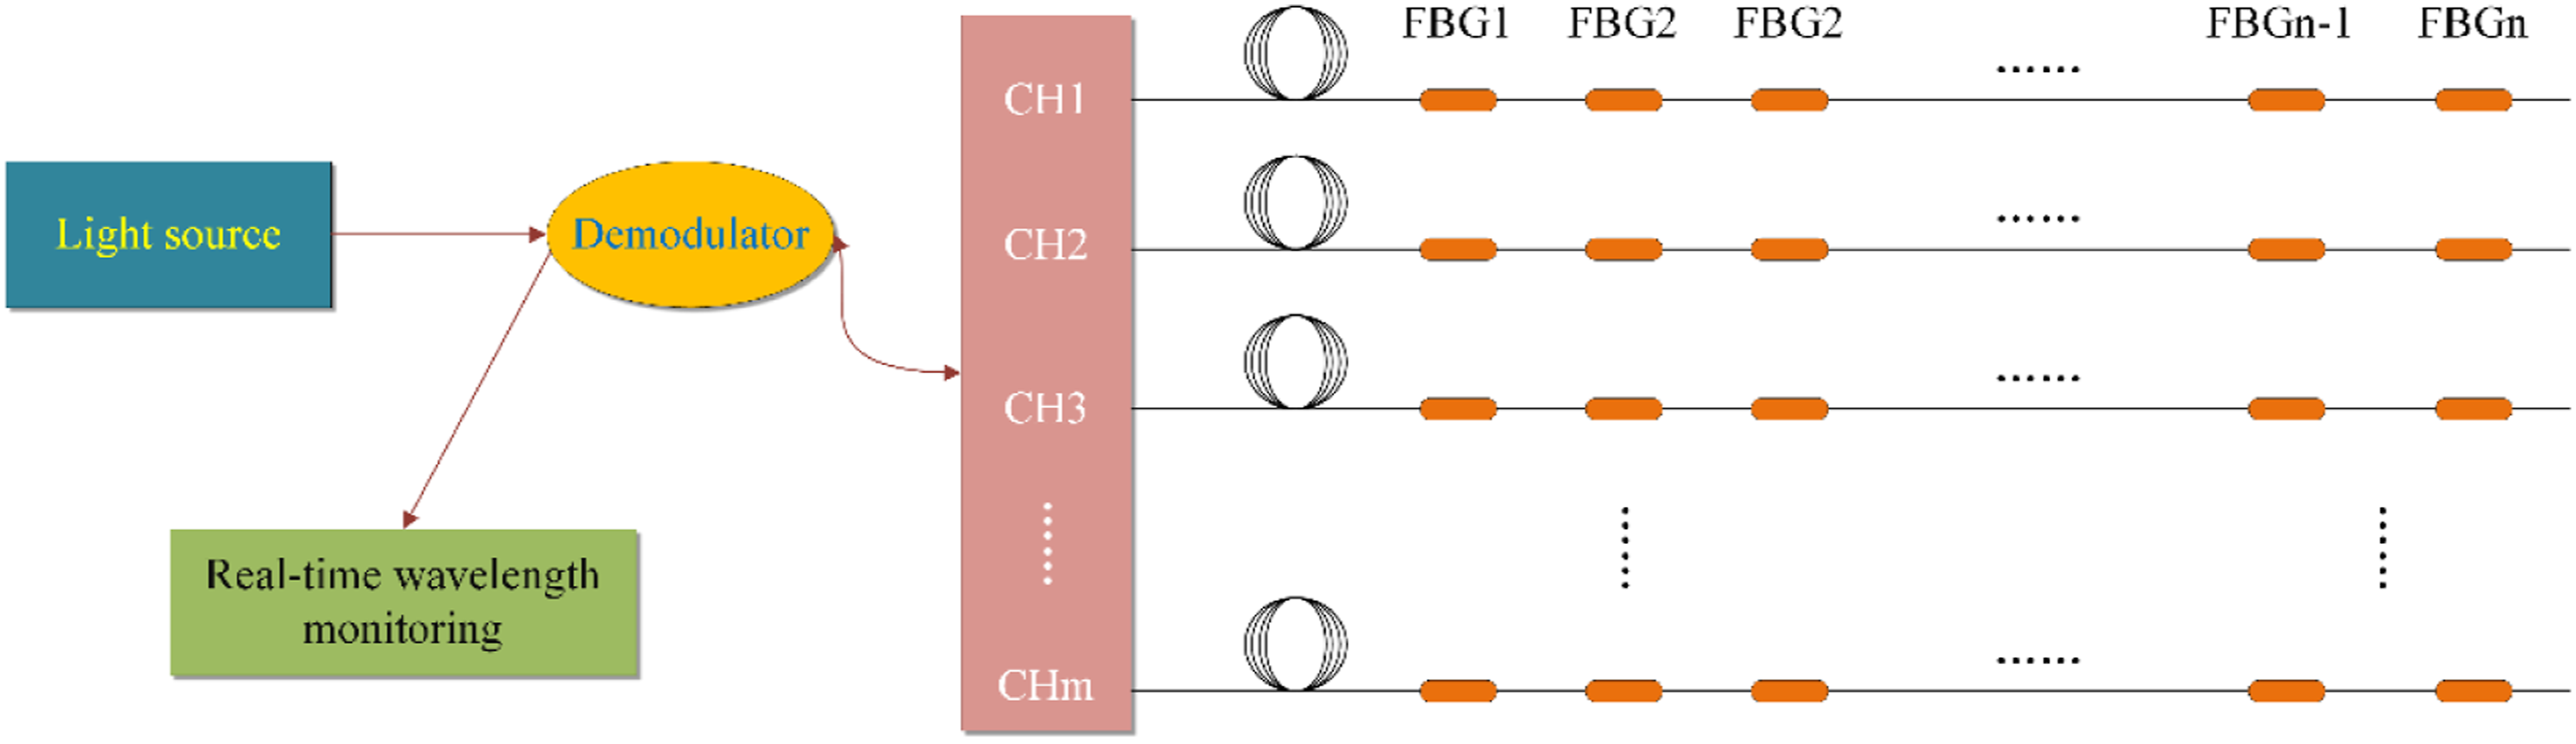
An optical fiber with seven grating spots is epoxy resin-attached to the track at the middle portion of the bridge span, and it is organized as illustrated in Figure 2. To guarantee that the grating points were uniformly distributed on the monitored structure, the optical fiber with seven grating points was pasted on the track plate according to the fourth grating point matching to the midpoint position of the bridge span. Figures 2 and 3 illustrate the data collection and schematic diagrams, respectively. FBG arrangement diagram. (a) Fiber optic paste position, (b) Grating point, (c) Fiber optic of beam, (d) Test model and demodulation system. Schematic diagram of data acquisition.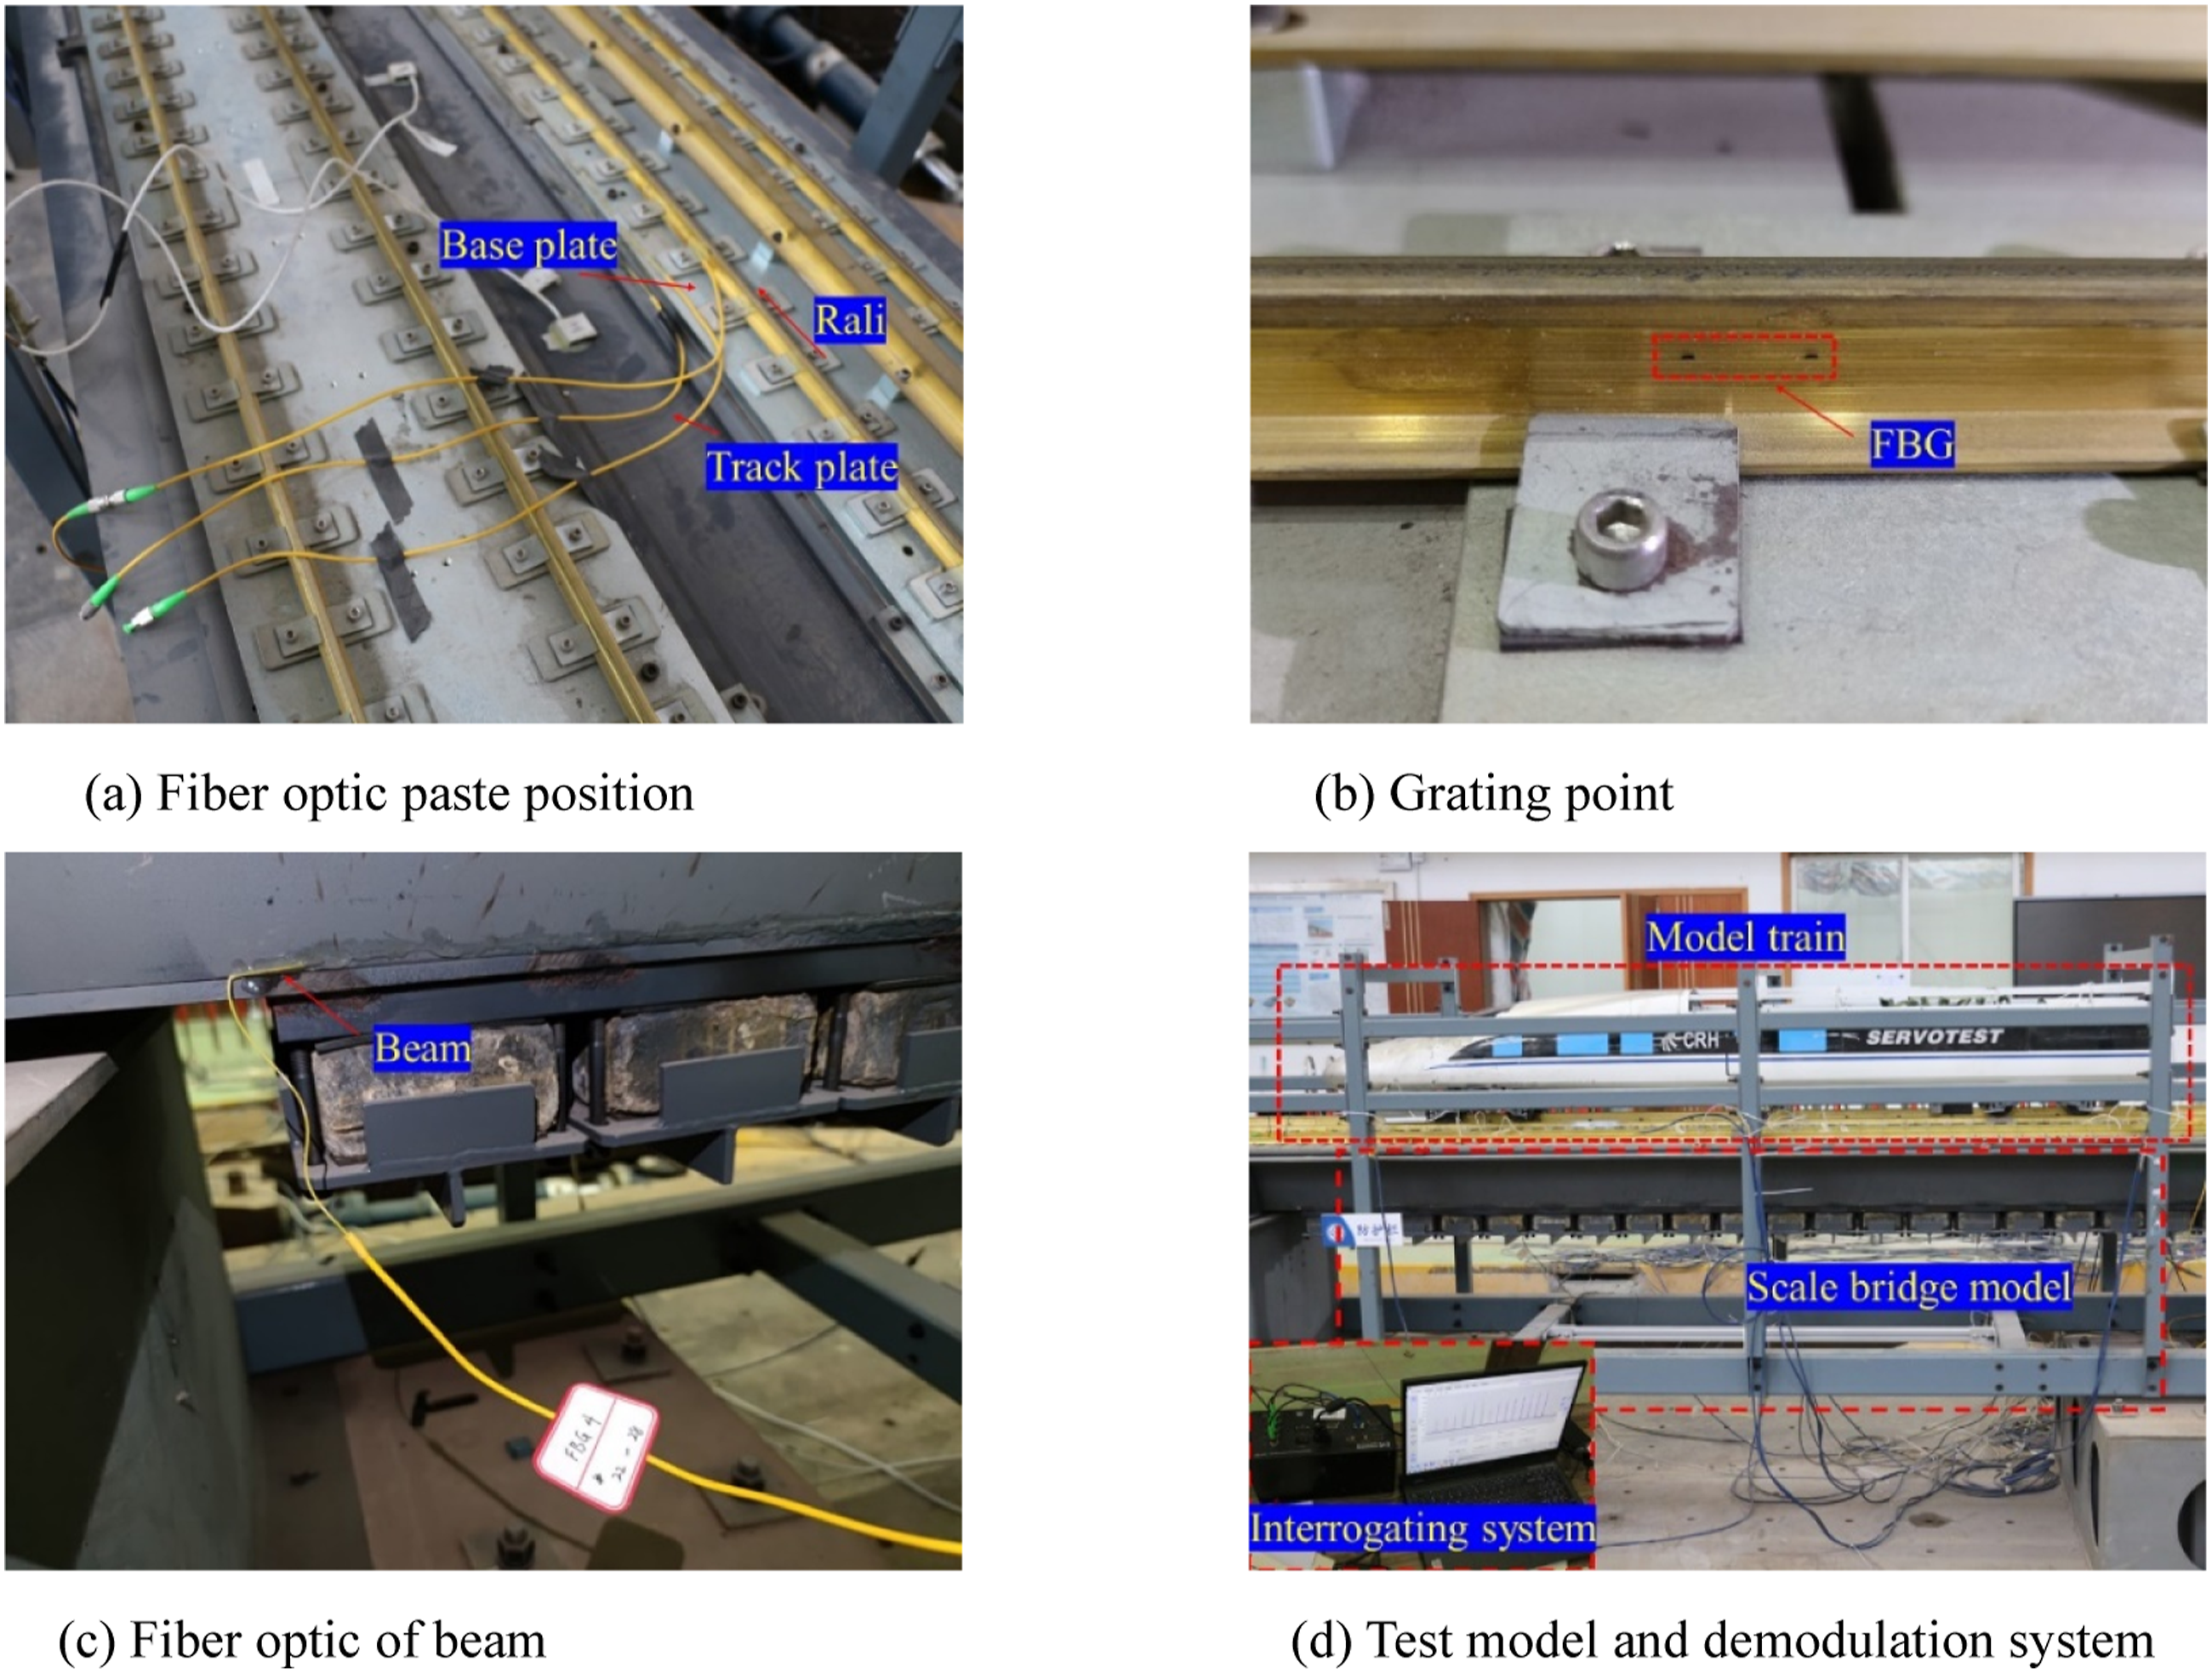
Introduction to the dataset
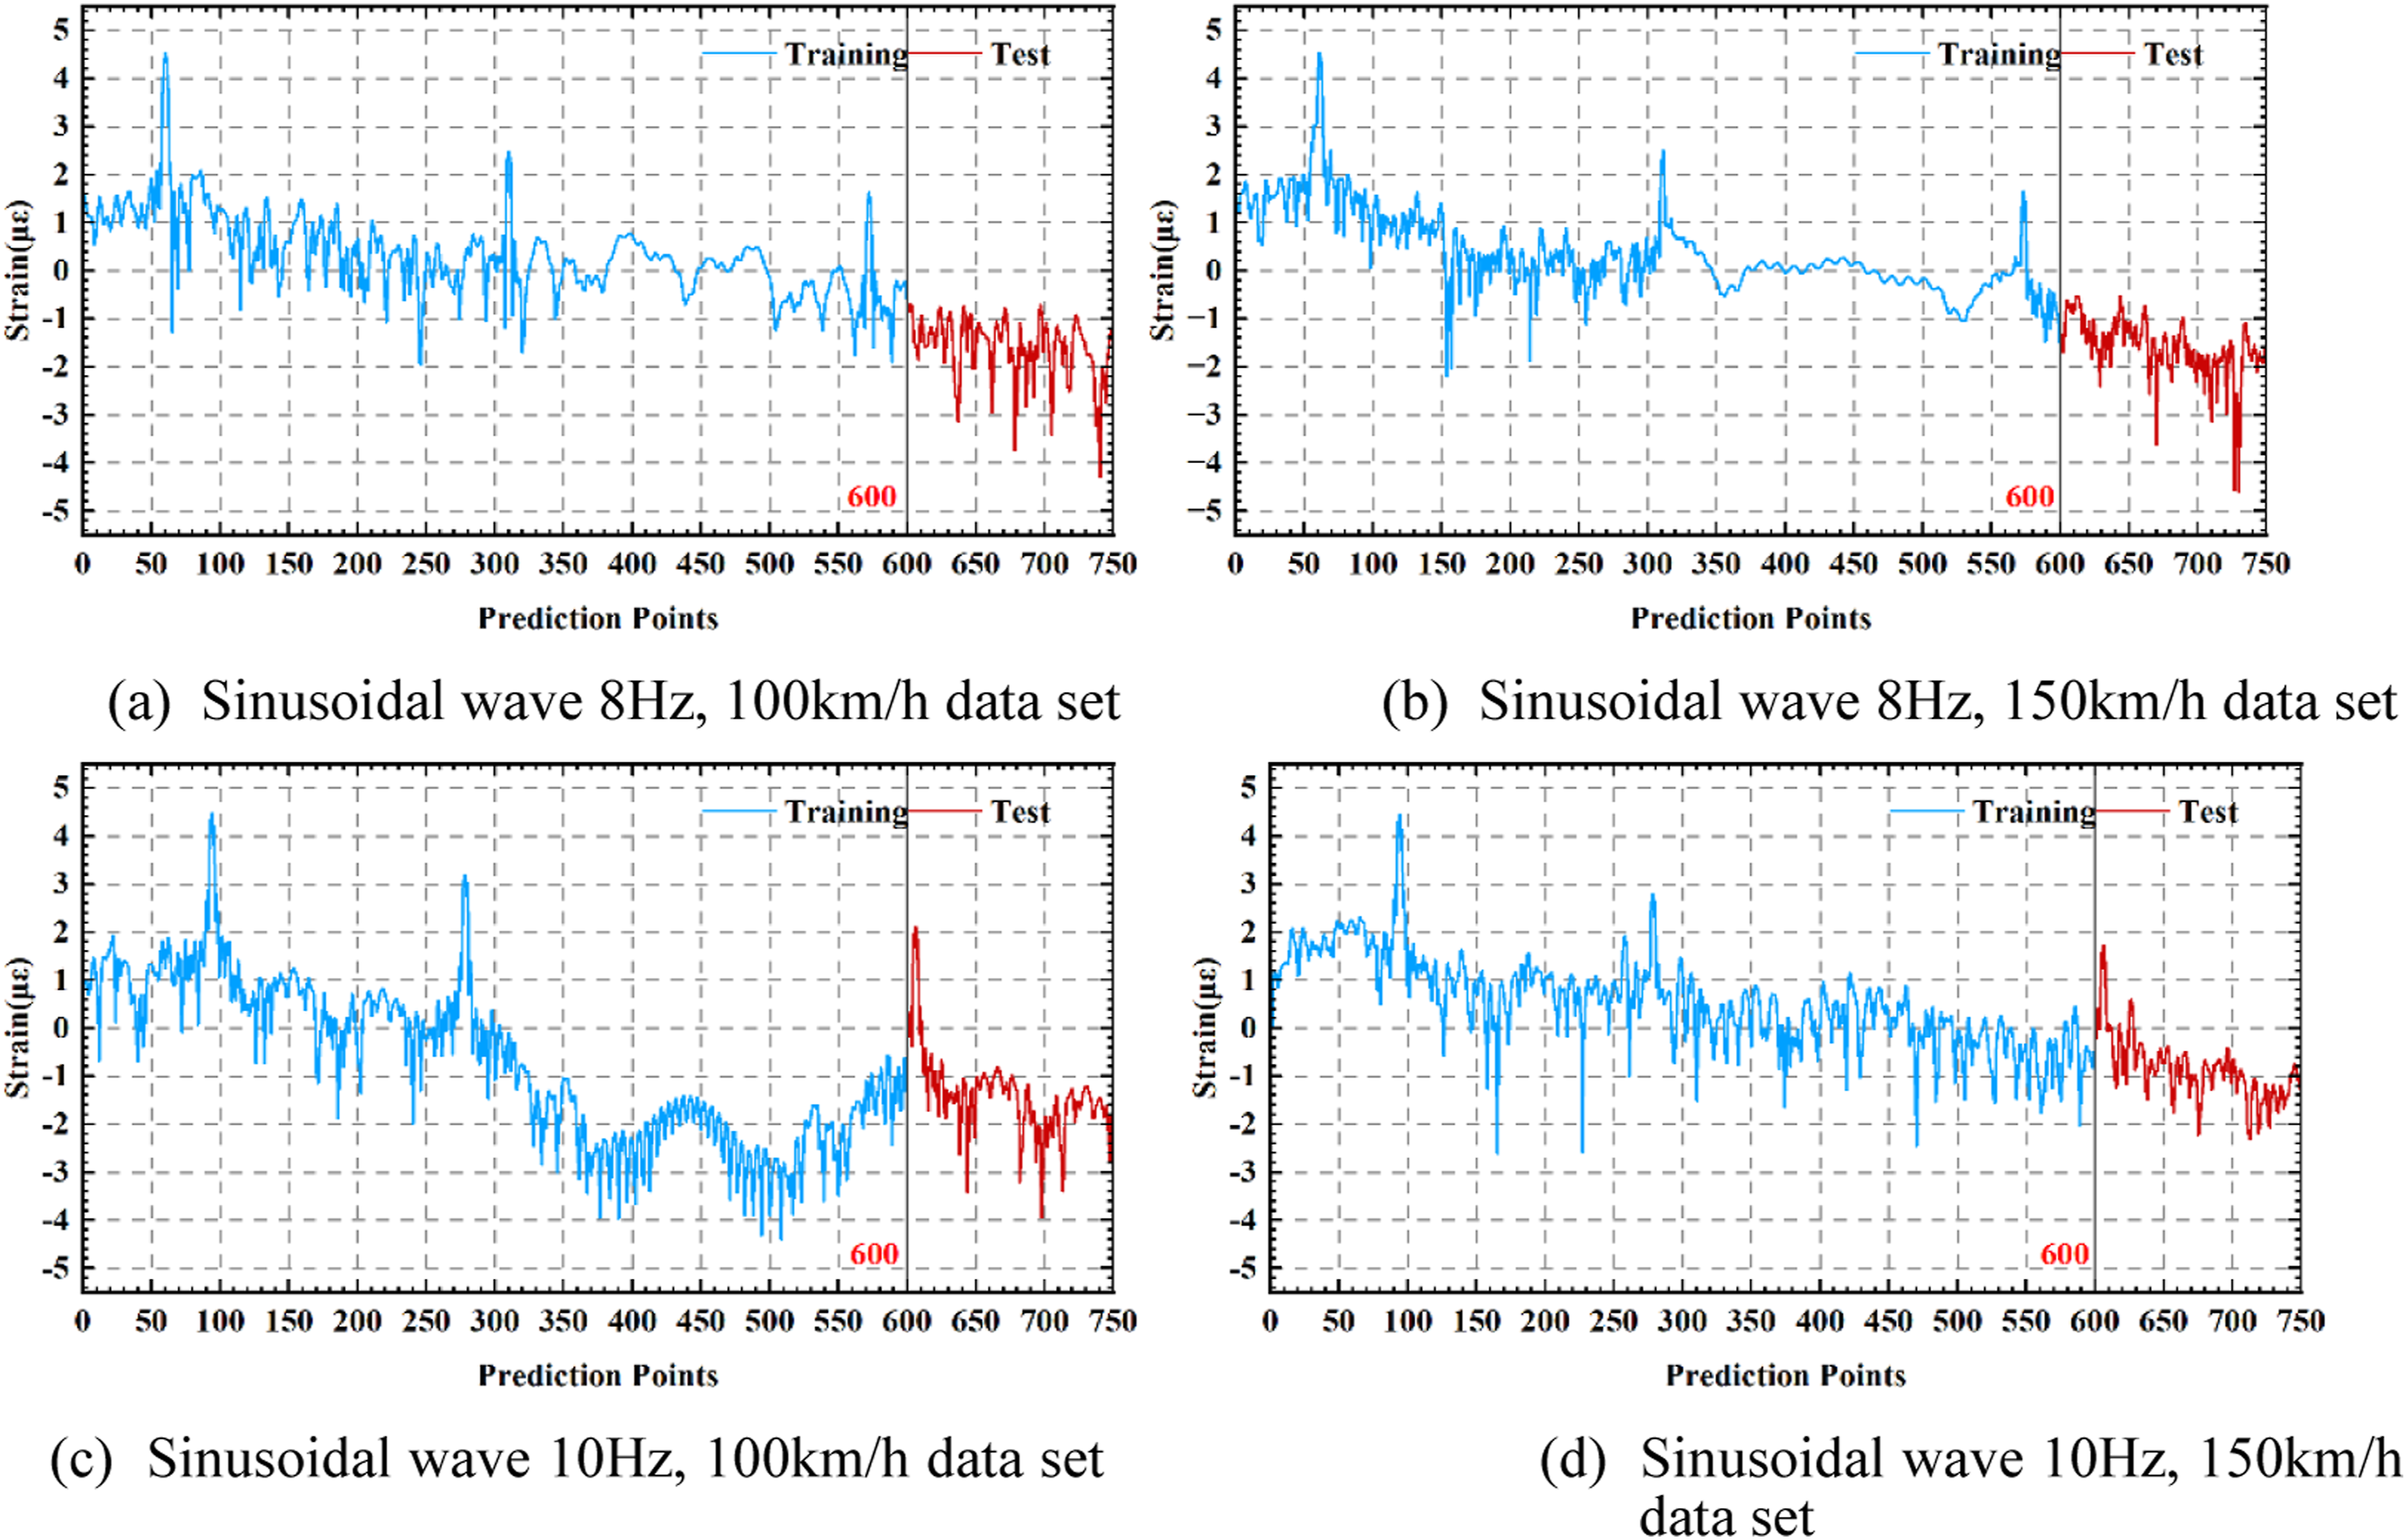
In this paper, the seismic response data measured by the quasi-distributed fibre grating sensor is applied as the data set of the model. Figure 4 shows the location information of the seismic response data measurement points, the spacing of each seismic response measurement point is 450 mm, 7 × 4 total 28 points of the rectangular area. The test was done in 54 groups according to the type of seismic wave, seismic wave acceleration, and vehicle speed, with a total of 54 × 750 = 40,500 data points, of which the first 32,400 data were used as the training set, and the last 8100 data were used as the test set. Due to the test conditions, if the shaker is moved longitudinally, it may lead to a collision between the bridge model and the transition device. Therefore, in this test, the ground motion input direction was set to transverse and vertical. The seismic design code for railway engineering in China stipulates that the vertical ground motion can be considered as the product of the horizontal ground motion and the coefficient k, which can be taken as 2/3. The specific conditions are shown in Table 2. Some of the condition data sets can be seen in Figure 5. Location information for seismic response data measurement points. Seismic test conditions of the travelling system. Partial working condition data. (a) Sinusoidal wave 8 Hz, 100 km/h data set, (b) Sinusoidal wave 8 Hz, 150 km/h data set, (c) Sinusoidal wave 10 Hz, 100 km/h data set, (d) Sinusoidal wave 10 Hz, 150 km/h data set.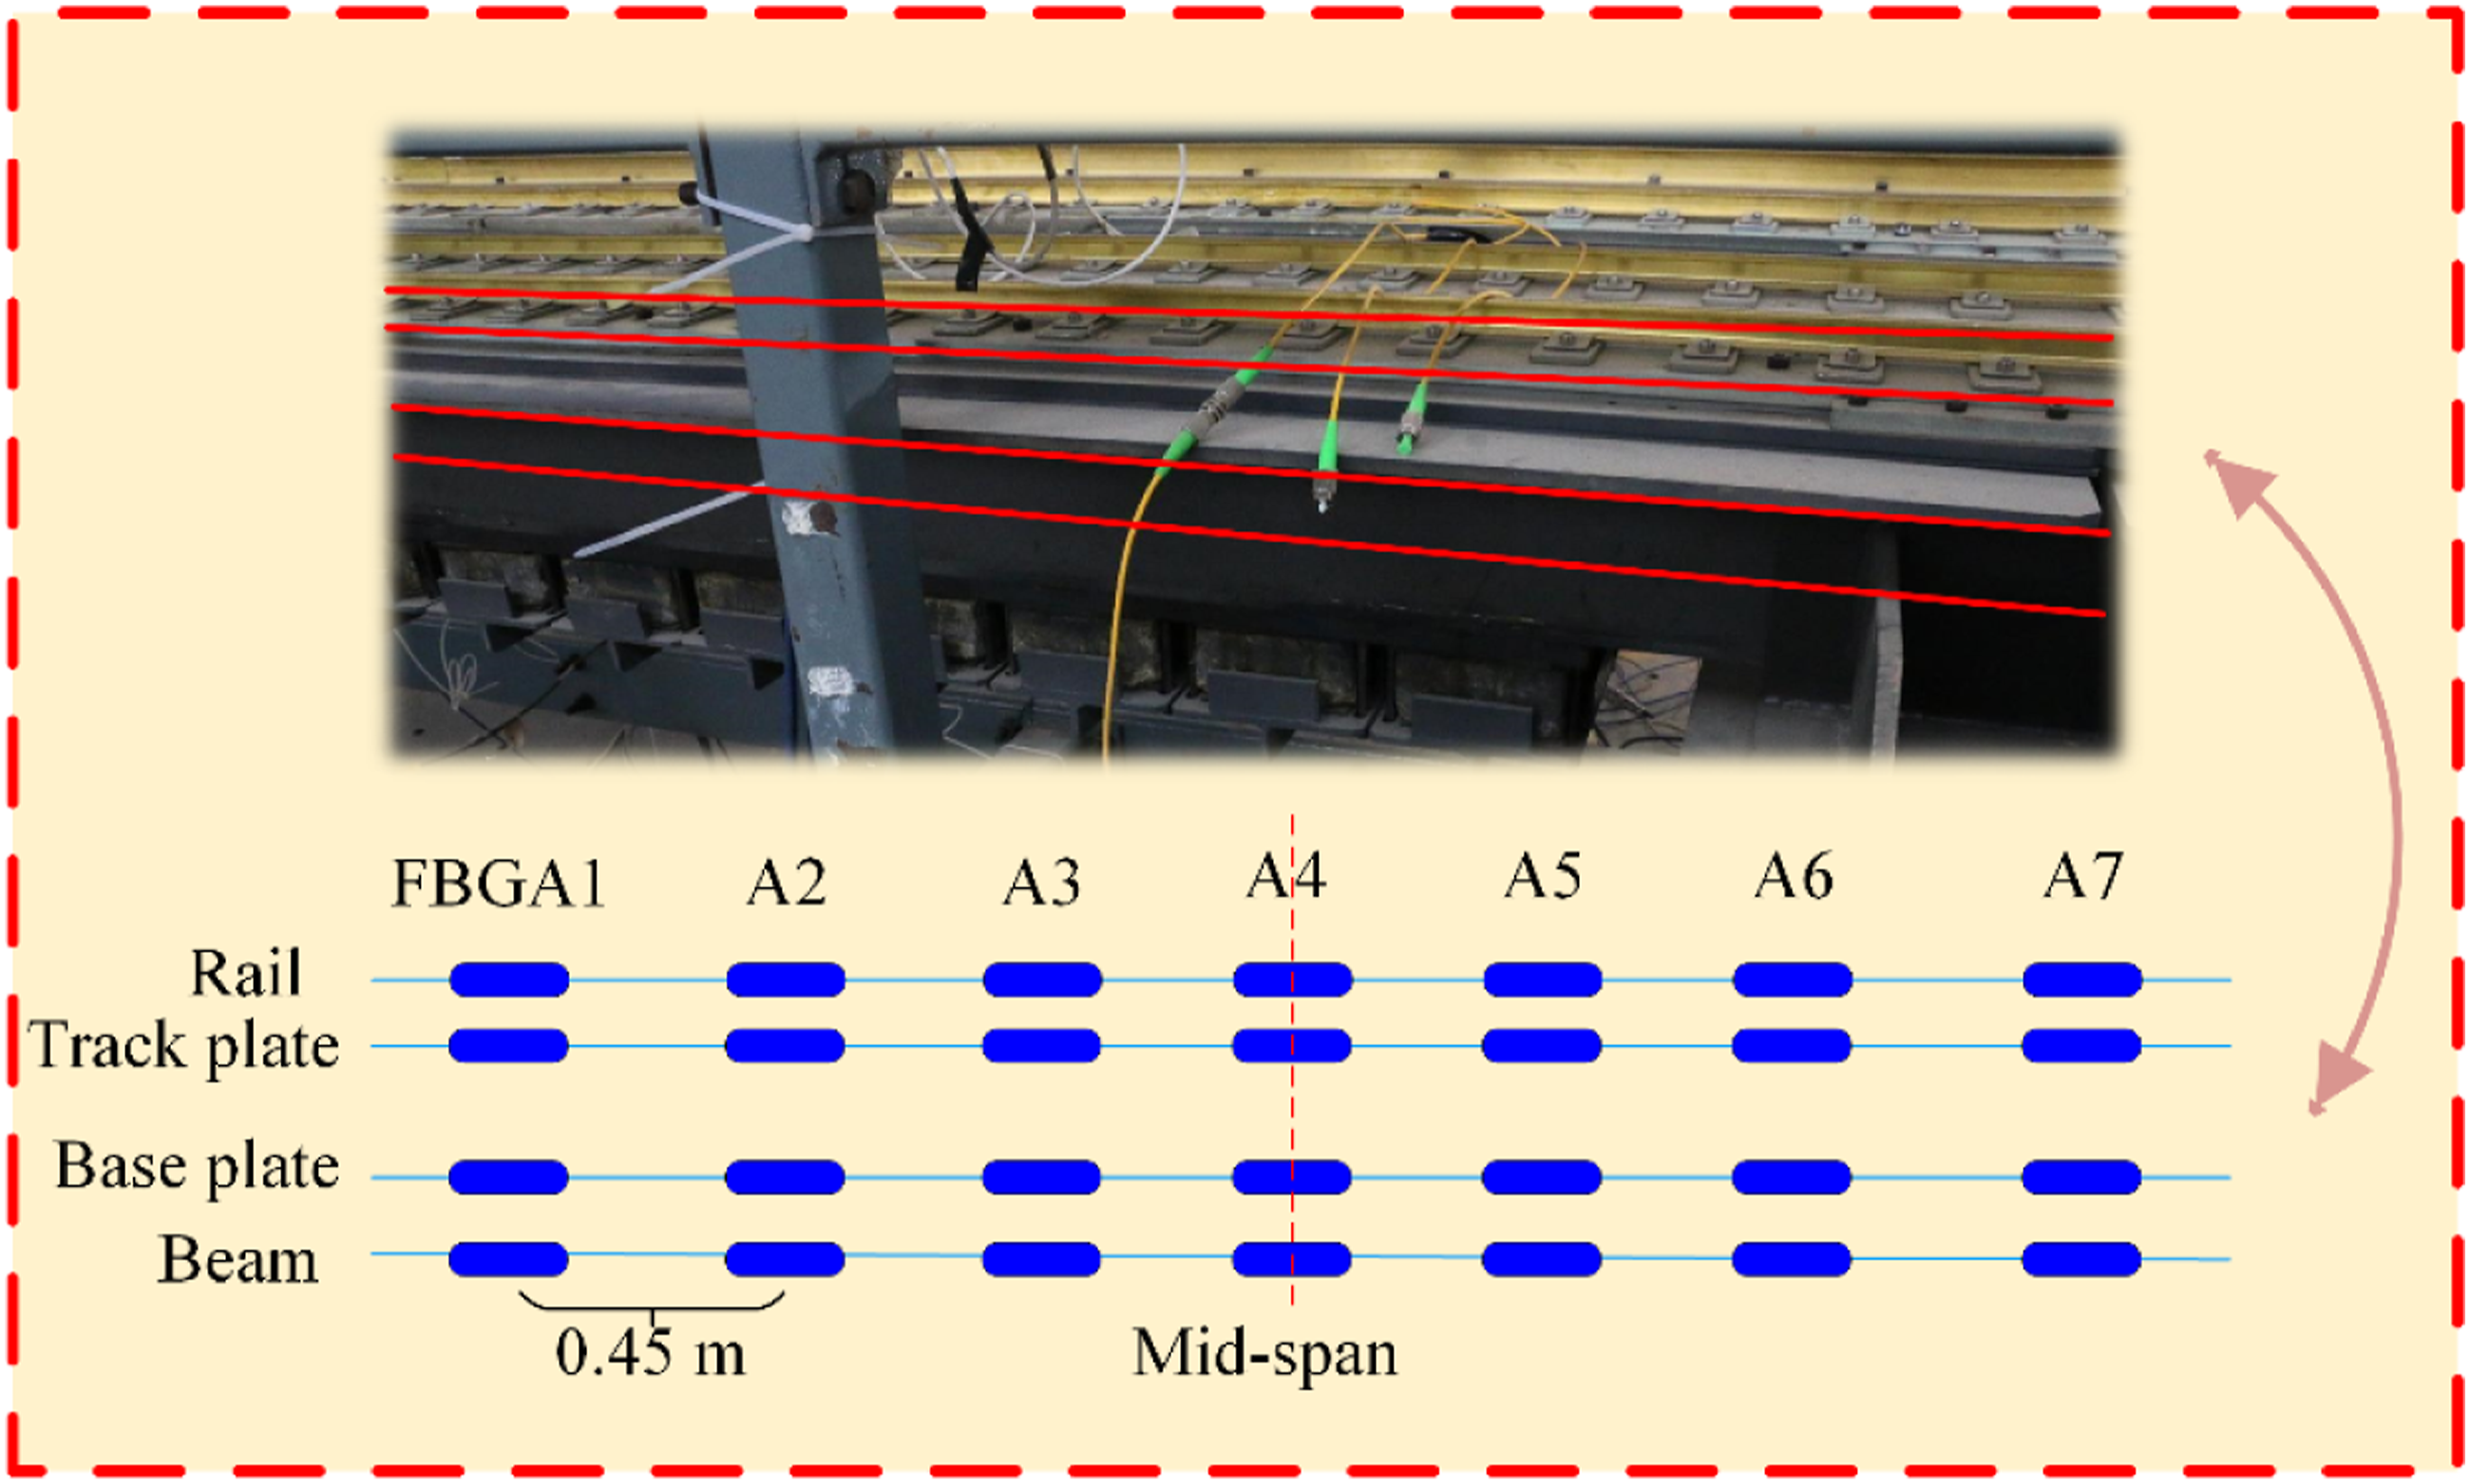

Prediction modeling phase
Proposed forecasting hybrid model
The CNN-BiLSTM-attention hybrid neural network consists of the CNN, BiLSTM, attention mechanism, and feature integration parts (Figure 6). The modeling process can be divided into the following steps: 1. The CNN includes convolutional, batch normali-zation, and pooling layers, with a rectified linear unit (ReLU) activation function. Results of sample construction were shuffled randomly and then fed into the CNN. First, the samples were convolved in the convolutional layer (having 24 convolution filters) along the depth direction. Next, batch normalization and a maximum pooling layer were adopted to optimize the network structure and improve the prediction accuracy of in situ stresses. Finally, the ReLU activation function was used to perform non-linear mapping of the output results. The local features of logging data can be extracted in this process using a convolutional layer. There-fore, the CNN can capture the step change of the insitu stresses in a certain interval. The theory of CNN is illustrated in Appendix A. 2. The BiLSTM part includes two BiLSTM neural network layers and two hyperbolic tangent (Tanh) activation functions, with each BiLSTM neural network layer having a hidden state of 12 dimensions. The samples are simultaneously fed into the CNN the BiLSTM; however, the samples should be transformed for data dimension because the CNN and BiLSTM have different requirements for it. The feature information is remembered and forgotten selectively to realize the variation trend and forward–backward correlation of logging information with depth, and effectively prevent the vanishing or exploding gradients. The Tanh function was selected as the non-linear activation function, to extract sequential features of the logging data using the BiLSTM neural network layer. Therefore, the BiLSTM is suitable for processing logging data in a depth series. The BiLSTM theory is presented in Appendix B. 3. The attention mechanism includes a softmax function layer, linear layer, and multiply function layer. To avoid overfitting, dropout is applied to the CNN part output with a probability of 0.3. Simultaneously, dimension transformation is applied to the BiLSTM output to make it more convenient for multiplication operations. The realization process of the attention mechanism is essentially a weighted summation process. Several non-critical features exist after extracting features from the training set using the CNN and BiLSTM neural network and affect the prediction results. To solve this problem, we need to pay more attention to the key features. First, the soft-max function was used to calculate the weight of each feature value of the CNN output, which was completed after the linear layer. Point multi-plication was then performed between the calculated weights and the feature values of the BiLSTM output to focus more on the key features. A higher contribution generally denoted a larger weight that can be assigned to the output feature. The theory of attention is illustrated in Appendix C. 4. The feature integration part includes a flattened layer, linear layer, and sigmoid activation function. After passing the attention mechanism, the data are fed into the flattened and linear layers, and the sigmoid function is selected as the non-linear activation function to integrate the output features and finally generate the predicted horizontal insitu stresses. CNN-BiLSTM-Attention hybrid neural network model structure.
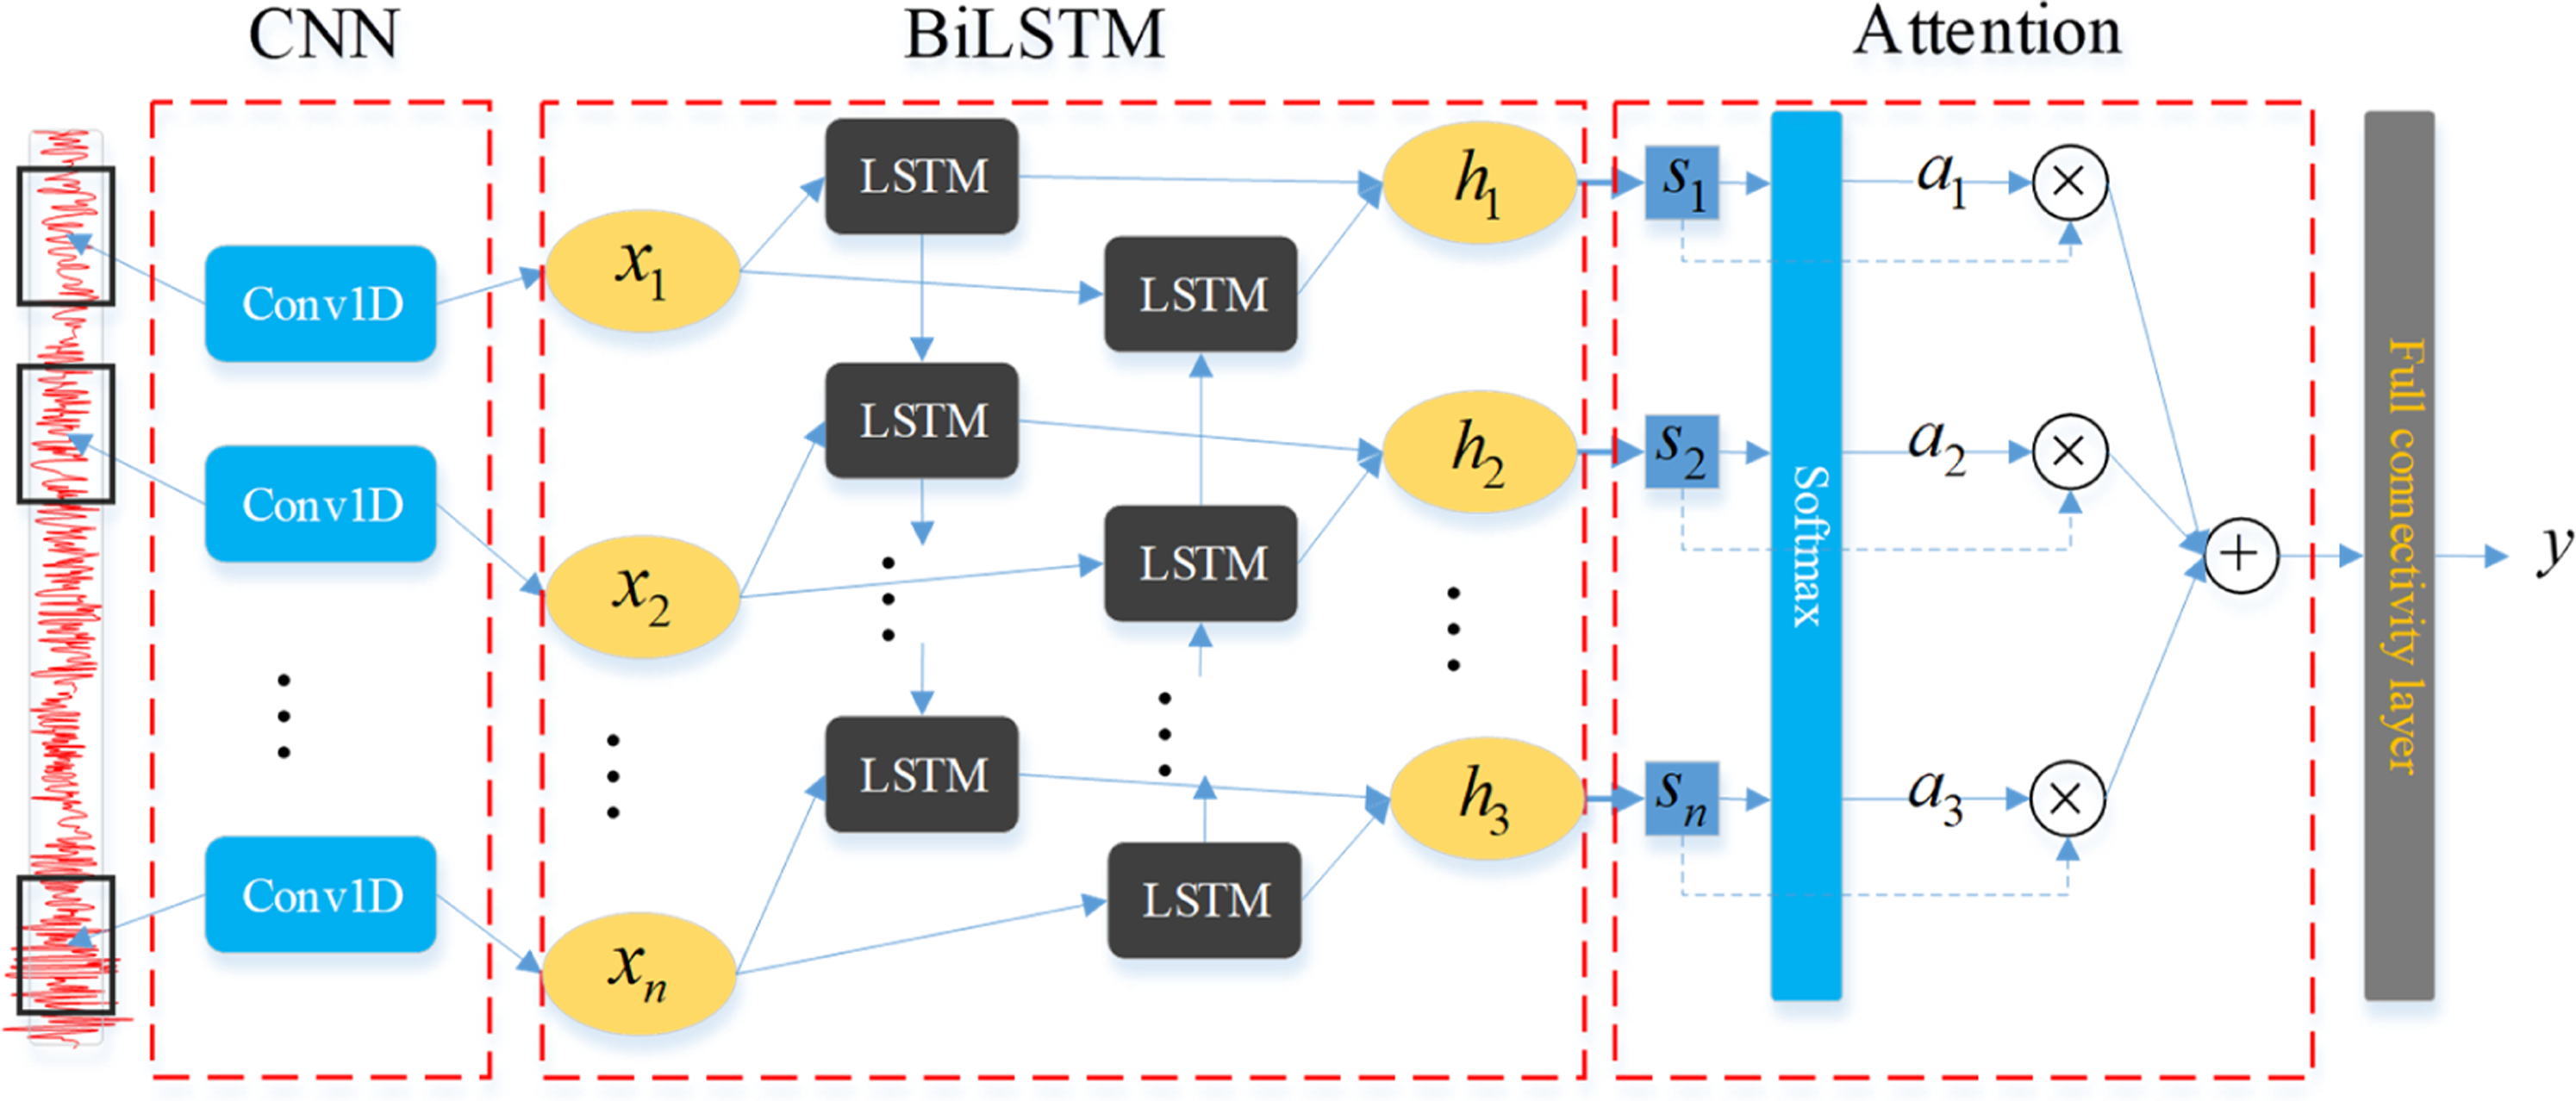
As mentioned above, the CNN-BiLSTM-Attention Attention model mainly contains three important components, that is, Convolutional Neural Network (CNN), Bidirectional Long and Short-Term Memory Neural Network (BiLSTM) and Attention Mechanism. Firstly, the acquired seismic strain response is used as an input into and convolutional layer, and the CNN is used as a kind of deep feature decoder to extract spatial features. The features are extracted from the training set and input to the BiLSTM layer, and the deep features of the next layer are obtained by training and optimising the parameters of the BiLSTM layer. The deep features obtained from the BiLSTM layer are weight resolved by the Attention layer to extract the main features, and finally output as the final predicted strain response through the fully connected layer.
To provide a clear understanding of the CNN-BiLSTM-Attention model used for seismic response prediction, the network architecture is meticulously detailed below. This architecture effectively handles the complexities of seismic data, leveraging spatial and temporal patterns to enhance prediction accuracy.
Detailed architecture of the CNN-BiLSTM-attention model.

The layers are configured to progressively refine the input data, extracting meaningful spatial and temporal features, which are then synthesized in the output layer to predict the seismic responses over the last 150 data points. The combination of CNN for feature extraction, BiLSTM for capturing temporal dependencies, and the attention mechanism for emphasizing significant features ensures robust prediction capabilities.
Results of ML models
Comparison of CNN-BiLSTM-attention model’s prediction results at a single point with the true value
In this part, the last working condition of the data set (artificial wave RSN170, peak acceleration 0.21 g, 1.09 times) (60 data points) was selected to test the prediction effect of the model. Since there are 28 points of quasi-distributed fibre optic gratings deployed, it is difficult to compare the prediction results of the data points one by one, so a total of six measurement points are selected for sampling in this section. In order to facilitate the representation of the coordinates of the measurement points. Rail ( Six test point selection locations.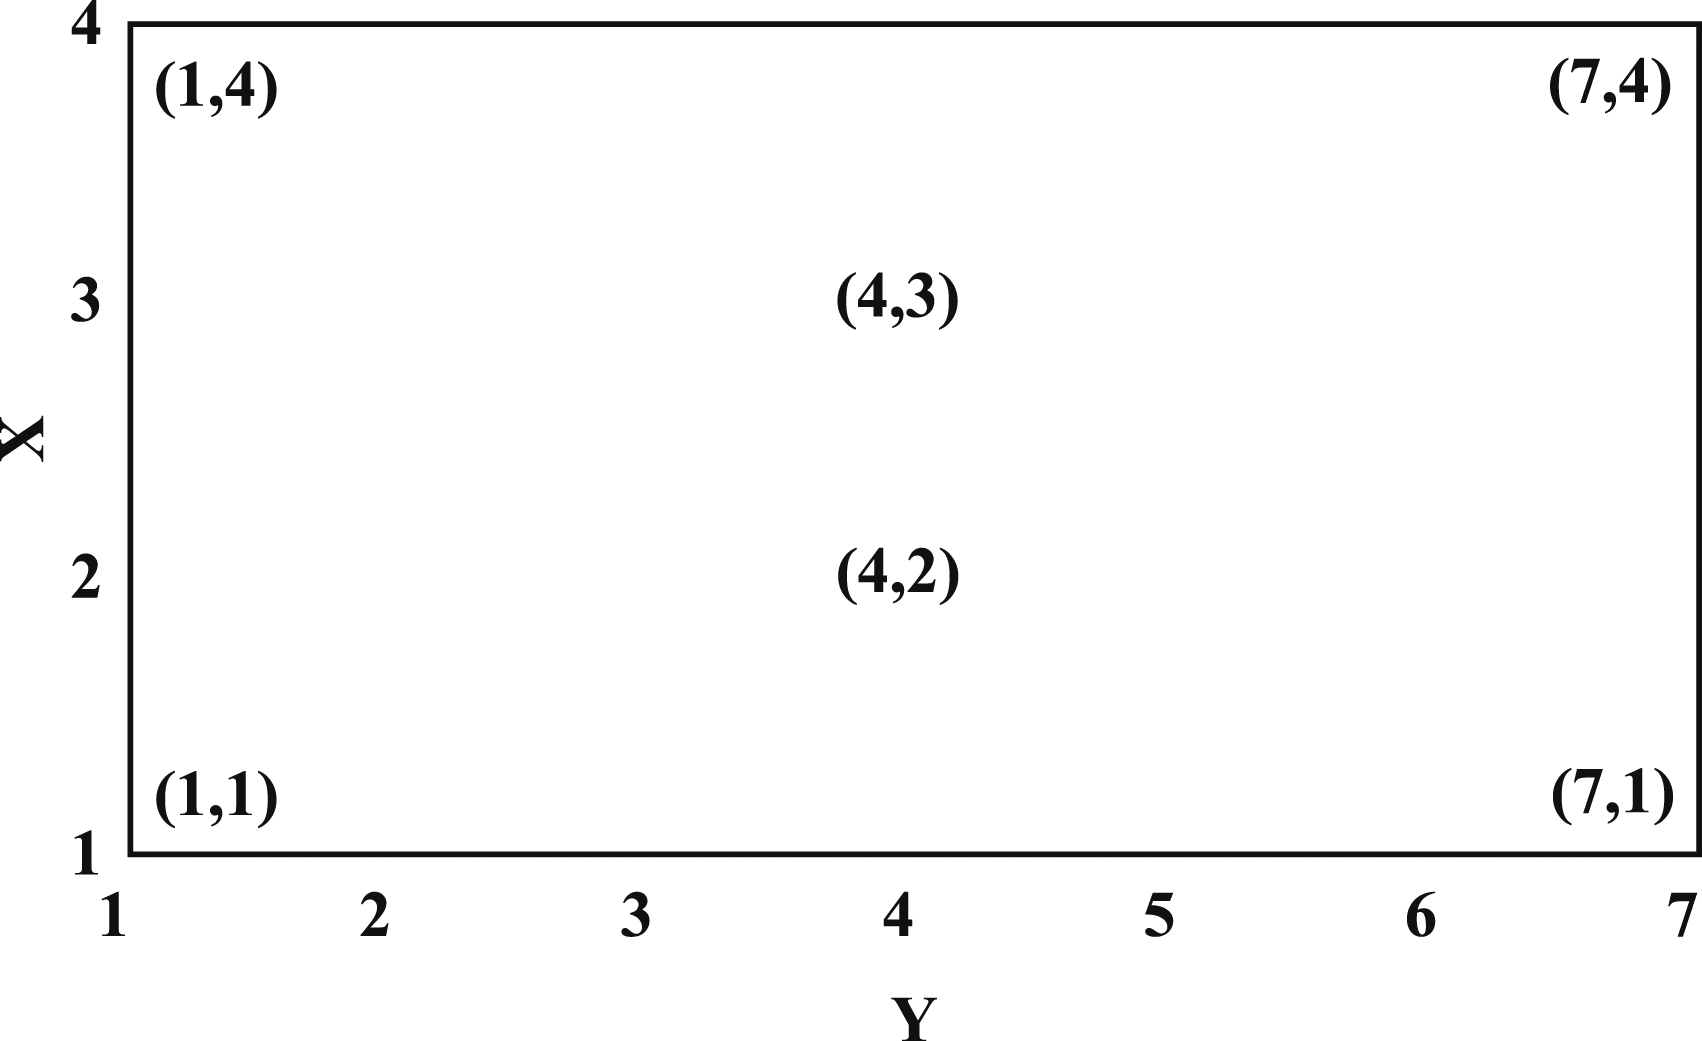
As shown in Figure 8, the comparison between the predicted and actual values of the CNN-BiLSTM-Attention model at six measurement points is shown. The spatial strain variation trends of the six measurement points are different, and the error between the predicted and actual strain values of the CNN-BiLSTM-Attention model is small. When the strain change is gentle such as (2,4) point 0∼5 the prediction point error is relatively large. While when the strain response varies greatly such as near the (1,1) prediction point 30, near the (1,7) prediction point 20, near the (2,3) prediction point 33, near the (3,4) prediction point 35, near the (4,1) prediction point 40, and near the (4,7) prediction point 42 the predicted values are more in line with the actual values, and the performance is stable across different measurement points. Comparison of predicted and actual values of CNN-BiLSTM-Attention model under six test points at different locations: (a) (1,1), (b) (1,7), (c) (2,4), (d) (3,4), (e) (4,1), (f) (4,7).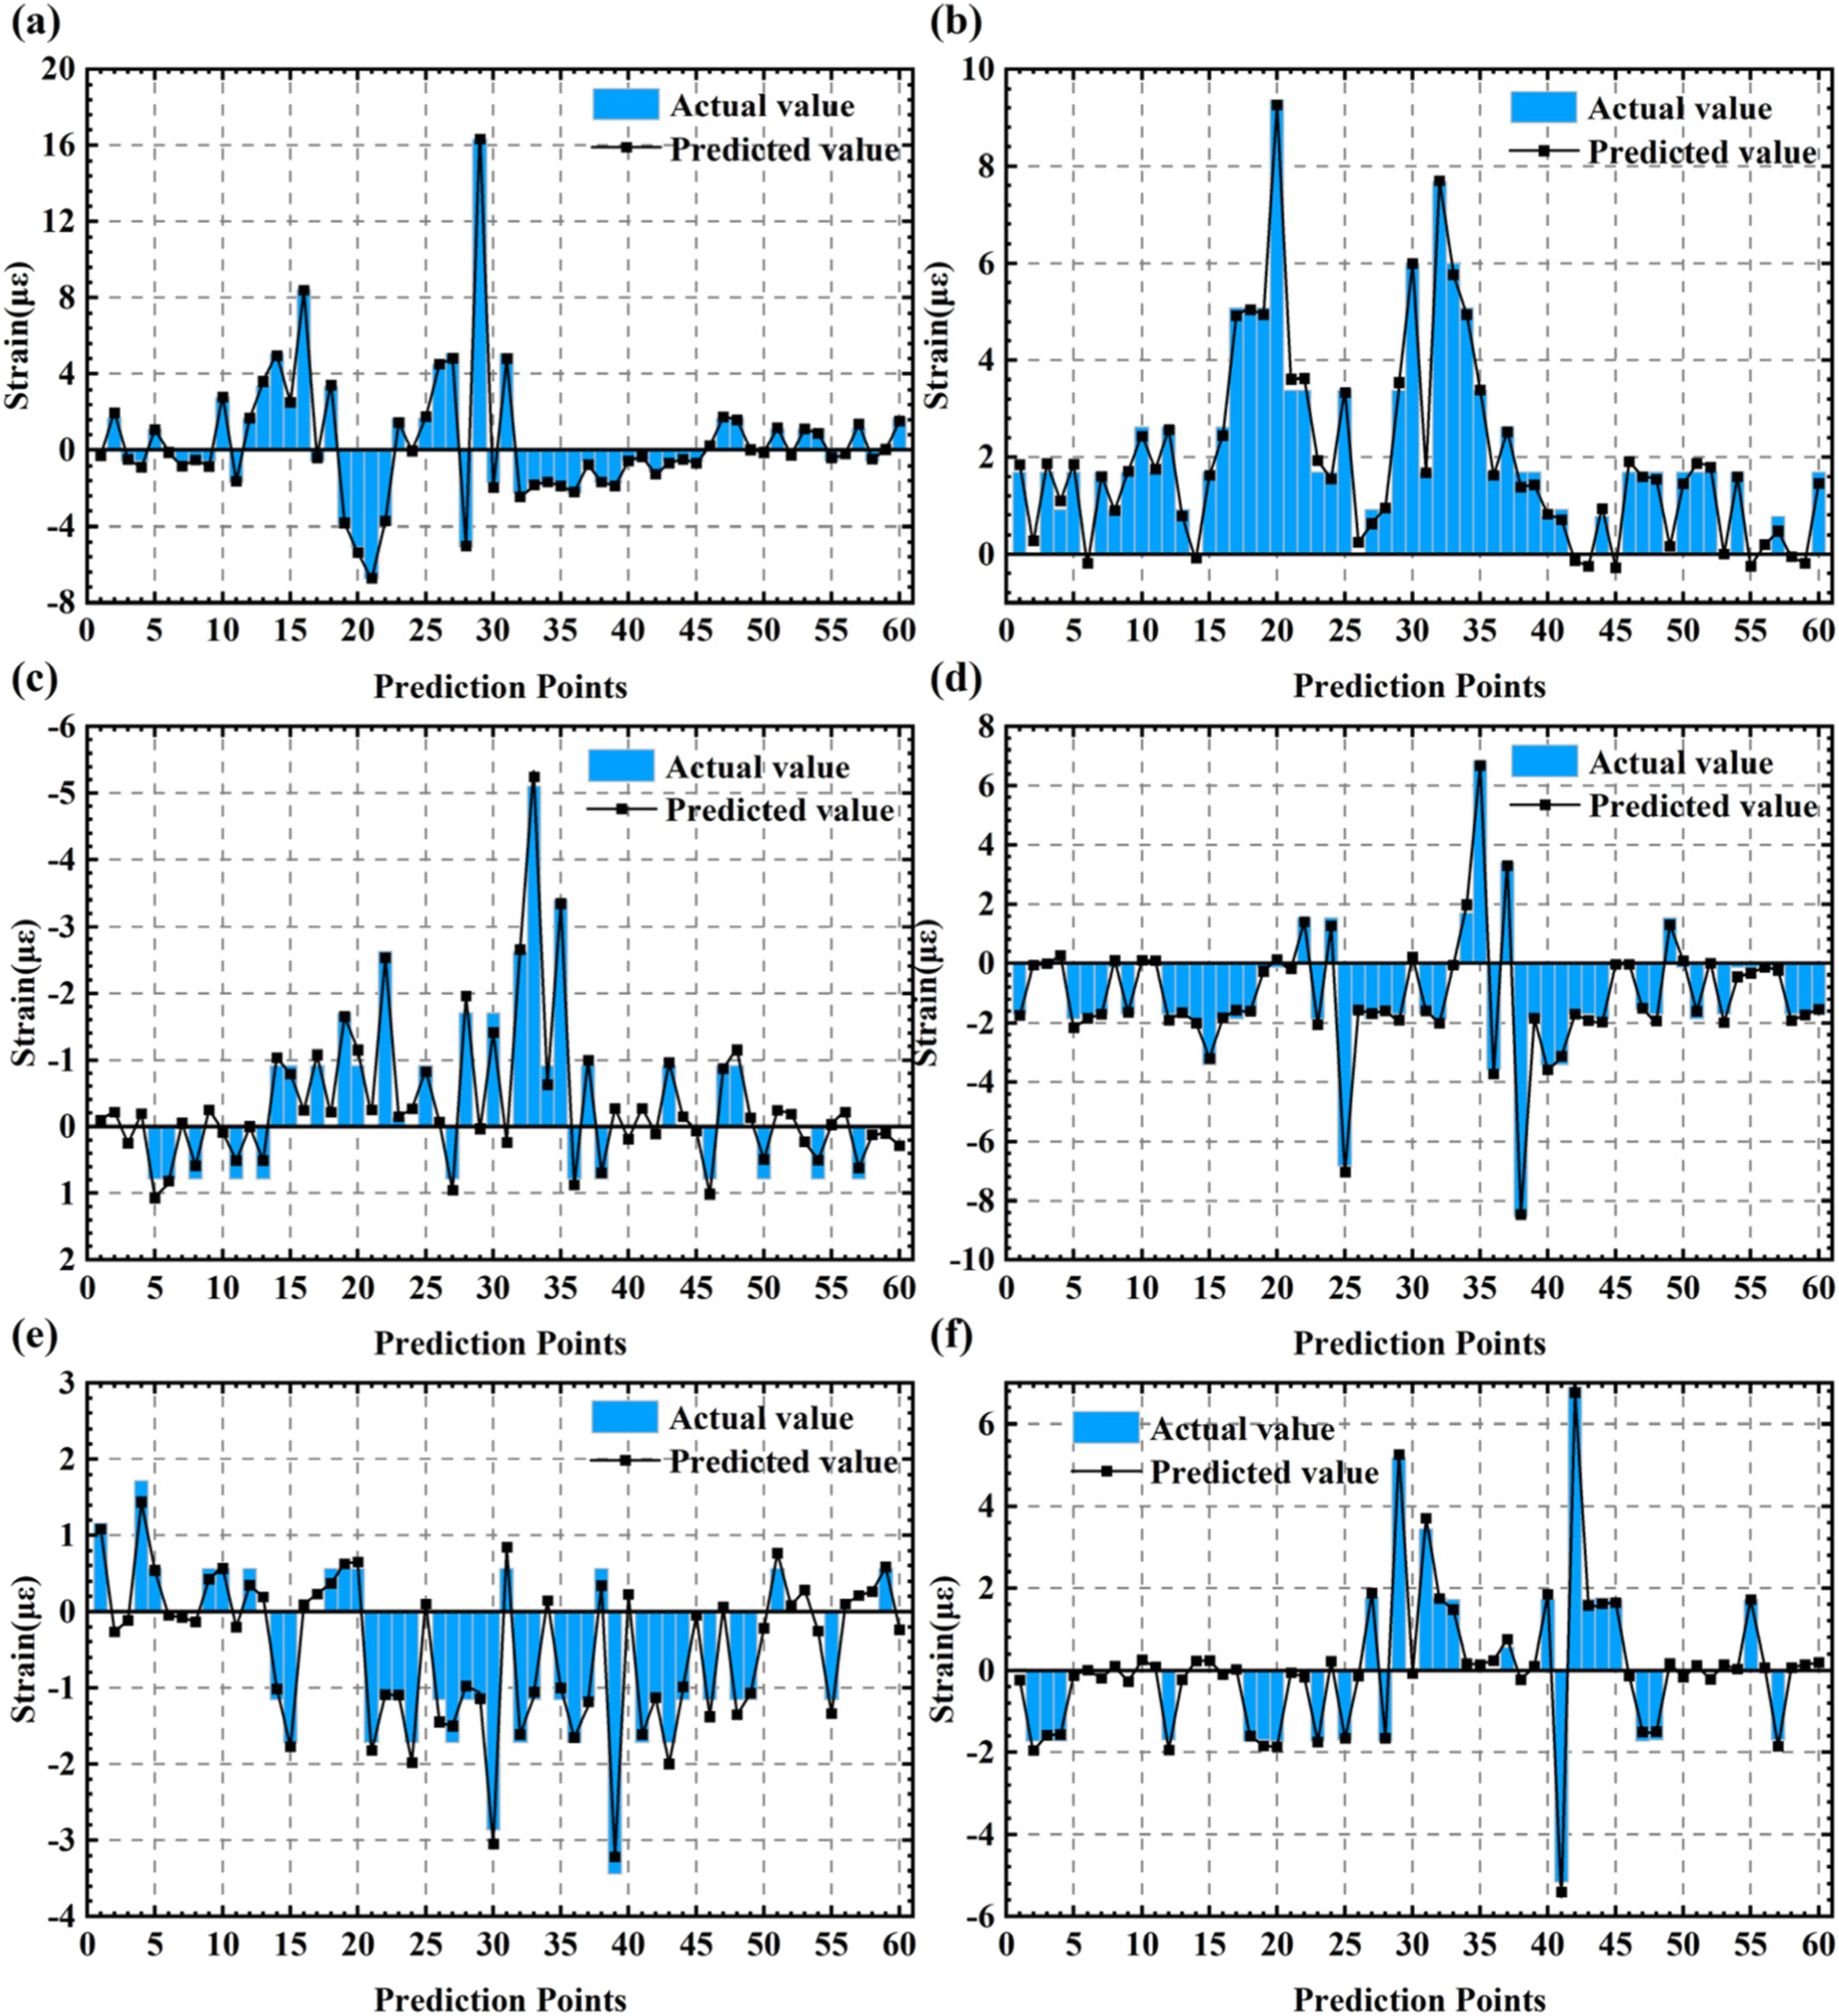
Figure 8(a) and (b) shows the measurement points at the head and tail ends at the rail. It can be seen that the predicted values of the two measurement points are smaller than the actual values when the strain is larger, and the predicted values are larger than the actual values when the partial strain is smaller. Figure 5(c) and (d) shows the prediction effect of the measurement points in the mid-span region of the track plate (2,4) and the base plate (3,4), respectively, and it can be seen that the strain value of the track plate changes more frequently, and the strain threshold of the base plate is larger. The CNN-BiLSTM-Attention model shows a more stable prediction effect in (3,4) with less error, and the fold line in (2,4) and the bar chart have less overlapping values. Values in (2,4) overlap less. It shows that the CNN-BiLSTM-Attention model exhibits higher prediction accuracy compared to the track office measurement points despite the large variation of the base plate strain response. Figure 5(e) and (f) shows the measurement points at the first and last ends of the box girder, and it can be seen that compared with the other four measurement points, the strain thresholds are smaller, and the magnitude of the discrepancy between the predicted and actual values is significantly higher than that of the other measurement points, no matter at the time when the strain is close to 0 or at the time when the strain value is larger. In summary, it can be shown that: (1) The CNN-BiLSTM-Attention model has a high prediction accuracy for the constructed area field, and there is no significant degradation of the prediction effect due to changes in the location of the measurement points. (2) The larger strain response near the track slab slightly affects the model prediction, and the predicted value is lower than the actual value. The CNN-BiLSTM-Attention model shows better performance in the base slab than in the track slab. The box girder strain is relatively poorly predicted even though it is small. It can be surmised that the model has a higher prediction accuracy for where the strain varies a lot.
Values of indicators for evaluating the prediction accuracy of six points.

These results highlight the CNN-BiLSTM-Attention model’s robust predictive accuracy, particularly demonstrating high R2 values, suggesting that the model can effectively predict seismic responses under diverse conditions. The analysis confirms that while the model performs exceptionally well in capturing dynamic strain variations, some discrepancies are observed in more subtle strain changes.
In summary, the CNN-BiLSTM-Attention model has demonstrated high predictive accuracy for the constructed area field, and there is no significant degradation of the prediction effect due to changes in the location of the measurement points. The larger strain responses near the track slab slightly affect the model prediction, and the predicted values are generally lower than the actual values. The model shows better performance in the base slab than in the track slab, and while the box girder strain is relatively poorly predicted, it is surmised that the model has a higher prediction accuracy where the strain varies significantly.
Comparison of CNN-BiLSTM-attention model’s prediction results with the true values in the whole region
There are more types of working conditions in this test, and the data set of prediction results is also larger. Therefore, in this section, we will only consider all the seismic response prediction results of four different specimen points randomly selected from the 60 time points of the last condition for the accuracy verification of the model prediction, and the selected time points are the 15th, 30th, 45th and 60th time points.
From Figure 9, it can be seen that the CNN-BiLSTM-Attention model has high accuracy in the prediction results and observation values across the entire region. The prediction accuracy does not decrease due to changes in the middle area or the edge area, demonstrating the model’s stability. For the whole region (each fiber grating is 6 × 350 mm long), the seismic response values between adjacent points are very close to each other, and the difference between adjacent points is within 0.3 με. This phenomenon enables improving the accuracy of prediction results by selecting a nearby response measurement point and using its historical seismic response data for the prediction model. Comparison of actual and predicted strain responses of the CNN-BiLSTM-Attention model at different time points. Time 15 (a–b), Time 30 (c–d), Time 45 (e–f), Time 60 (g–h); 3D scatter plots in left subfigures, heatmaps in right subfigures.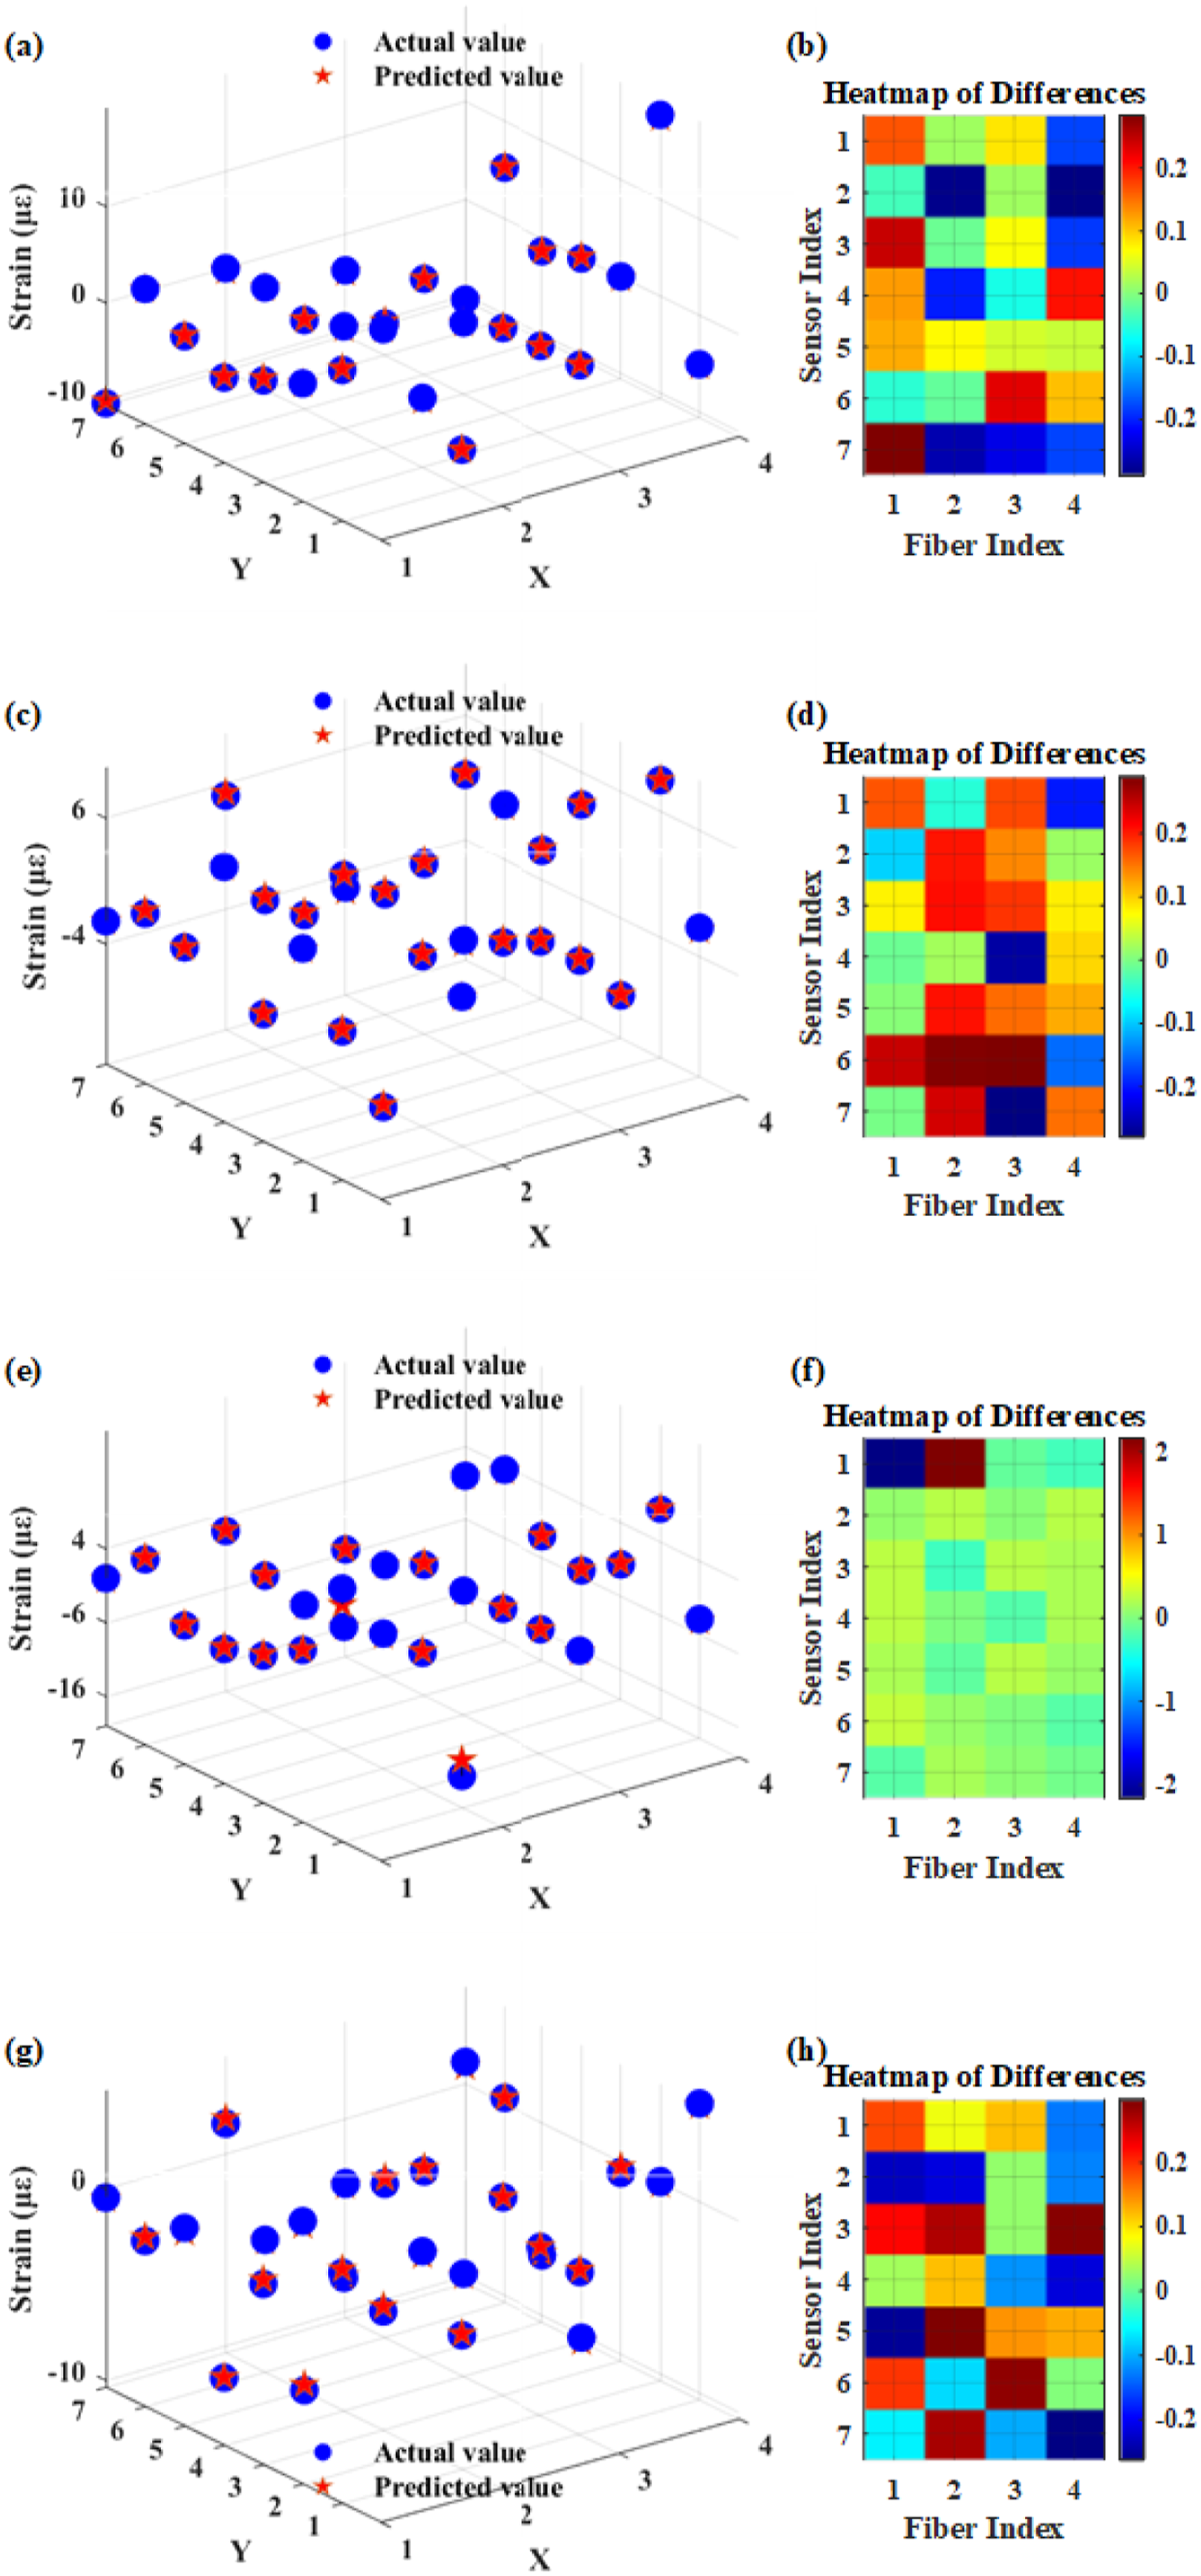
The 3D scatter plots (Figure 9(a), (c), (e), and (g)) illustrate the actual and predicted strain responses at different time points (15, 30, 45, and 60). The comparison shows that the model’s predictions are in good agreement with the actual observations.
The heatmaps (Figure 9(b), (d), (f), and (h)) provide a visual representation of the differences between actual and predicted strain responses. These heatmaps clearly show that the differences are minimal, further demonstrating the high prediction accuracy of the CNN-BiLSTM-Attention model.
From this, we can conclude: (1) The small gap in seismic response between different measurement points within the region demonstrates the possibility of using a convolutional neural network to improve the accuracy of single-point seismic response prediction by utilizing the past seismic response information of the surrounding raster measurement points. (2) The CNN-BiLSTM-Attention model has high prediction accuracy over the whole region, both at the edges and in the middle of the region. The prediction results of this model are very stable and achieve high accuracy in the regional seismic response prediction problem. (3) The CNN-BiLSTM-Attention model ensures that the predicted values are in good agreement with the observed values at the selected time points, and the model achieves good prediction results in the whole experiment, both in terms of the seismic response values of a single location and the distribution of the whole region. (4) The CNN-BiLSTM-Attention model can be used for the prediction of seismic response in the whole region of the fiber grating spatial field. It can predict the future seismic strain response in the whole region and has a high prediction accuracy for each measurement point.
Comparison of CNN-BiLSTM-attention model with common deep learning models
This section compares the CNN-BiLSTM-Attention model with two commonly used models for seismic response prediction. The evaluation is performed using data from 17520 of the test set. Figure 10 shows the distribution of the prediction results of the three different models (CNN-BiLSTM-Attention, LSTM, RNN). The straight lines in the graph represent the predicted values are equal to the actual values of seismic response. Distribution of prediction results for three different models (CNN-BiLSTM-Attention, LSTM, RNN). (a) CNN-BiLSTM-Attention Prediction Distribution, (b) LSTM Prediction Distribution, (c) RNN Prediction Distribution.
As shown in Figure 10(a), the distribution of the seismic response strain values from large to small shows that the points with small and medium seismic strain response are more densely populated in the dataset for the present test condition. There are fewer points above that. The distribution points of the expected results are uniformly distributed along the line connecting the predicted and actual values and are quite close to the line. In contrast, the predictions of the CNN-BiLSTM-Attention model deviate slightly from the straight line when the seismic response is small, especially where the seismic response is below 3 με, suggesting that the model’s predictions usually outperform the observed values when the seismic response is small. For places where the seismic response is between 5 με and 17 με, the prediction accuracy is good. For places with seismic responses above 20 με, the predicted seismic responses seem to be lower than the actual values.
As shown in Figure 10(b), the predictions of the LSTM model are roughly at the places where the straight lines are similar, but compared to Figure 10(a), the LSTM model has more points that are further away from each other. For the portion of the seismic response less than 3 με, the predictions of the LSTM model are the same as those of the CNN-BiLSTM-Attention model, and most of the points are larger than the actual values. The predictions of the seismic response are more than the actual values and deviate more from the straight line, and the error is higher for the part of the seismic response greater than 20 με.
As shown in Figure 10(c), the distribution of the RNN model prediction results deviates from the straight line obviously. When the seismic response is small (below 8 με), the seismic response is predicted above y = x, and the error is larger. When the seismic response is between 8με and 12με, the predicted points are closer to the actual values, but the deviation is much larger than the previous two models. When the seismic response exceeds 12με, the predicted point of seismic response is lower than the actual value. And the deviation increases with the increase of the seismic strain response value.
Values of indicators for evaluating the prediction accuracy of the three models.

Conclusion
In this study, a CNN-BiLSTM-attention hybrid neural network model was proposed to predict seismic response. The prediction accuracy of the model is trained and validated with real datasets collected from a quasi-distributed system with predefined operating conditions. The point prediction results of the model are evaluated using three metrics: RMSE, MAE, and R2. The main conclusions are as follows: (1) The proposed model predicts the seismic strain response of a spatial monitoring area constructed with quasi-distributed fibre gratings, both in terms of time-series prediction of a single point and prediction of a quasi-distributed monitoring point at the same moment in time. (2) CNN-BiLSTM-attention makes full use of the representation ability of spatial features of CNNs, the sequential information processing ability of BiLSTMs, and the attention ability of important features of the attention mechanism to provide better performance compared to traditional neural network models. (3) The CNN-BiLSTM-Attention model accurately predicts the seismic response regardless of the fluctuation interval of the seismic response, and the improvement of the seismic response prediction accuracy is much larger when the seismic response is smaller or larger. The prediction decision coefficient reaches 94.46 percentTherefore, this model is recommended for the corresponding prediction of train-bridge system earthquakes
Footnotes
Declaration of conflicting interests
The author(s) declared no potential conflicts of interest with respect to the research, authorship, and/or publication of this article.
Funding
The author(s) disclosed receipt of the following financial support for the research, authorship, and/or publication of this article: This research work was financially supported by the National Natural Science Foundation of China (Grant No. 11972379), Hunan:100-talent plan, Hunan high-level talent plan (Grant No. 2024AQ2018) and Central South University Research: Project Nos. 2022-major-17 (innovation-drivenproject) and 2022-major-14.

Appendix A: Convolutional neural networks
The processing of image data by ANN is inefficient since there are too many inputs and training parameters. CNNs were created in order to work around the constraints of ANNs while analyzing class image data. CNN is the first genuinely constructed multilayer neural network technique with high network depth scalability. The number of network parameters is minimized while the deep characteristics of multidimensional data are preserved by using convolutional and pooling techniques. As a result, CNNs are frequently utilized in image recognition and computer vision. Convolutional layers, pooling layers, and fully linked layers comprise the CNN architecture. Brief descriptions of these several levels are provided below.
Appendix B: Bidirectional long short-term memory
The LSTM network is a kind of temporal recurrent neural network that has been modified (RNN). It has been suggested and enhanced with the inclusion of another forgetting gate. The upgraded LSTM network eliminates the issue of “gradient disappearance” in model training and can learn long and short term time series dependent information. Figure 13 depicts the network’s core units. Basic units of LSTM.
The LSTM network’s fundamental unit consists of forgetting gates, input gates, and output gates (Xiang et al., 2023c). Together with the state memory unit
In the realm of BiLSTM neural network, the central tenet is to ensure that the feature data acquired at time instant t is imbued with information from both past and future simultaneously. This is achieved through its constitutive elements: a forward LSTM and a backward LSTM. The forward LSTM processes the data from past to present, while the backward LSTM navigates from future to past. This bidirectional processing furnishes a rich contextual framework, enabling the model to have access to remote data in both input directions, thereby enhancing the model’s comprehension and prediction accuracy for temporally complex data sequences (Li et al., 2020). The BiLSTM network structure is shown in Figure 14. Schematic diagram of BiLSTM network structure.
The output of BiLSTM is the matrix obtained by forward propagation and backpropagation by concatenating
Appendix C: Attention mechanism
Attentional mechanisms were originally proposed and applied to solve image-related problems (Carrasco, 2011). It has recently been applied to the field of natural language processing. Here, we use the attention mechanism to compute the weights of the feature vectors output from the BiLSTM network at different time steps and assign higher weights to important features to ensure that the network can have better performance.
The structure of the attention model in this paper is shown in Figure 15. Structure of the attention model.
In the figure,
The Attention mechanism is modeled as follows: