



Abstract
The main factor in the collapse of steel structures is the bearing capacity of beam-column connections. One of the most common connection types for steel structures is the T stub connection. The bearing capacity of these connections is affected by loads such as earthquakes and fire. Therefore, in this study, the fire effect and the high-temperature value at the T connection were investigated to examine their effects on the behavior of the connection zone. The study was conducted using 15 T-Stub connections. T-Stub bolted joints examined in the study were produced using IPE standard profiles. Three cross-sections were used, with tf/tw ratios of 1.52, 1.56, and 1.58. The test elements formed using prestressed bolts of the same diameter were examined at four high temperatures. In the first part of the study, the behavior of 15 T-Stub connections under axial tensile loading was experimentally determined. The second part created a finite element model in ABAQUS for all models. The finite element model analysis results converged with those from the experimental study, with an average 2% error in maximum load-carrying capacity and 11% in energy dissipation capacity. As the tf/tw ratio increased, the Fmax capacity increased, while the deformation capacity decreased. While no significant loss of cross-section stiffness was observed up to 600°C, significant stiffness loss was observed at 900°C.
Introduction
Structures are subjected to various loads throughout their lifetimes; however, unfavorable loads can pose significant risks. Therefore, structural elements must have sufficient strength to carry external loads and meet safety criteria. Compared to a reinforced concrete structural member of the same volume, steel structural elements offer higher strength and are used in building construction. Also, steel materials are easy to assemble and disassemble -if required (Saberi et al., 2017). Steel structures are mainly preferred as construction materials in industrial buildings, business centers, and shopping centers. Besides the advantages of using steel, there are also disadvantages; one is its resistance to fire. Also, the most critical zone in steel buildings is the connection zone; research on various connections has been reported in the literature, and ongoing research focuses on the behavior of connections after a fire. As a result, one of these connections is the T-Stub beam-column connection (Coelho et al., 2004; Maali et al., 2018, 2019; Sağıroğlu et al., 2018). Much research has been conducted in the literature, but very little on the T-Stub beam-column connection after fire. Figure 1 shows that the T-Stub accounts for the column flange’s deformation and the endplate’s bending in the case of an extended end plate bolted connection. Because the column flange is unstiffened, the T-Stub on the column side is oriented to the endplate T-Stub at right angles. The models for the column and the endplate sides are different. The T-Stub elements on the column flange side are generally hot-rolled profiles. In contrast, on the endplate side, such elements comprise two welded plates, the endplate, the beam flange, and a further stiffener corresponding to the beam web. Therefore, the behavior of T-Stub connections exposed to fire should be considered in the design and analysis of steel frames since these members represent the actual behavior (Sağıroğlu and Aydin, 2015). Also, the behavior of the steel connections exposed to fire should be examined, and more information should be obtained (EN 1993-1-8: 2005 Eurocode 3, 2005, European Committee for Standardization, 2002, European Committee for Standardization, 2005, International Organization for Standardization, 1975, Cirpici et al., 2021). The biggest weakness of steel structures is fire. Some numerical and experimental studies from the literature are given below. T-Stub model for the endplate side and corresponding failure mechanisms according to Eurocode 3 (EN 1993-1-8).
Investigated the basic behavior and collapse resistance of typical steel buildings in the event of a fire in a confined space or fire exposure on all floors using the ABAQUS software (Hong et al., 2008, Dassault Systèmes Simulia Corp, 2017). Crosti (2009) presented the performance of steel structures under fire. Berrospi Aquino et al., 2021 provides a comprehensive review focusing on the role of the T-Stub component in defining the tension and compression zones of moment-resisting connections, examining its theoretical background, experimental applications, and numerical modeling, while offering original suggestions for future research. Liu et al., 2023 conducted a comprehensive experimental and numerical study on the tensile behavior of Q355 steel T-Stubs and proposed an original nonlinear constitutive model based on spring-slider elements, defined by four physically meaningful parameters directly obtained from macroscopic tests. Payá-Zaforteza and Garlock (2012) presented a numerical study for fire response of a steel highway overpass bridge using ABAQUS finite element software. Aziz and Kodur (2013) studied the fire response of a steel bridge beam using ANSYS software. Tartaglia et al. (2020) investigated the influence of bolt type, preload, geometric nonlinearities, and initial imperfections on the strength and ductility of T-Stub connections through experimental tests and parametric finite element analyses, highlighting the need for improved design rules to ensure sufficient ductility under seismic and robustness demands. Cisneros et al. (2017) conducted numerical and experimental studies of asymmetric T-Stub components to assess the effect of bolt position relative to the web, demonstrating that asymmetry leads to load redistribution and premature failure. In contrast, their numerical models accurately predicted stiffness and strength with errors of less than 10% and 20%, respectively. Aziz et al. (2015) presented experimental and numerical studies on the fire performance of typical steel bridge beams. Discussed the numerical simulations performed on the substructure of a steel building, namely the column-beam end plate connection (Petrina, 2016). Bao et al. (2019) conducted static tests and finite element analyses to investigate the mechanical behavior of bolts in T-Stub connections, revealing the significant impact of flange geometry and bolt diameter on bending moments and failure modes, and proposed a reliable new connector model based on moment distribution theory that eliminates the need to calculate prying forces. The behavior of steel T-Stub connections produced by wire and arc additive manufacturing (Dai et al., 2025), the surrogate-based calibration of hysteretic model parameters for bolted T-Stub connections (Shen et al., 2025), and the experimental investigation of their cyclic performance (Rasoulitabar et al., 2025) are among the prominent studies in the literature addressing the performance of T-Stub connections. Łukomski et al. (2017) presented the fire resistance test results for unprotected steel beams in EN 1993-1-2. Wong (2017) obtained the temperature distribution of a partially heated steel element using a simple finite difference scheme with parametrically coded generic elements. Performed a numerical study and compared the results of a proposed model prepared by SAFIR software with those obtained by SCIA Engineer; these models represent the behavior of a steel hollow section frame exposed to high temperatures, considering the impact of thermal and structural responses (Lausova et al., 2017). Barata et al., (2014) experimentally and numerically investigated the behavior of welded T-Stub components under static loading at ambient and elevated temperatures, demonstrating that temperature significantly reduces strength, stiffness, and ductility, and proposed temperature-dependent ductility indices, which were validated against simplified analytical models. Focusing on fire protection materials in an industrial building with a steel structural system under standard fire conditions, the high-temperature resistance of steel structural elements with and without fire protection materials was examined by subjecting them to a 1800-s exposure at high temperature (Cirpici, 2020). Sun et al. (2018) proposed modified resistance models for Q690 steel T-Stubs to address the limitations of EC3 in accounting for HAZ effects and combined loading. Yuan et al. (2020) developed improved stiffness and strength formulations for stainless steel T-Stubs that incorporate strain hardening. Also validated the structural performance of a new bolted T-Stub connection under monotonic and cyclic loads, identifying key parameters influencing its ductility and energy dissipation (Li et al., 2018; Silva et al., 2021).
Figure 1 illustrates the possible failure mechanisms of the T-Stub component according to Eurocode 3 (EN 1993-1-8). The T-Stub model represents the tensile zone of bolted steel connections where the applied tensile force is transferred through a combination of bolt tension and flange bending. In the thick flange mechanism, the flange stiffness is sufficiently high and no significant plastic hinge develops in the flange; therefore, the connection behavior is governed primarily by bolt tension and prying forces are negligible. In the intermediate flange mechanism, the flange stiffness becomes comparable to the bolt stiffness, and plastic hinges form near the bolt rows due to flange bending. This deformation generates additional prying forces (q), which increase the tensile force in the bolts, and the failure mechanism is governed by the combined effect of flange yielding and bolt tension. In the thin flange mechanism, the flange is relatively flexible, leading to significant flange bending and the formation of multiple plastic hinges. In this case, prying forces become dominant and the tensile force in the bolts increases to r u +q u indicating that the structural response is mainly controlled by flange bending and prying action. According to Eurocode 3, the design resistance of the T-Stub component is determined by evaluating these possible mechanisms and adopting the governing mechanism that provides the lowest resistance.
The present study aims to experimentally investigate bolted T-Stub beam-to-column steel connections under different post-fire conditions. The T-Stub steel connection in the present study, produced using the IPE standard profiles examined, differs from those reported in the literature, which were created by welding plates. Thus, it is expected that problems such as weld breakage in connections and low strength can be overcome. On the other hand, more information on the behavior of these elements is needed to use weld-less T-connections. However, T-Stub connections with IPE standard profiles examined in this study are not mentioned and discussed in Eurocode 3. Recent studies on the post-fire behavior of steel connections reveal a consistent trend of diminished residual strength, stiffness, and ductility, alongside altered failure modes. For instance, bolted top and seat angle connections exhibit a significant reduction in load-bearing capacity following fire exposure, with strength loss varying depending on the severity of heating (Silva et al., 2002, El Hamoui et al., 2025). Similarly, thin-walled carbon steel bolted connections show considerable degradation in ductility and stiffness, particularly influenced by post-fire cooling methods (Sulayman and Mahmood, 2022). In contrast, high-strength steel flush endplate connections demonstrate relatively limited degradation in mechanical properties after exposure to elevated temperatures, indicating a certain level of resilience (Wang et al., 2024). Furthermore, studies on steel connections under extreme conditions, such as column-loss scenarios, highlight that structural performance may vary significantly depending on connection configuration and loading conditions (Chang et al., 2024). In addition, welded beam-to-column joints exhibit a noticeable reduction in bending moment capacity, with failure modes shifting toward more brittle behavior under severe thermal exposure (Meng and Zhu, 2025). Overall, these findings emphasize the critical influence of temperature and cooling conditions on post-fire structural performance and underline the necessity for connection-specific assessment approaches. The findings of the present study are consistent with these observations, particularly in terms of the reduction in residual capacity, stiffness degradation, and the governing role of connection components in defining the post-fire response. These findings further support the observed behavior in this study.
In addition to understanding the effect of web length (T-section connection) on the load-deformation curve, the web length was selected in accordance with Eurocode 3. Furthermore, the flange thickness (tf) to web thickness (tw) T-section ratio was selected to be 1.52, 1.56, and 1.58 to examine its effect on the load-deformation curves. Finally, the load-deformation characteristics and failure modes of semirigid top-and-seat T-section connections with various elemental dimensions have been evaluated and compared. Various T-sections have been used to make a meaningful comparison. 15 connections across the three groups were tested using these parameters.
Scope and limitations
This study focuses on the investigation of the post-fire residual mechanical behavior of steel bolted T-Stub connections and does not aim to evaluate their load-carrying capacity during fire exposure (in-fire) or their simultaneous thermo–mechanical response under elevated temperatures. All mechanical tests were conducted after the specimens had been heated according to the ISO 834 standard fire curve and subsequently cooled to ambient temperature. This approach represents damage assessment scenarios commonly encountered in post-fire engineering practice.
Within this framework, phenomena active during fire exposure—such as time-dependent creep, transient thermal strains, and bolt relaxation at elevated temperatures—were not directly validated experimentally. The ISO 834 fire curve and the thermal steps implemented in the finite element model were used not to simulate active fire behavior, but rather to represent thermal degradation of material properties and the residual stress states formed after cooling.
Therefore, the findings of this study should be interpreted in terms of the post-fire residual load-carrying capacity, stiffness, ductility, and failure modes of the connections. The results should not be interpreted as indicators of fire resistance or structural performance during fire exposure.
In this study, the heating history (including heating rate, exposure duration at the target temperature, and cooling regime) was kept constant for all specimens to ensure a consistent thermal protocol and to isolate the effect of maximum temperature on the post-fire residual behavior. In this context, the final temperature levels considered in the experimental program were selected based on the ISO 834 standard fire curve to ensure consistency with realistic fire exposure conditions. The ISO 834 curve was not used to simulate the full time-dependent thermal response, but rather to define representative temperature levels corresponding to different stages of thermal degradation and the formation of residual stress states after cooling. A parametric investigation of different heating histories is beyond the scope of the present study. Under these conditions, the results are primarily governed by the maximum temperature level, as it represents the only varying thermal parameter in the experimental program.
Experimental investigation
Test specimens and loading procedure
In this study, 15 experimental specimens were developed to investigate the behavior of bolted T-Stub connections under different post-fire conditions and static loading. The specimens were divided into three groups: T200 (sections cut from the IPE200 standard profile), T220 (IPE220 profile), and T240 (IPE240 profile). The T-Stub specimens were designed in accordance with Eurocode 3. The geometric properties of all specimens are presented in Figure 2 and Table 1. Reference specimens not exposed to any temperature were prepared for each profile group (IPE200, IPE220, and IPE240). Due to geometric constraints, T-profiles were assembled using multiple bolts arranged in a single row at their edges. They were subjected to axial tension parallel to the bolt axes to examine their tensile behavior and to observe the formation of plastic hinges. High-strength bolts of class 8.8 were used in all connections, according to EN 1993-1-8. The specimens connected through flanges were designed to fail in plastic collapse mode 2, as defined in the EN code, which occurs when four bolts reach their collapse limit due to additional tensile force parallel to the bolt axis, resulting in flange deformation. Additionally, to examine the effect of web length on the load–deformation behavior, web lengths were determined in accordance with Eurocode 3. Furthermore, the flange thickness (tf) to web thickness (tw) ratio was selected as 1.52, 1.56, and 1.58 to investigate its influence on the load–deformation characteristics of the connections. This study aimed to evaluate the combined effects of experimental and numerical (ASTM International, 2020) investigations on beam-to-column steel bolted T-Stub connections under various post-fire conditions. Geometries of T-Stub specimens and description of nomenclatures. Test specimen properties.

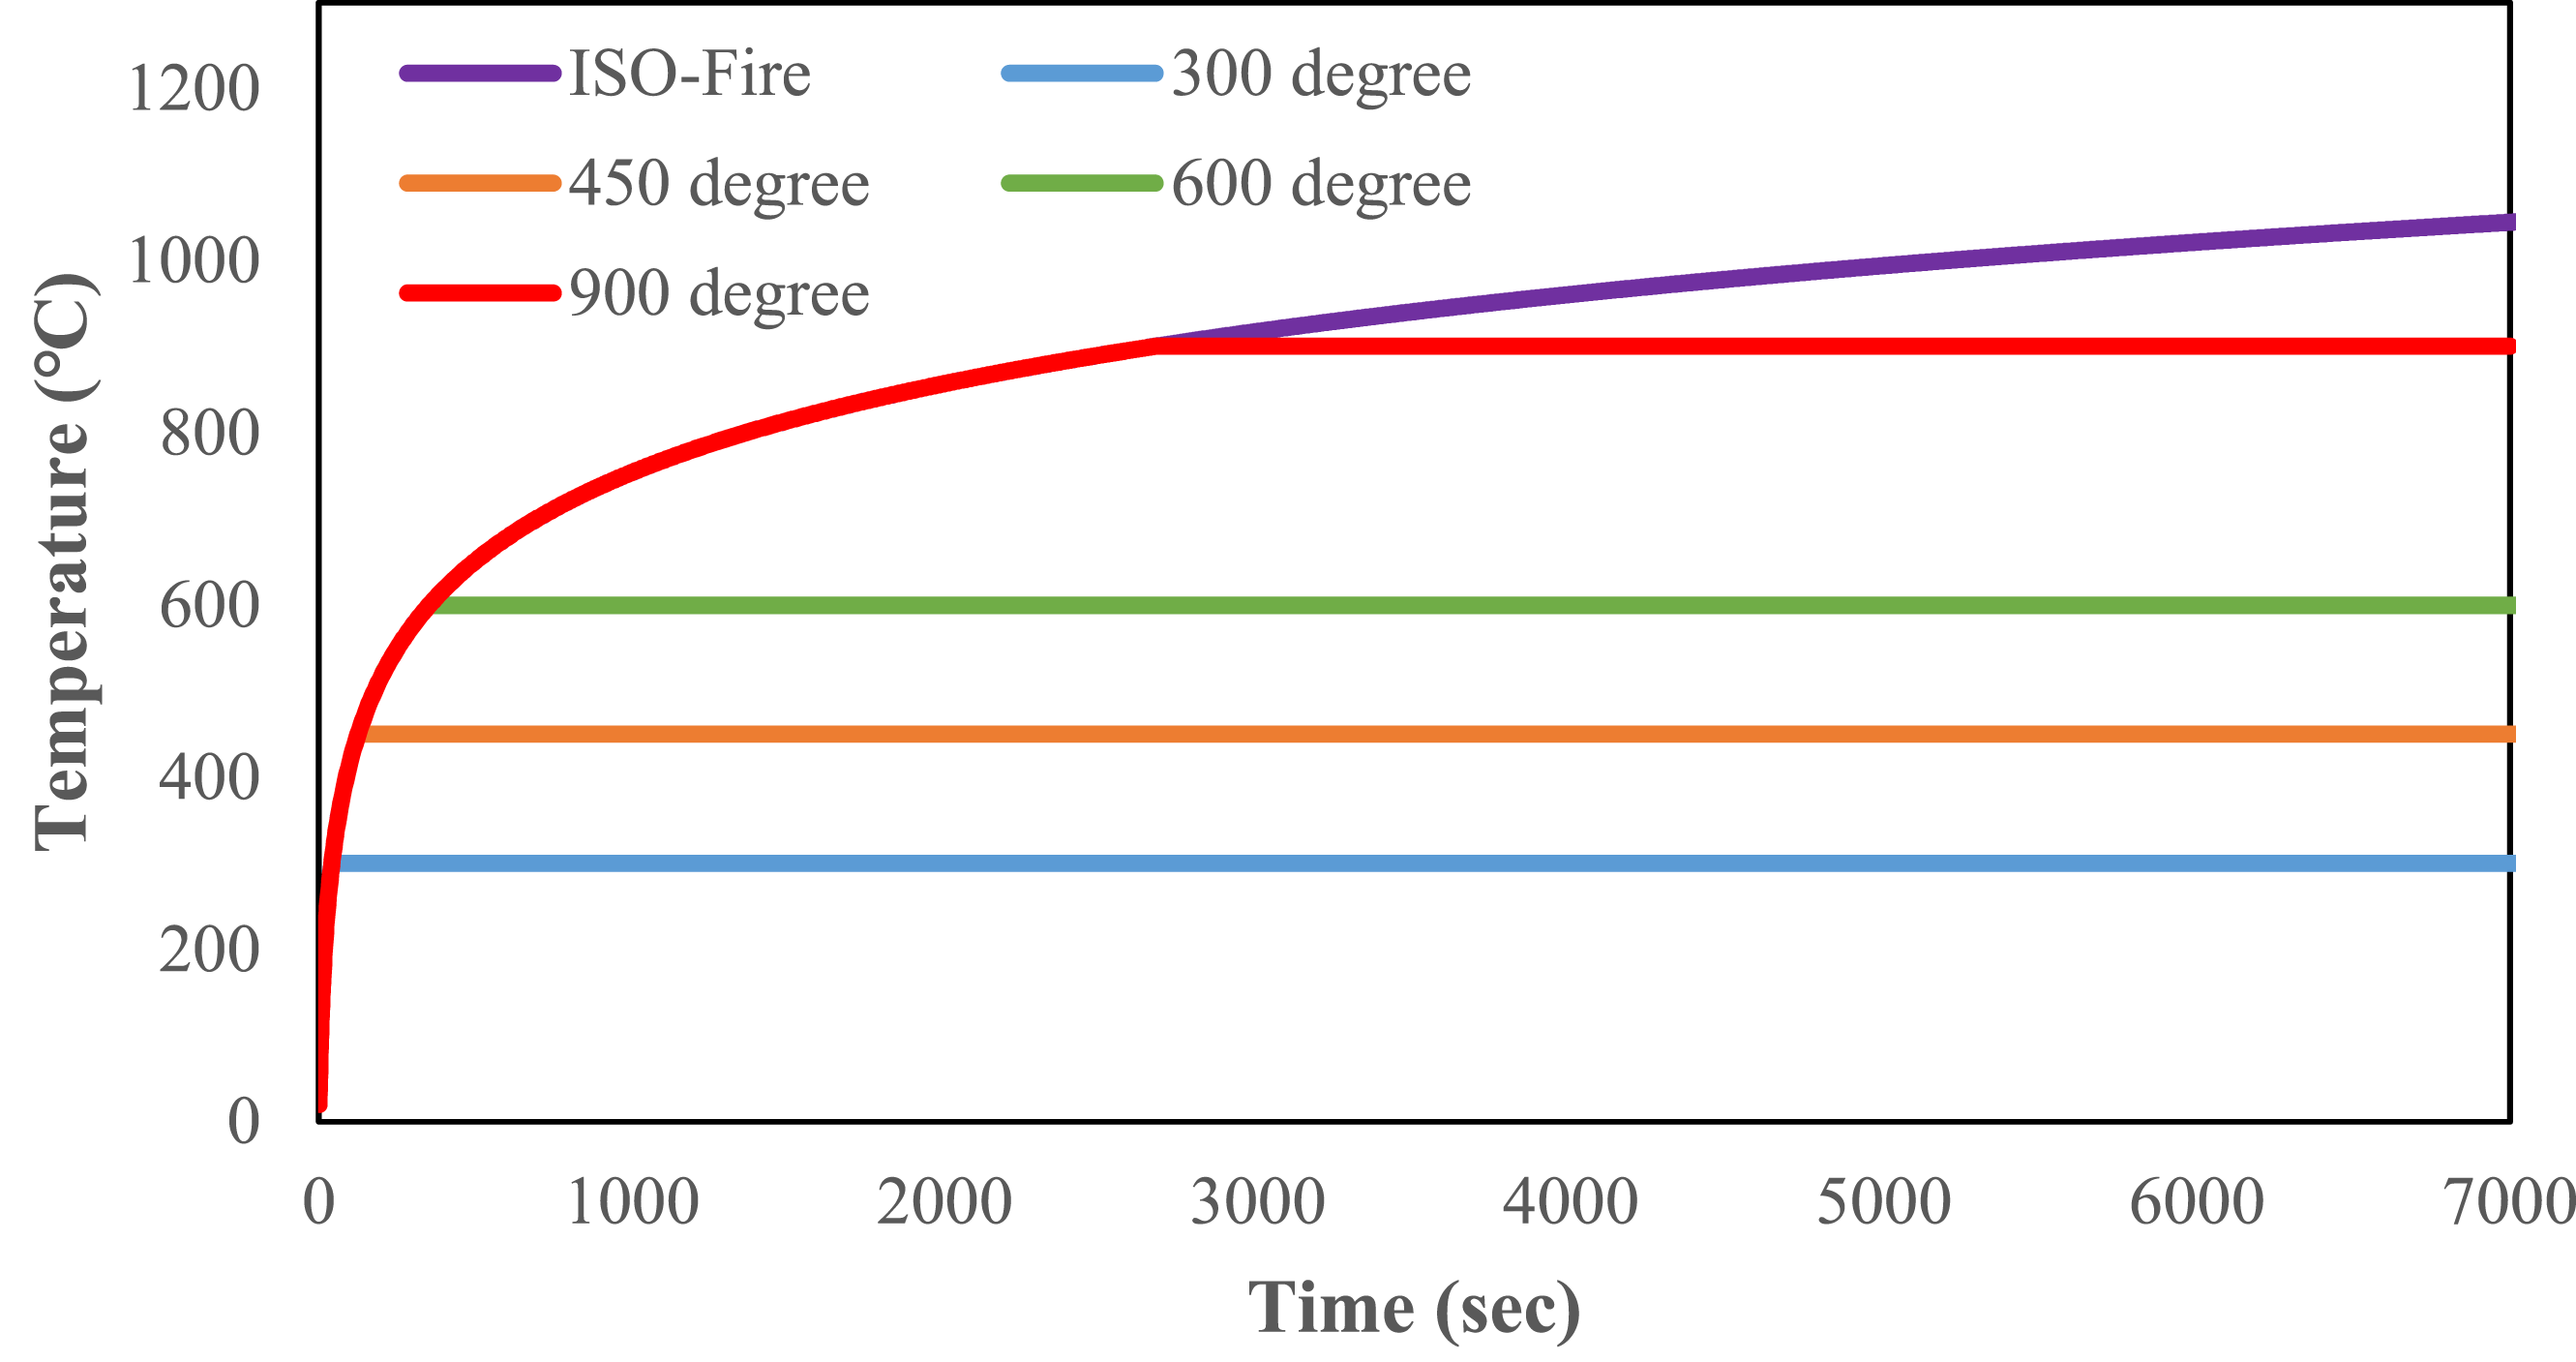
Specimens were heated in a furnace (Figure 3) to 300, 450, 600, and 1000°C, following the standard fire curve. For example, for 300°C, the specimens were placed into the furnace, heated to 300°C according to the standard fire curve, and held at this temperature for 120 minutes. After heating, they were allowed to cool naturally at room temperature for 24 hours. To expose the test specimens to elevated temperatures, a single-cell furnace with internal dimensions of 800 × 800 × 800 mm and a total internal volume of 512 L, capable of reaching 900°C, was used. The single-cell furnace design encloses the heating resistors, thereby minimizing the risk of sample splashes and electrical arcing. The furnace chamber was first preheated to the target temperature in a fully sealed environment to achieve the desired thermal conditions. Once the internal temperature reached the specified value, the specimens were carefully placed inside the furnace for thermal exposure. Furnace and axial tensile test setup used in the experiments.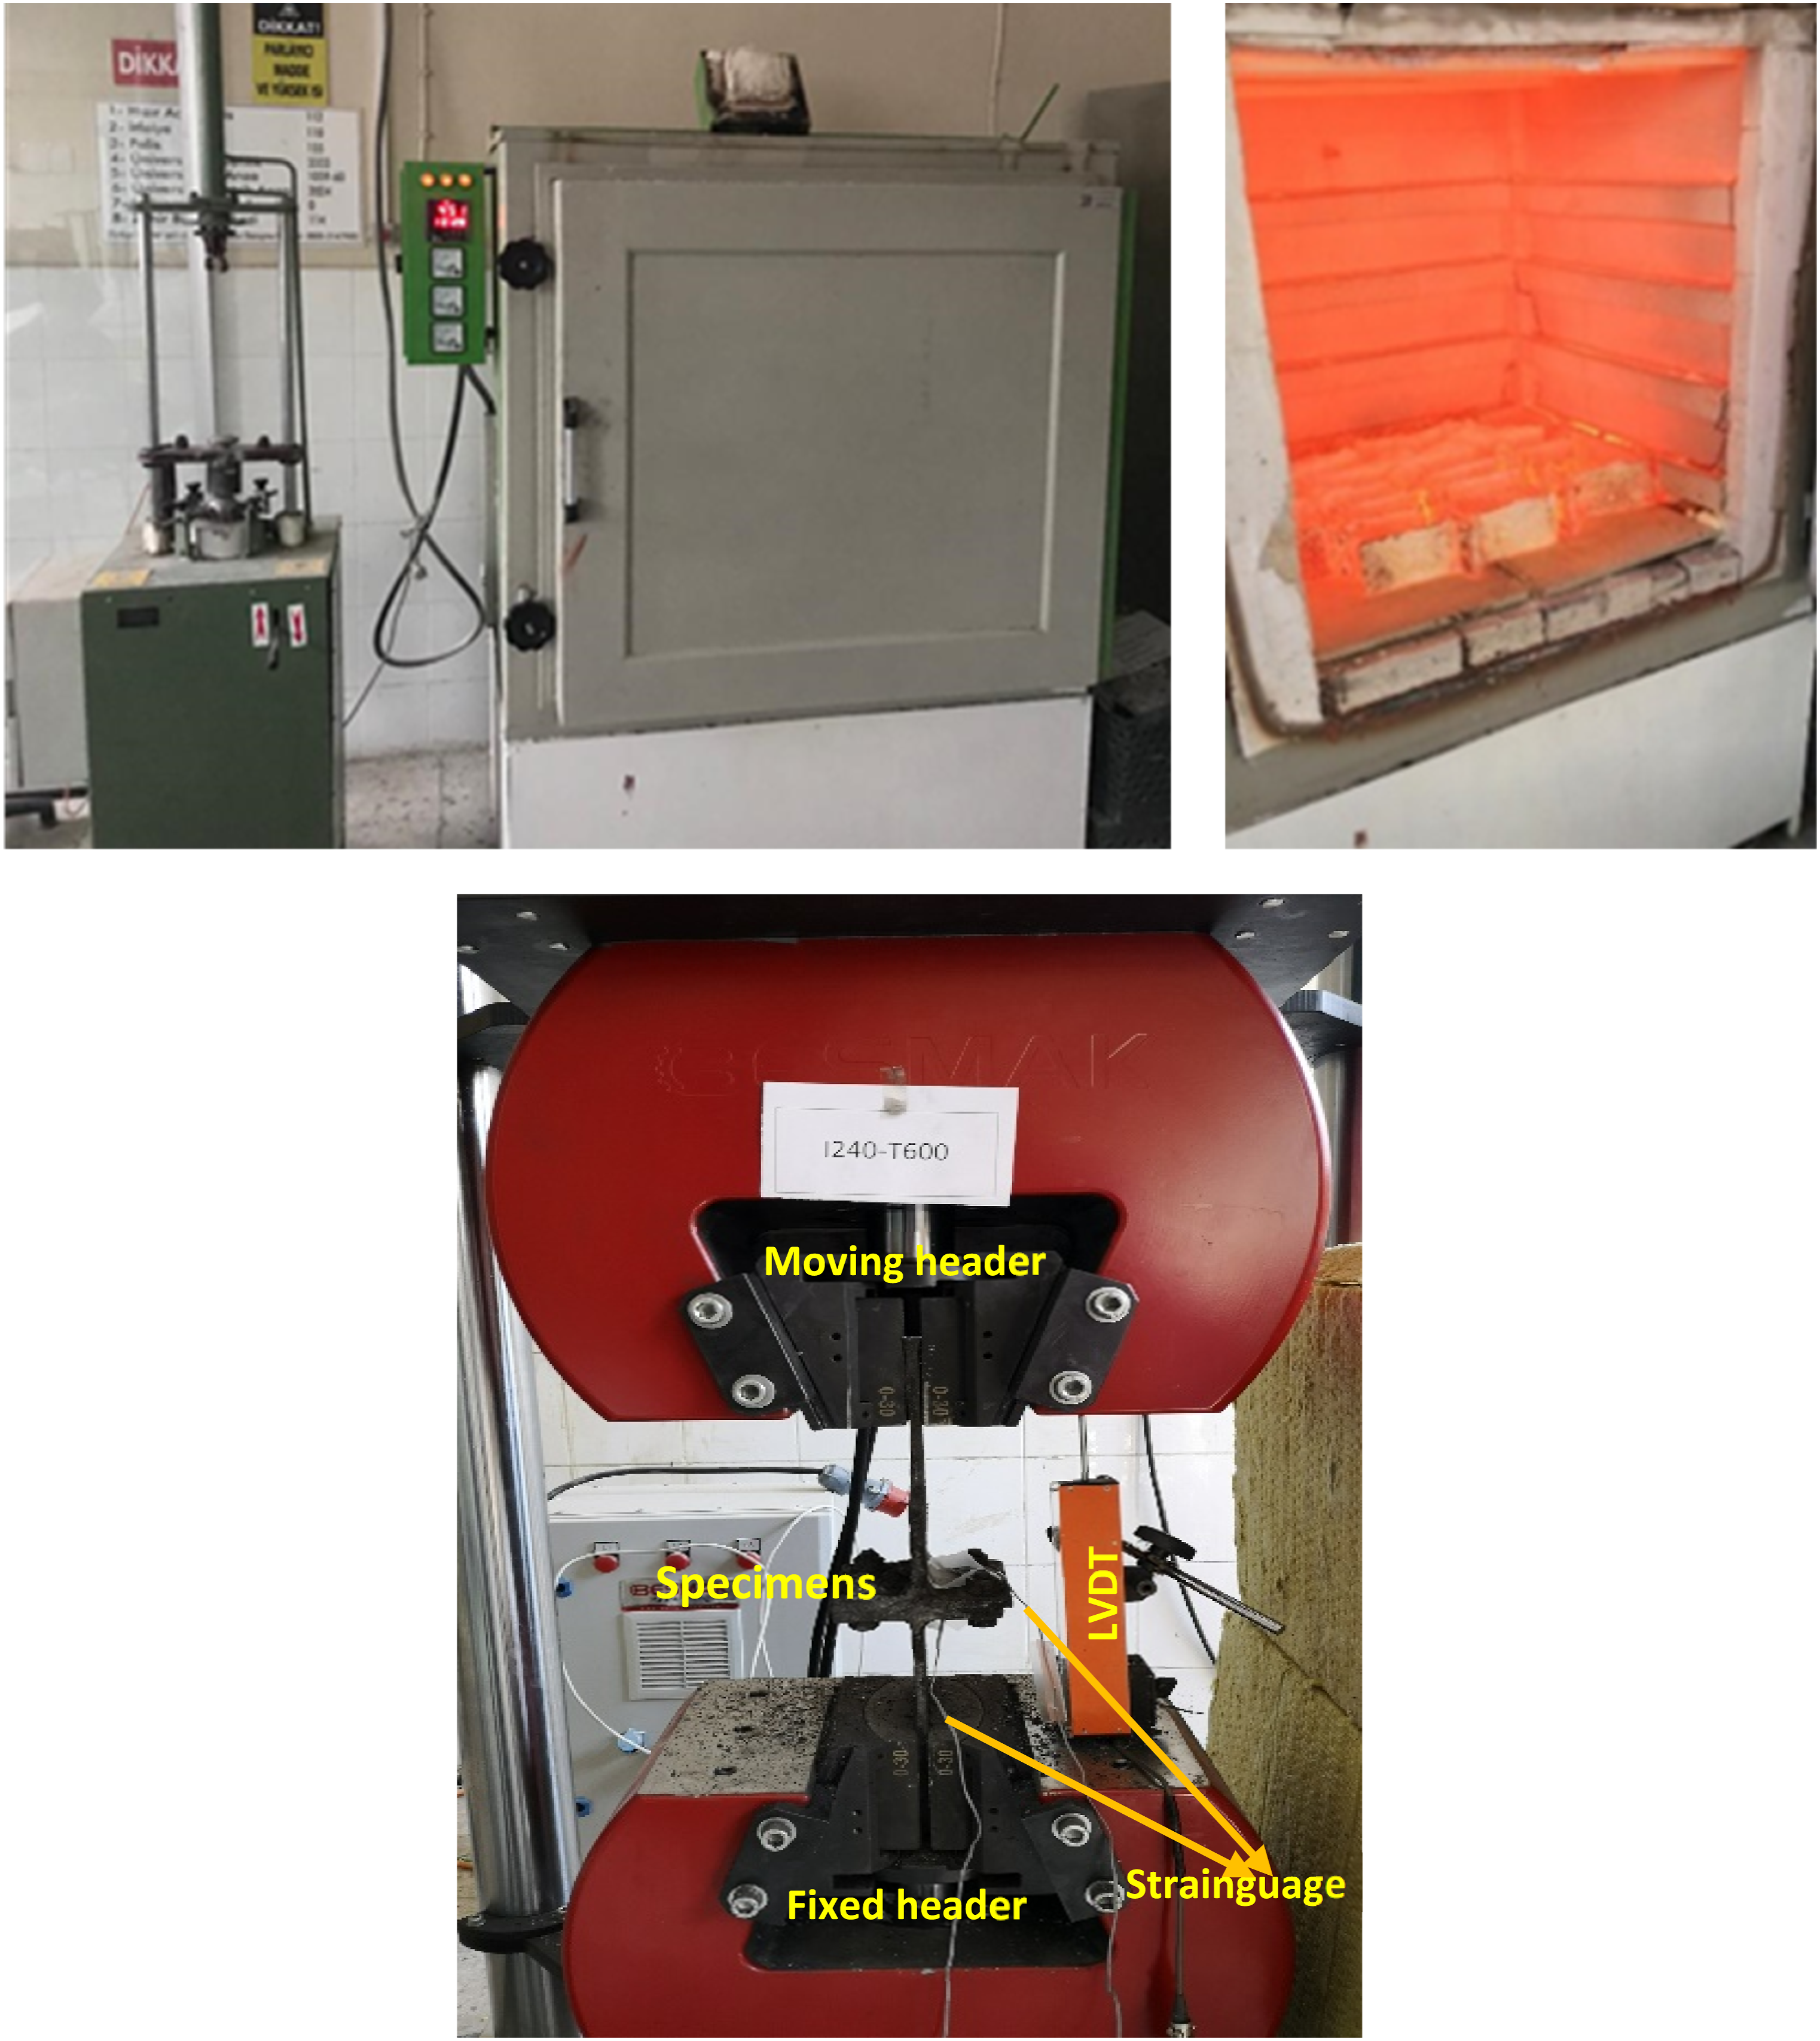
The fire curve (ISO834, Eurocode 1: Actions on structures-Part 1-2: General actions- Actions on structures exposed to fire) was calculated using the following standard load-time graph equation: Standard fire curve and fire temperatures tested (ISO 834).
Following the exposure of all specimens to elevated temperatures for 120 minutes and subsequent cooling under ambient conditions for 24 hours, the specimens were instrumented with strain gauges and positioned in the axial tensile test setup; during heating, specimen temperatures were monitored using the furnace internal thermocouple system, with no external thermocouples attached to the specimens, and the furnace temperature was therefore taken as representative of the specimen temperature. During the experiment, a constant loading speed of 3 × 10⁻² mm/s was applied until the T-joints reached their limit capacity. The deformations and displacements in the T-Stub connections due to the applied tensile force were measured using a linear variable displacement transducer (LVDT), which was capable of capturing large displacements. Data obtained from the strain gauges and the LVDT were recorded using an 18-channel data logger and subsequently transferred to a computer for detailed analysis.
Mechanical properties
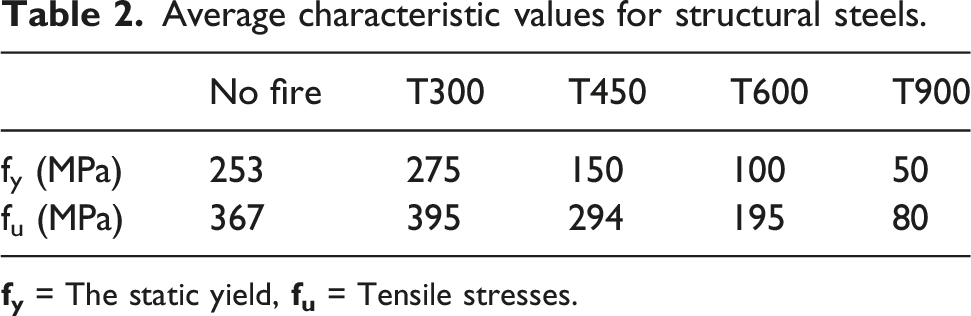
To correctly analyze the strength of the joint area, it is very important to determine the mechanical properties of each element in the combination. Therefore, the material properties of the steel elements in the connection must be determined. Knowing the stress-strain graph of steel becomes important, especially in finite element software. For this purpose, a total of 30 coupon samples were removed from the head and body (IPE200, IPE220, and IPE240), where the steel material of the test samples was located, and tested with a uniaxial tensile test ASTM A370-20 in Figure 5. These were then tested on a Bestmark machine with a 150 kN capacity and a torque span of 900 mm. The average yield and breaking stress values obtained from 30 coupon samples in the tensile test are given in Table 2. The tensile test was carried out on ‘5 group x 6 coupons’ samples that were not exposed to fire and were exposed to fire at 300, 450, 600, and 900°. The cooling process ended after 24 hours in an open-furnace-door state for all samples. All profiles are made of S275 steel. The typical chemical composition of S275 steel includes a maximum of 0.25% carbon (C), 1.50% manganese (Mn), 0.040% phosphorus (P), 0.040% sulfur (S), 0.012% nitrogen (N), and, in some cases, up to 0.50% silicon (Si). Steel tensile test and coupon samples. Average characteristic values for structural steels.
The stress–strain curves of the coupon samples extracted from the connections are presented in Figure 6. An equal number of coupon specimens were extracted from the post-fire T-Stub specimens and then subjected to axial tensile testing after exposure to 300, 450, 600, and 900°C, while additional coupons were taken from unheated specimens and tested as a control group (No-Fire). The applied standard fire curve followed for heating is shown in Figure 5. For the specimens heated to 300°C, cooled, and subsequently tested, an increase in both tensile strength and strain values was observed compared to the No-Fire sample. However, no distinct yield plateau was formed in these specimens. Similarly, the specimens exposed to 450°C exhibited no yield plateau; in these samples, tensile strength decreased while strain capacity increased relative to the 300°C specimens. In coupons heated to 600°C, after cooling and tensile testing, the absence of a yield plateau persisted, with a further reduction in tensile strength and an increase in strain capacity compared to the 450°C specimens. Lastly, the specimens exposed to 900°C did not exhibit a yield plateau in the stress–strain curve and showed the most significant reduction in tensile strength, along with the highest strain capacity, among all tested temperatures. Test setup of tensile coupon test and Stress-Strain Curve.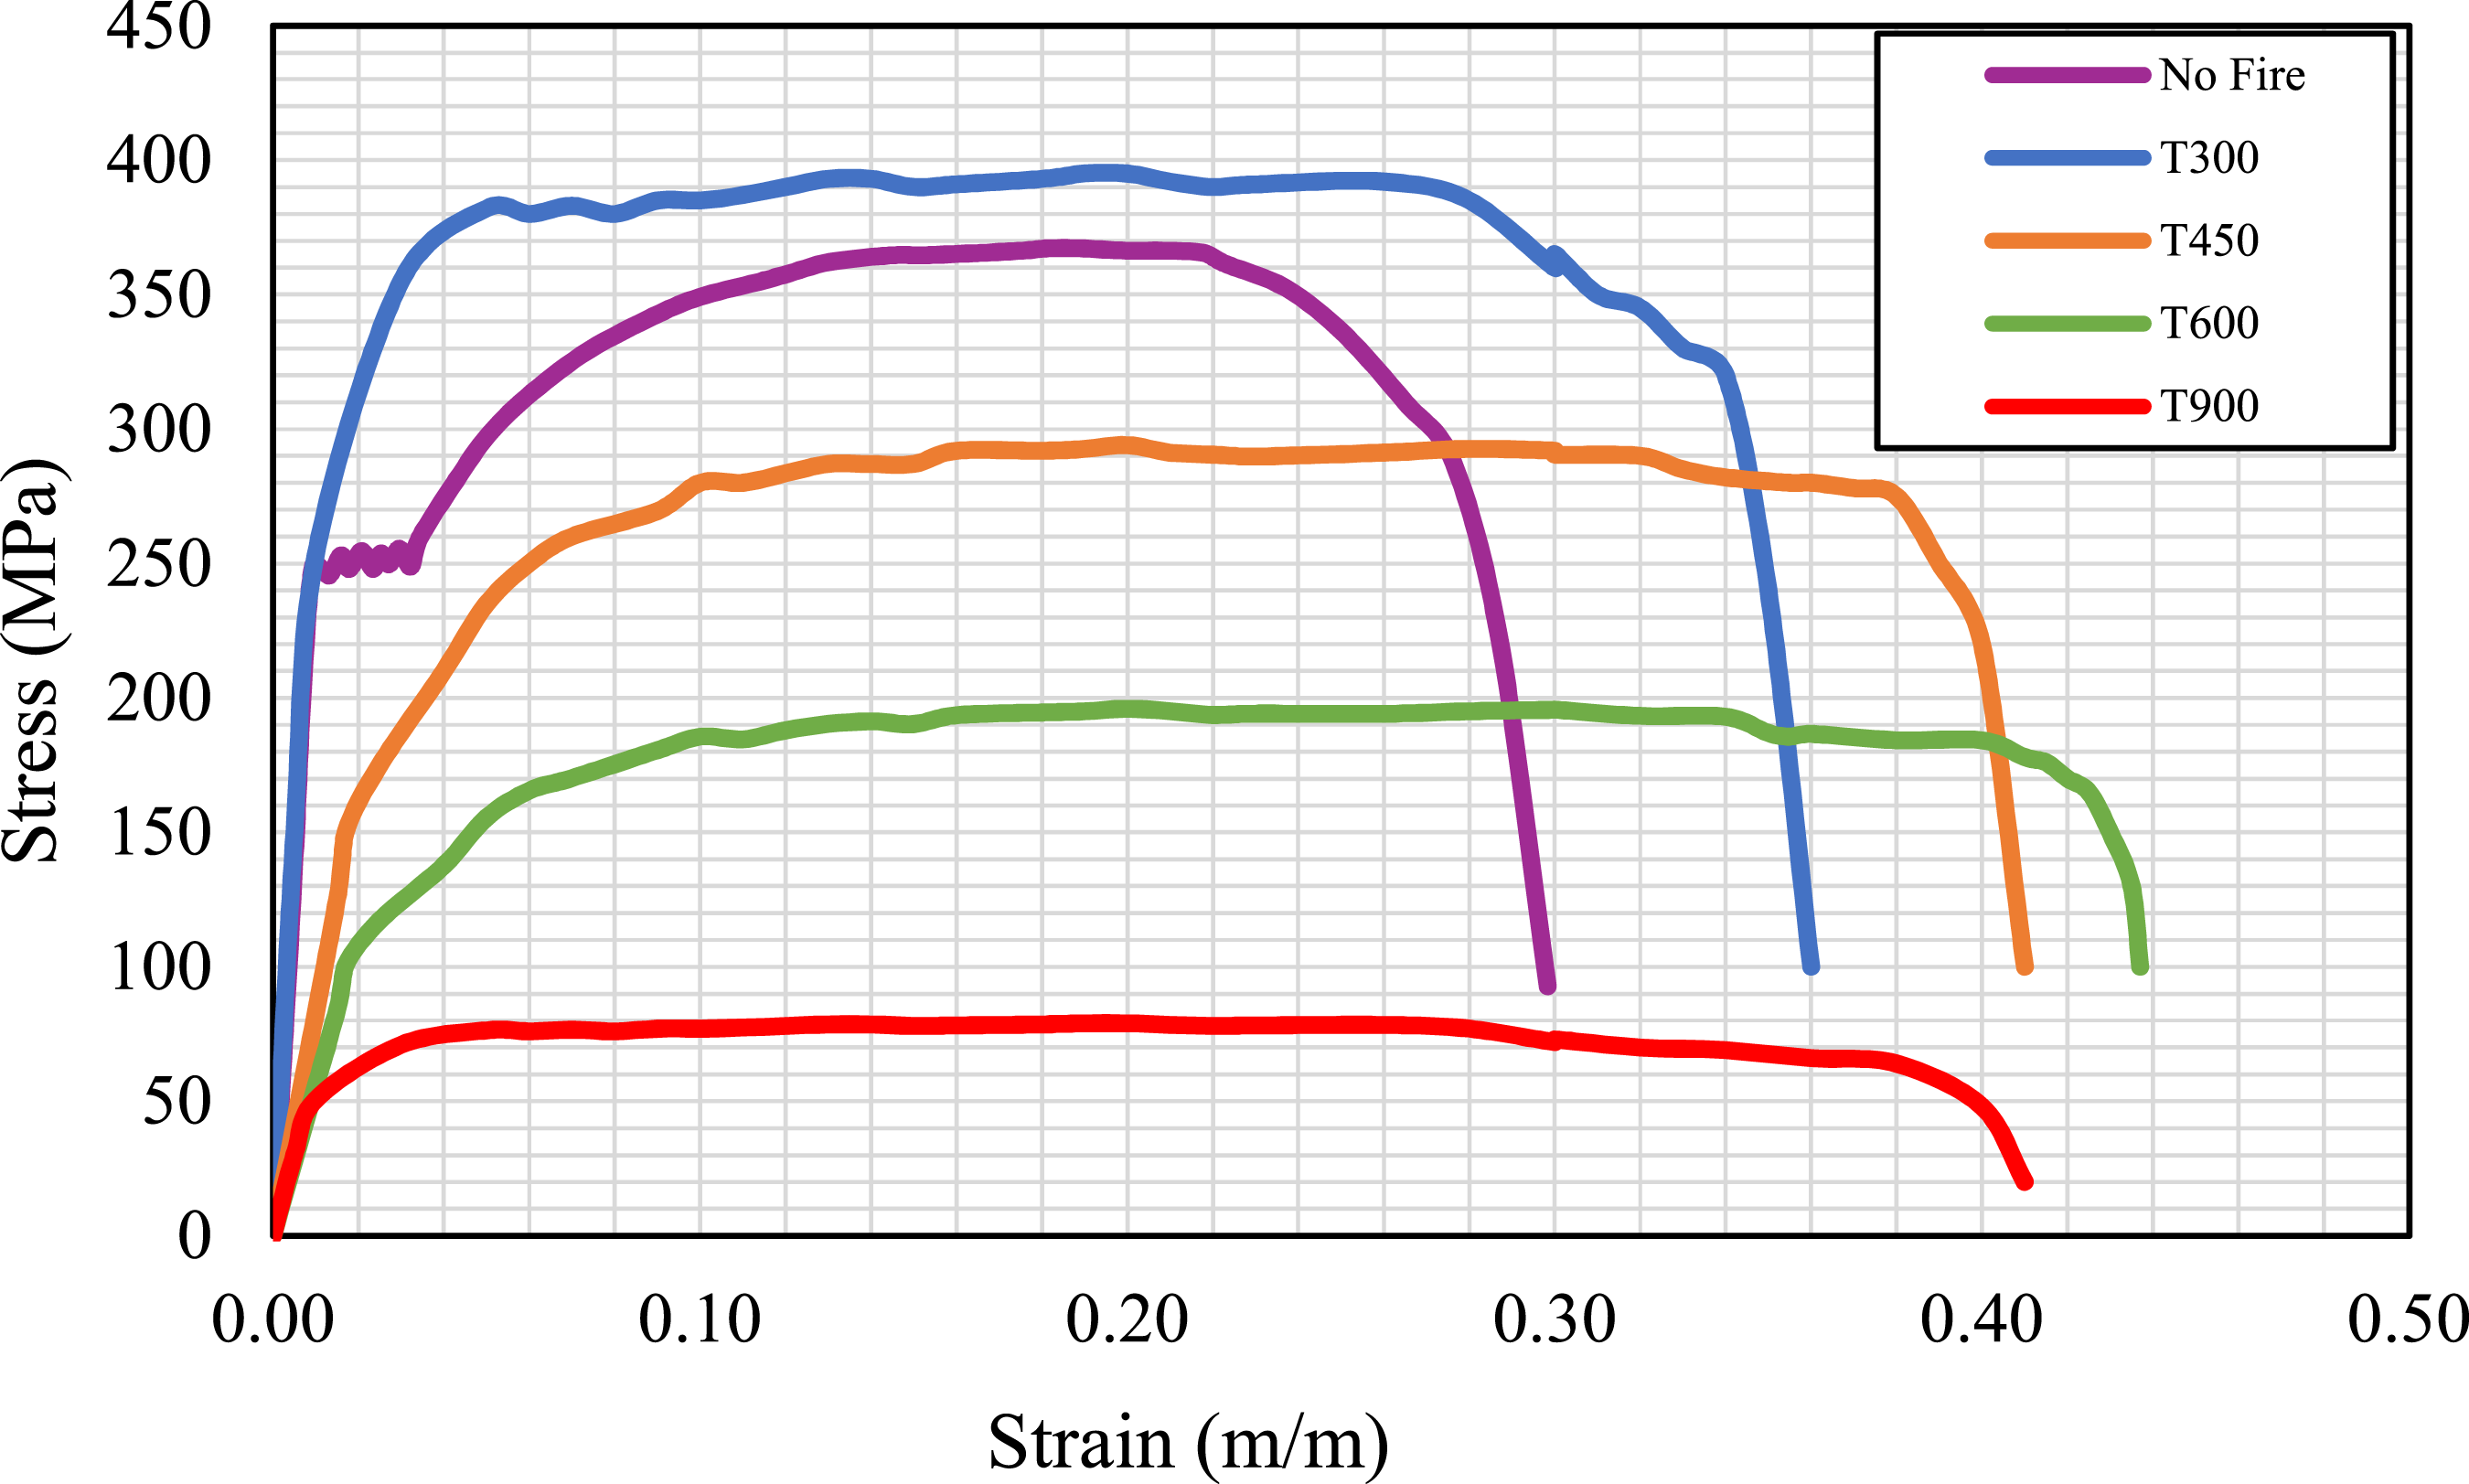
It should be emphasized that the pronounced post-fire strength reductions reported in Table 2 correspond to S275 coupons extracted from the T-Stub profiles, whereas the residual ratios reported in Kodur et al. (2017) relate to grade 8.8 bolt steel. These two materials have fundamentally different metallurgical states and thermal stability: S275 is a low-carbon hot-rolled ferrite–pearlite structural steel that undergoes recovery/recrystallization and grain coarsening when heated to 450–900°C, leading to an annealed microstructure and thus a strong reduction in residual fy and fu after cooling, as observed in our coupon tests. In contrast, class 8.8 bolts are quenched-and-tempered steels with a tempered-martensitic microstructure that is comparatively temper-resistant; therefore, bolts heated stress-free in (Kodur et al., 2017) retain a higher fraction of their original strength after cooling. In addition, although our bolts were pre-tensioned prior to heating (and thus experienced stress-assisted relaxation/creep during the fire phase), this inversion primarily affects bolt preload and joint stiffness during heating, rather than the intrinsic post-fire tensile strength measured after cooling. Consequently, the larger residual strength loss in S275 coupons compared with 8.8 bolts does not indicate a contradiction; rather, it reflects differences in material class and the distinction between preload-loss phenomena during heating and residual material capacity measured after cooling.
Test results and discussion
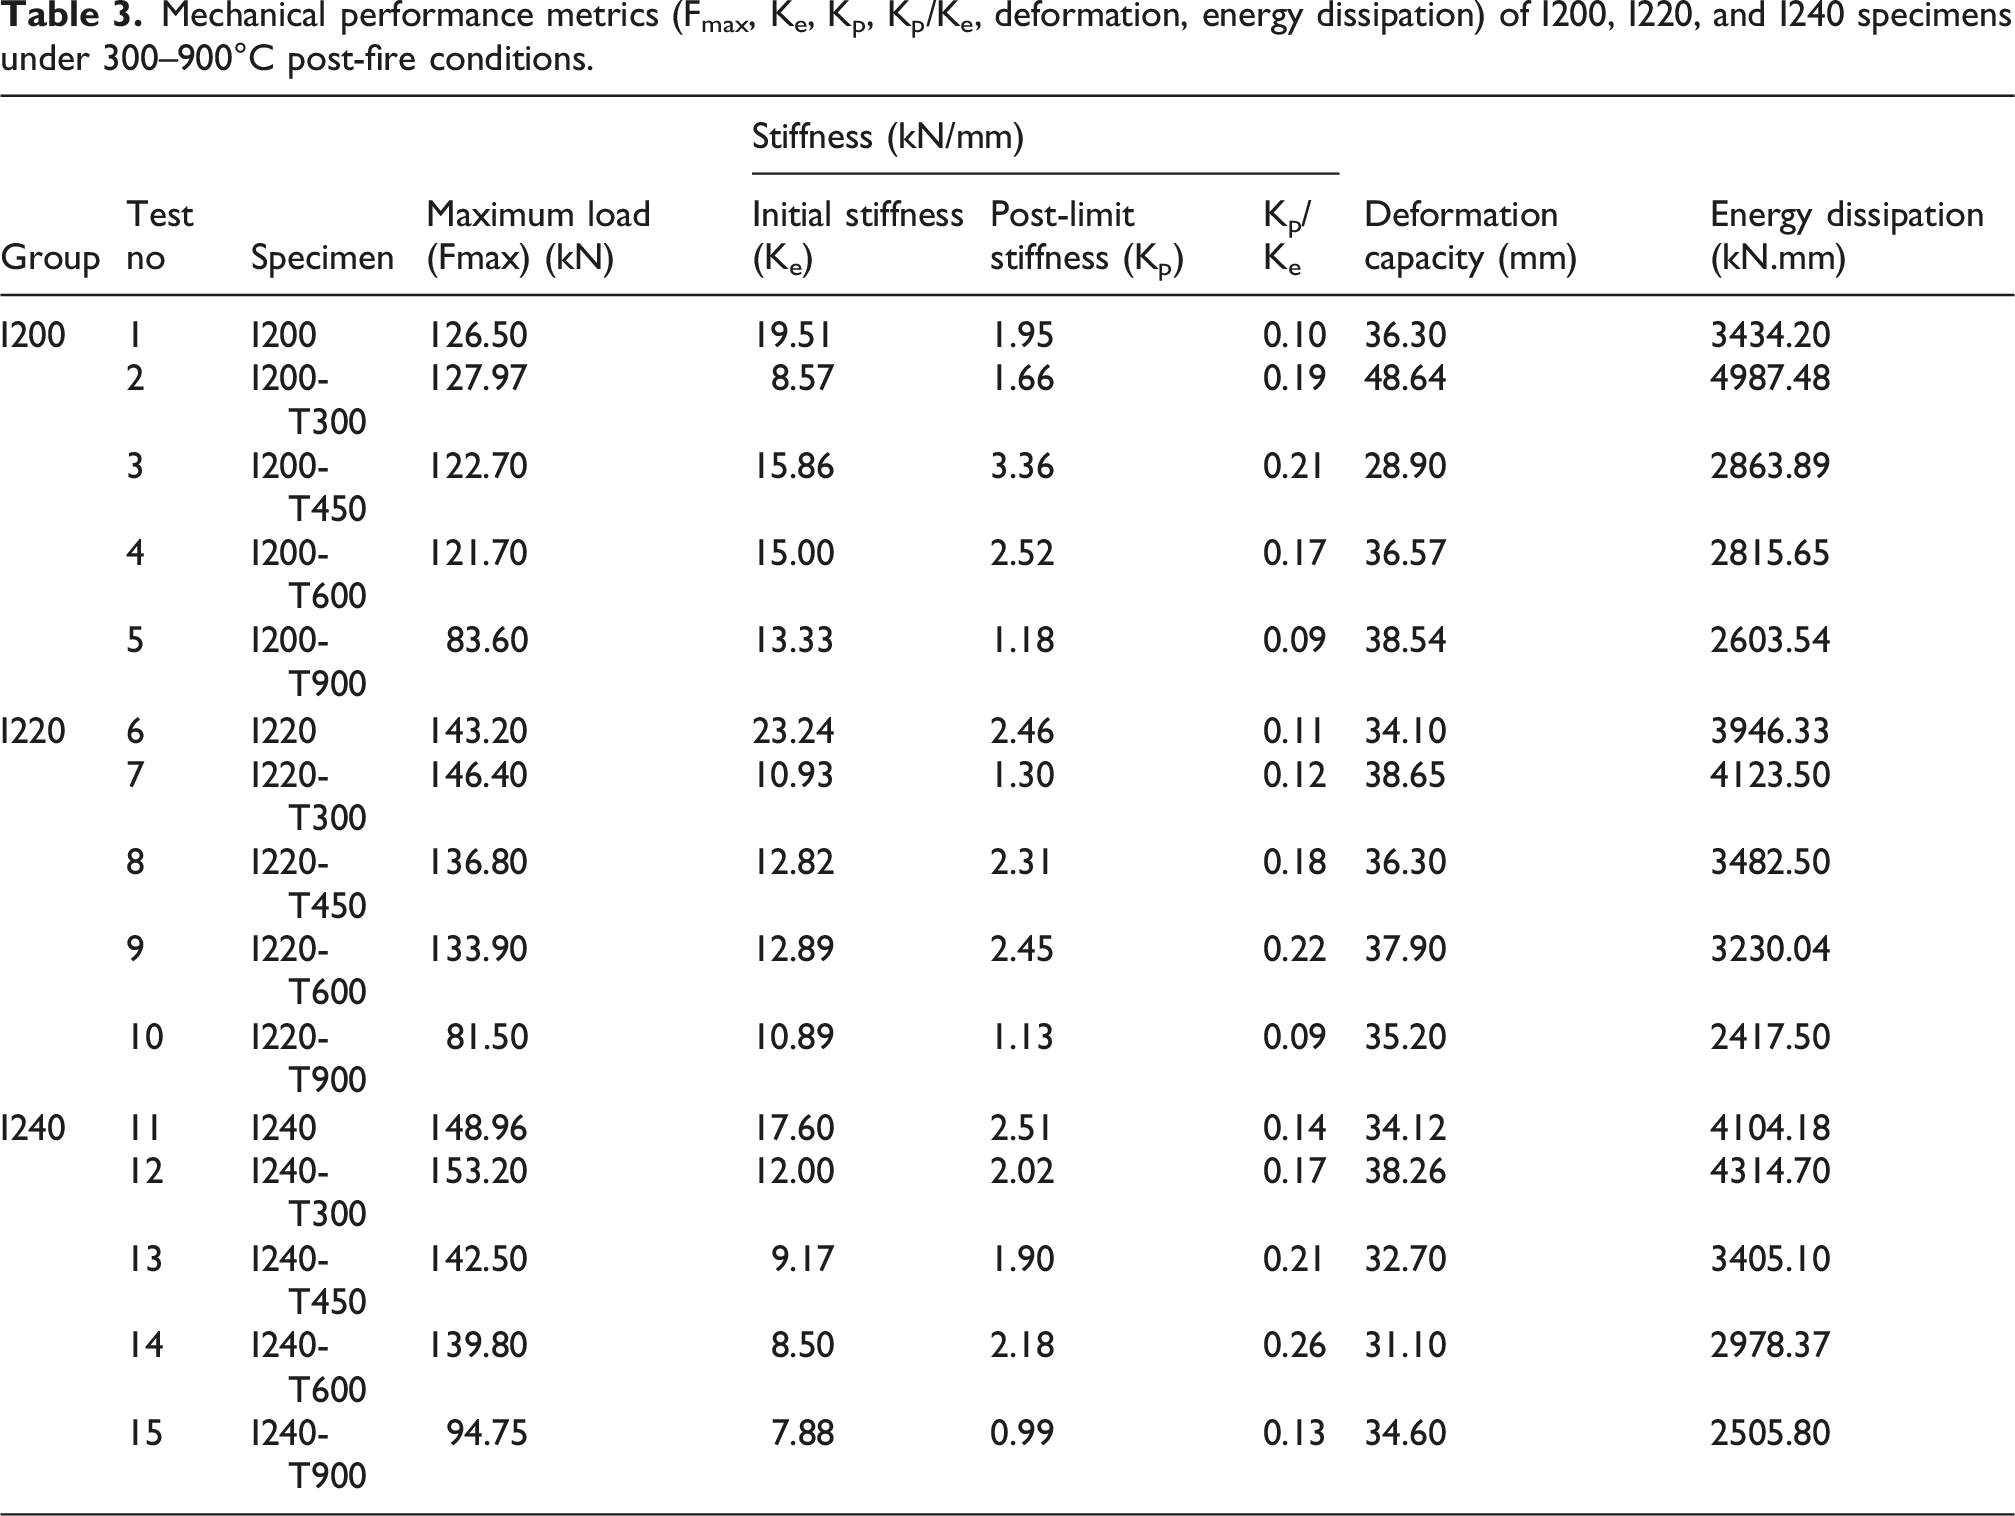
Mechanical performance metrics (Fmax, Ke, Kp, Kp/Ke, deformation, energy dissipation) of I200, I220, and I240 specimens under 300–900°C post-fire conditions.
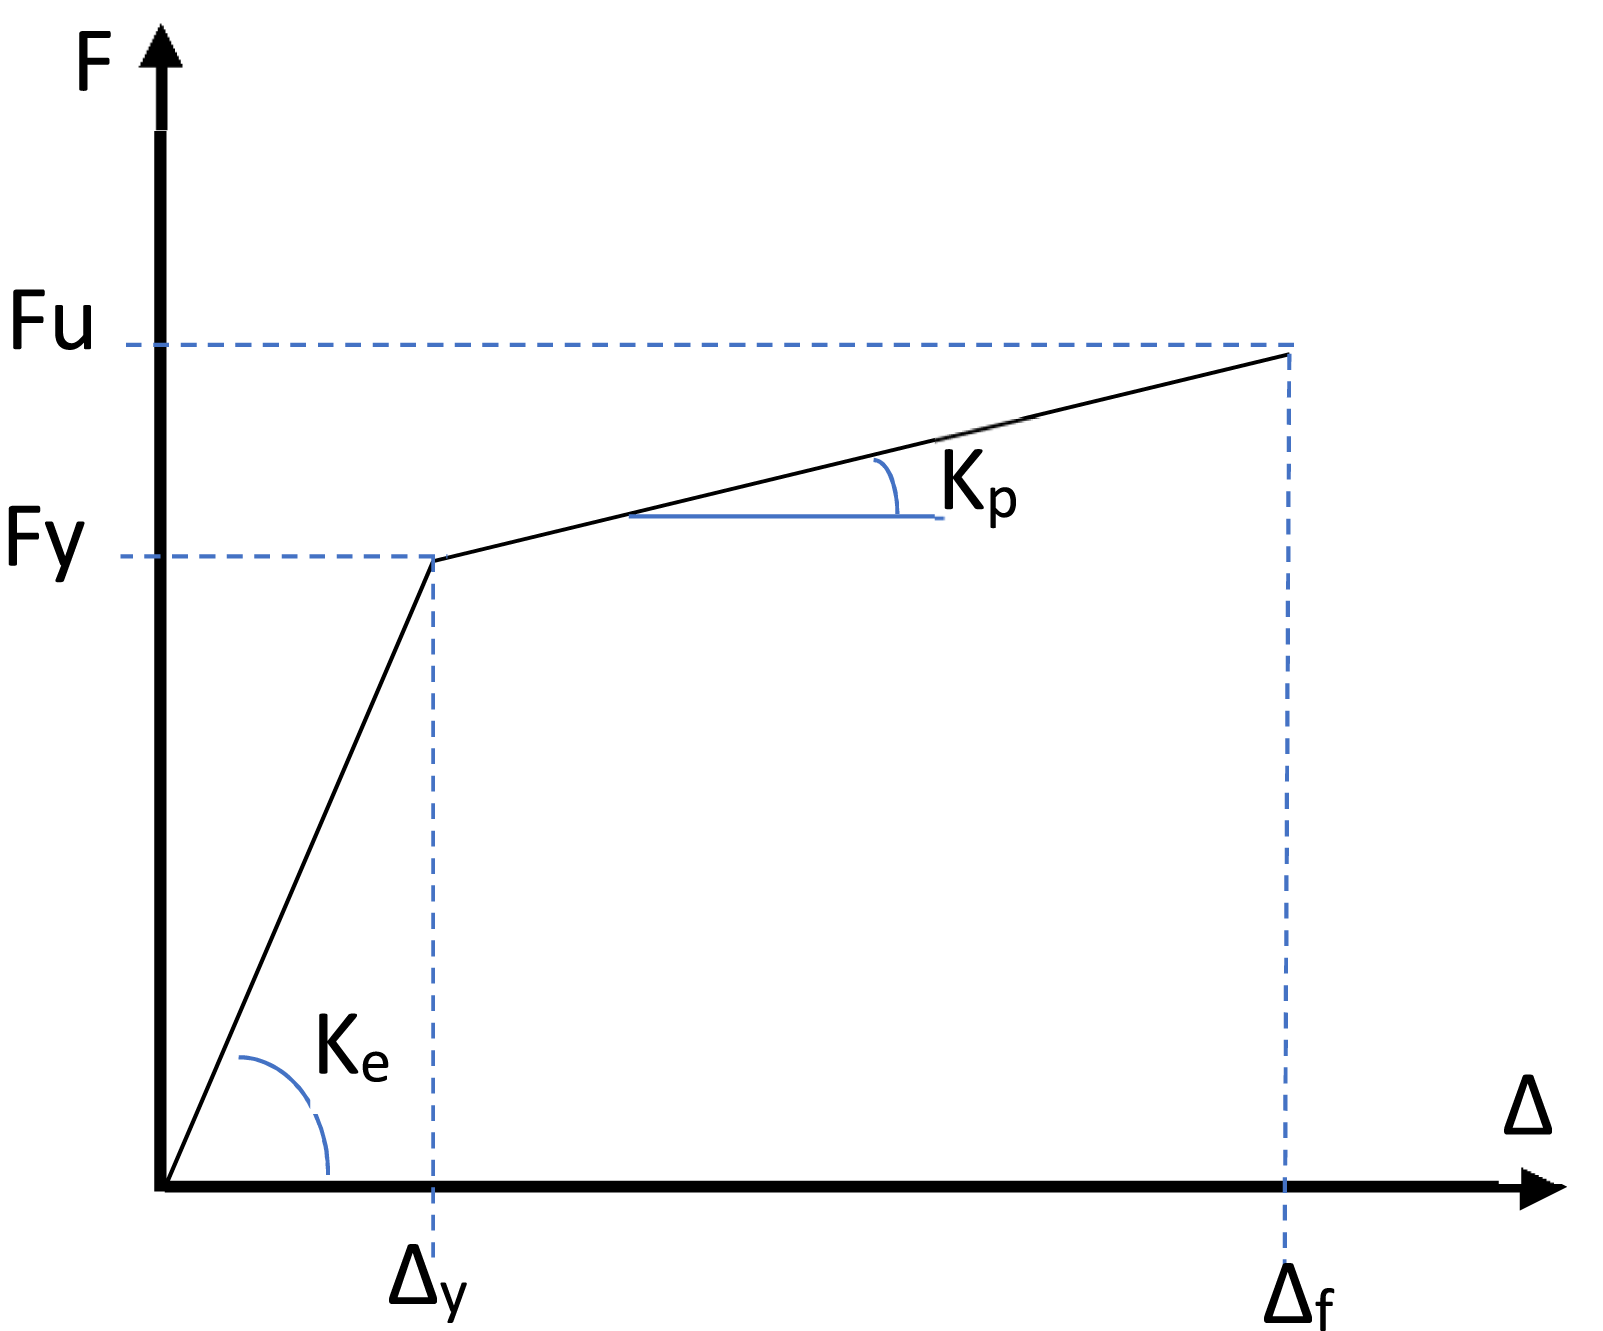
Determining initial stiffness and post limit stiffness (Yaman et al., 2025).
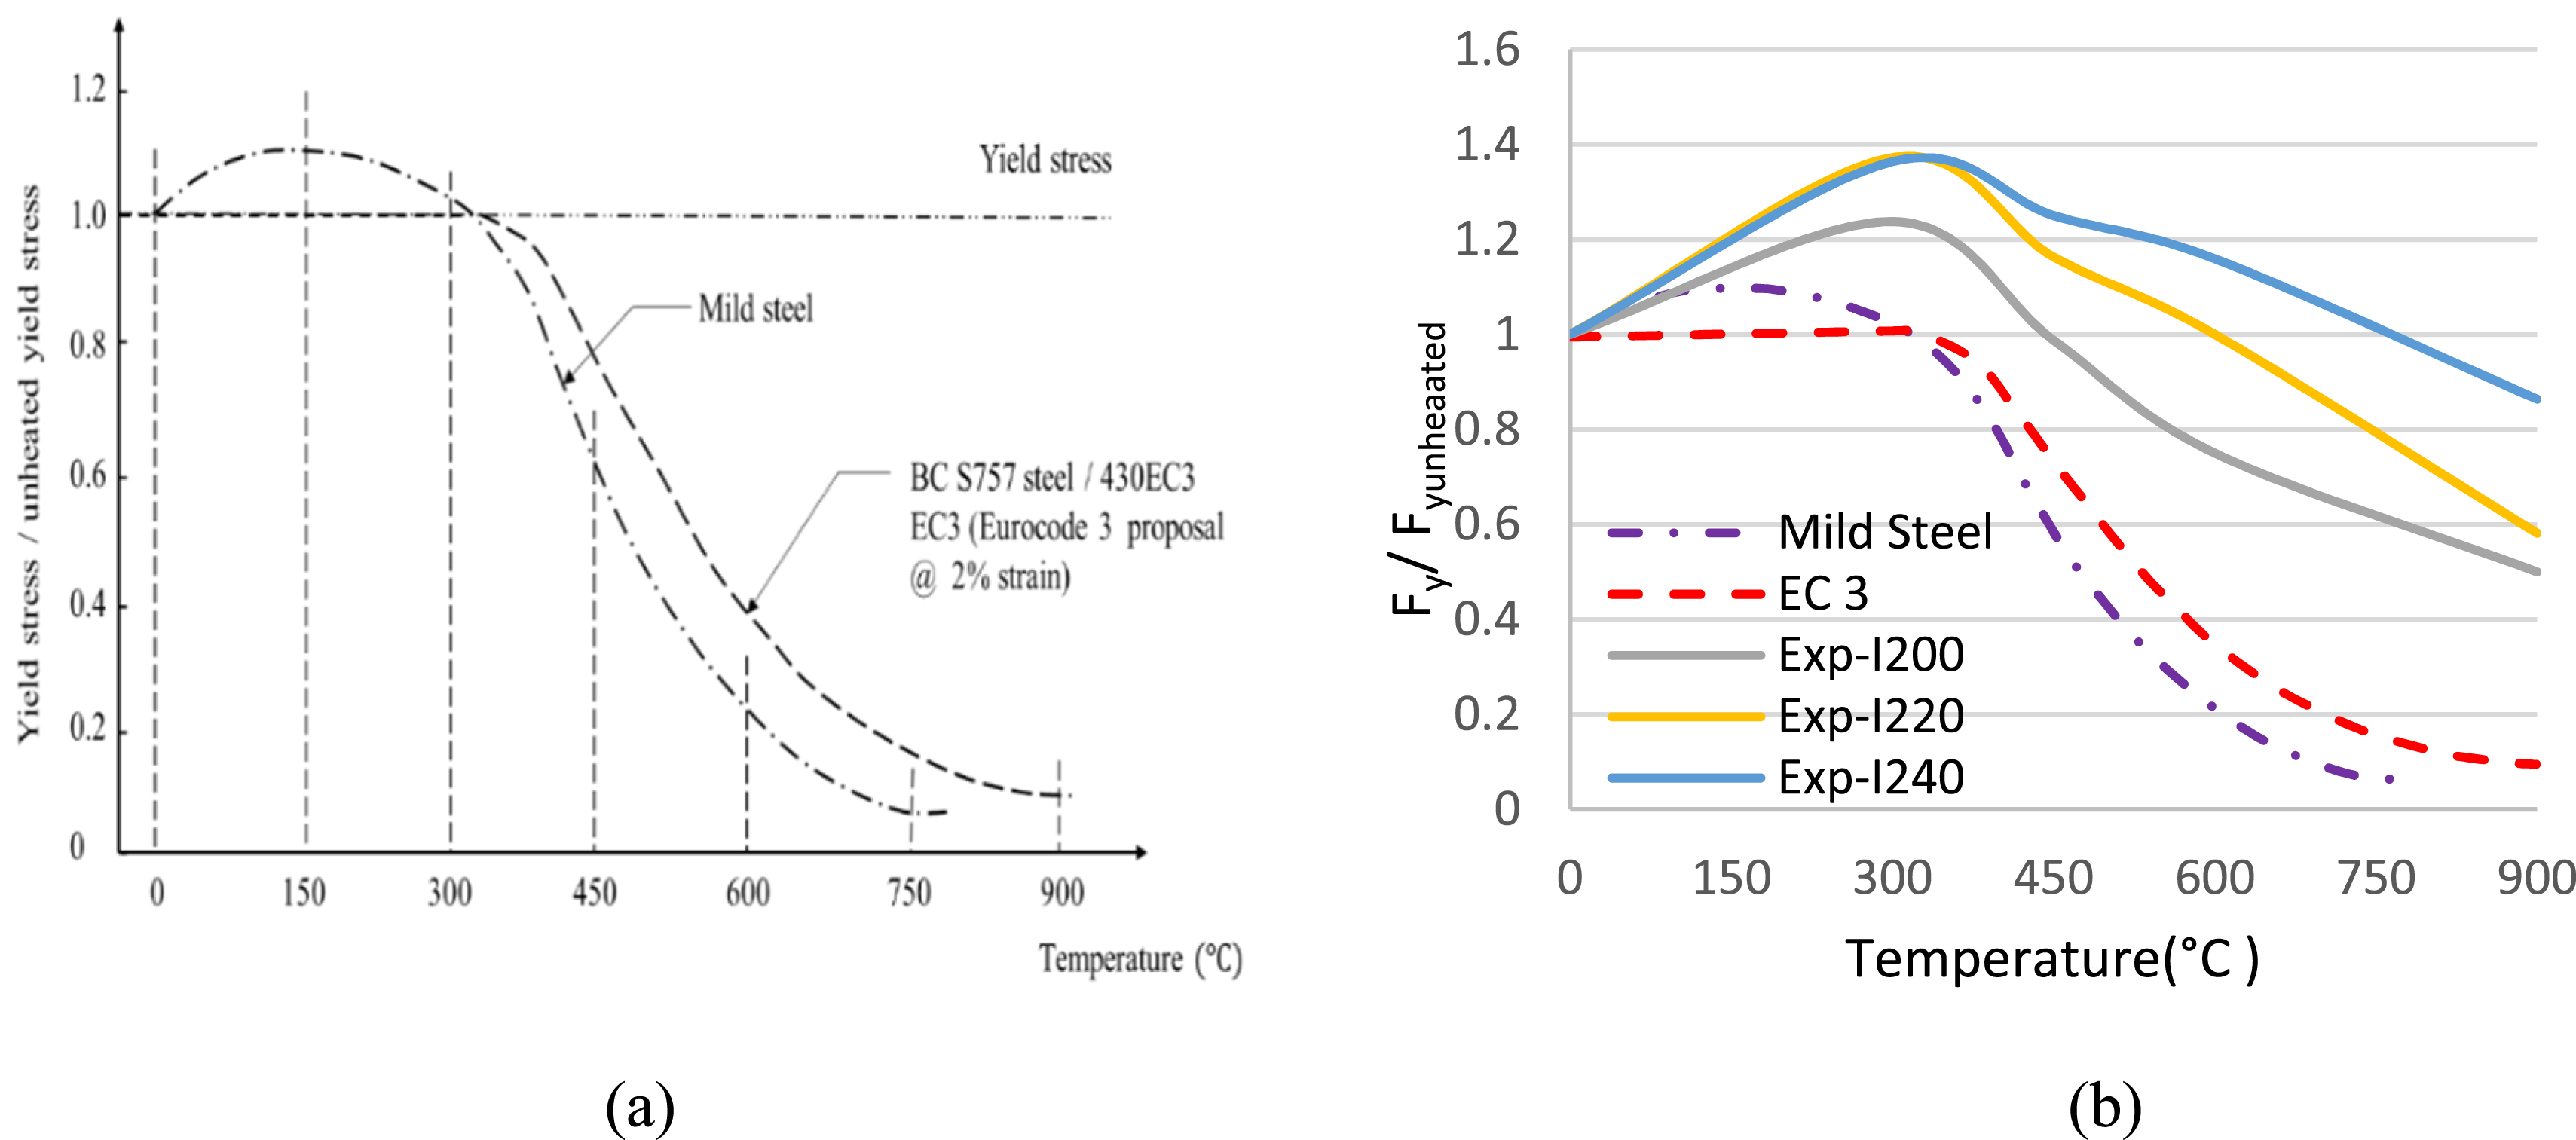
When the load-deformation graphs are examined, it is observed that as the profile cross-section grows towards I200 and I240, the load-carrying capacity increases, but the joints exhibit more rigid behavior. In addition, it is observed that all three profiles’ cross-sections exhibit a more rigid behavior under axial load after being heated and cooled at 300°C, and there is a decrease in strength at 450°C and later. In Table 3, when the deformation capacities of all three test groups are examined, it is seen that the test specimens exposed to 300°C exhibit the highest deformation. A similar situation is observed in the energy dissipation capacity. While the axial load-carrying capacities of T-Stub connections exposed to 300°C, 450°C, and 600°C temperatures are close to each other, with a loss of 5% compared to the reference specimen in all three test groups, the axial load-carrying capacity of T-Stub connections exposed to 900°C is decreased by 40%. The most significant value of the ratio (Kp/Ke) between the post-limit stiffness and the initial stiffness shifts from the T450 element to the T600 element as the cross section grows (Figure 8). The Post-fire Load-deformation curves of I200-I220-I240 specimens at increased from 300°C to 900°C temperature.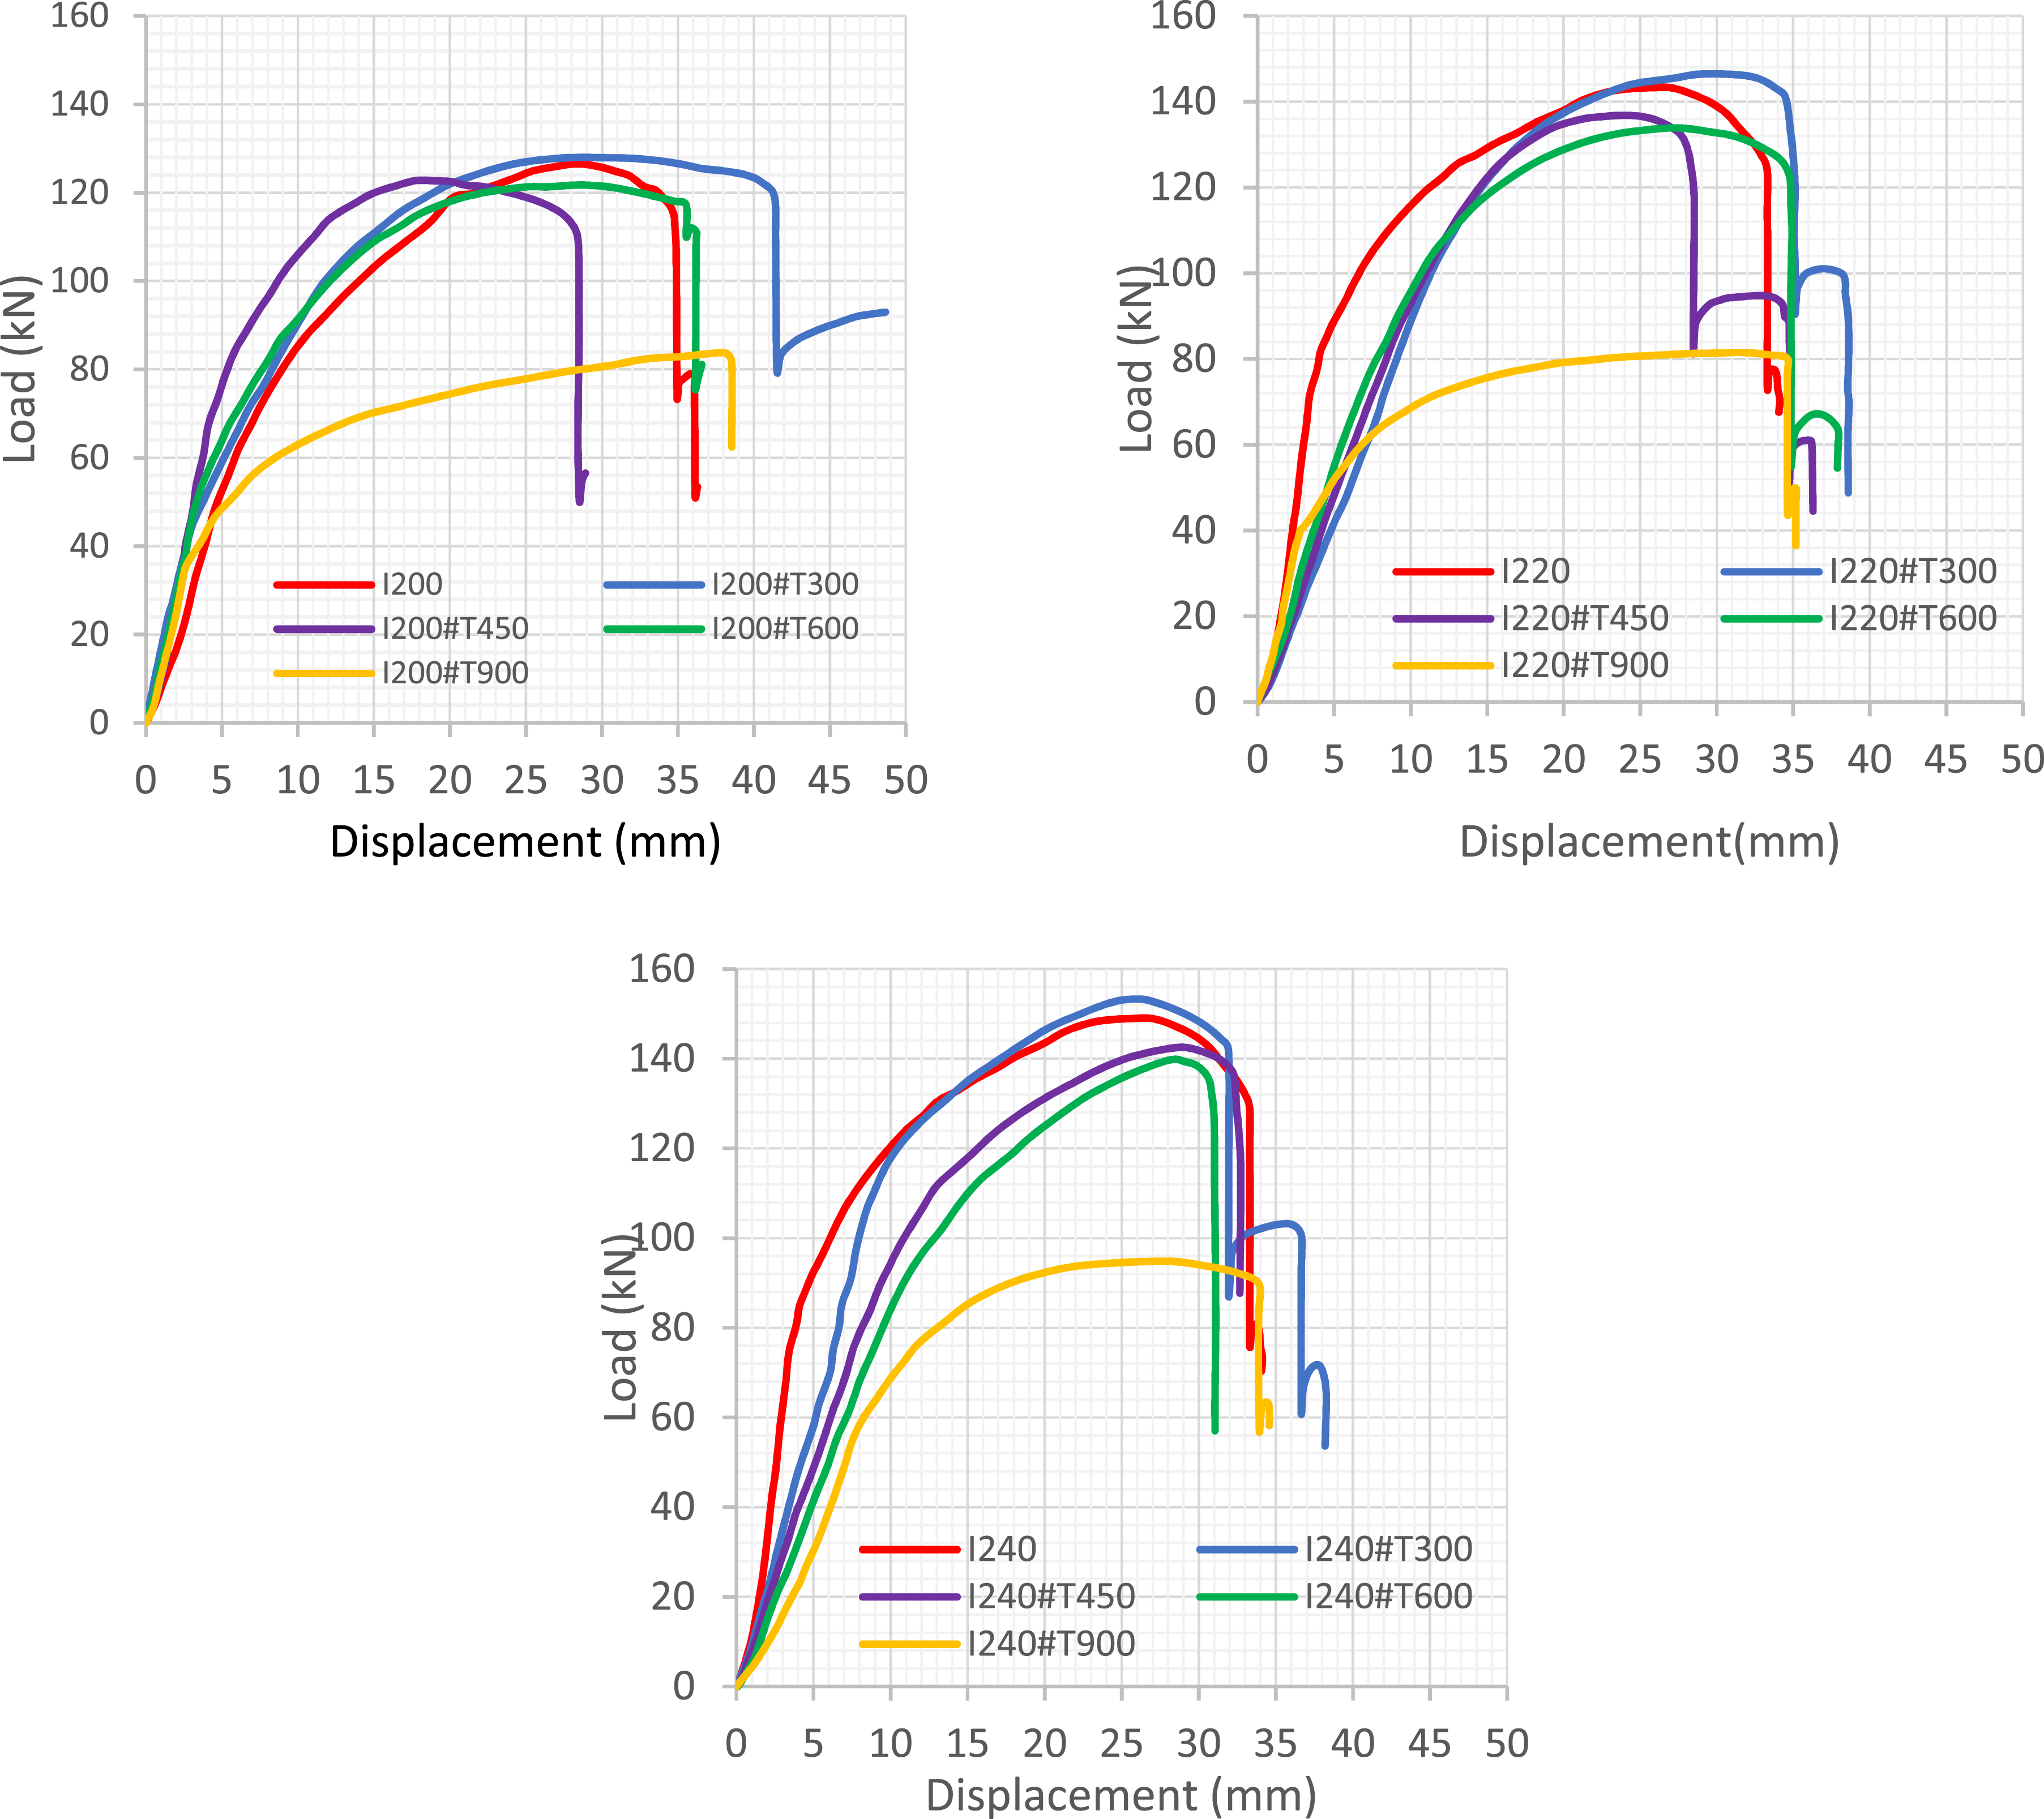
Comparing I220 group elements
Upon examining the post-fire load–deformation behavior and characteristics of the I220 specimens, it was observed that the maximum load-bearing capacity decreased by approximately 6.5%-44.3% as the exposure temperature increased from 300°C to 900°C. However, the specimen exposed to 300°C exhibited an increase of about 2.25% in maximum load capacity. The load–strain characteristics of the I220 group are presented in Figure 8 and Table 3. The maximum deformation values decreased with increasing post-fire temperature from 300°C to 900°C. In general, as the temperature increased, both the load-bearing capacity and structural resistance declined. While an increase in ductility was observed in the specimens exposed to 300°C, 450°C, and 600°C, a sudden decrease in ductility was noted in the specimens subjected to 900°C. Furthermore, when the I220 specimens were compared with the reference (unheated) specimens, the initial stiffness ratio generally decreased with increasing temperature. Additionally, as the temperature increased from 300°C to 900°C, the energy dissipation capacity decreased by approximately 11.75% to 38.74%. On the other hand, the I220-T300 specimen exhibited a 4.5% increase in energy dissipation compared to the reference I220 specimen. These findings indicate that exposure to temperatures above 450°C reduces energy dissipation capacity.
Comparing I240 group elements
The maximum load value decreased by approximately 17% and 39%, respectively, as the post-fire temperature increased from 300°C to 900°C. However, the maximum load value increased by about 5.13% as the post-fire temperature increased to 300°C. Generally, the resistance and the maximum load value decreased with increasing post-fire temperature from 300°C to 900°C. Also, the initial stiffness ratio decreased with increasing post-fire temperature. Table 3 shows that the maximum deformation increases with increasing post-fire temperature from 300°C to 900°C. In addition, the maximum deformation increased with increasing temperature in the I240 profiles, where different post-fire temperatures were applied, compared to the reference I240 specimen. However, as the post-fire temperature increased from 300°C to 900°C, the dissipated energy decreased by approximately 17%-39%. However, in the I240 specimen test, where the temperature reached 300°C, the dissipated energy increased by about 5% with increasing post-fire temperature. After 300°C, the dissipated energy decreased with increasing post-fire temperature. As a result, at temperatures above 300°C, steel’s strength and energy dissipation capacity are reduced.
Strength ratio and ductility
Yield load, failure load, ductility ratio, and failure modes of I200, I220, and I240 specimens under 300–900°C post-fire conditions.
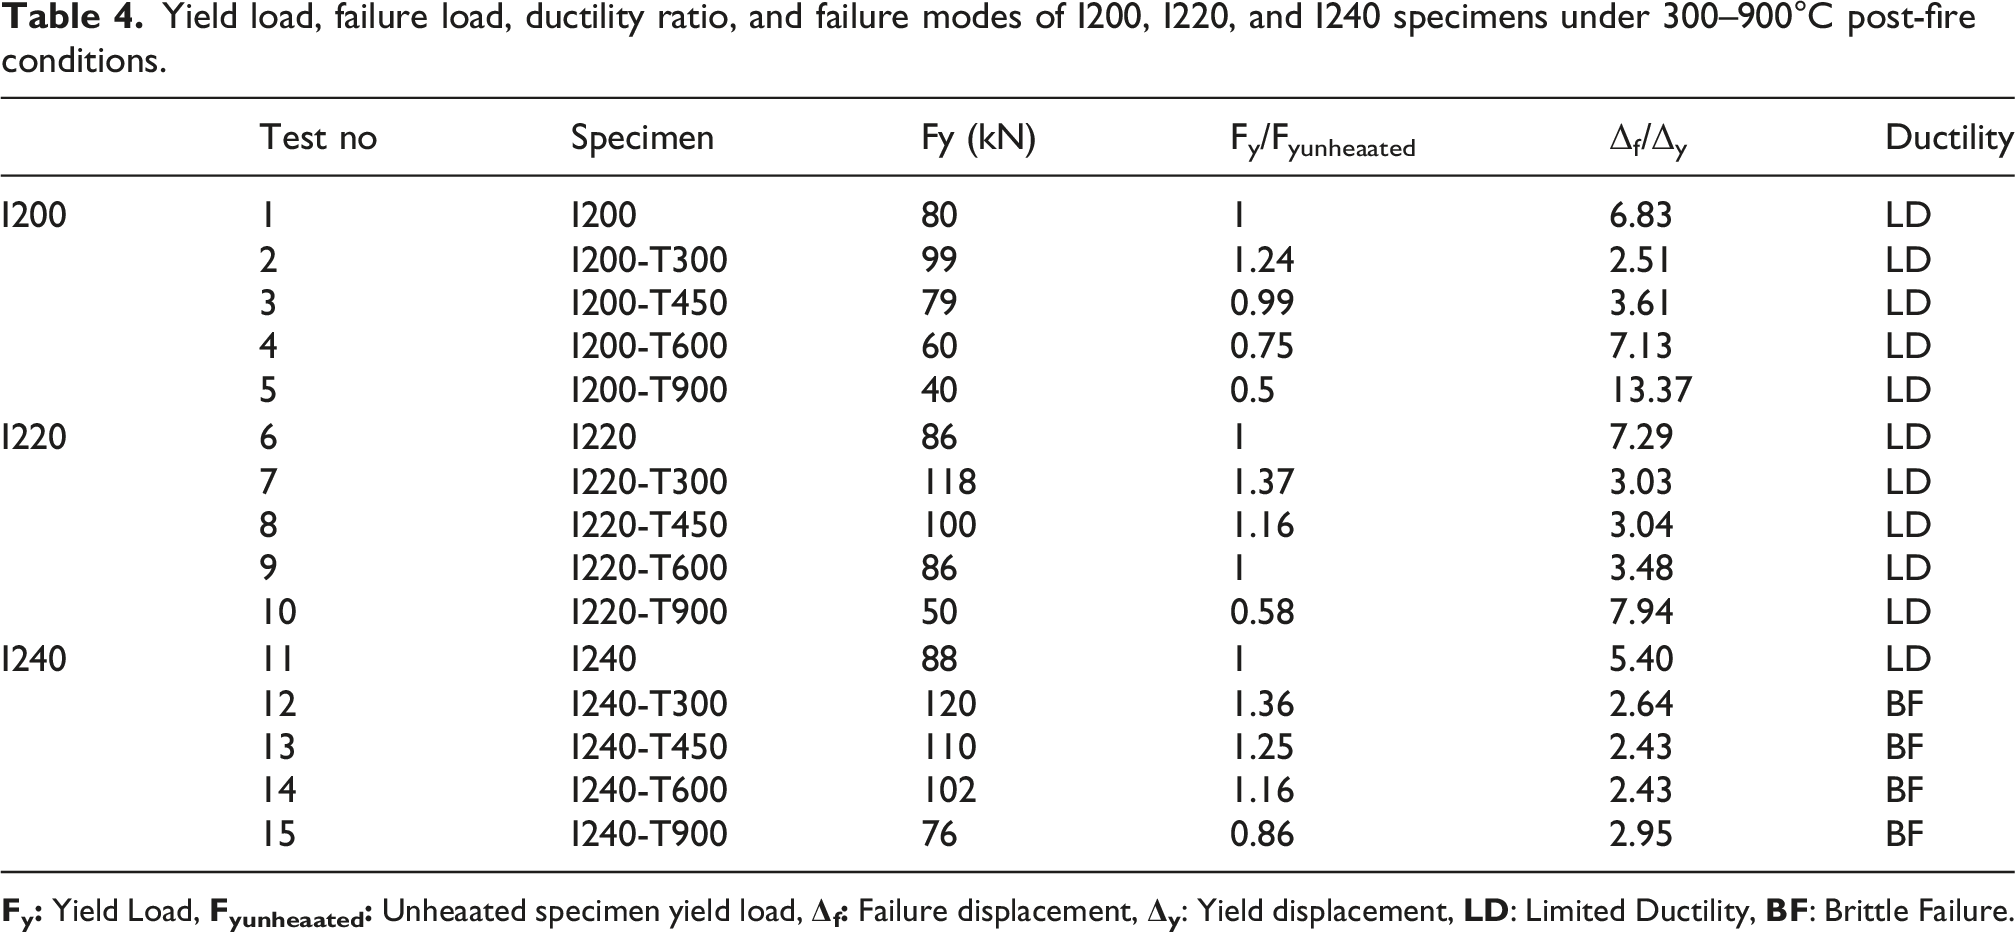
When the curve showing the relationship between steel strength and temperature in Eurocode 3 is examined, it is seen that the steel exposed to temperatures up to 300° hardens after the heating-cooling cycle (Figure 9). When the curves describing the relationship between strength and temperature obtained from the experimental study of T-Stub joints are compared with the curve in Eurocode 3, a similar behavior is observed (Figure 10(a)-(b)). Post-fire strength, ductility, and Kp/Ke ratios of I200-I220-I240 T-Stub connections exposed to elevated temperatures from 300°C to 900°C. Reduction factors for the stress–strain relationship of carbon steel at elevated temperatures: (a) according to Eurocode 3; (b) based on the experimental results obtained from post-fire tensile tests conducted after specimens were cooled to room temperature.
Effect of flange-to-web thickness ratio (tf/tw) on Kp/Ke ratio and load-carrying performance of specimens
The influence of the flange-to-web thickness ratio (tf/tw) on the load-carrying capacity and the post-limit to initial stiffness ratio (Kp/Ke) of bolted T-Stub connections under various post-fire conditions is illustrated in Table 3 and Figures 9 and 11. An increase in the tf/tw ratio from 1.52 to 1.56 led to an average increase of 10% in the maximum load capacity, while a rise from 1.52 to 1.58 resulted in a 17% improvement, based on comparisons of specimens subjected to the same temperature. Regarding ductility, as measured by the Kp/Ke ratio, the I200 group exhibited the highest value (0.21) at 450°C with tf/tw = 1.52. For I220 and I240 groups with higher tf/tw ratios (1.56 and 1.58), the peak Kp/Ke values occurred at 600°C, indicating that increasing tf/tw shifts the temperature at which maximum post-yield stiffness occurs. Specifically, the Kp/Ke ratio increased from 0.19 for tf/tw = 1.56 to 0.26 for tf/tw = 1.58, highlighting the positive effect of web and flange proportions on post-fire ductility. Comparison of Fmax, Kp/Ke ratio, deformation capacity, and energy dissipation in post-fire resistance of I200, I220, and I240 specimens exposed to temperatures between 300–900°C.
The test elements exposed to 300°C showed a significant increase in deformation capacity in all three experimental groups compared with the reference specimens, but a rapid decrease at 450°C compared with 300°C. While the temperature ranged from 450 to 900°C, this decrease was followed by an increase. However, in general, a decrease in deformation capacity is observed as the tf/tw ratio changes from 1.52 to 1.58. In addition, as the tf/tw ratio increased, the energy distribution ratio also increased. A comparison of all test specimens exposed to the same temperatures are shown graphically in Figure 11.
As the tf/tw ratio increases, the flange becomes significantly stiffer relative to the web. With the flange thickening, plastic hinge development is restricted, resulting in a narrower deformation region in the stress–strain response. This reduction in plastic deformation capacity decreases the energy dissipation potential, thereby reducing the overall ductility of the connection. In specimens with tf/tw ratios of 1.52 and 1.56, the T-Stub connections failed in Mode 1, as defined in Eurocode 3. This mode is characterized by yielding of the T-Stub flange and bolt fracture, representing semi-rigid connection behavior. However, at a tf/tw ratio of 1.58, the connection transitioned to a Mode 3 failure mechanism, where bolt fracture occurs before the flange yields. This behavior typically arises when the flange is excessively thick and is commonly associated with rigid connection performance. Moreover, maintaining a constant bolt diameter across all specimens further suppressed localized deformation, causing the stiff flange to dominate the response and promoting a more brittle failure mode.
Numerical investigation
Fifteen three-dimensional (3D) numerical models were created using the commercial FE package ABAQUS to evaluate how bolted T-Stub connections will behave in various post-fire conditions. The observed cross-sectional dimensions, initial geometric flaws, material characteristics from the coupon tensile tests, and more were incorporated into the FE model.
Material properties
The T-Stub was modeled using the incremental plasticity model, incorporating the nonlinear material characteristics from real stress-logarithmic plastic strain curves. The following equations were used to derive the true stress-strain relationship from the engineering stress-strain curve.

Element type and mesh size
The model was built using the solid element C3D8R (eight-node reduced integration brick element), which can simulate nonlinearities in geometrical and material behavior. A mesh convergence study was conducted using three different mesh densities for the T-Stub and bolt components: a coarse mesh (6 × 6 mm for the T-Stub and 4 × 4 mm for the bolts), a medium mesh (3 × 3 mm for the T-Stub and 2 × 2 mm for the bolts) (Figure 12)., and a fine mesh (2 × 2 mm for the T-Stub and 1 × 1 mm for the bolts). For the reference I200 specimen, the selected medium mesh predicted a maximum load of 130.1 kN, compared to the experimental value of 126.5 kN, corresponding to a deviation of 2.8%. The predicted energy dissipation capacity was 3429.48 kN·mm, which shows excellent agreement with the experimental value of 3434.2 kN·mm, with a difference of only 0.1%. In contrast, the coarse mesh overestimated both stiffness and load-carrying capacity. The maximum load obtained with the coarse mesh was approximately 136 kN, corresponding to an overestimation of about 8%, while the predicted energy dissipation was approximately 3910 kN·mm, which is nearly 13% higher than the experimental result. This deviation is attributed to insufficient mesh resolution around the bolt holes and plastic hinge regions, leading to artificially increased stiffness. The fine mesh yielded a maximum load of approximately 129 kN and an energy dissipation capacity of about 3460 kN·mm, resulting in variations below 1–2% compared to the medium mesh. However, the computational time increased significantly (approximately three times longer than the medium mesh). Therefore, the medium mesh configuration (3 × 3 mm for the T-Stub and 2 × 2 mm for the bolts) was adopted as the optimal balance between numerical accuracy and computational efficiency. Finite element model of experimental specimens and boundary conditions.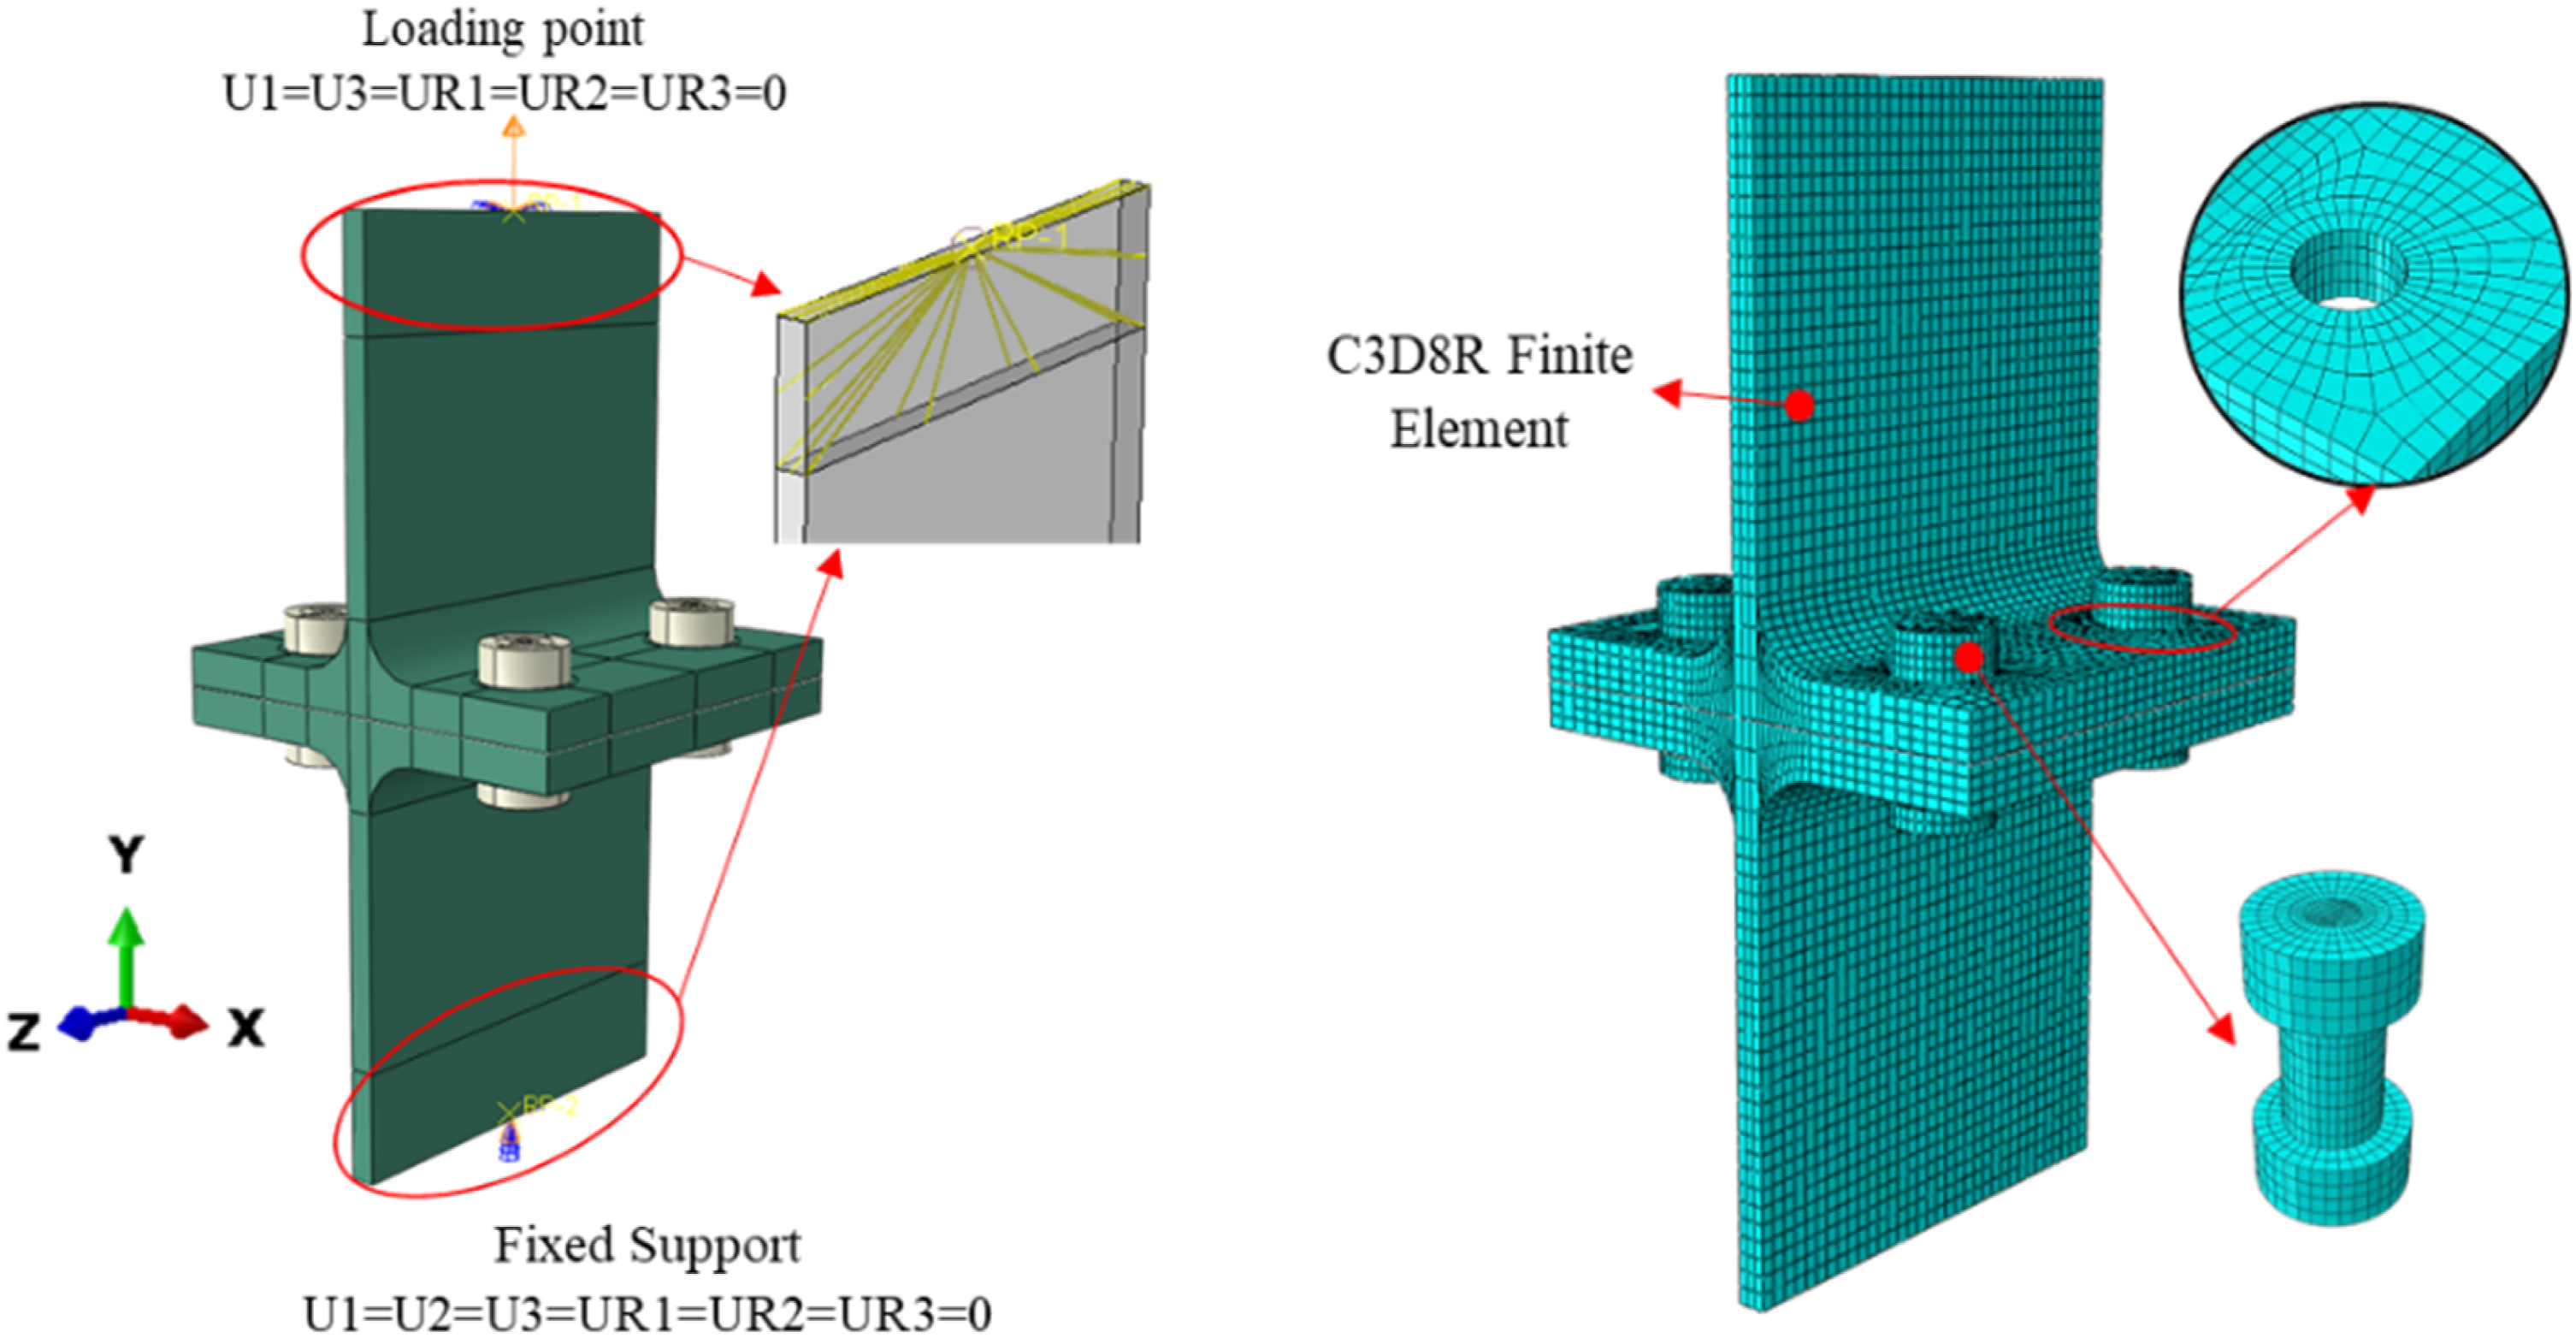
Boundary Conditions and loading procedure
The FE model needed to define the contact pairings, including the interactions between the bolt head and the flange top surface, and between the bolt shank and the inner surface of the bolt hole. A “hard contact” command was used for all of the aforementioned contact pairs to allow separation between contacting surfaces. The tangent and normal directions, which are orthogonal, were used to establish the attributes for each contact pair. A “hard contact” attribute was used to characterize the constitutive relationship in the normal direction, allowing separation after contact. A penalty-based friction model with a 0.3 friction coefficient described the tangential behavior. The whole FE analysis included four steps. A pretension force (e.g., 50 kN) was applied to each bolt in the very first analysis step using the bolt load function. The influence of this pretension was inherently accounted for in all subsequent analysis stages, including thermal loading, cooling, and post-fire mechanical loading. Then, for the second and third steps, the model was heated and cooled, respectively, according to the temperature history measured from the experiment as thermal loading. At the end of the cooling step, the thermally induced residual stress state was extracted and assigned as predefined fields using the initial state definition in ABAQUS. In the final step of the analysis, a monotonically increasing displacement load up to 50 mm was applied to the end of the web. At the same time, the previously defined residual stress field was actively considered. Although residual stress fields were not directly measured in the present experimental program, the validity of the modelling approach was confirmed through comparison with experimental load–displacement curves, showing close agreement in maximum load and energy dissipation capacity. Therefore, the adopted procedure provides a reliable representation of post-fire structural behavior.
The objective of the present study is to evaluate the post-fire residual capacity of bolted T-Stub connections rather than their structural response during fire exposure. Accordingly, all experimental tests were conducted after the specimens were heated following the ISO 834 standard fire curve and subsequently cooled to ambient temperature. The thermal step implemented in the FEM reproduces this heating–cooling cycle to obtain the corresponding residual stress field prior to mechanical loading. Time-dependent phenomena such as creep, transient thermal strain, and temperature-dependent stress relaxation during the heating phase were not explicitly modeled, as the study focuses on residual strength and stiffness after cooling. The numerical model was therefore validated against experimental load–displacement responses measured under post-fire conditions.
Validation of the finite element methods (FEM)
A finite element model was created in ABAQUS for each of the 15 T-Stub connections studied experimentally. It has been observed that the behavior and collapse mode of 15 T-Stub connections in the experimental study are similar to those obtained from finite element model analyses of each connection. In Figure 13, several experiments and FEM results are presented, showing the level of similarity between the experimental study and the ABAQUS model collapse mode. Maximum load and energy dissipation values are presented in Table 5. T300 specimen post-experiment and ABAQUS-FEM post-analysis failure modes. Comparison of experimental and FEA results in terms of maximum load and energy dissipation capacity.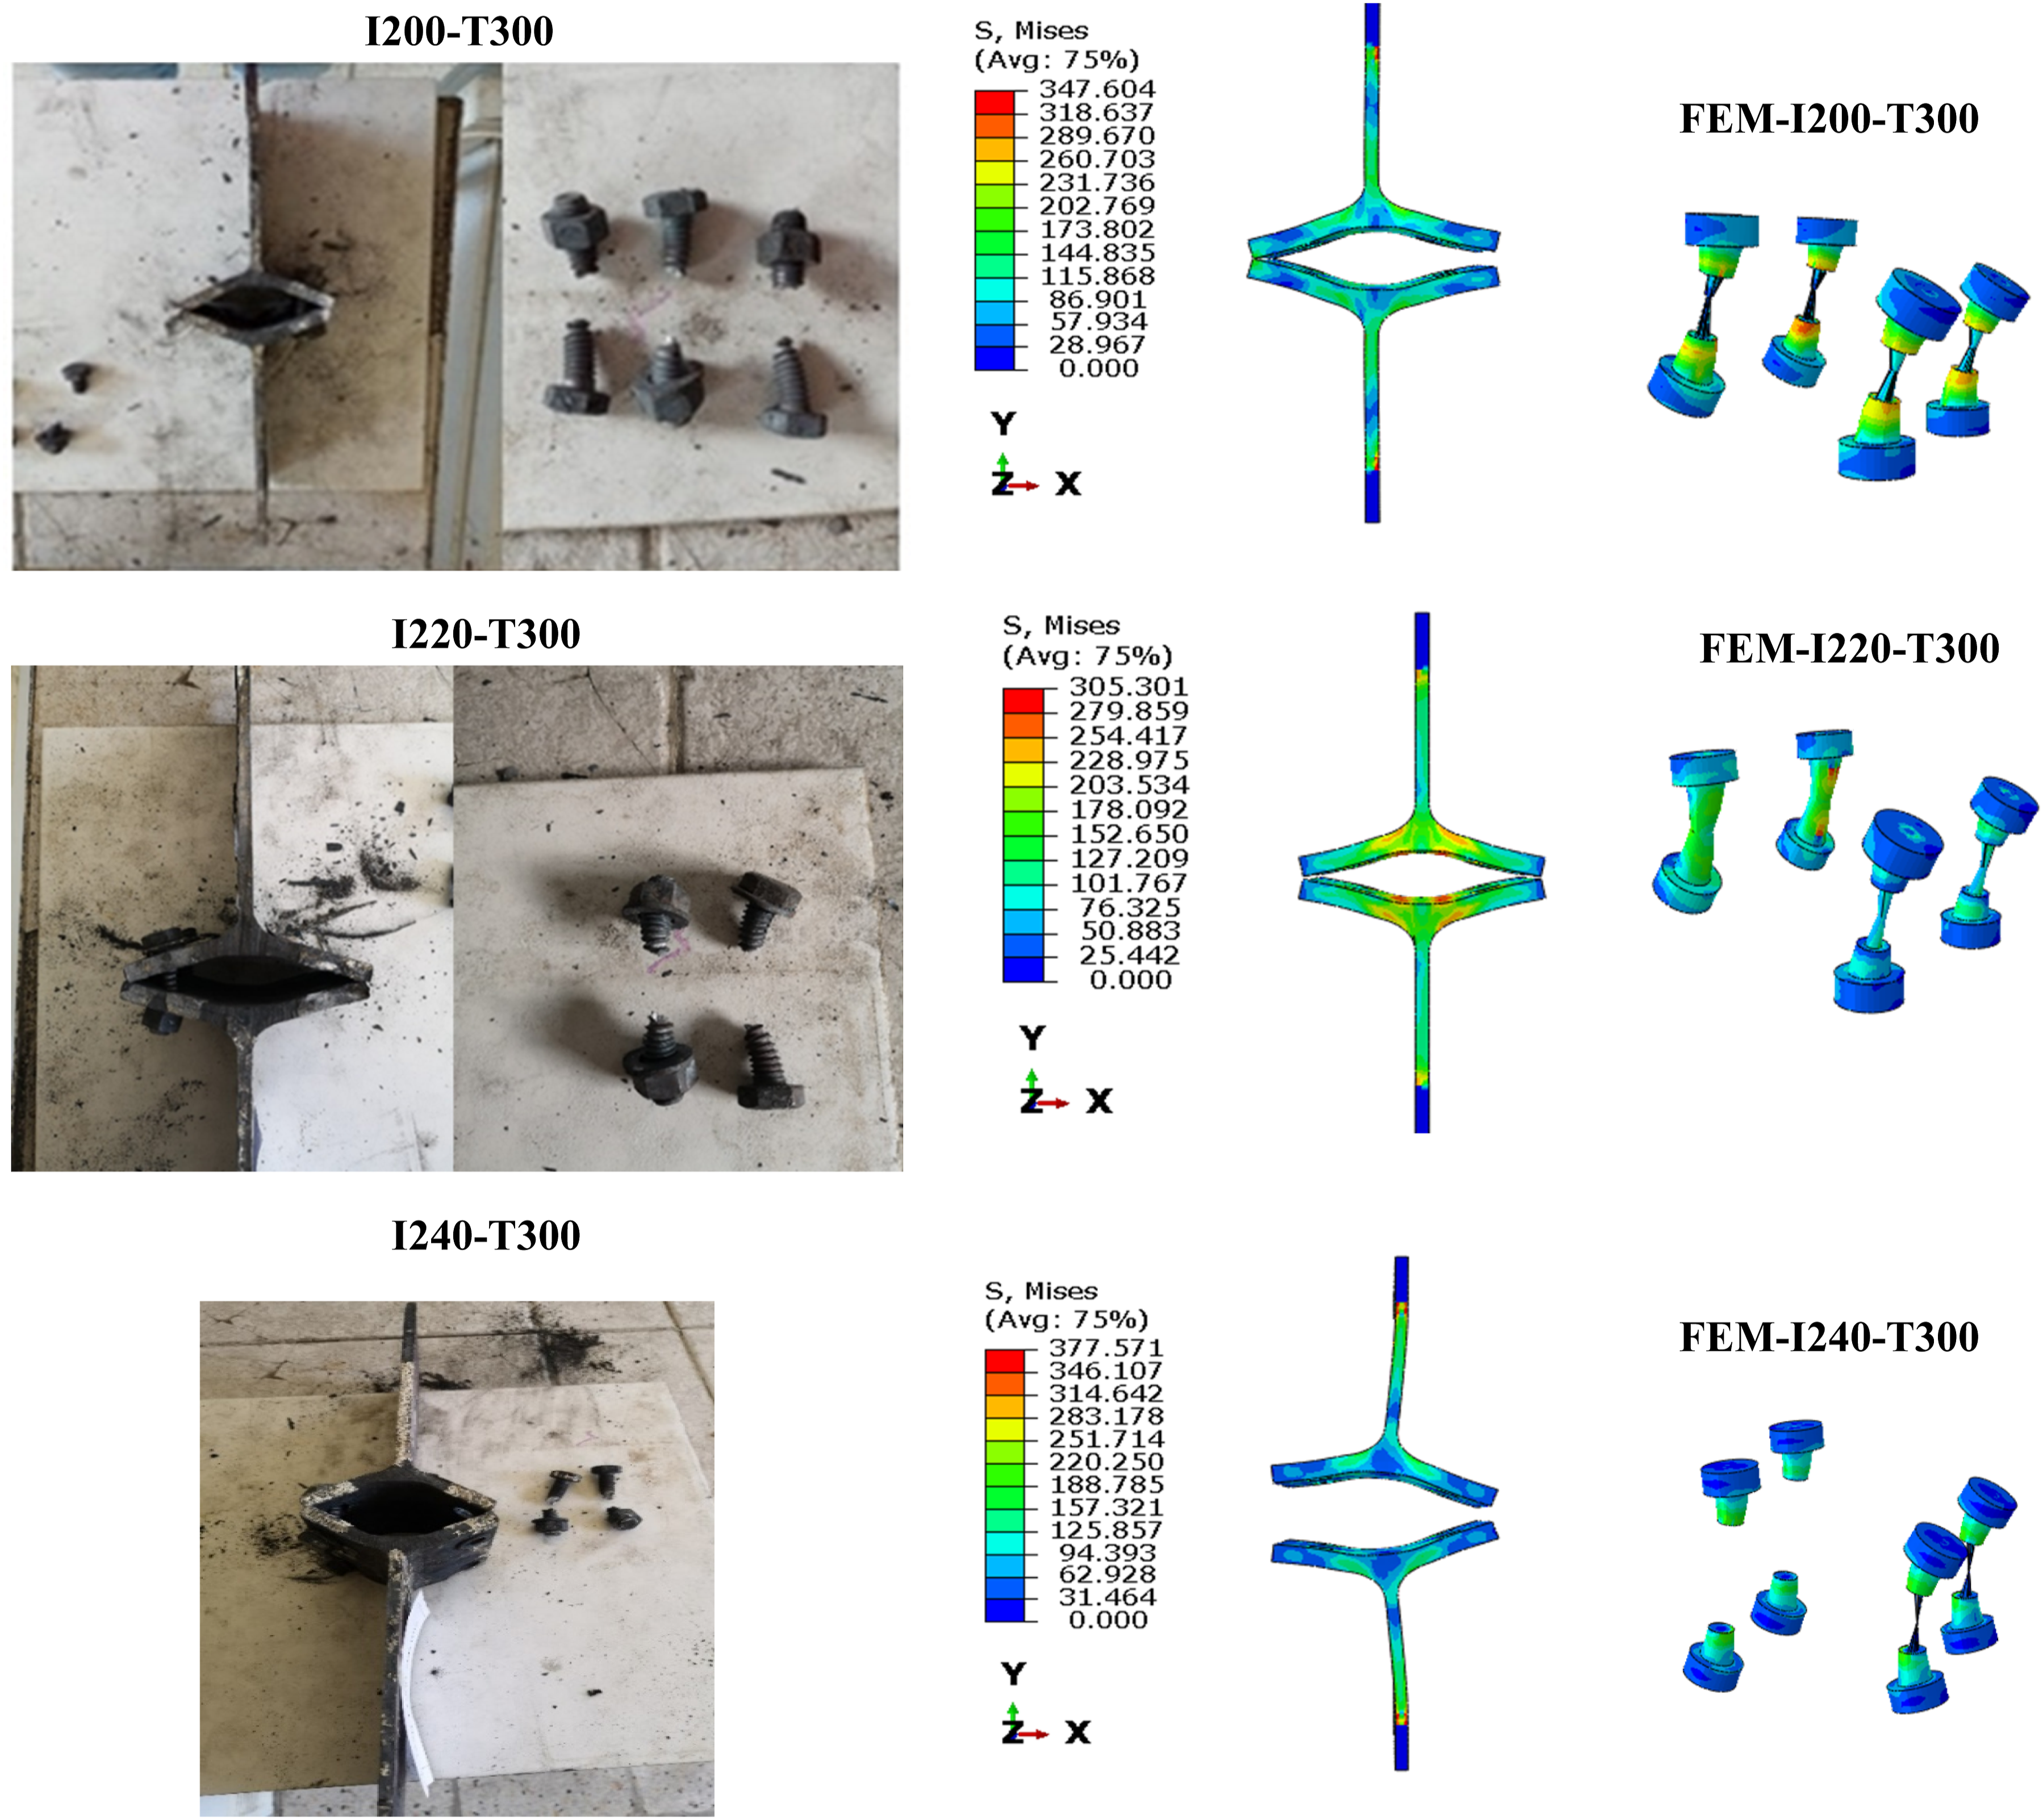

By comparing the maximum load and energy dissipation values obtained from the experimental study of 15 T-Stub connections and the maximum load and energy dissipation values obtained from the ABAQUS-FEM analysis, the percentage of convergence to the experimental results was calculated. These values are presented numerically in Table 5 and in curves in Figure 14. The load-displacement curves are well-behaved. Nonetheless, higher discrepancies in energy dissipation values were observed in certain cases, notably the T900 specimens. This can be attributed to the severe degradation of steel ductility and increased sensitivity to local imperfections at 900°C. In the experiments, mechanisms such as bolt slippage, slight out-of-plane deformations, and localized yielding enhanced the total energy dissipation, which was not fully captured in the idealized FEM conditions. Validation graphs of experimental results with the finite element model.
Failure modes
There are three failure modes in Eurocode 3 for the T-Stub connections. Mode 1 is the complete flange yielding without bolt failure. Mode 2 is the flange yielding with bolt failure, and Mode 3 is bolt failure. Figure 15 shows how the failure modes determined from FEM analysis compare with those from laboratory testing. As shown in Figure 16, all models showed Mode 2 as the failure mode. After 2 or 3 bolts were broken, all connections in all models formed a V shape at failure. Only in the IPE 200 tests, if the bolts were M12 in some models, flange yielding could also be observed. Also, as the experimental wall thickness increases, removing IPE 240 from IPE 200 decreases bolt breakage from 3 to 2. Determining the failure mode. The failure modes of all models.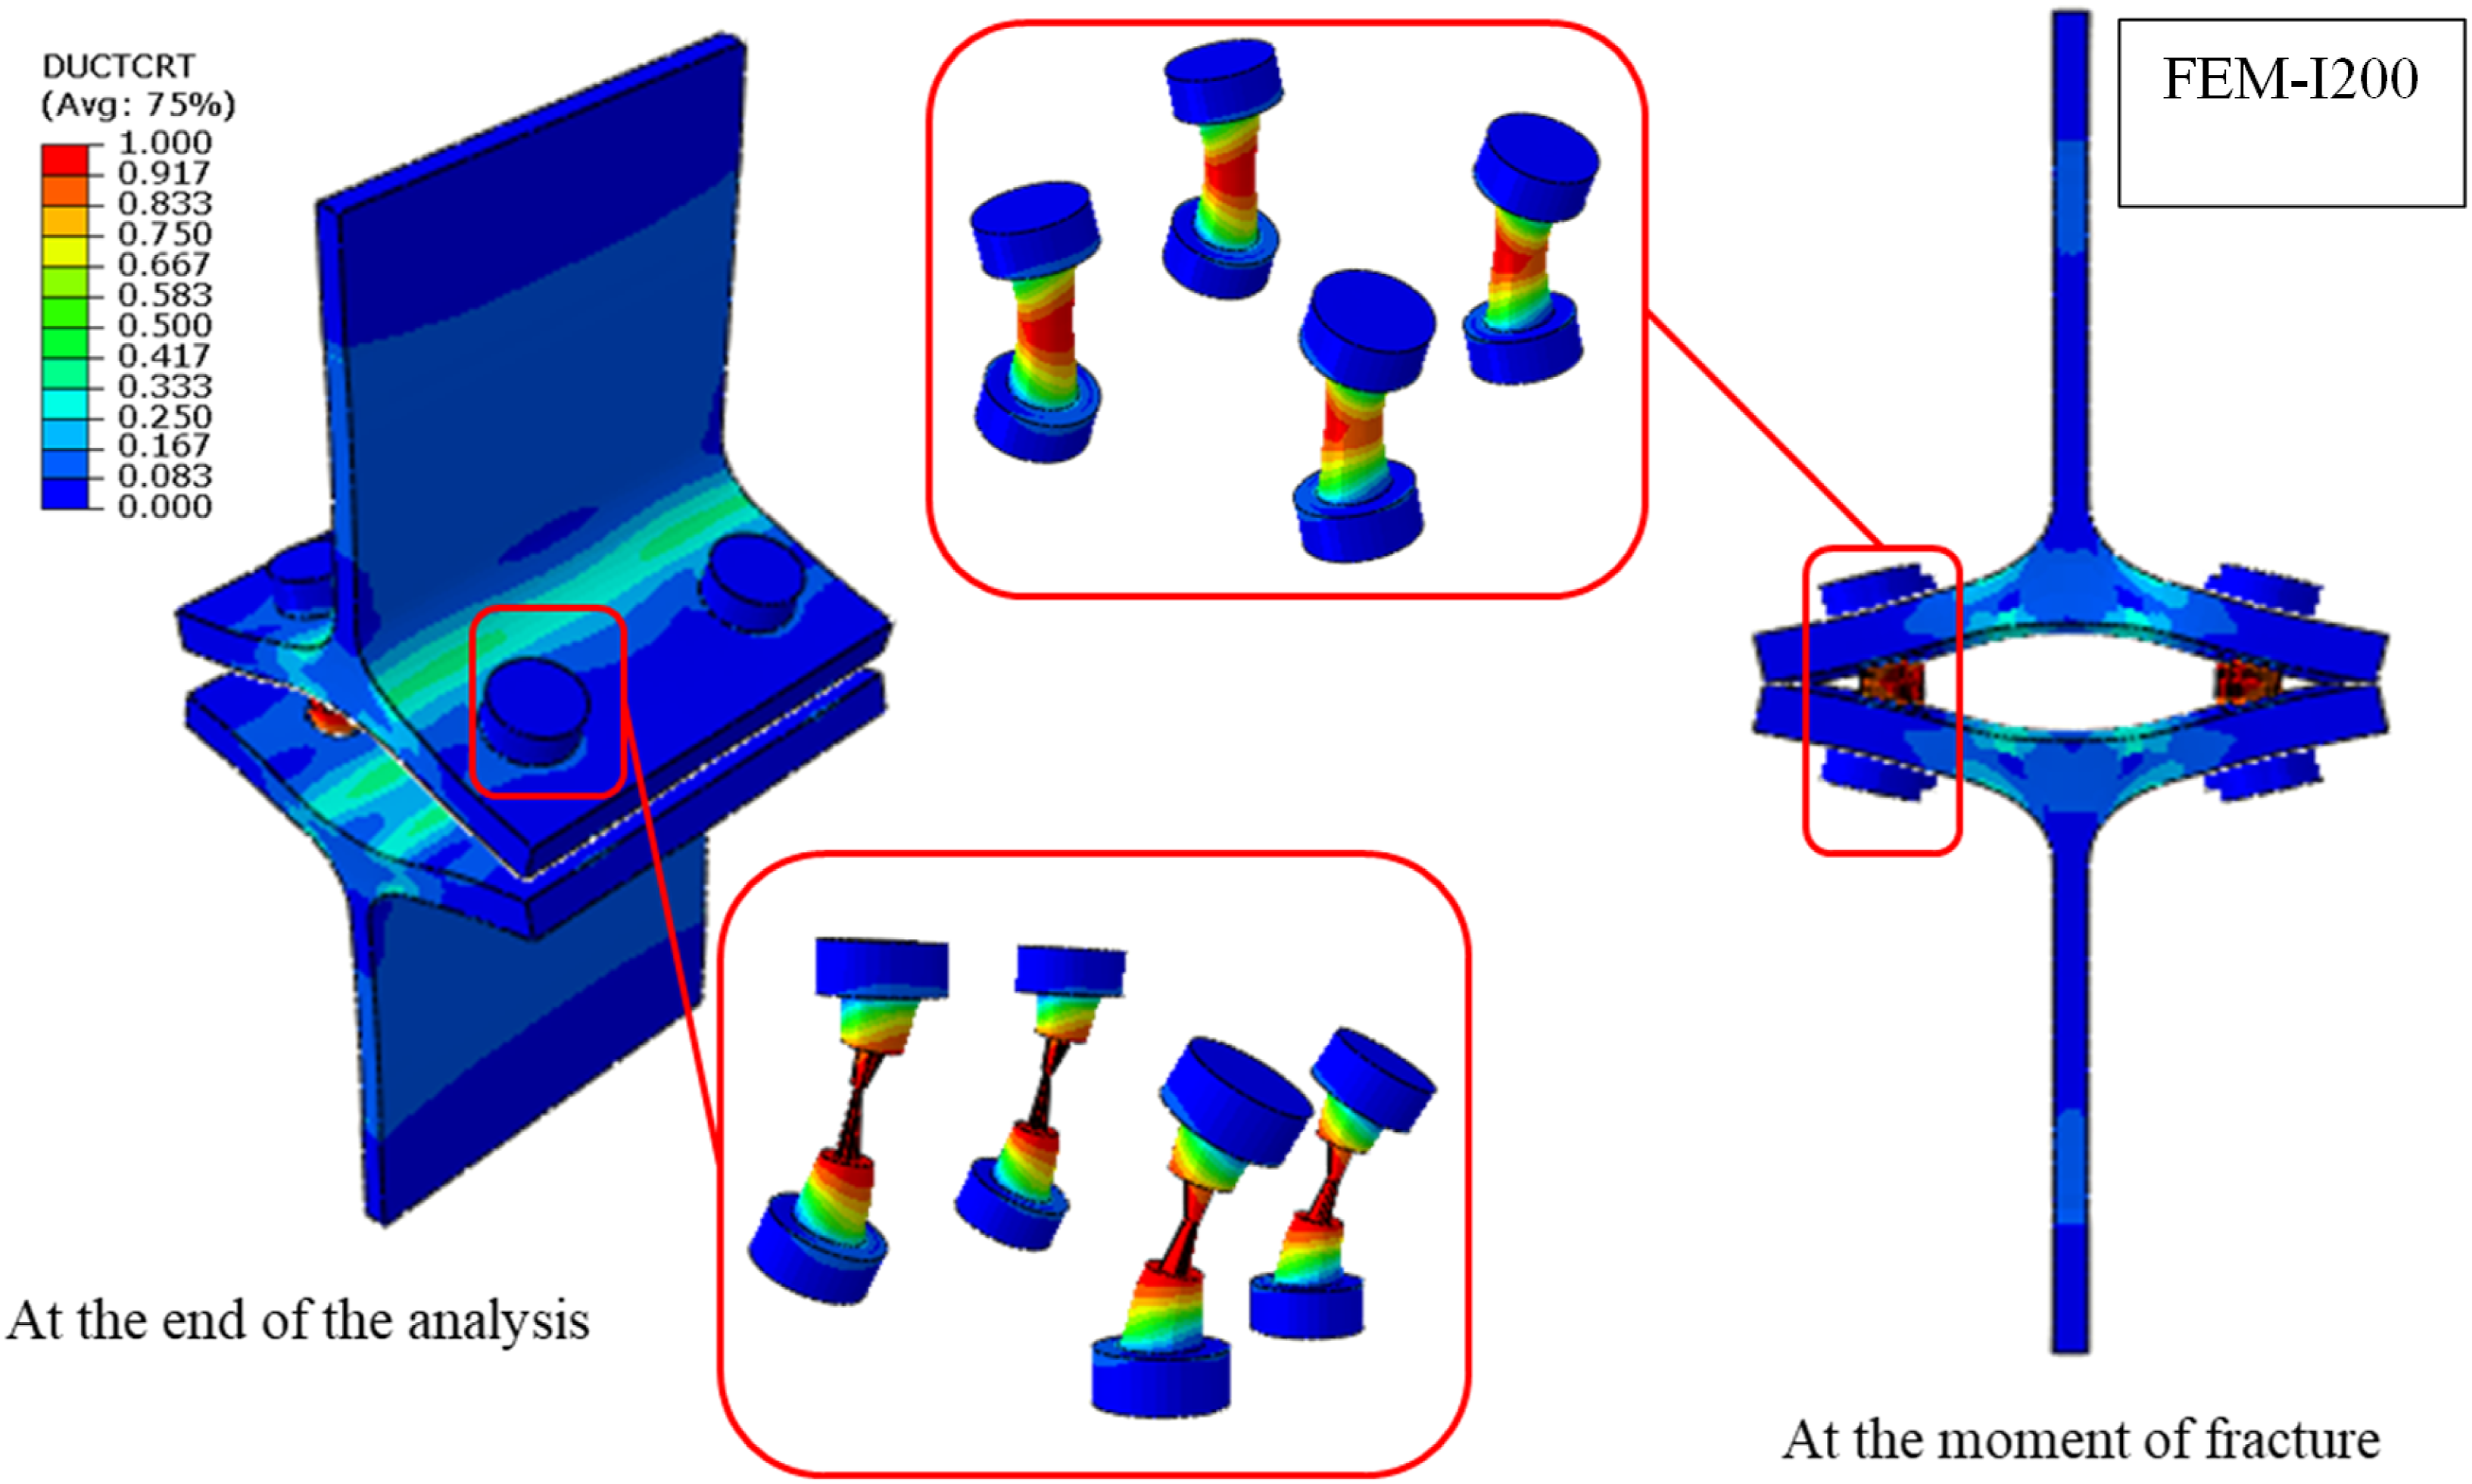
The experimental observations indicate that the overall response is generally governed by flange deformation. Accordingly, the load–deformation behavior of the T-stub connection is primarily controlled by flange bending. While bolt behavior contributes to load transfer and the development of prying forces, the deformation of bolts remains secondary under the tested conditions and does not govern the failure mechanism.
Parametric study
Parametric study matrix.
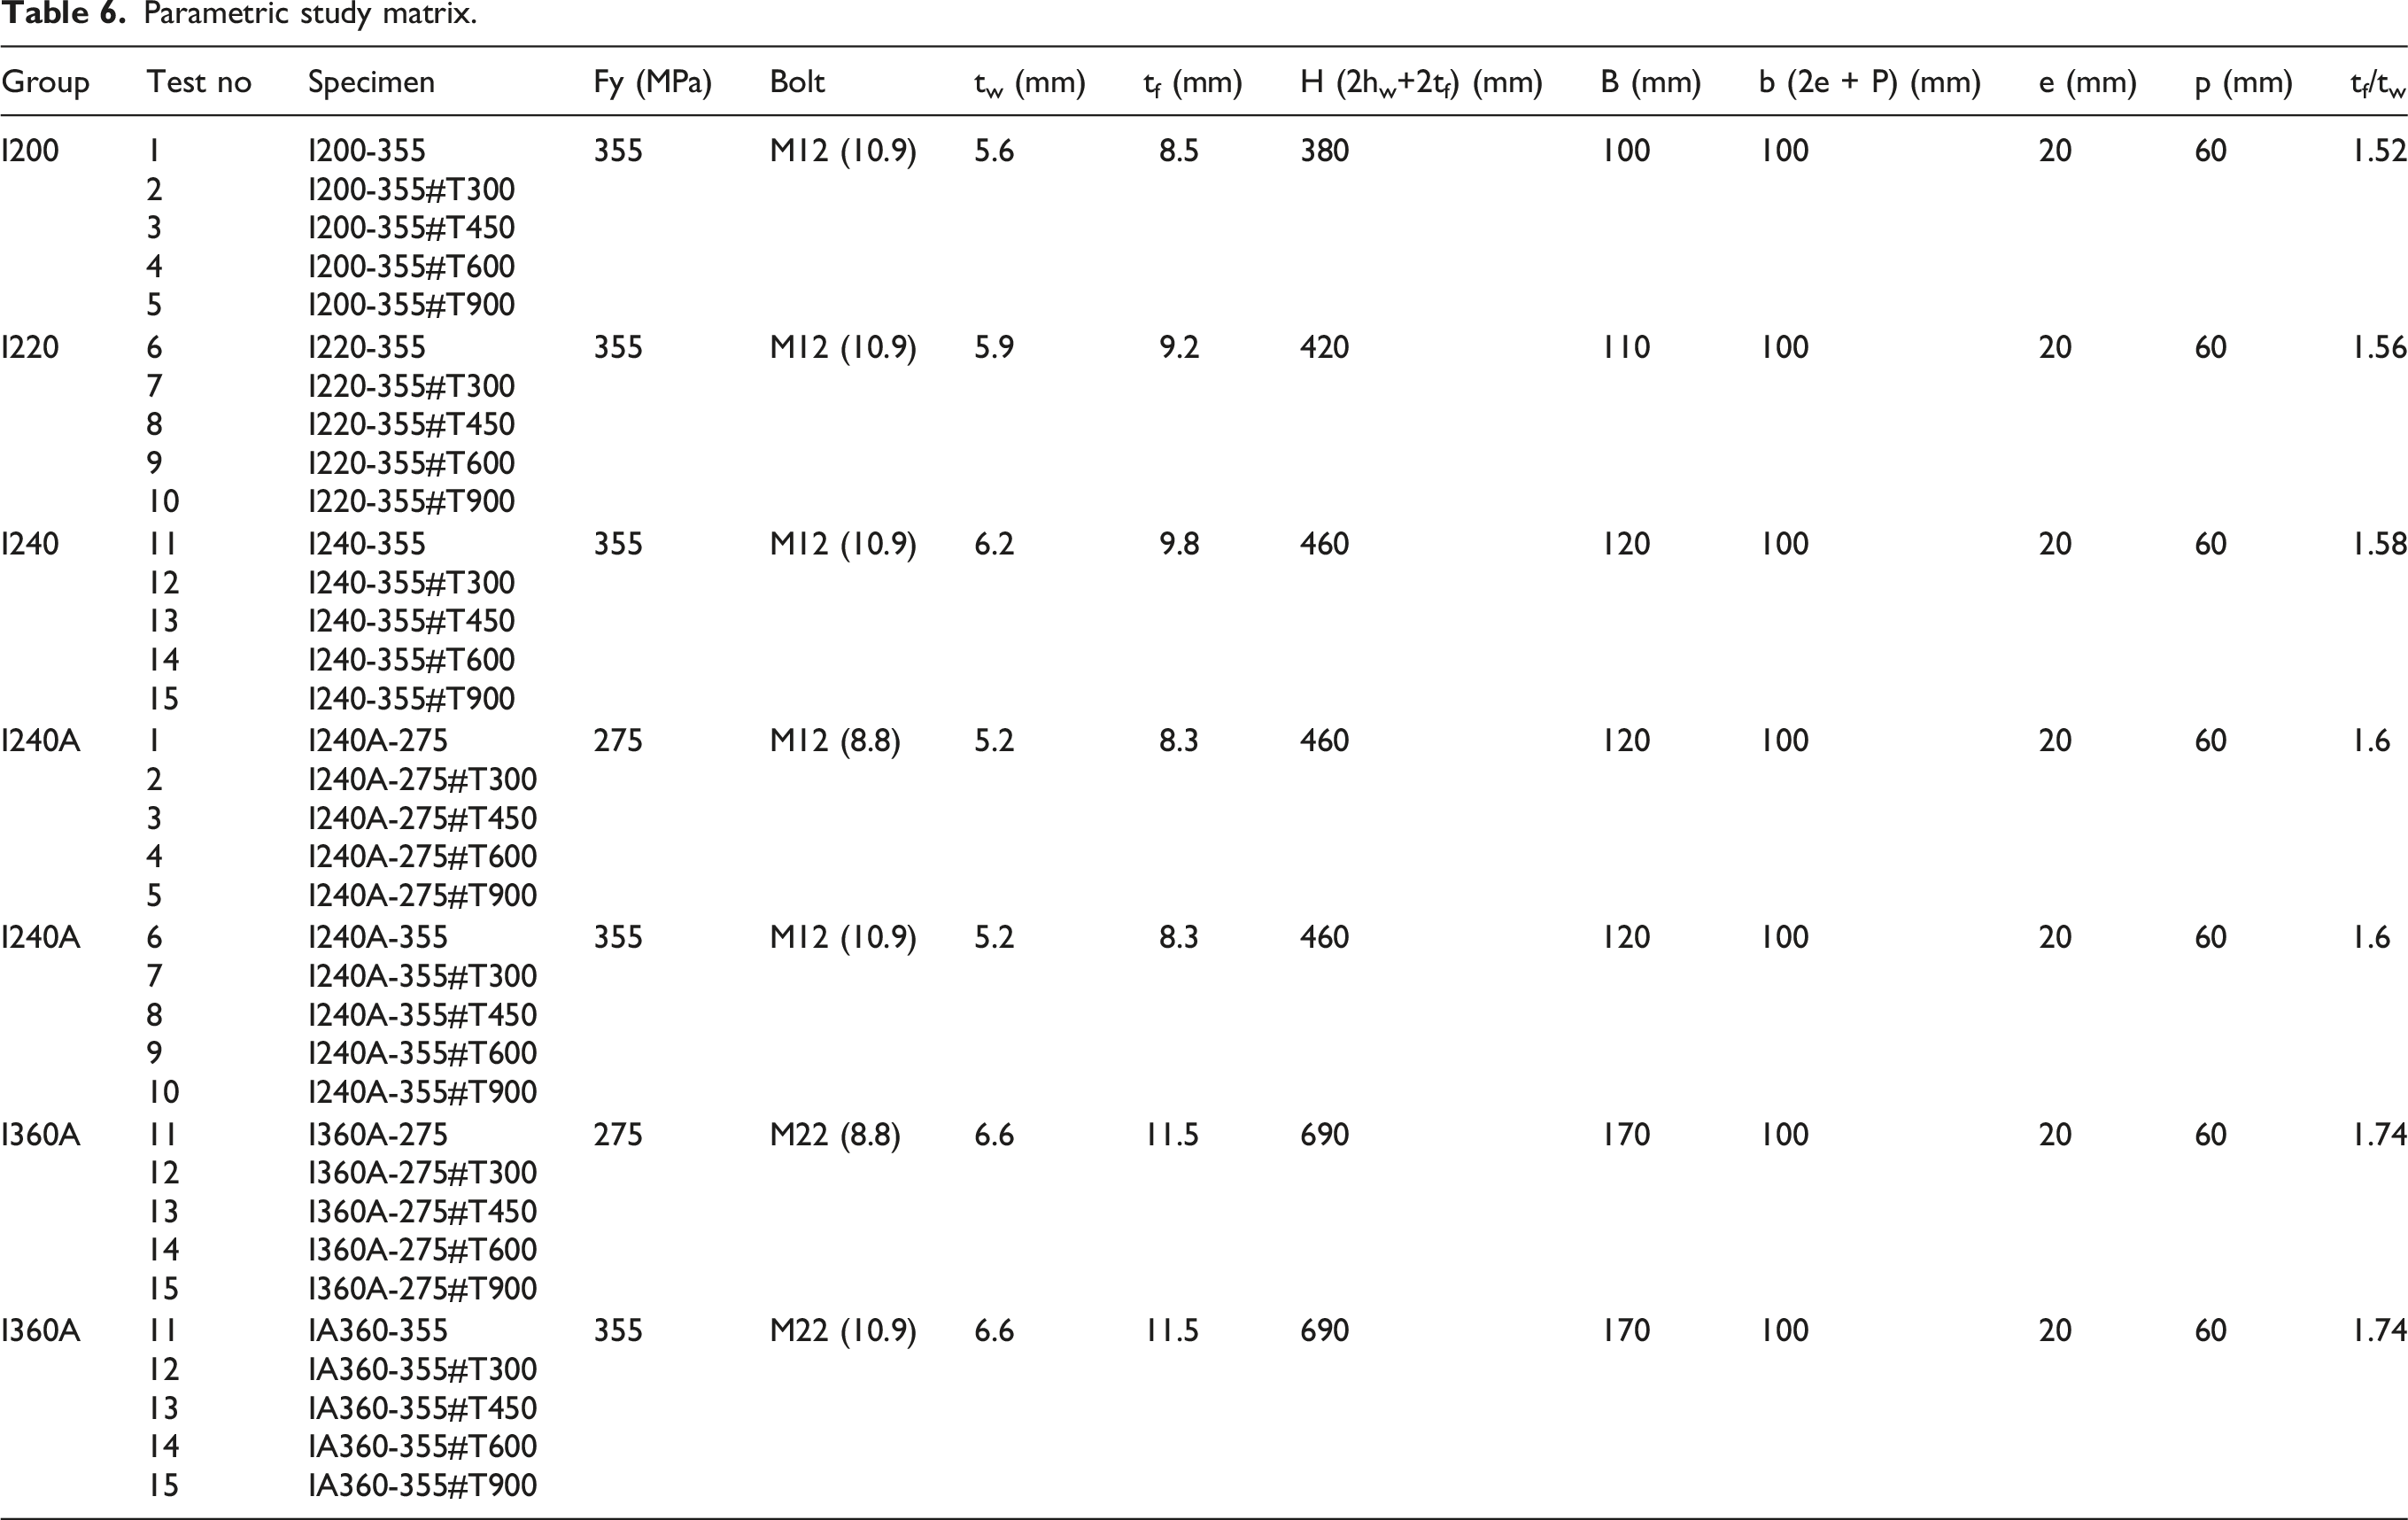
The quantitative evaluation of the parametric analysis results presented in Figure 17 and Table 7 reveals that the cross-section geometry, material strength, and temperature level are decisive factors in the mechanical behavior of T-Stub connections. Under reference-temperature conditions, the maximum load capacity increases significantly with cross-section size. For instance, while the maximum load capacity in the I200–S355 series is approximately 214 kN, this value increases to about 255 kN and 245 kN in the I220–S355 and I240–S355 sections, respectively. For the I360 A series, which has a larger cross-section geometry, the maximum load capacity is approximately 285–290 kN for S275 steel and 335–345 kN for S355 steel. These findings indicate that an increase in cross-sectional stiffness substantially enhances the load-carrying capacity of the connection. Load-Displacement curves for parametric studies. Mechanical performance metrics of the parametric study profiles.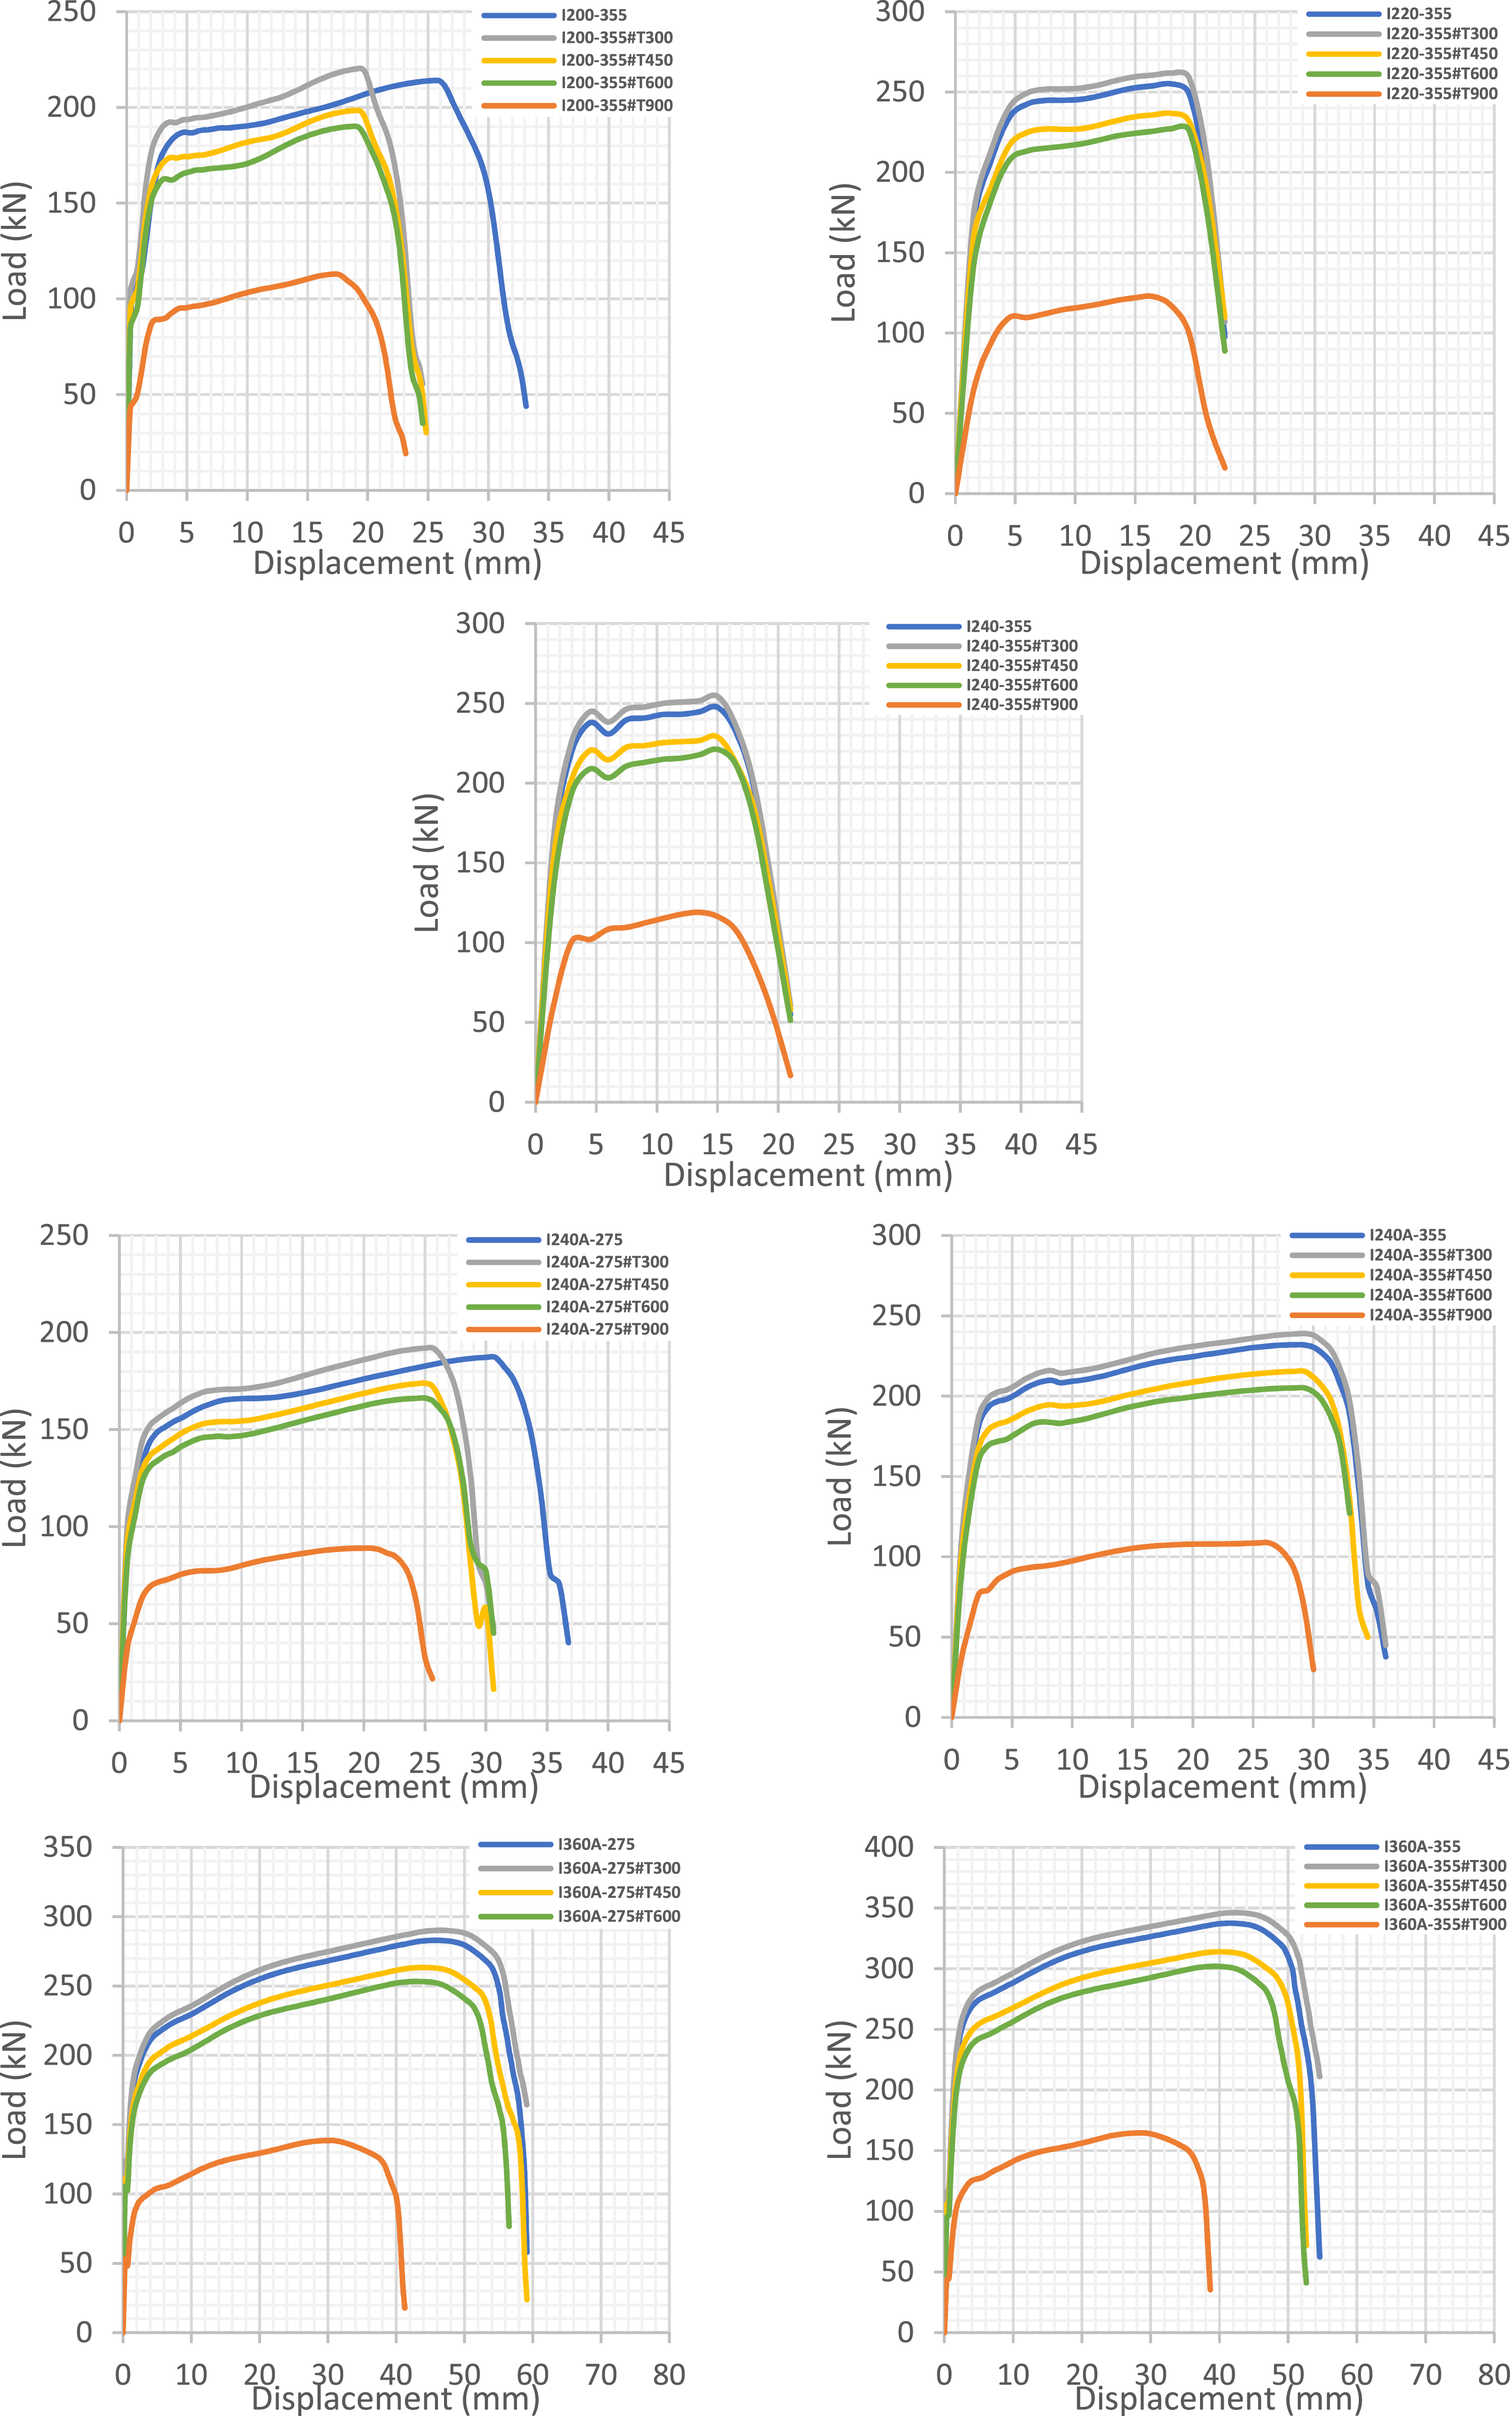
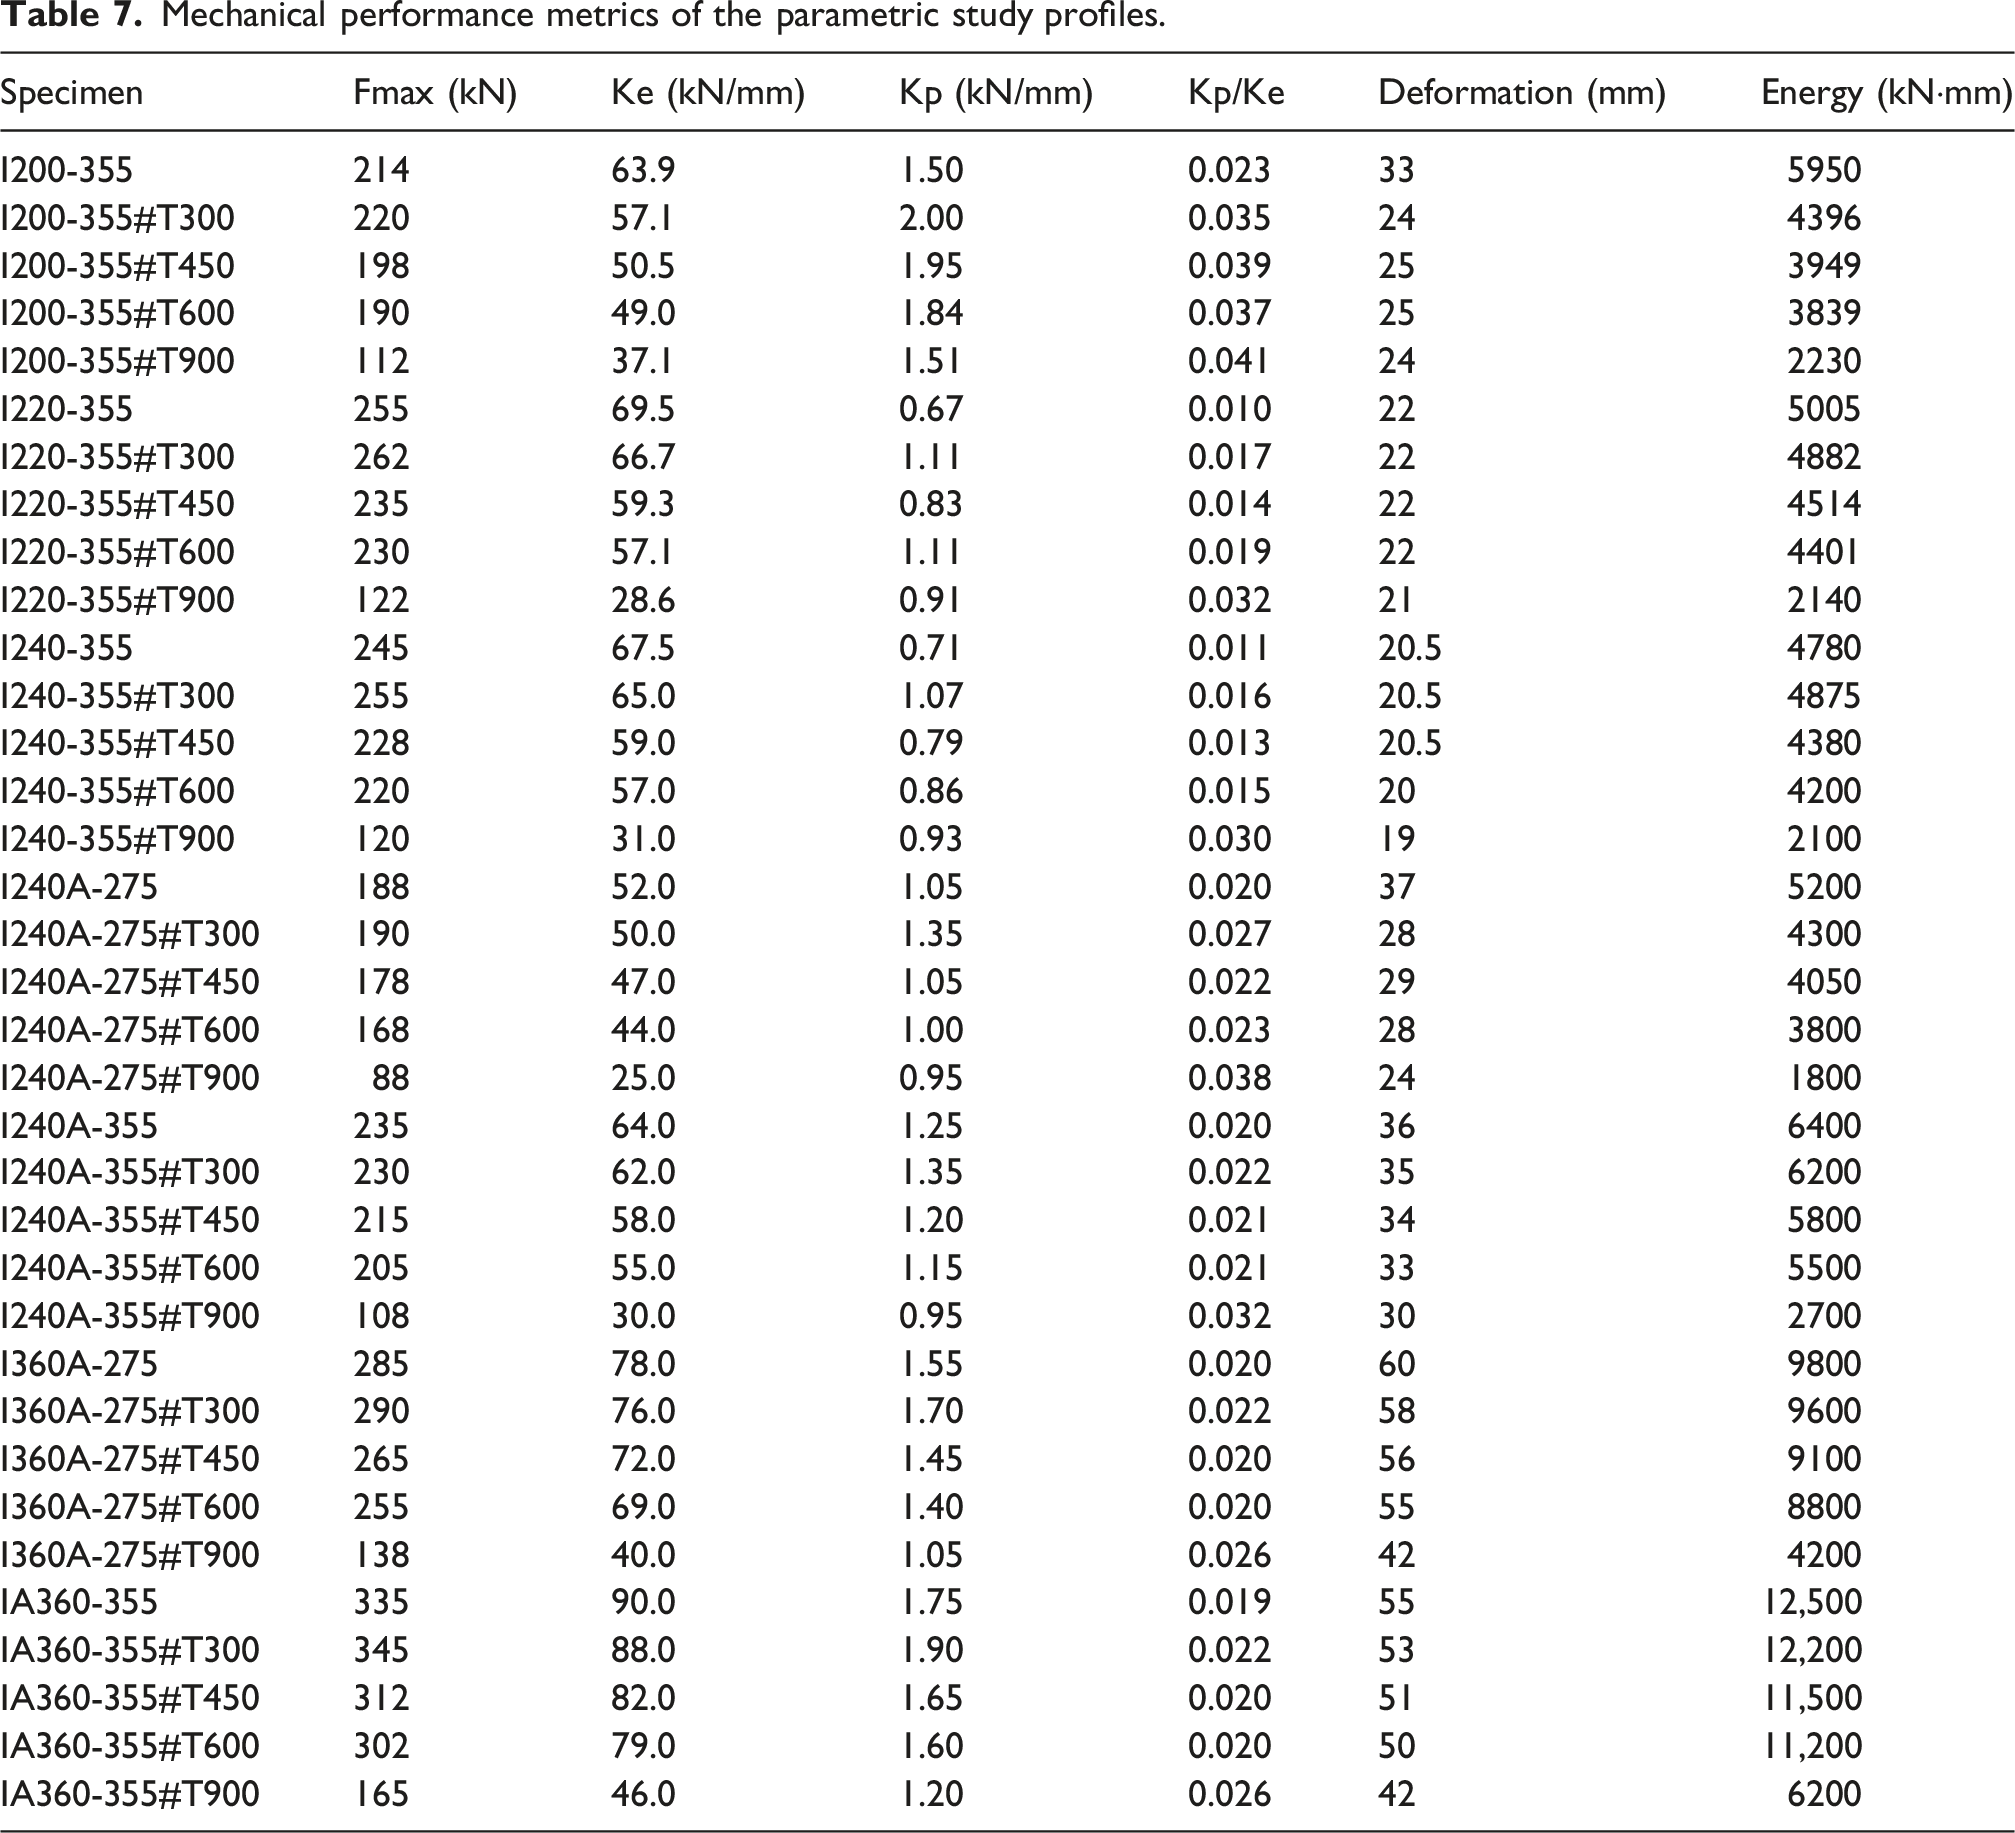
When evaluated by initial stiffness (Ke), a similar trend is observed. In the I200–S355 series, the initial stiffness is approximately 63.9 kN/mm, whereas this value increases to about 67.5 kN/mm in the I240–S355 series and reaches approximately 90 kN/mm in the I360A–S355 series. However, the initial stiffness decreases with increasing temperature. For instance, in the I360A–S355 series, the initial stiffness is about 90 kN/mm under reference conditions, decreasing to approximately 46 kN/mm at the T900 temperature level. This corresponds to a stiffness reduction of approximately 45–50%.
When temperature effects are examined, the general trend across all cross-section series indicates a reduction in load-carrying capacity at elevated temperatures. However, a modest increase in strength is observed at T300. For example, in the I200–S355 series, the maximum load capacity, which is approximately 214 kN under reference conditions, increases to about 220 kN at T300. Similarly, in the I220–S355 series, the maximum load capacity rises from approximately 255 kN to 262 kN, while in the I240–S355 series it increases from about 245 kN to 255 kN. A comparable trend is also observed in the I360A–S355 series, where the maximum load capacity increases from approximately 335 kN to 345 kN. This corresponds to a limited increase in strength of approximately 3–5%. The limited increase in strength observed at the T300 level may be associated with the steel’s material behavior at intermediate temperatures. At this temperature level, a significant reduction in the elastic modulus and yield strength of steel has not yet occurred. However, the material’s ductility and plastic deformation capacity may increase. This behavior allows for more effective redistribution of stresses within the connection components, resulting in a limited increase in the connection’s maximum load-carrying capacity. As the temperature increases to T450 and T600 levels, significant reductions in the yield strength and elastic modulus of steel occur. Consequently, a gradual decrease is observed in the maximum load capacity, initial stiffness, and energy dissipation capacity of the connections. The most pronounced capacity loss occurs at the T900 temperature level. For instance, in the I240–S355 series, the maximum load capacity decreases from approximately 245 kN under reference conditions to about 120 kN at T900. Similarly, in the I360A–S355 series, the maximum load capacity declines from approximately 335 kN to about 165 kN. These results indicate that a capacity reduction of approximately 45–50% occurs at elevated temperature levels.
When evaluated in terms of energy dissipation capacity, the connections’ energy absorption capability increases significantly with increasing cross-section size. For instance, while the energy dissipation capacity in the I200–S355 series is approximately 5950 kNmm, this value reaches about 12,500 kNmm in the I360A–S355 series. However, a notable reduction in energy dissipation capacity is also observed at elevated temperature levels. In the I360A–S355 series, the energy capacity, approximately 12,500 kNmm under reference conditions, decreases to about 6200 kNmm at the T900 temperature level.
It is observed that increasing the cross-section geometry and material strength enhances both the load-carrying capacity and stiffness of the connection, whereas increasing temperature, particularly at elevated levels, significantly weakens the connection behavior. In particular, at the T900 temperature level, the maximum load capacity and energy dissipation capacity decrease by approximately 45–50%, whereas a limited strength increase of approximately 3–5% is observed at the T300 temperature level. These findings clearly indicate that changes in temperature-dependent material properties and connection geometry must be considered together when evaluating the post-fire performance of structural connections.
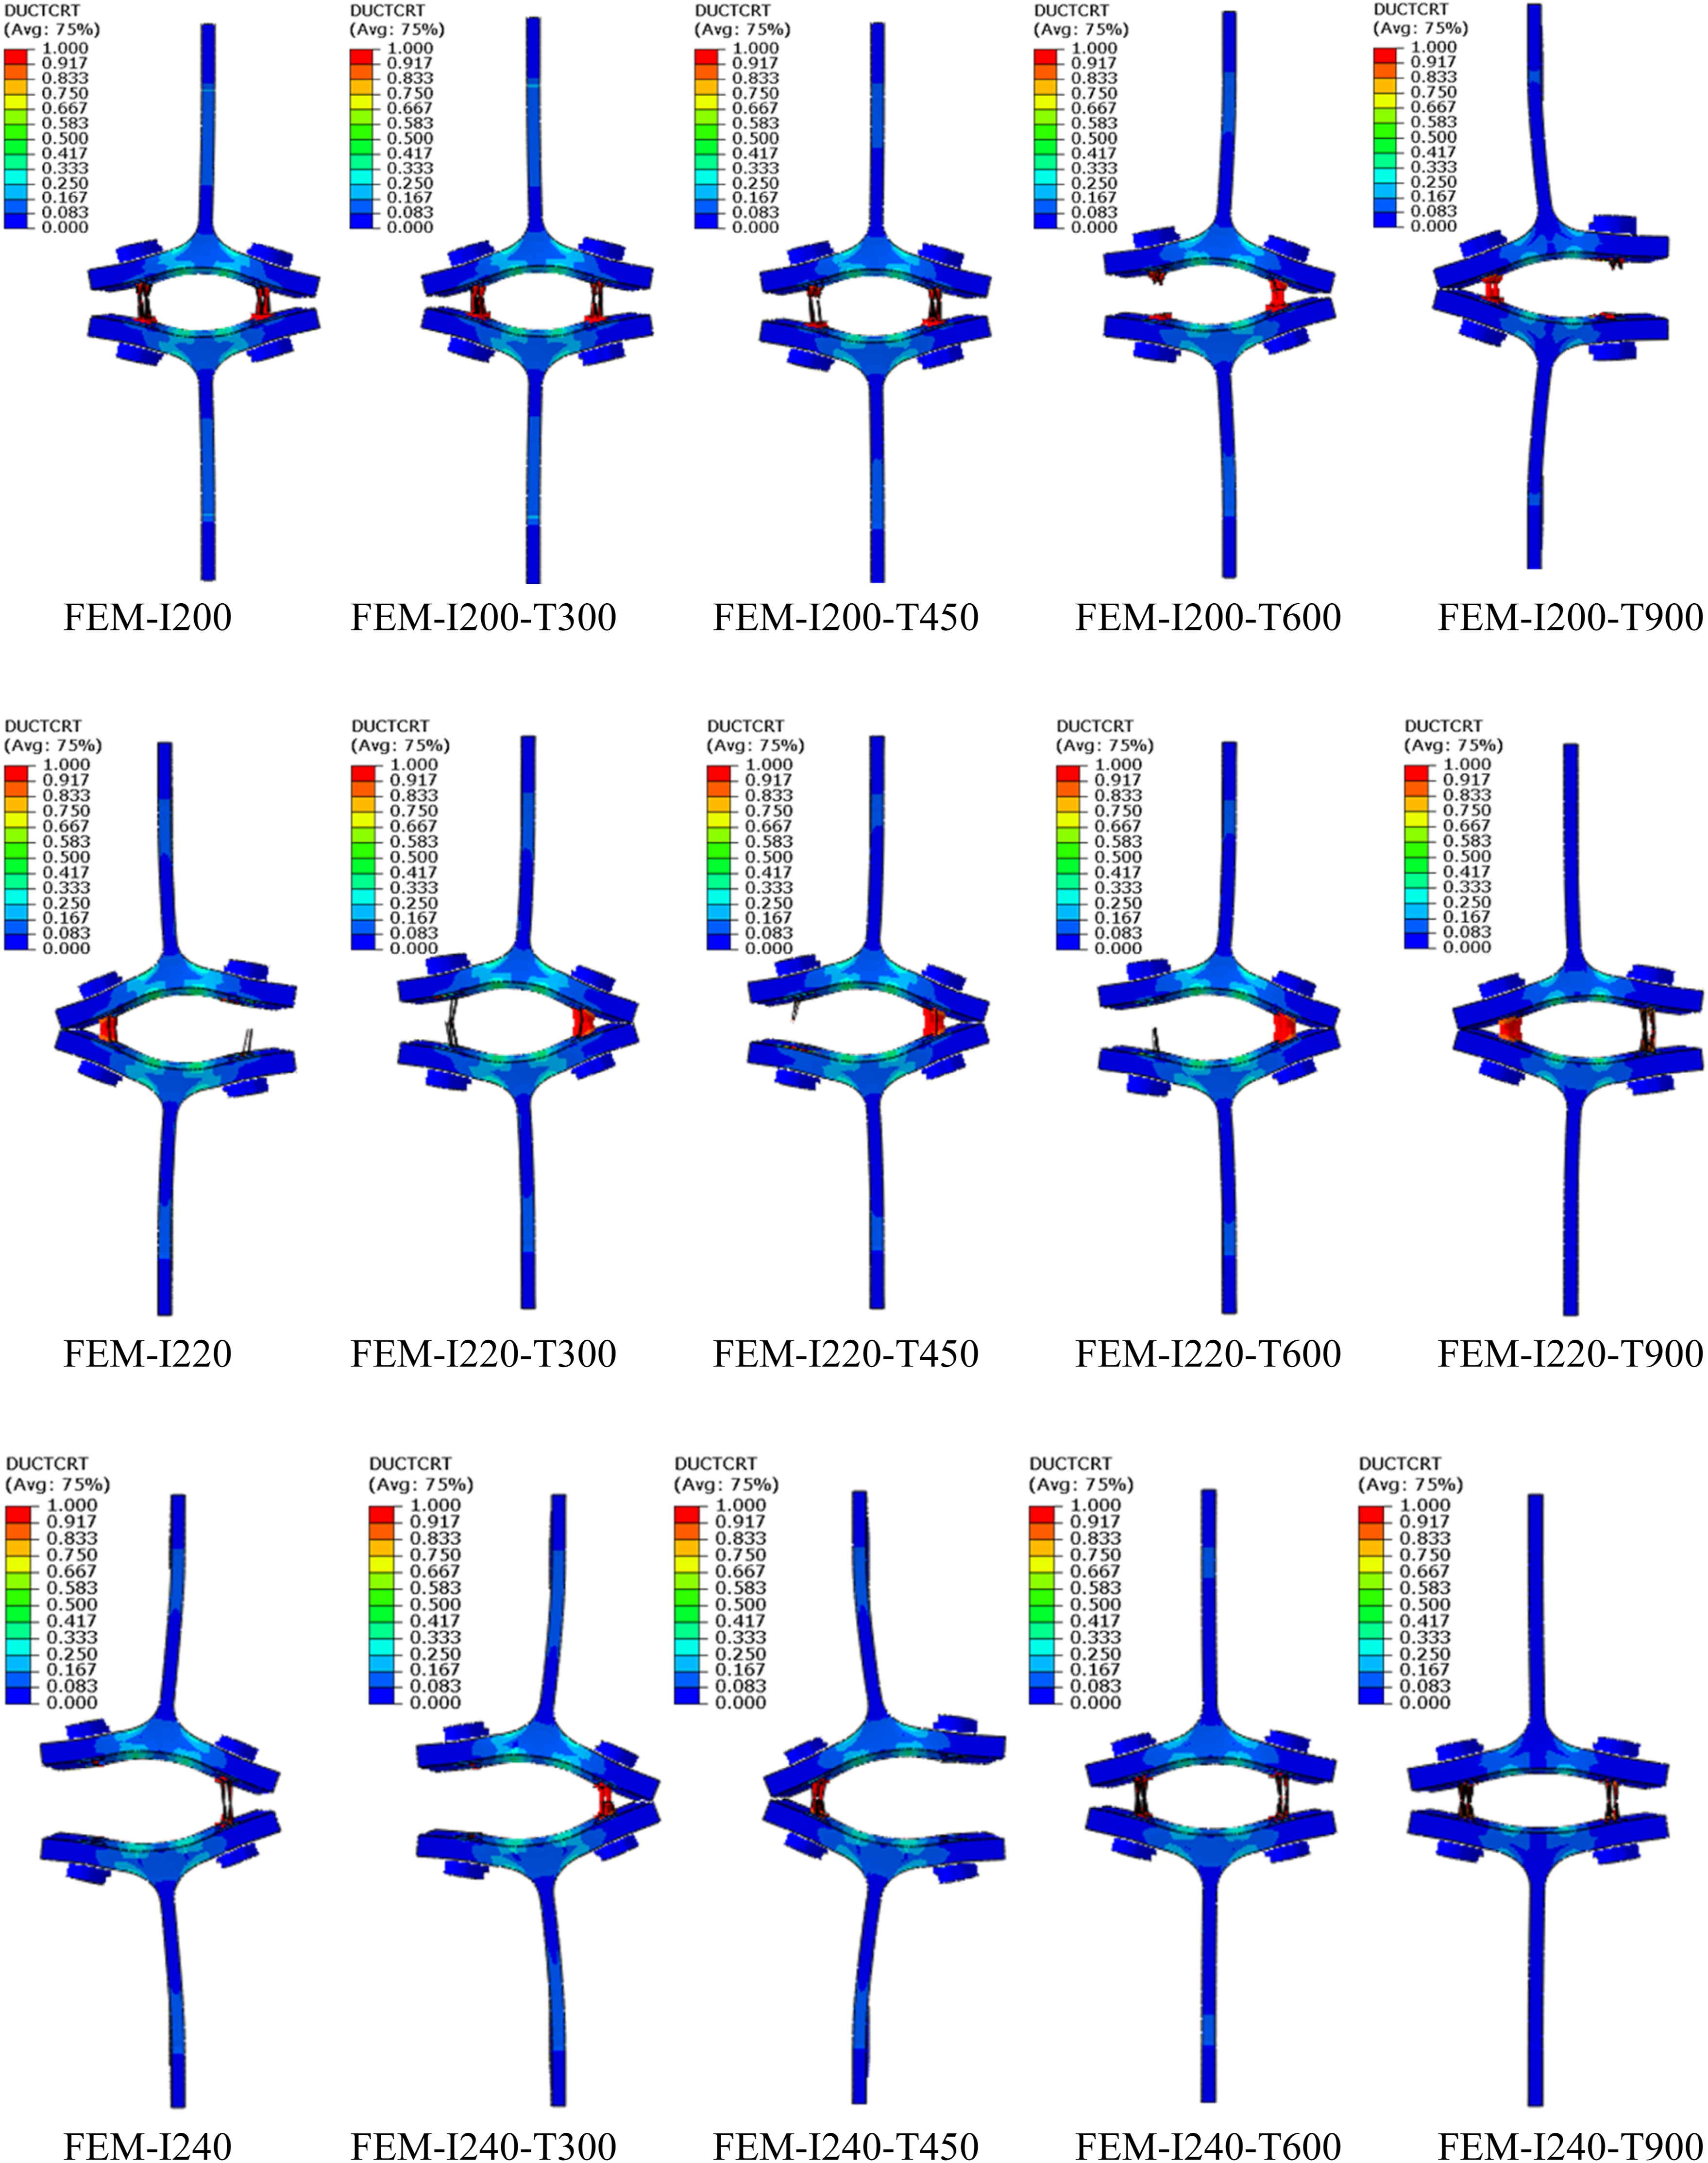
The DUCTCRT (ductile damage criterion) parameter is a damage indicator used in finite element analyses to represent the tendency to initiate ductile damage and the level of plastic deformation in the material. This parameter is calculated from the equivalent plastic strain and the stress state and is generally expressed as a value between 0 and 1. A DUCTCRT value close to 0 indicates that the element is far from satisfying the ductile damage criterion, whereas values approaching 1 indicate that the initiation of ductile damage in the material is imminent.
In T-Stub connections, the distribution of DUCTCRT typically concentrates along the bolt line, within the tension region of the flange, and at the flange–web intersection. This parameter is therefore used to evaluate where plastic deformation develops within the connection and whether the damage remains localized or spreads over a wider region.
When the results of the parametric analyses are examined (Figure 18), it can be observed that the distribution of ductile damage in T-Stub connections is directly influenced by variations in the tf/tw ratio. In the I200–355–M12–10.9 (tf/tw = 1.52) specimen, the DUCTCRT values are mainly localized along the bolt line and within the tensile region of the flange. In contrast, in the I220–355–M12–10.9 (tf/tw = 1.56) specimen, as the tf/tw ratio increases, the damage distribution begins to extend towards the web region. Similarly, in the I240–355–M12–10.9 (tf/tw = 1.58) specimen, the damage remains predominantly confined to the connection region, whereas in the I240A–355–M12–10.9 (tf/tw = 1.60) specimen, the DUCTCRT distribution becomes more widespread around the flange and along the web. A comparable trend is also observed in the I240A–275–M12–8.8 (tf/tw = 1.60) and I240A–355–M12–8.8 (tf/tw = 1.60) specimens, where the damage distribution tends to propagate from the connection region toward the web. At higher ratios, in the I360A–275–M22–8.8 (tf/tw = 1.74) and I360A–355–M22–10.9 (tf/tw = 1.74) specimens, the DUCTCRT values increase significantly, particularly in the web and in the tensile region beneath the flange, indicating that the damage spreads over a larger portion of the cross-section. Overall, this trend indicates that as the tf/tw ratio increases, the flange stiffness increases, altering the load transfer mechanism. Consequently, plastic deformation develops not only within the flange region but also along the web, leading to a more distributed ductile damage pattern within the connection. Ductile Damage Criterion (DUCTCRT) of the parametric study profiles.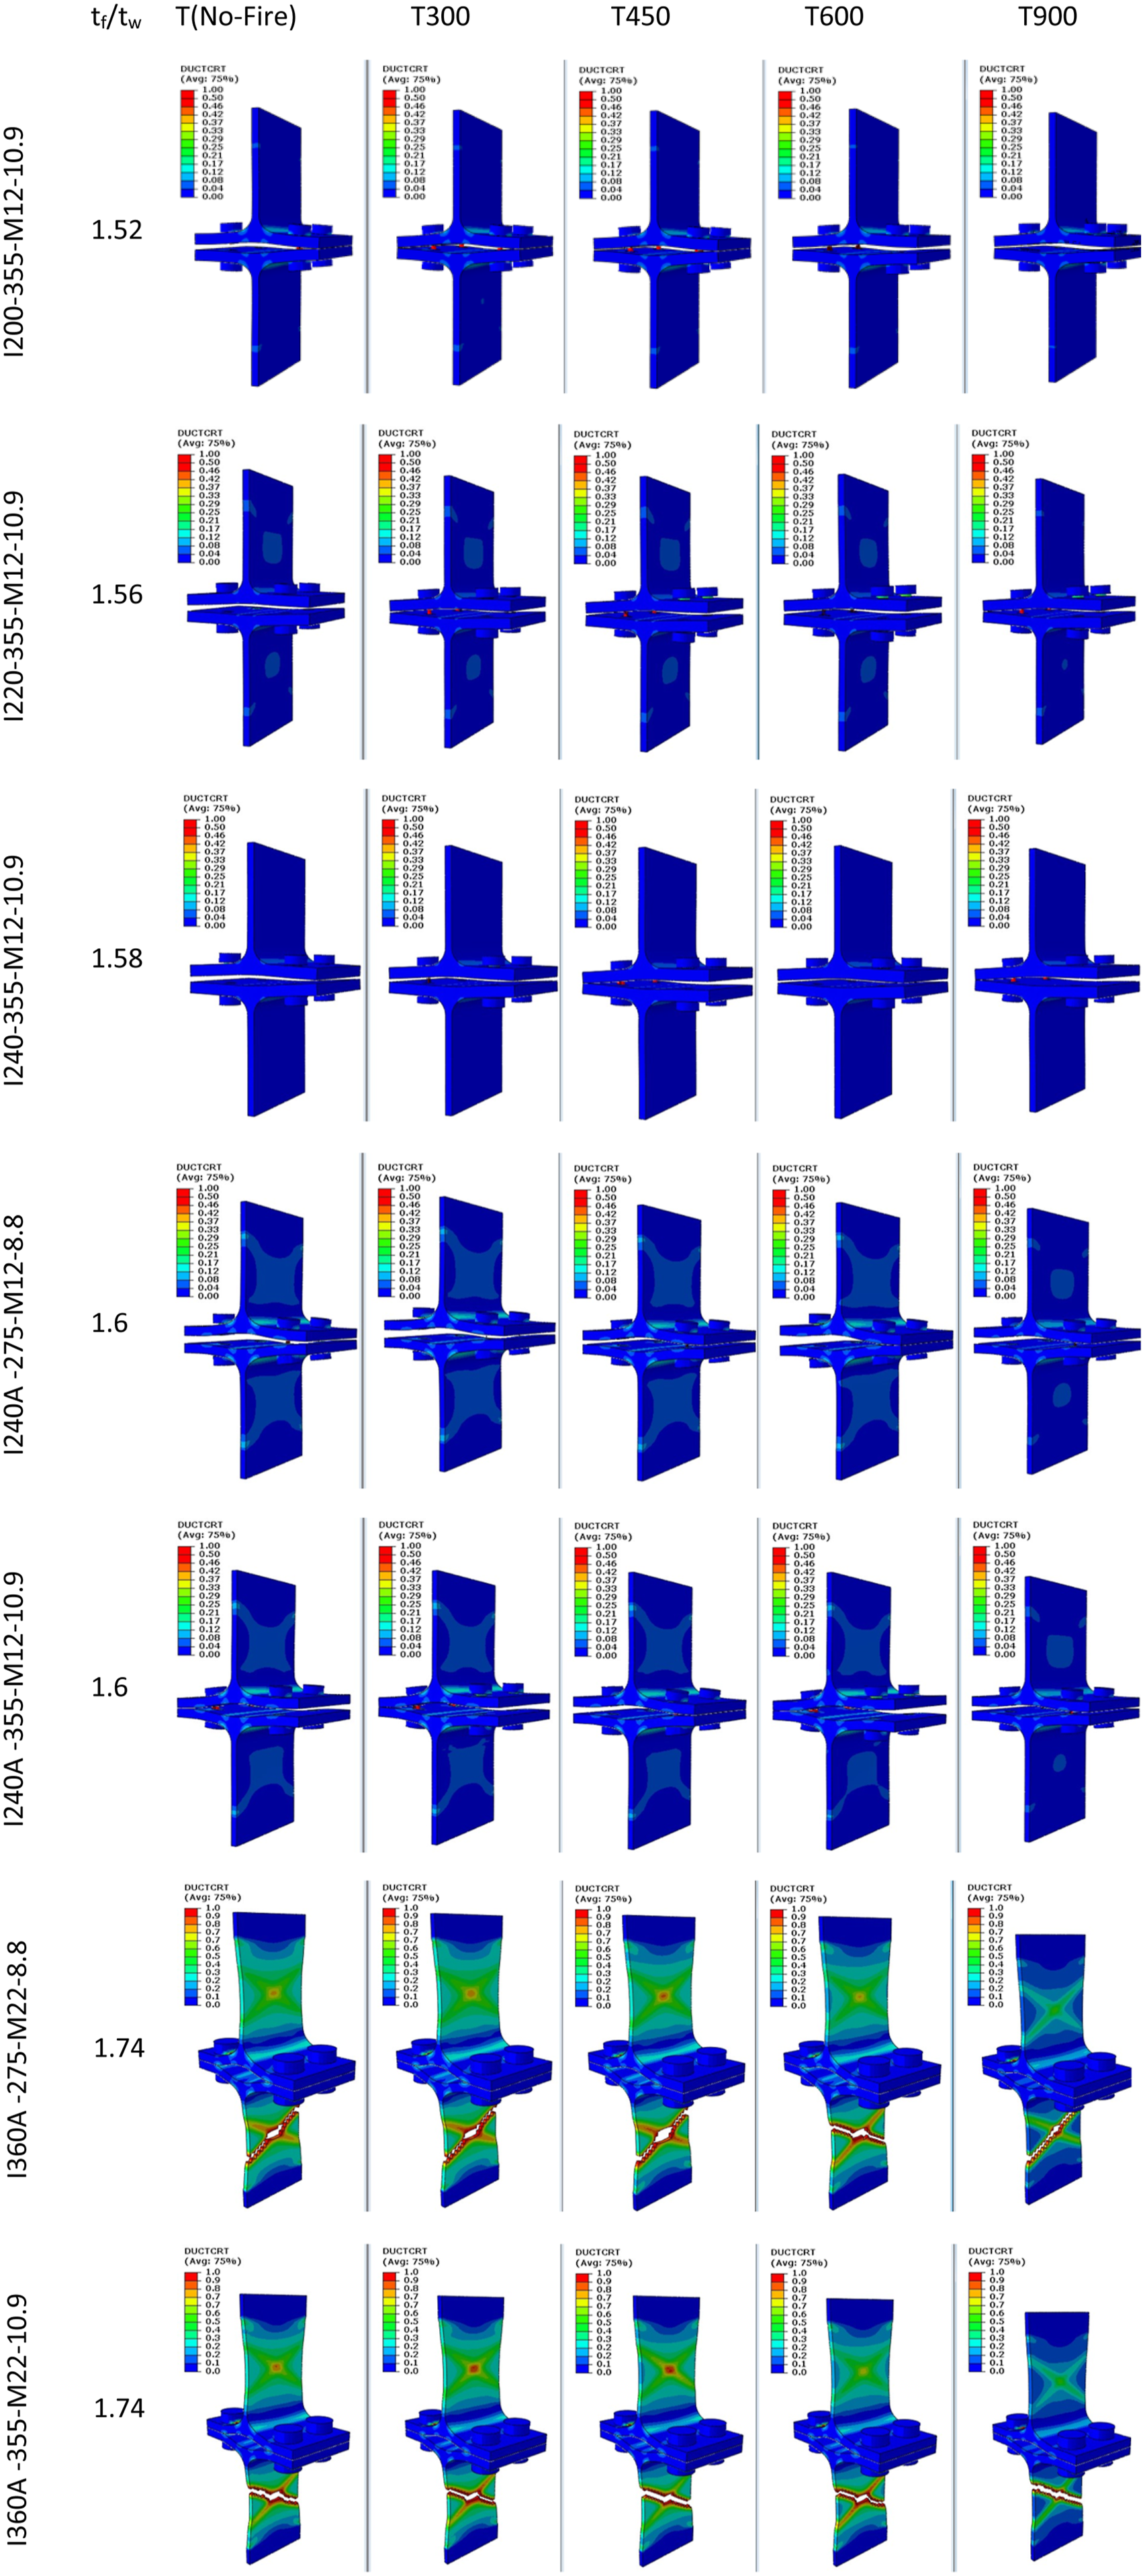
When the variation in tf/tw ratios is evaluated with respect to temperature, it is observed that, across all models, DUCTCRT values increase slightly as temperature rises to T900, mainly due to reduced material strength at elevated temperatures. At lower temperature levels (No Fire–T300), the damage parameter generally remains localized along the bolt line and within the tensile region of the flange. At moderate temperatures (T450–T600), the damage distribution within the connection region becomes somewhat more pronounced, and in some models it tends to propagate toward the web. At high temperatures (T900), although DUCTCRT values increase, damage in most models does not reach critical levels, and the connection behavior remains largely limited to localized plastic deformation. This indicates that, despite the degradation of material properties at elevated temperatures, the connection largely retains its ductile behavior.
When the variation in tf/tw ratios is evaluated by steel grade, particularly for the I240 A and I360 A profiles, it is evident that material strength has a pronounced influence on connection behavior. Although the geometry remains unchanged, in the I240A–S275 model, plastic deformation initiates earlier due to the lower yield strength, and the DUCTCRT distribution spreads over a wider region, extending from the flange–bolt interaction zone toward the surrounding areas. In contrast, in the I240A–S355 model, the higher yield strength results in more limited damage development, and the DUCTCRT values remain mostly localized within the connection region. A similar trend is also observed in the I360 A profiles. In the I360A–S275 model, higher DUCTCRT values are distributed over larger regions, particularly along the web and in the tensile zone beneath the flange, whereas in the I360A–S355 model, the damage distribution remains more confined. Overall, these observations indicate that the higher yield strength of S355 steel impedes the propagation of plastic deformation, leading to ductile damage in more localized regions. In contrast, in S275 steel, the earlier onset of plasticity leads to damage spreading over a larger portion of the cross-section.
When Figure 19 is examined, it can be observed that in the I200–355–M12–10.9 and I220–355–M12–10.9 models, the increase in the tf/tw ratio from 1.52 to 1.56 does not significantly alter the critical region where stresses develop. However, particularly at intermediate temperatures, it causes the peak von Mises stresses in the connection region to become more localized. In the comparison of the I240–355–M12–10.9 and I240A–355–M12–10.9 models, the increase in the tf/tw ratio from 1.58 to 1.60 results in a slight reduction in the maximum von Mises stresses at most temperature levels. Nevertheless, especially around T600, an increase in stress concentration around the bolts and in the flange-root region can be observed. Von Mises stresses of the parametric study profiles.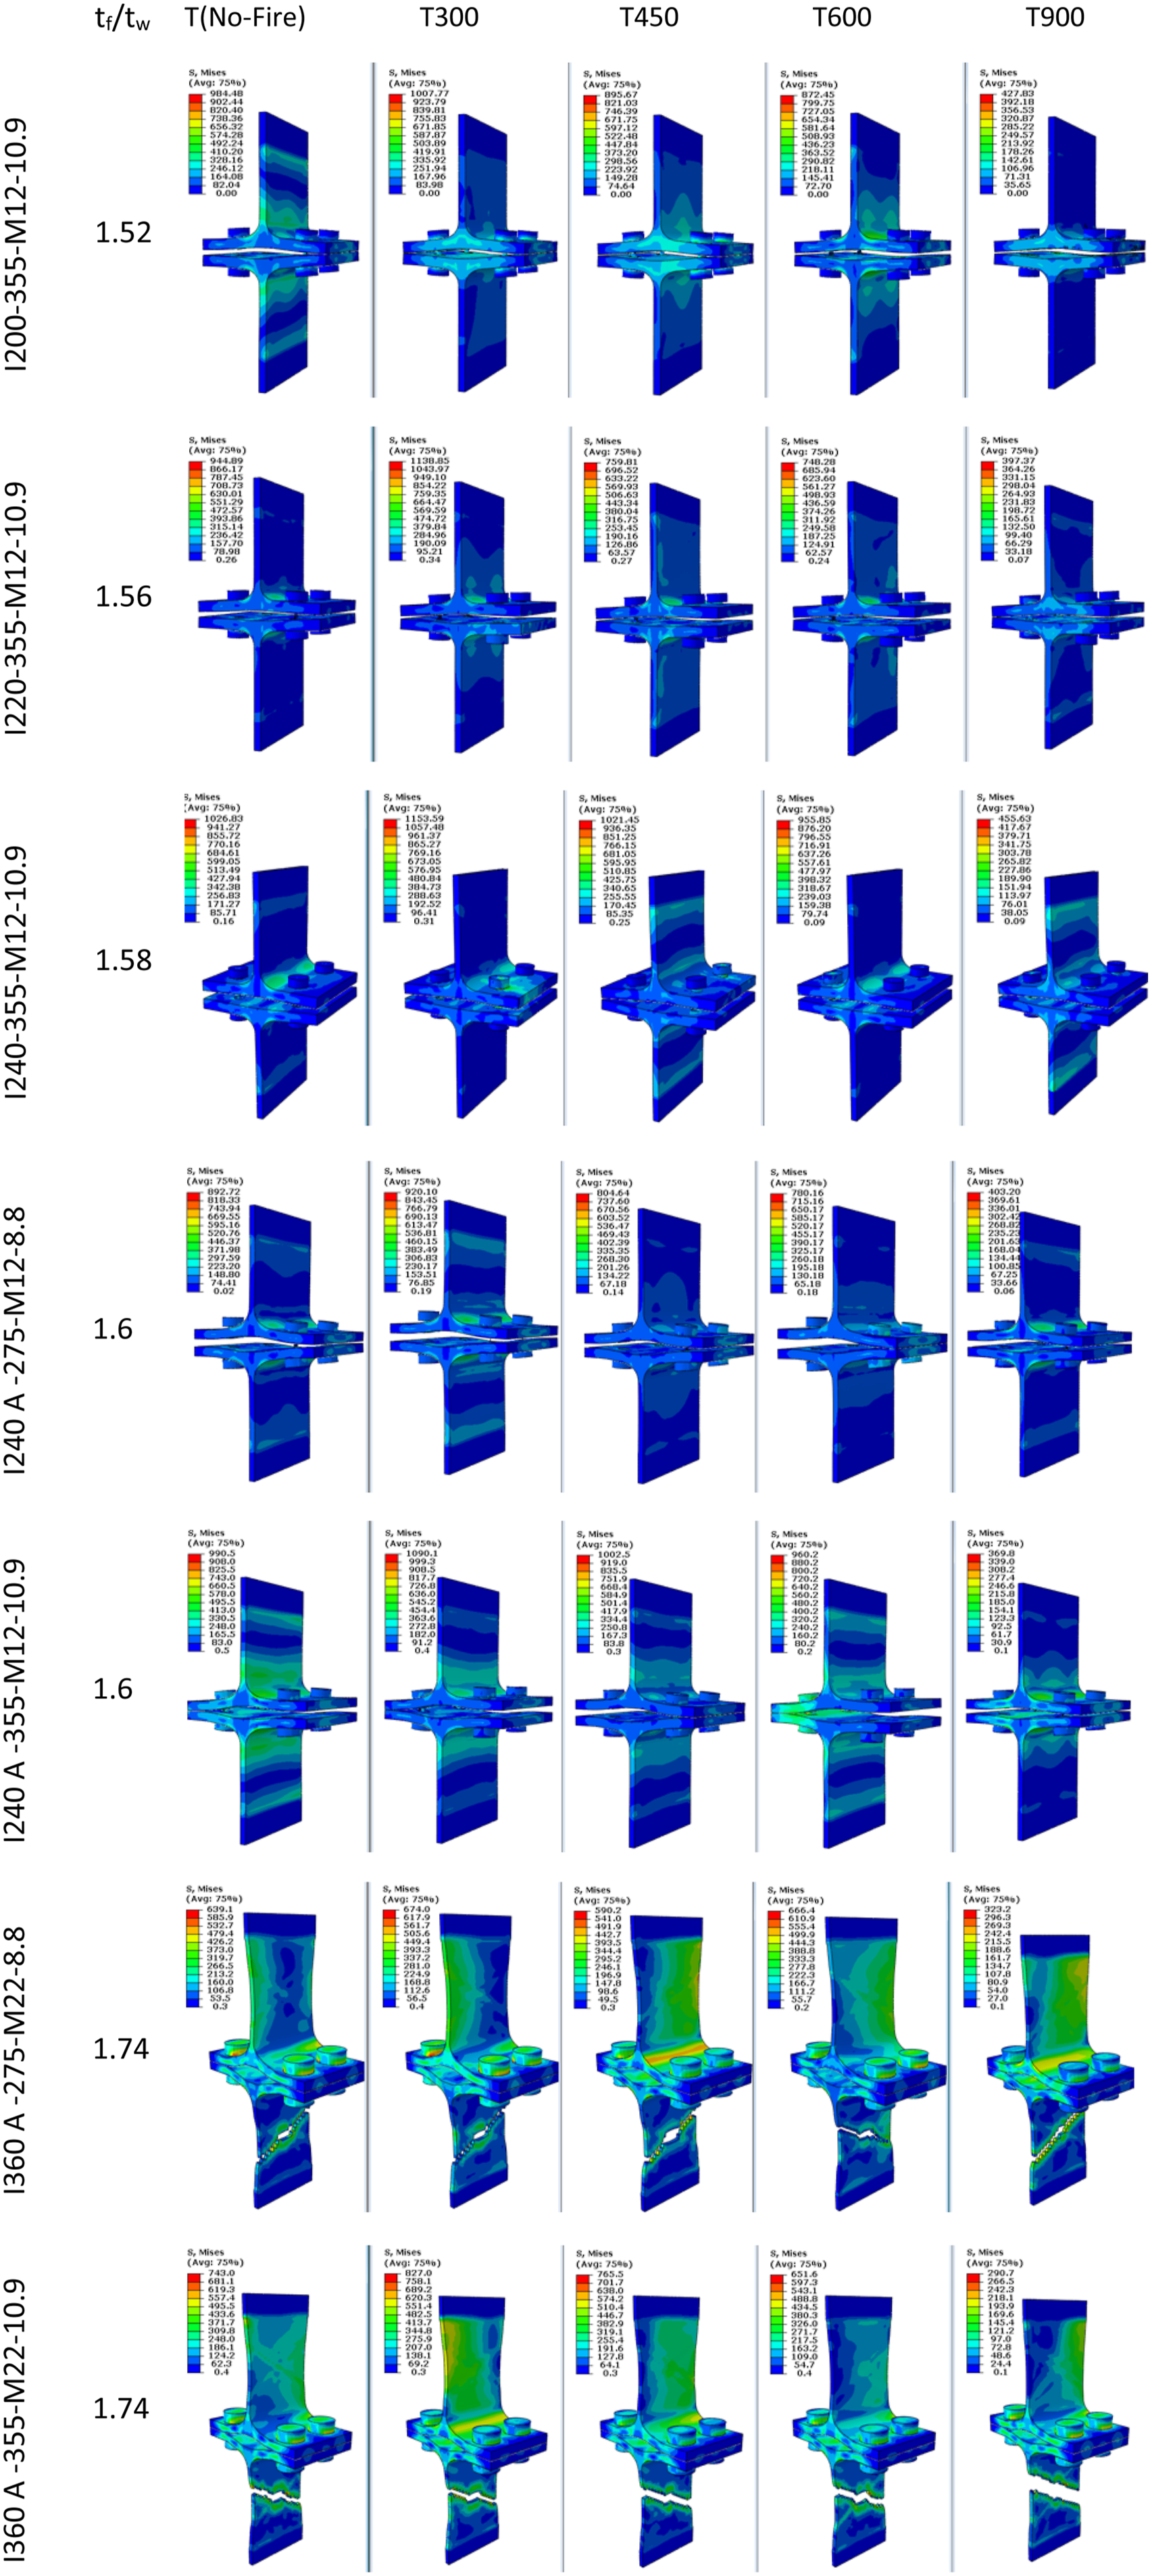
In contrast, for the I240A–275–M12–8.8 and I360A–275–M22–8.8 models, the increase in the tf/tw ratio from 1.60 to 1.74 generally leads to a reduction in the peak von Mises stresses, although the stress distribution tends to concentrate in the web–root region in the form of a more localized yielding line. A similar trend is also observed when comparing the I240A–355–M12–10.9 and I360A–355–M22–10.9 models. In this case, the increase in the tf/tw ratio from 1.60 to 1.74 reduces the maximum von Mises stresses at all temperature levels, while transforming the stress distribution from a more diffuse pattern within the connection region to a more pronounced, localized stress band along the web. These results indicate that an increase in the tf/tw ratio not only affects the maximum stress level but also alters the stress transfer mechanism within the connection and the localization of plastic deformation.
When the von Mises stress distributions of the I360A–275–M22–8.8 and I360A–355–M22–10.9 specimens are examined, it can be observed that significant stress concentrations develop particularly in the tensile region beneath the flange and at the web–flange intersection. At certain temperature levels, a tear-like stress band extending along the element is also observed. This behavior can be attributed to the transfer of load from the bolts to the flange and to the relatively high tf/tw ratio (1.74), which shifts part of the load transfer mechanism toward the web.
Conclusion
T-Stubs are used in steel structures to bolt structural members together, and welding plates are used to create them. These connection zone elements, widely used in practice, have been the main focus of the study. Unlike the literature and Eurocode 3, T-Stub connection experiments using IPE standard profiles were investigated through experimental and FEM analyses. Thus, problems such as possible breakage points and low strength in T-Stub connections are overcome. On the other hand, this study was conducted to better understand the behavior of these elements and to ensure the widespread use of weldless T-Stub connections in practice. • As the cross-sectional area of the specimens not exposed to fire increases, the maximum load also increases. At temperatures up to 300°C, the maximum load increases slightly by 1–3%. However, as the temperature increases from 300°C to 900°C, the maximum load decreases significantly for all profiles. The greatest reduction occurs at 900°C, where the maximum load drops by 51%-74% compared to the reference specimens. • As the cross-sectional area of specimens not exposed to fire increases, the energy dissipation capacity rises by 4–14%. Similarly, specimens exposed to temperatures up to 300°C show an increase. However, as the temperature increases from 300°C to 900°C (with minor fluctuations at intermediate levels), the energy dissipation decreases, with reductions of 32% to 63% at 900°C compared to the reference specimen.
When the Kp/Ke ratio is evaluated under temperature effects, it increases for IPE 220–200 and IPE 240–200 specimens at 300, 450, 600, and 900°C. However, for IPE 240–220 specimens, the ratio decreases at 600 and 900°C. This indicates that above about 600°C, temperature becomes more influential than cross-sectional area in governing plastic deformation capacity.
Experiments and finite-element analyses show consistent results regarding the effects of the tf/tw ratio and temperature. Increasing the tf/tw ratio proportionally increases the maximum load capacity. At 300°C, Fmax is higher than the reference, indicating hardening after heating and cooling. Although resistance decreases up to 600°C, the reduction remains below 6.5%, preserving about 93% of the connection strength. At 900°C, connections lose approximately 40% of their strength. Compared with deformation capacity, T-Stub connections exposed to 300°C exhibit high energy dissipation. T-Stub connections exposed to 300°C exhibit good strength and behavior. • Axial tensile tests allow identification of elastic and plastic behavior of T-stub connections from load–displacement responses. Increasing temperature due to fire reduces the initial stiffness (Ke) and increases the post-limit stiffness (Kp). While 300°C is critical for Ke, 600°C is critical for Kp. Lower tf/tw ratios lead to more ductile behavior at low temperatures, whereas higher ratios increase load capacity. However, above 600°C, all sections exhibit highly ductile behavior. • The growth of the tf/tw ratio reduces the initial stiffness. This is due to the use of bolts of the same diameter in all connections. As tf/tw ratio increases, the stiffening cap area is forced to carry more load, and the weak bolts in the connection fail prematurely.
The results of the parametric analyses indicate that the mechanical behavior of T-Stub connections is primarily governed by cross-section geometry, material strength, and temperature. Increasing the cross-section size significantly improves the load-carrying capacity, initial stiffness, and energy dissipation capacity of the connection. These results demonstrate that higher cross-sectional stiffness enhances load transfer between the flange, web, and bolts. • Connection performance is significantly affected by temperature. A slight increase in strength is observed around 300°C, due to enhanced plasticity and stress redistribution. However, at higher temperatures, notable degradation is observed, with substantial reductions in load capacity and stiffness. • Analyses show that changes in the tf/tw ratio affect stress transfer and ductile damage distribution. As the ratio increases, flange stiffness increases, and more load is transferred to the web, leading to a wider distribution of damage and localized stress bands at the web–flange junction. • Steel grade influences plastic deformation in the connection. Higher-strength steel (S355) limits deformation and localizes damage, while lower-strength steel (S275) allows it to spread over a wider area. Overall, post-fire behavior of T-stub connections depends on the combined effects of geometry, temperature-dependent material properties, and flange–web–bolt interaction. • Parametric results show that increasing the tf/tw ratio alters ductile damage distribution in T-stub connections. With higher tf/tw ratios, damage spreads from the bolt–flange zone toward the web. Von Mises stress analysis indicates tear-like stress concentrations along the web, especially in I360 A-275-M22-8.8 and I360 A-355-M22-10.9 specimens. Moreover, rising temperatures reduce material strength, leading to partial increases in DUCTCRT values.
Recommendations
In future studies, it is recommended to investigate a wider range of flange-to-web thickness ratios (tf/tw) by utilizing custom-fabricated or alternative profile sections to better understand this parameter’s influence on the post-fire behavior of bolted T-Stub connections. Also, toughness tests (e.g., Charpy impact tests) should be included to provide a more comprehensive evaluation of material behavior at elevated temperatures.
Footnotes

Funding
The authors received no financial support for the research, authorship, and/or publication of this article.
Declaration of conflicting interests
The authors declare that there is no conflict of interest. They have no known competing financial interests or personal relationships that could have appeared to influence the work reported in this paper.
Data Availability Statement
The data supporting this study’s findings are available on request from the corresponding author.