



Abstract
Background
Alzheimer's disease (AD) is a neurodegenerative disorder that is associated with neuroinflammation. Neutrophil extracellular traps (NETs) are web-like structures that cause inflammation, but its involvement in AD pathogenesis is unclear.
Objective
This study aimed to identify key NETs related genes associated with AD.
Methods
A total of 180 samples from the GSE122063 and GSE36980 dataset were obtained from the GEO repository. The representative genes were obtained, and its diagnostic performance was evaluated by analyzing operating characteristic curves. Consensus clustering and principal component analysis were performed to cluster AD samples. Gene ontology, KEGG pathway enrichment, and protein interaction network were analyzed. Peripheral blood samples were collected from 5 AD patients and 5 healthy donors to determine the expression of representative proteins or genes using WB, ELISA, and RT-qPCR.
Results
A total of 297 differentially expressed genes (DEGs) were associated with AD, 18 NETs genes showed potential diagnostic value. NETs genes expression effectively distinguished AD patients into 2 subgroups. The AD1 cluster showed higher abundance of activated dendritic cells, monocytes, and neutrophils, the AD2 cluster showed higher levels of naive B cells, eosinophils, and activated NK cells. We randomly selected and measured the levels representative genes in AD patients. The levels of NETs and CCL2, TLR2 expressions were significantly increased, whereas the level of BDNF was significantly decreased in AD patients comparing with healthy controls.
Conclusions
This study identified key NET genes including BDNF, CCL2, and TLR2 to be associated with AD pathogenesis and classification.
Introduction
Alzheimer's disease (AD) is a neurodegenerative disorder that is characterized by the accumulation of amyloid-β (Aβ) plaques and neurofibrillary tangles in the brain, leading to cognitive decline and memory loss.1,2 AD poses a significant public health challenge, with an estimated 6.7 million Americans aged 65 and older currently affected, projected to rise to 13.8 million by 2060. AD was the sixth-leading cause of death in 2019, and remains the fifth-leading cause among older Americans. Unpaid caregivers provided an estimated 18 billion hours of care in 2022, valued at $339.5 billion. With a growing demand for dementia care workers, there's a pressing need for programs to attract and train healthcare professionals. Medicare and Medicaid payments for AD-related services are significantly higher than for those without the condition, totaling an estimated $345 billion in 2023. 3 The pathogenesis of AD is complex and involves a variety of biological processes, including inflammation and immune system dysregulation.4–6 Amyloid-β plaques and tau protein tangles, the hallmarks of AD, are accumulated in the brain during this process. 7 These abnormal protein expressions trigger the immune response, leading to the activation of microglia, the immune cells in the brain. 8 Microglia play an important role in the immune response in the brain, which are able to remove the debris and abnormal proteins, as well as eliminating damaged or dying neurons. 9 However, on the other hand, the over-activated microglia contribute to neuroinflammation in AD, worsening cognitive ability and further damaging the neurons. 10 Other immune cells, such as T cells and B cells, have also been linked to the onset and progression of AD in addition to microglia.11,12 The inflammation present in AD is also mediated by inflammatory molecules such as cytokines (e.g., IL-6, TNF-α), chemokines (e.g., CXC, CCL2), cyclooxygenase, and complement (e.g., C1, C5).13,14 Although inflammation response is essential in the pathogenesis of AD, there are still lack of sufficient studies on this topic considering the complexity and persistence of the inflammatory response.
Neutrophil extracellular traps (NETs) are web-like structures that are released by neutrophils during inflammation, and are involved in the host defense against microbial pathogens. 15 Recent studies have suggested that NETs may also play a role in the pathogenesis of neurodegenerative diseases, including AD. While glial cells primarily maintain central nervous system (CNS) homeostasis and regulate immunity, evidence indicate that neuroinflammation and CNS injury can prompt the recruitment and activation of peripheral immune cells, notably neutrophils. 16 Upon infiltration into the CNS parenchyma, neutrophils can exacerbate tissue damage and inflammation by releasing cytokines, reactive oxygen species, and NETs. The presence of NETs in the CNS can escalate neuroinflammation and foster neuronal injury and dysfunction.17,18 However, the specific involvement of NETs in AD remains unclear. In this study, we aimed to investigate the role of NETs in AD by analyzing differentially expressed genes (DEGs) in AD patients using RNA-sequencing data from a public dataset. We identified 21 differentially expressed NETs genes that were significantly associated with AD and further evaluated their diagnostic performance using operating characteristic (ROC) analysis. We also performed unsupervised clustering of the AD patients based on the expression of the differentially expressed NET genes and identified two distinct subgroups of AD patients who could be effectively distinguished by principal component analysis (PCA) and consensus clustering. Our study provides evidence of dysregulated expression of NET-related genes in AD and suggests that NETs may contribute to AD pathogenesis. Furthermore, our study highlights the potential of transcriptomic analysis in identifying novel molecular targets for the diagnosis and treatment of AD.
Methods
Human samples
Informed consent was obtained from all healthy donors and AD patients prior to inclusion in the study, and experiments were performed in accordance with institutional and regional guidelines. Peripheral blood samples were collected from 5 AD patients. All patients presented clinical or laboratory variables that fulfilled the criteria for AD. Blood samples from 5 age- and sex-matched healthy donors served as the controls for AD patients.
Data download and preprocessing
Two datasets, GSE122063 and GSE36980, were downloaded from the NCBI's GEO database, containing samples from 44 and 33 AD patients, and 56 and 47 healthy controls, respectively. To mitigate batch effects, the ComBat method was employed. The harmonized datasets were then utilized for subsequent analyses. To obtain the autophagy gene set data, we retrieved it from the Human Autophagy Database (http://www.autophagy.lu/). By referring to Zhang et al., we curated and downloaded a set of 69 genes that are known to be associated with NETs. 19
Identification of differentially expressed NET genes
To identify differential gene expression between the disease and control groups, we utilized the limma package of R software. The resulting differential gene set was then intersected to obtain a list of differentially expressed NETs genes.
Evaluation of the diagnostic performance of differentially expressed NET genes
The diagnostic performance of the differentially expressed NET genes was assessed by analyzing the ROC curves using the pROC package of R software. Genes with an area under the ROC curve (AUC) greater than 0.6 were considered potential target genes.
AD sample cluster grouping
Consensus clustering is an unsupervised clustering method that enables the identification of new disease subtypes or comparative analysis of different subtypes based on various histological datasets. In this study, we employed the R software ConsensusClusterPlus package to cluster disease groups based on differentially expressed NET genes.
Cluster validation using principal component analysis (PCA)
The cluster groupings were subjected to PCA using the factoextra package of R software.
Analysis of differences between different cluster classes of AD samples
The ssGSEA algorithm was utilized to evaluate the immune cell content in our samples. We applied the ssGSEA package of R software to determine the immune score of each sample. Furthermore, we employed the pheatmap of R software to create a heatmap that depicts the expression of NETs, immune cell infiltration, and autophagy-related genes among different cluster classes.
AD samples were analyzed for differences between different cluster classes
The R software limma package was used to evaluate the differential RNA expression between different cluster classes of AD samples, and the screening criteria for differential expression of RNAs were determined as Padj < 0.05 and |log2 FC| ≥ 0.5. GO and KEGG pathway enrichment analyses of related genes were performed using the R software clusterProfiler package.
PPI interaction network construction and hub gene search
Protein interaction network analysis was conducted through the String online database, and the cytoHubba module in Cytoscape software was utilized for further analysis. The MCC method in the cytoHubba module of Cytoscape software was employed to identify the hub genes.
Western blot (WB)
The samples were prepared by mixing 300 μL blood sample with 300 μL RIPA lysis buffer (Beyotime Biotechnology, Shanghai, China) solution containing 2 μL proteinase inhibitor and 2 μL stabilizer. After full mixing, the samples were oscillated at 4°C for 10 min, followed by centrifuge for 3-5 min in the double layer centrifuge tube. The whole blood proteins were obtained from the fluid in the tube. Next, the total protein was separated by SDS‒PAGE and transferred to a PVDF membrane (Millipore, Bedford, MA, USA). After that, the membranes were blocked in 5% defatted milk and then incubated with the following primary antibodies overnight at 4°C: Toll-like Receptor 2 Antibody (#2229, Cell Signaling Technology, USA), CCL2/MCP-1 Rabbit mAb (A23288, ABclonal, China), and anti-TLR2 (1:500, 66645-1-Ig, Proteintech, China). After the membranes were rinsed with TBST, they were incubated with horseradish peroxidase-conjugated goat anti-rabbit IgG (bs-0295G-HRP, Bioss, MA, USA) or goat anti-mouse IgG H&L/HRP (bs-0296G-HRP, Bioss, MA, USA) at room temperature for 2 h. Immunodetection was performed using an enhanced chemiluminescence light-detecting kit (Amersham Pharmacia, Biotech) for 1 min. A mouse monoclonal antibody against GAPDH (1:10000; SAB4300645, Sigma Aldrich, USA) was used as a loading control. Optical densitometry was measured following normalization to the control (housekeeping gene) using Scientific Imaging Systems (Image LabTM 3.0 software, Bio-Rad Laboratories, Hercules, CA, USA).
Enzyme-linked immunosorbent assay (ELISA)
This procedure was performed as previously described. 20 Briefly, an antibody bound to a 96-well clear-bottom black plate captured the enzyme MPO (5 μg/ml; sc-16128-R, Santa Cruz Biotechnology), and the amount of DNA bound to the enzyme was quantified using the SPINK5 ELISA kit (Hnybio, China) according to the manufacturer's instructions. The fluorescence intensity (excitation at 488 nm and emission at 525 nm wavelength) was quantified by a Berthold LB941 Microplate Reader (Berthold Technologies, TN, USA).
Gene expression by real-time PCR (RT-PCR)
Total RNA was extracted from the cells using TRIzol reagent (Invitrogen, Shanghai, China) according to the manufacturer's instructions. RNA was reverse transcribed into cDNA using a HiScript lll 1st Strand cDNA Synthesis Kit (Vazyme, Nanjing, China). Taq Pro Universal SYBR qPCR Master Mix (Vazyme, Nanjing, China) and CFX96 Touch 1855195 Real-Time PCR system were employed to conduct RT‒qPCR. Target gene expression was calculated using the comparative method for relative quantification after normalization to Gapdh gene expression. Relative quantification was conducted by using the 2(−ΔΔCt) method. The primer sequences are shown in Table 1.
Sequences of primers for RT-qPCR.

Statistical analysis
The data obtained from the experiments described above were analyzed using SPSS 22.0 software and are presented as means ± S.D. One-way analysis of variance (ANOVA) was used to assess the differences between groups in the ELISA, WB and RT-PCR assays. Post-hoc power calculation was performed using the 'pwr' package in R. p value less than 0.05 was considered statistically significant.
Results
Identification of differential NETs genes
To identify key DEGs associated with AD, we performed an analysis using the limma algorithm and set a threshold of |log2FC| ≥ 0.5 and padj < 0.05. The results of the differential gene volcano plot are presented in Figure 1. A total of 297 DEGs were identified in AD pathogenesis, including 155 downregulated and 142 upregulated genes. To further investigate the potential involvement of NETs in AD, we intersected the list of DEGs with the NET gene list, identifying 18 representative differential NET genes. These genes include BDNF, CHGB, TGFBI, CCL2, SST, MET, CRH, HAPLN1, HTR2A, PRPH2, VIP, FCGR2A, TLR2, SCG2, ANGPT2, CP, CCKBR, and FOS. The diagnostic potential of these genes in differentiating AD from healthy controls was evaluated using the R software pROC package, and the area under the ROC curve was found to be greater than 0.6. These 18 genes were retained for further analysis.
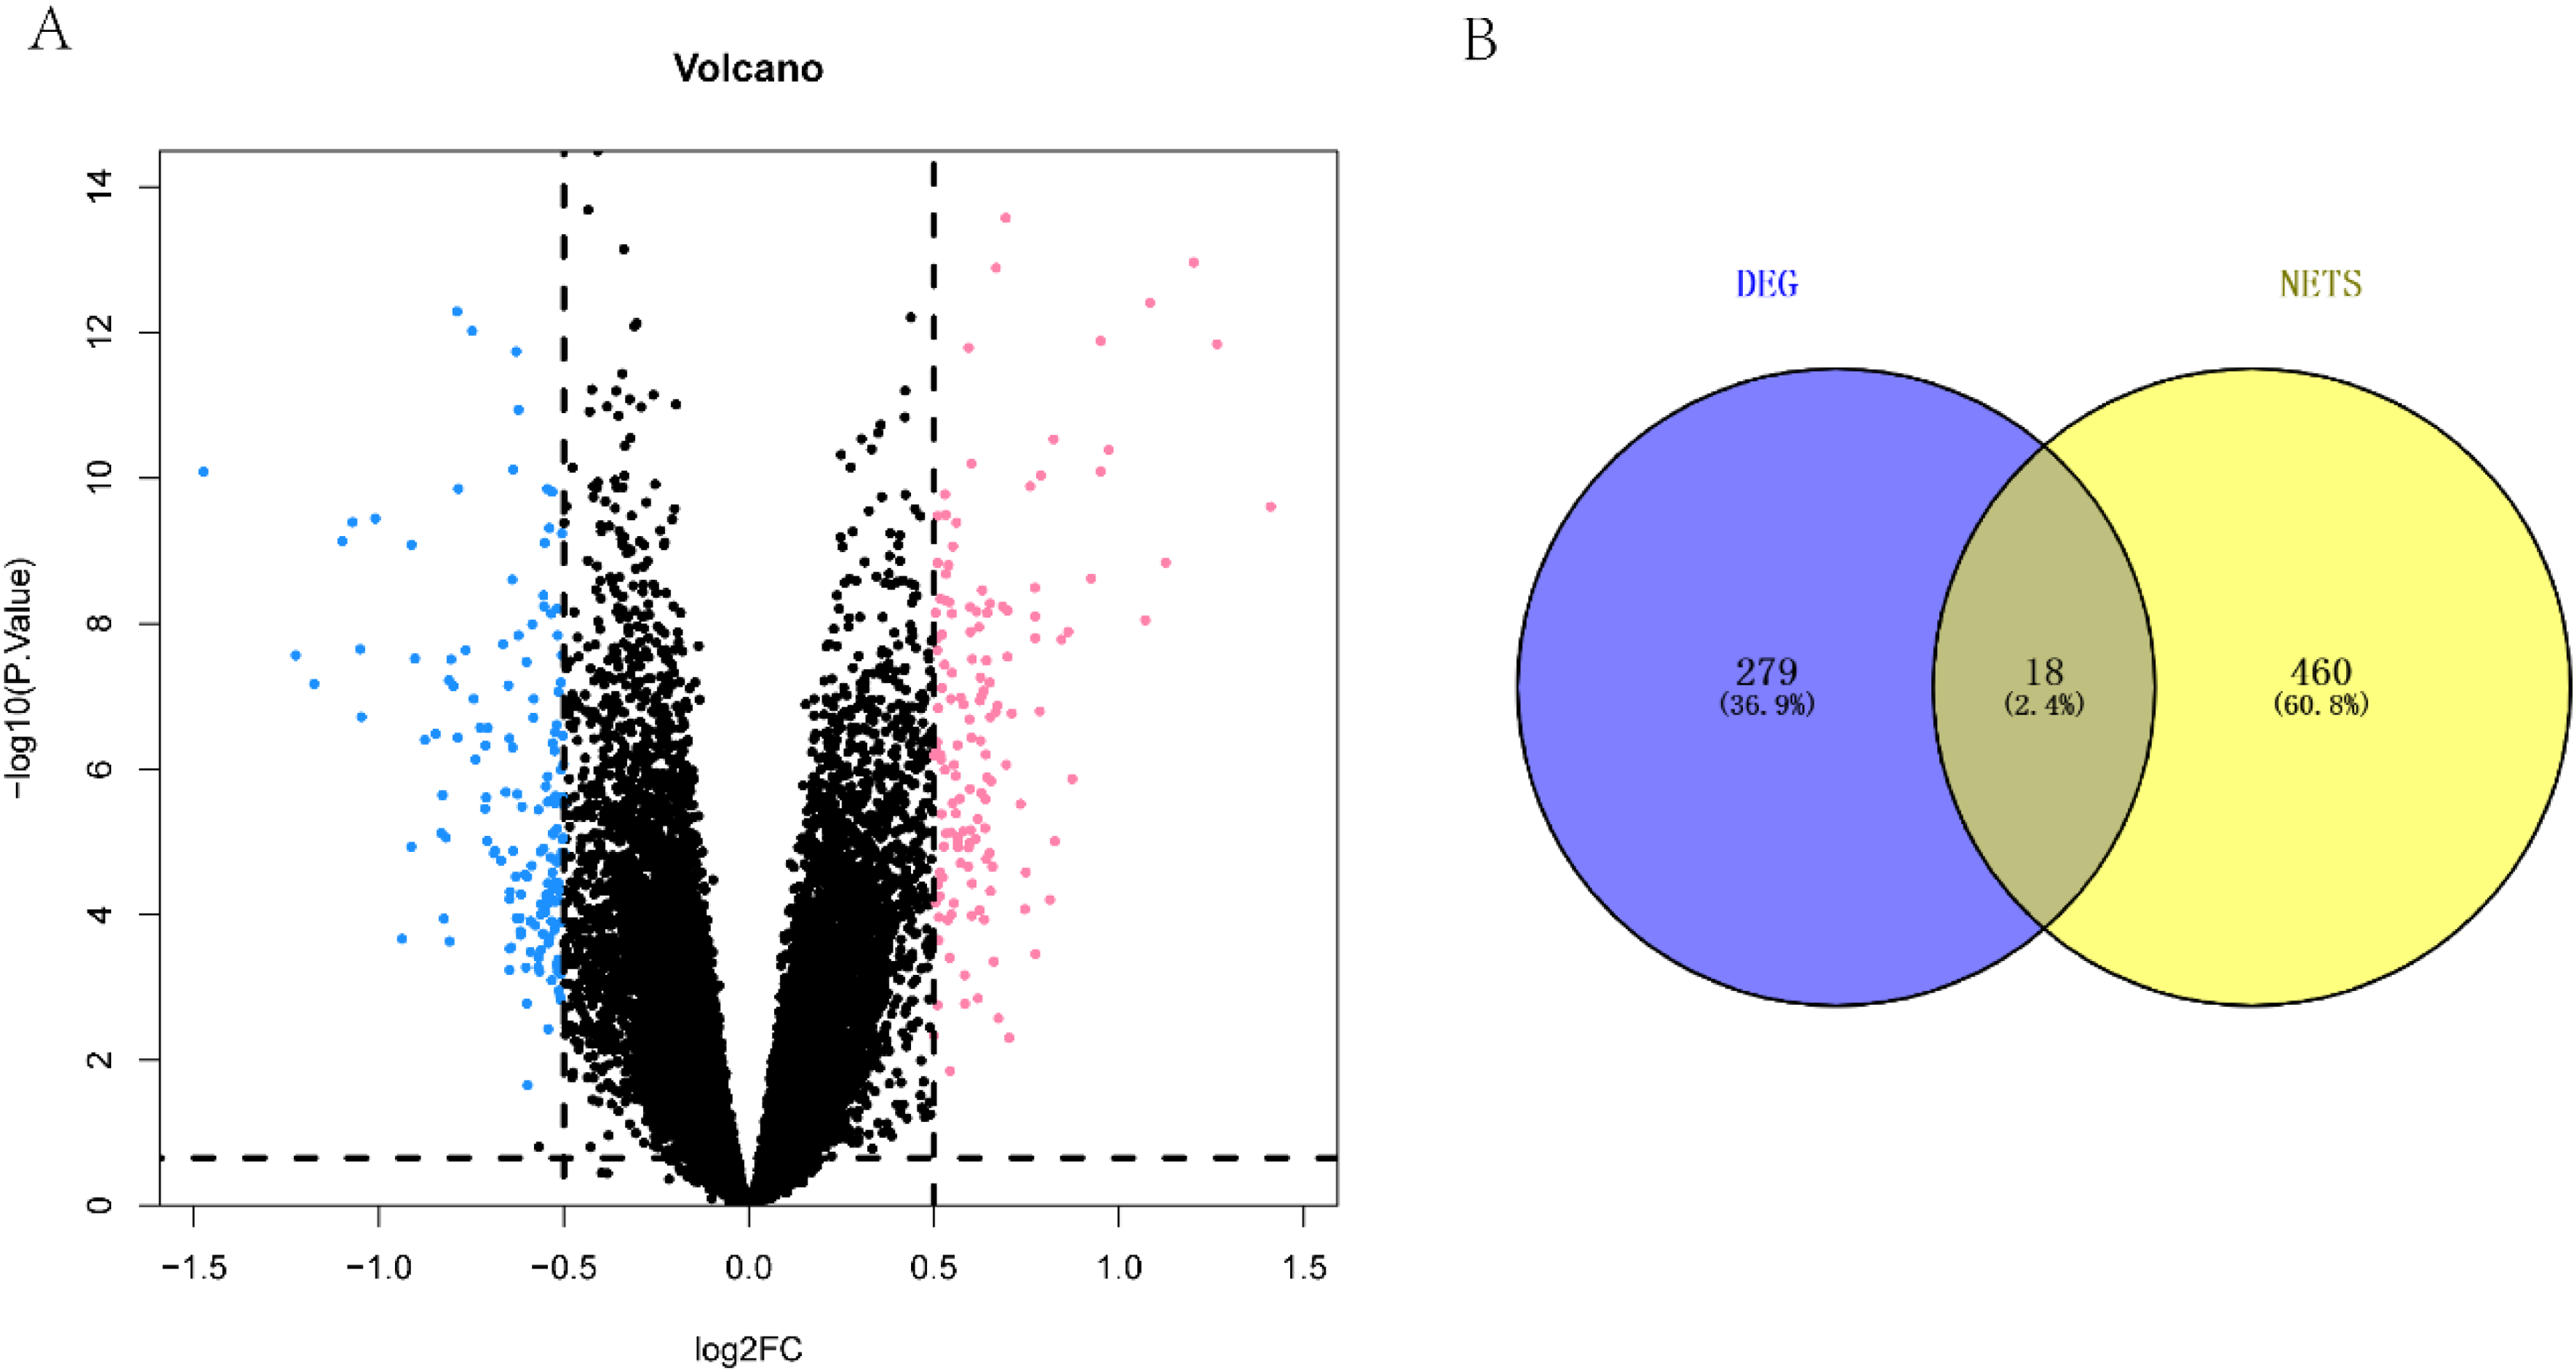
Identification of differential NET genes. (A) Differential volcano plot, where red represents genes with upregulated differences, blue represents genes with downregulated differences and gray represents genes with no significant differences. (B) Intersection analysis of differentially expressed genes and NETS-related genes.
Diagnostic performance assessment of NET genes
The diagnostic performance of the differentially expressed NET genes was assessed using the pROC package in R software, revealing an area under the ROC curve greater than 0.6 for distinguishing between the disease and control groups. A total of 18 genes were identified for further analysis in this section, as shown in Figure 2.

Diagnostic performance assessment of NET genes. (A-R) ROC curves of NETs genes distinguishing the AD and control groups. (S) Relative expression of NETs genes in the AD and control groups.
AD samples were clustered into different subtypes according to NETs genes
To cluster the disease groups based on the differentially expressed NETs genes, we utilized the Consensus-ClusterPlus package in R software. The consistent cumulative distribution function (CDF) plot in Figure 3A presents the CDF when k is taken to different values. The delta area plot in Figure 3B demonstrates the relative change in the area under the CDF curve for k and k-1 compared to k-1. Upon examination of the plot, we found that the area under the curve only slightly increased when k = 4, indicating that 3 was the optimal value for k. Consequently, we divided the AD group into three subtypes, which were named AD_1, AD_2, and AD_3. Since AD_3 only contained three samples, it was excluded from subsequent analyses, and only the differences between the two groups, AD_1 and AD_2, were investigated.

AD sample cluster grouping. (A) Consistent cumulative distribution function (CDF) plot showing the cumulative distribution function when k is taken to different values. (B) Delta area plot showing the relative change in area under the CDF curve for k and k-1 compared to the CDF curve. During the Delta area analysis, we observed that when k = 2, the area under the CDF curve represents the overall change, as there is no k=1 for reference. This observation suggests that at k = 2, the total area under the curve can intuitively reflect the basic characteristics of the dataset without the need for comparing relative changes. Based on this analysis, we chose k = 2 as the starting point for our analysis. This approach not only ensures the simplicity of the analysis but also effectively captures the core variations in the data. (C) Heatmap of driving gene expression clustering (k = 2). Each column of this plot represents a sample, and each row represents a differentially expressed gene. Each square represents the expression of that gene in that sample, with darker colors representing higher expression of that gene. The heatmap divides the disease group into 2 clusters.
Validation by PCA
We performed PCA validation on the disease data obtained from AD_1 and AD_2, which exhibited a clear discrimination between the two clusters, as depicted in Figure 4. This outcome implies that differential expression of the NET gene can effectively distinguish between the two subgroups of AD patients.
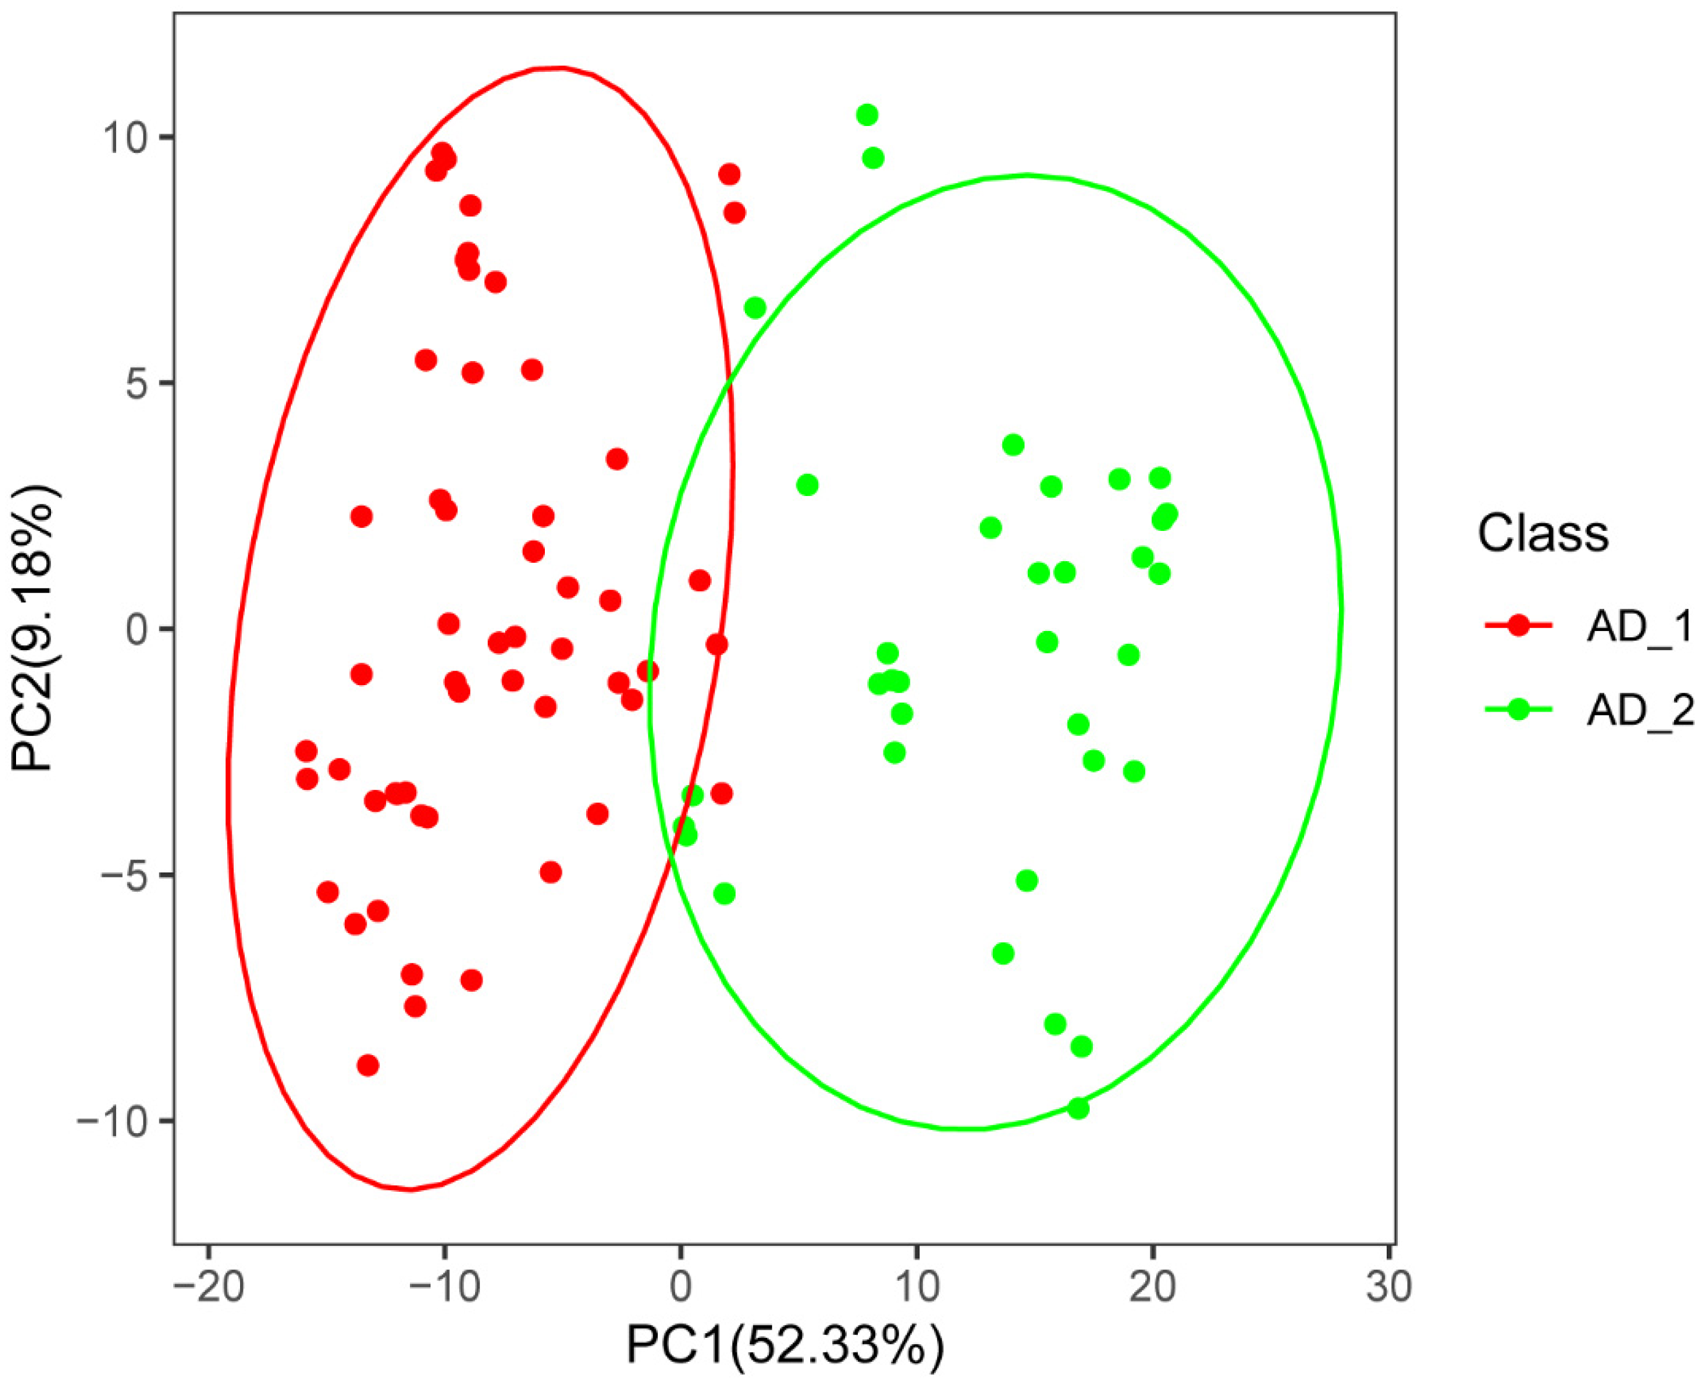
Principal component analysis validation. PC1 is the first principal component, PC2 is the second principal component, and the dashed circles represent the confidence ranges of different clusters.
Immune infiltration of different cluster classes in AD samples
To evaluate the activity of the 22 immune cell types in the AD samples, we utilized the single-sample Gene Set Enrichment Analysis (ssGSEA) algorithm along with immune cell-specific gene sets in R software. The immune infiltration was then correlated with various clusters, as presented in Figure 5A and B. The heatmap indicated that cells, including Regulatory T cells, Monocytes Macrophages, Natural Killer (NK) cells, Dendritic cells, Neutrophils, Eosinophils, did not exhibit significant changes in either of the subgroups (Figure 5A). The bar plot further explored how the majority of immune cells changed in the two subgroups. Significantly, cells such as HLA, Type I IFN response, B cells, check_point, CCR, pDCs showed higher levels in the AD_2 subgroup. A higher abundance was observed on AD_1, such as aDCs CD8+ cells, Mast cells. Our analysis revealed a clear association between different clusters and immune infiltration.
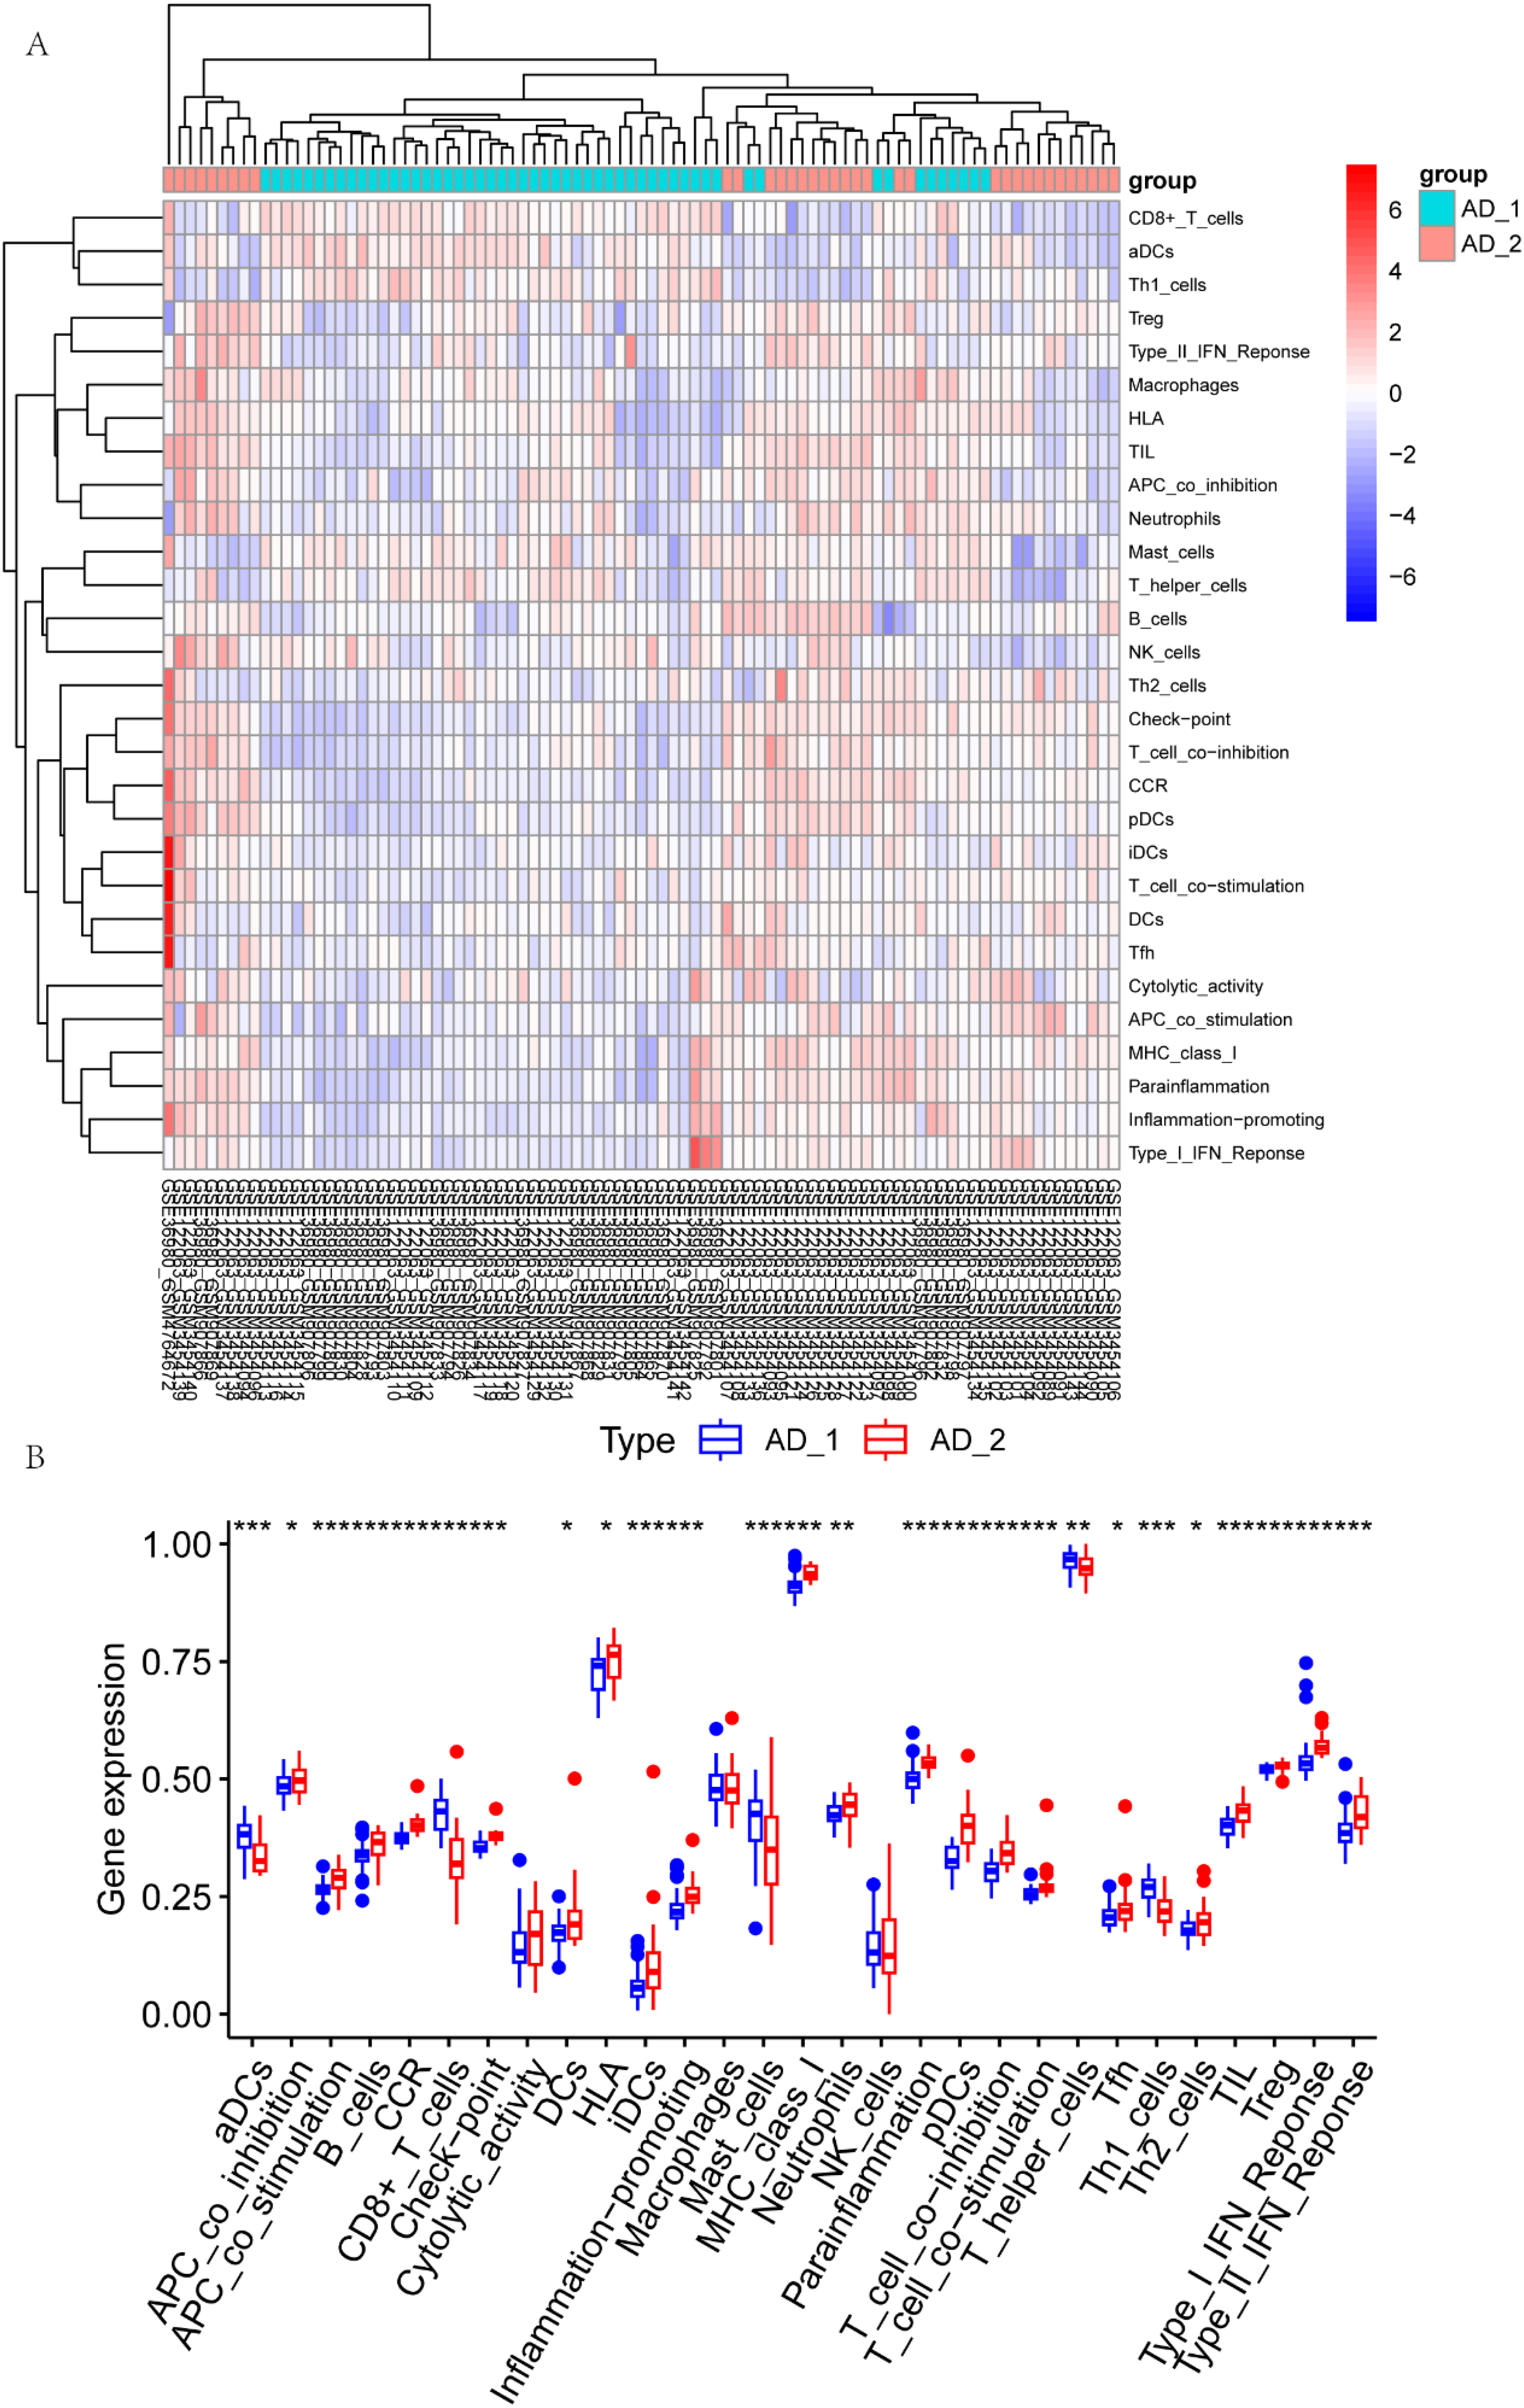
Immune infiltration of different cluster classes in AD samples. (A) Relationship between different clusters and immune infiltration scores. (B) Differences in immune cell infiltration scores by cluster. p values are reported after an unpaired parametric T test was performed. *p < 0.05; **p < 0.01; ***p < 0.001; ****p < 0.0001.
Analysis of gene differences between different cluster classes of NETs
Utilizing R software, we generated a differential expression volcano plot (Figure 6A) and a corresponding gene expression heatmap (Figure 6B) to investigate the differential expression of NET-related genes across distinct cluster classes. There were 7 upregulated genes and 6 downregulated genes that presented significant changes, as shown in Figure 6A. Clearly, ANGPT2, CP, TLR2, FGGR2A, TGFB1, and CCL2 showed high abundance in AD_2. Interestingly, genes such as CCK8R, CRH, SCG2, SST, MET, HTR21, and CHGB had higher levels in AD_1. Although there was larger variance within the AD_2 subgroup, it was likely caused by a larger sample number than AD_1. Our analysis demonstrated notable dissimilarities in the expression patterns of several NET-associated genes between different clusters.

Analysis of gene differences between different cluster classes of NETs. (A) Expression volcanoes of different cluster classes (AD_1 versus AD_2) of NETs; red represents upregulated differences, blue represents downregulated differences and gray represents nonsignificant differences. (B) Expression profiles of genes associated with different cluster classes (AD_1 versus AD_2) of NETs; red represents upregulated differences, blue represents downregulated differences, and yellow represents nonsignificant differences.
Differential analysis of autophagy-associated genes among different cluster classes
Using R software, we generated differentially expressed volcanoes (Figure 7A) and heatmaps (Figure 7B) to assess the expression patterns of autophagy-related genes across various cluster classes. The number of DEGs and the intersection with genes involved in autophagy is 49. These changes are further explored in Figure 7B. The results revealed significant variations in the expression of several autophagy-related genes across different clusters.
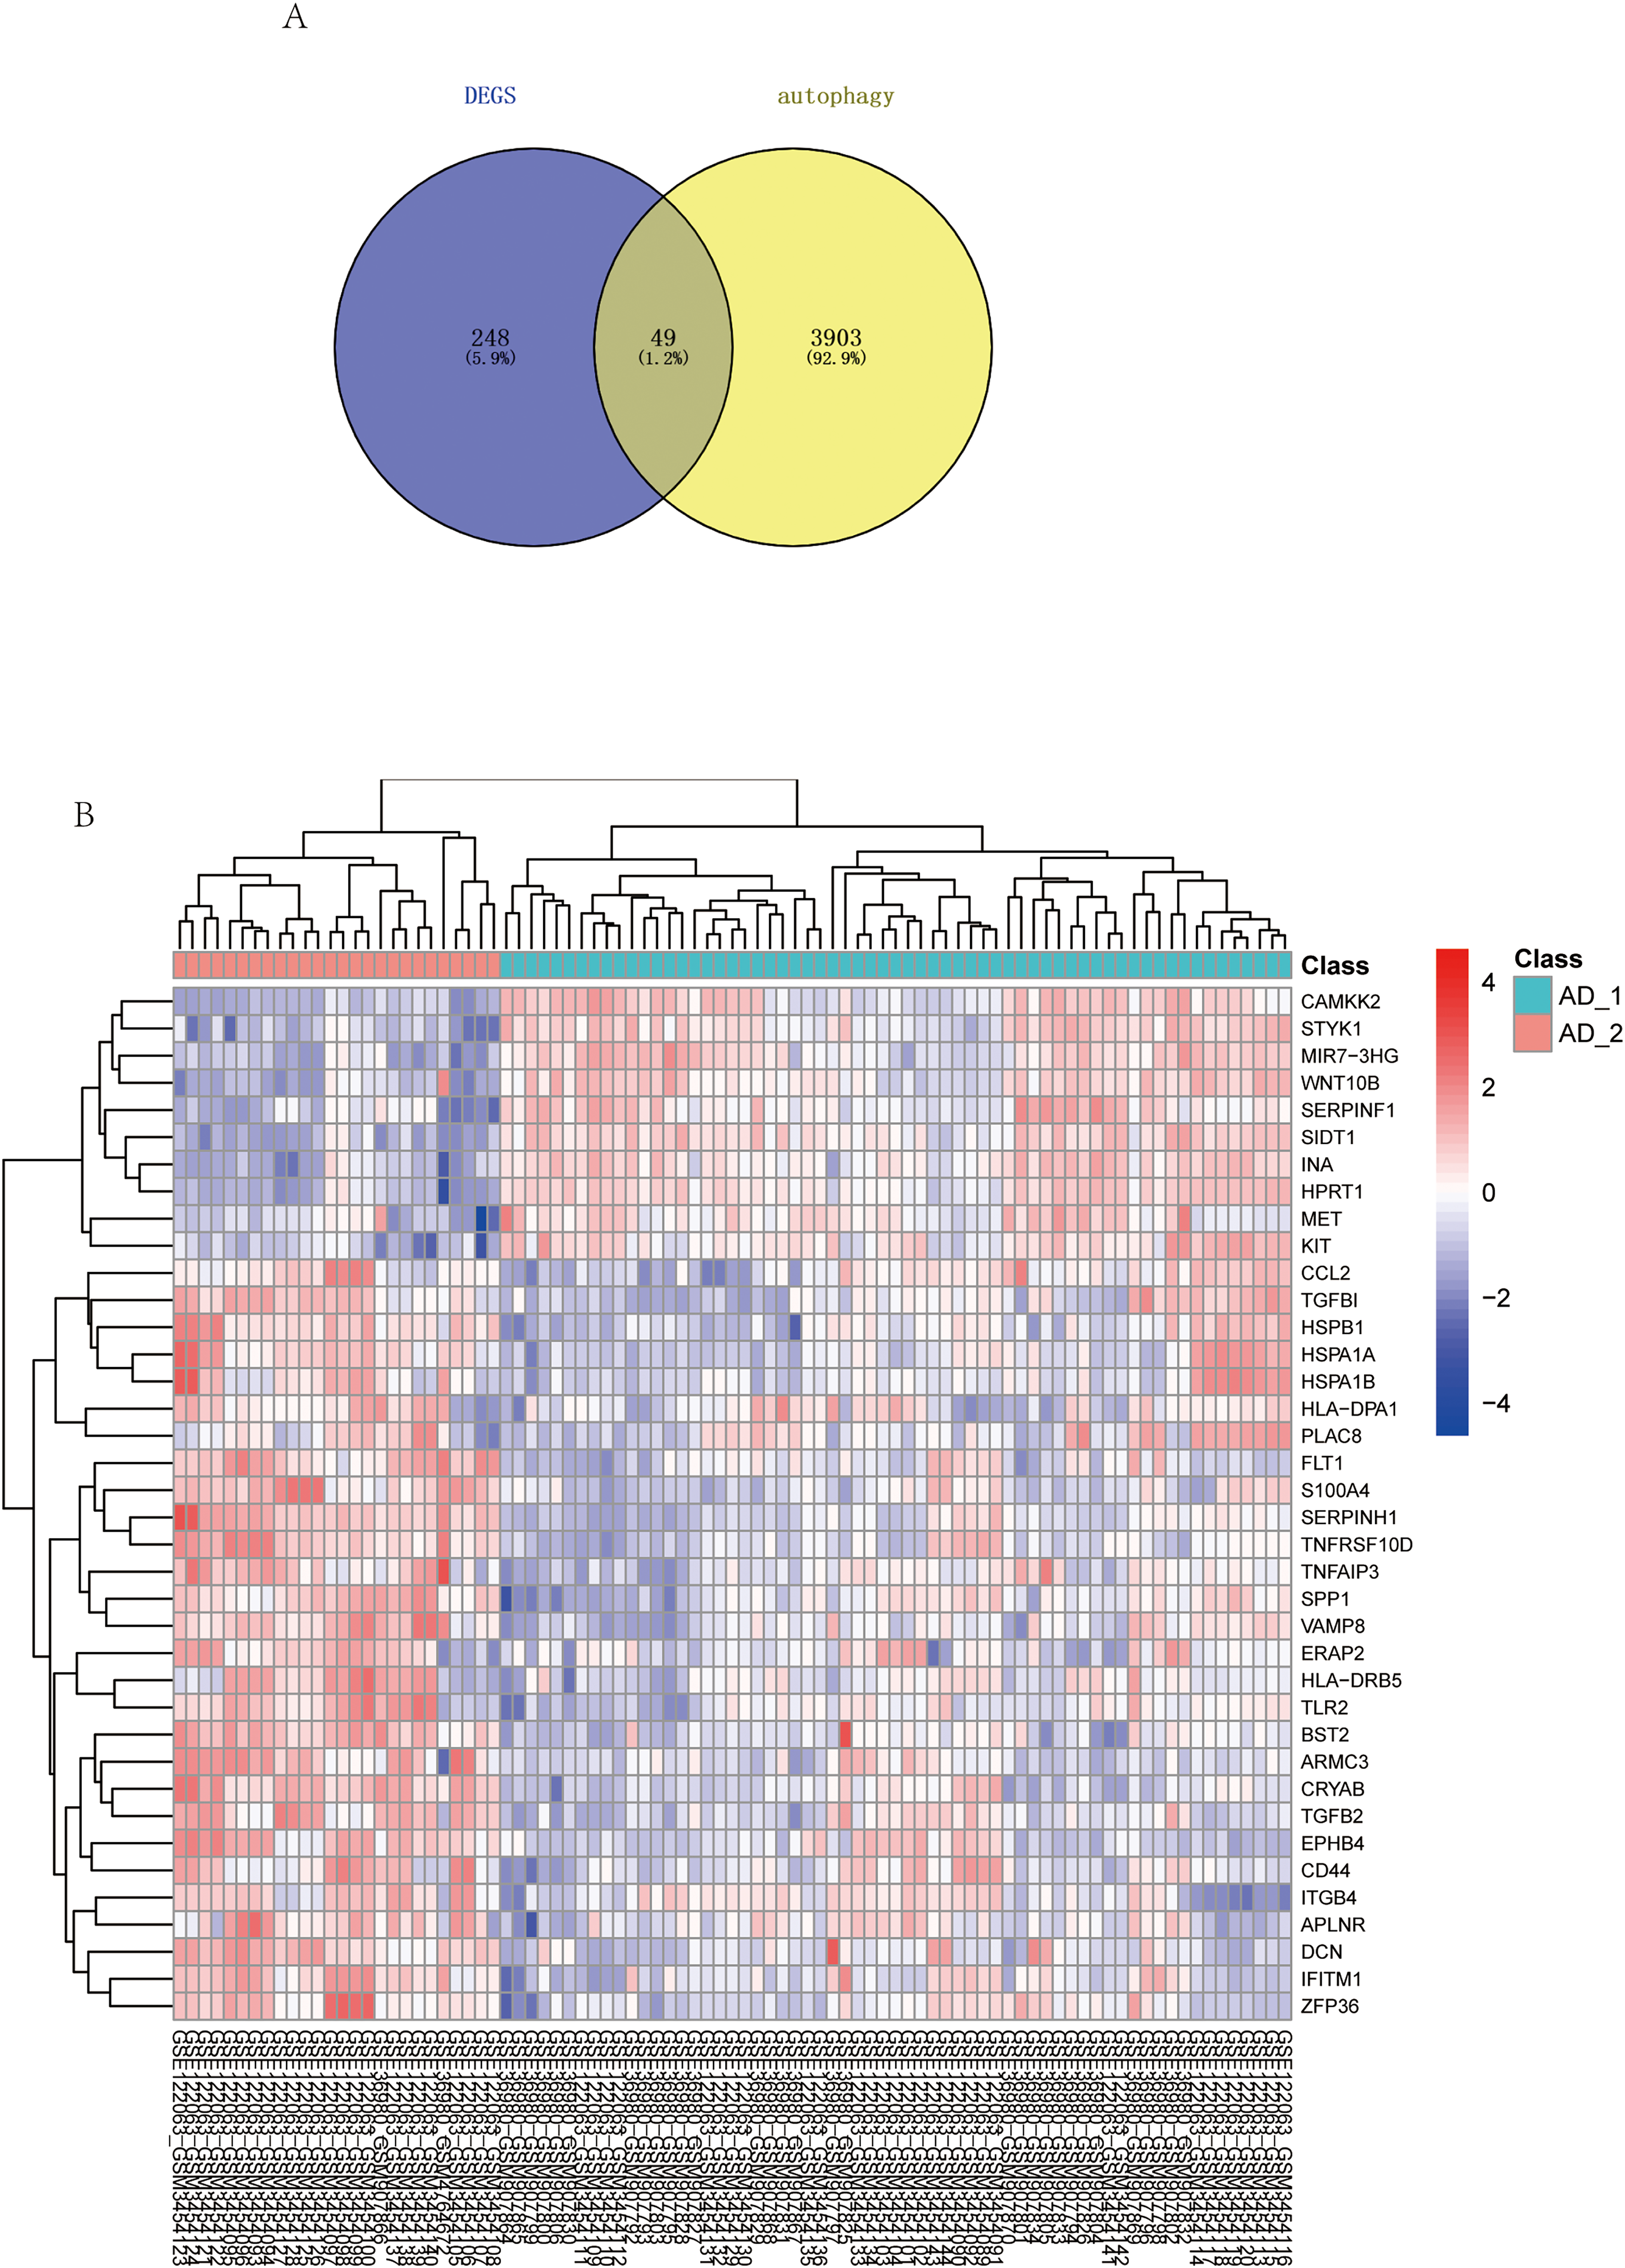
Differential analysis of autophagy-associated genes among different cluster classes. (A) Intersection analysis of differentially expressed genes and autophagy-associated genes. (B) Expression profiles of autophagy-related genes in different cluster classes (AD_1 versus AD_2); red represents upregulated differences, blue represents downregulated differences, and yellow represents nonsignificant differences.
Analysis of differential expression of genes in different cluster classes
The above results indicated that there were strong differences between the two AD subgroups in terms of immune infiltration, NET gene expression and autophagy-related gene expression. Therefore, the limma algorithm was employed to assess the DEGs between various cluster classes (AD_1 versus AD_2), utilizing threshold values of |log2FC| ≥ 0.5 and p value < 0.05. The results are presented in the form of a differential gene volcano plot, as depicted in Figure 8A. A total of 5066 DEGs were identified in AD, comprising of 2601 downregulated genes and 2465 upregulated genes. These genes were further visualized via a heatmap generated by R software, as shown in Supplement Figure 1. To elucidate the biological implications of these genes, we performed GO and KEGG pathway enrichment analysis using the R software “clusterProfiler” package. The analysis revealed 1210 GO biological processes, 119 GO molecular functions, and 150 GO cellular components enriched for these genes, with the top 10 pathways presented in Figure 8B, respectively. Pathways including modulation of chemical synaptic transmission in BP, channel activity and passive transmembrane transporter activity in MF, together with synaptic membrane in CC, presented the highest enrichment in the corresponding categories. Similarly, the KEGG enrichment analysis highlighted 77 associated pathways enriched for these genes, with the top 30 pathways displayed in Figure 8C. Interestingly, the pathway of neuroactive ligand‒receptor interaction presented the top enrichment.

The differentially expressed genes between various cluster classes. (A) Gene expression volcanoes of different cluster classes (AD_1 versus AD_2); red represents upregulated differences, blue represents downregulated differences and yellow represents nonsignificant differences. (B) GO functional enrichment analysis. The color represents the significance of the p value; the redder the color is, the smaller the p value, the size of the circle represents the number of enriched pathway genes, and the larger the circle is, the greater the number. (C) KEGG functional enrichment analysis. The color represents the significance of the p value; the redder the color is, the smaller the P value, the size of the circle represents the number of enriched pathway genes, and the larger the circle is, the greater the number.
PPI network and hub gene screening
We generated protein‒protein interaction (PPI) networks for the set of 297 DEGs using the String database, filtering for results with a composite score of 0.7 or higher, and visualized the networks using Cytoscape software. The resulting network consisted of 288 nodes and 722 reciprocal pairs, as illustrated in Figure 9A. To identify hub genes, we employed the MCC method in the cytoHubba plug-in and selected the top 20 highest-scoring node genes as putative hub genes, namely, CCL2, BDNF, FOS, CD44, GFAP, TLR2, SPP1, C3, SST, CD163, CD68, GAD2, TAC1, C1QA, CRH, KIT, CALB1, VSIG4, C1QC, SLC17A6. These results are presented in Figure 9B.
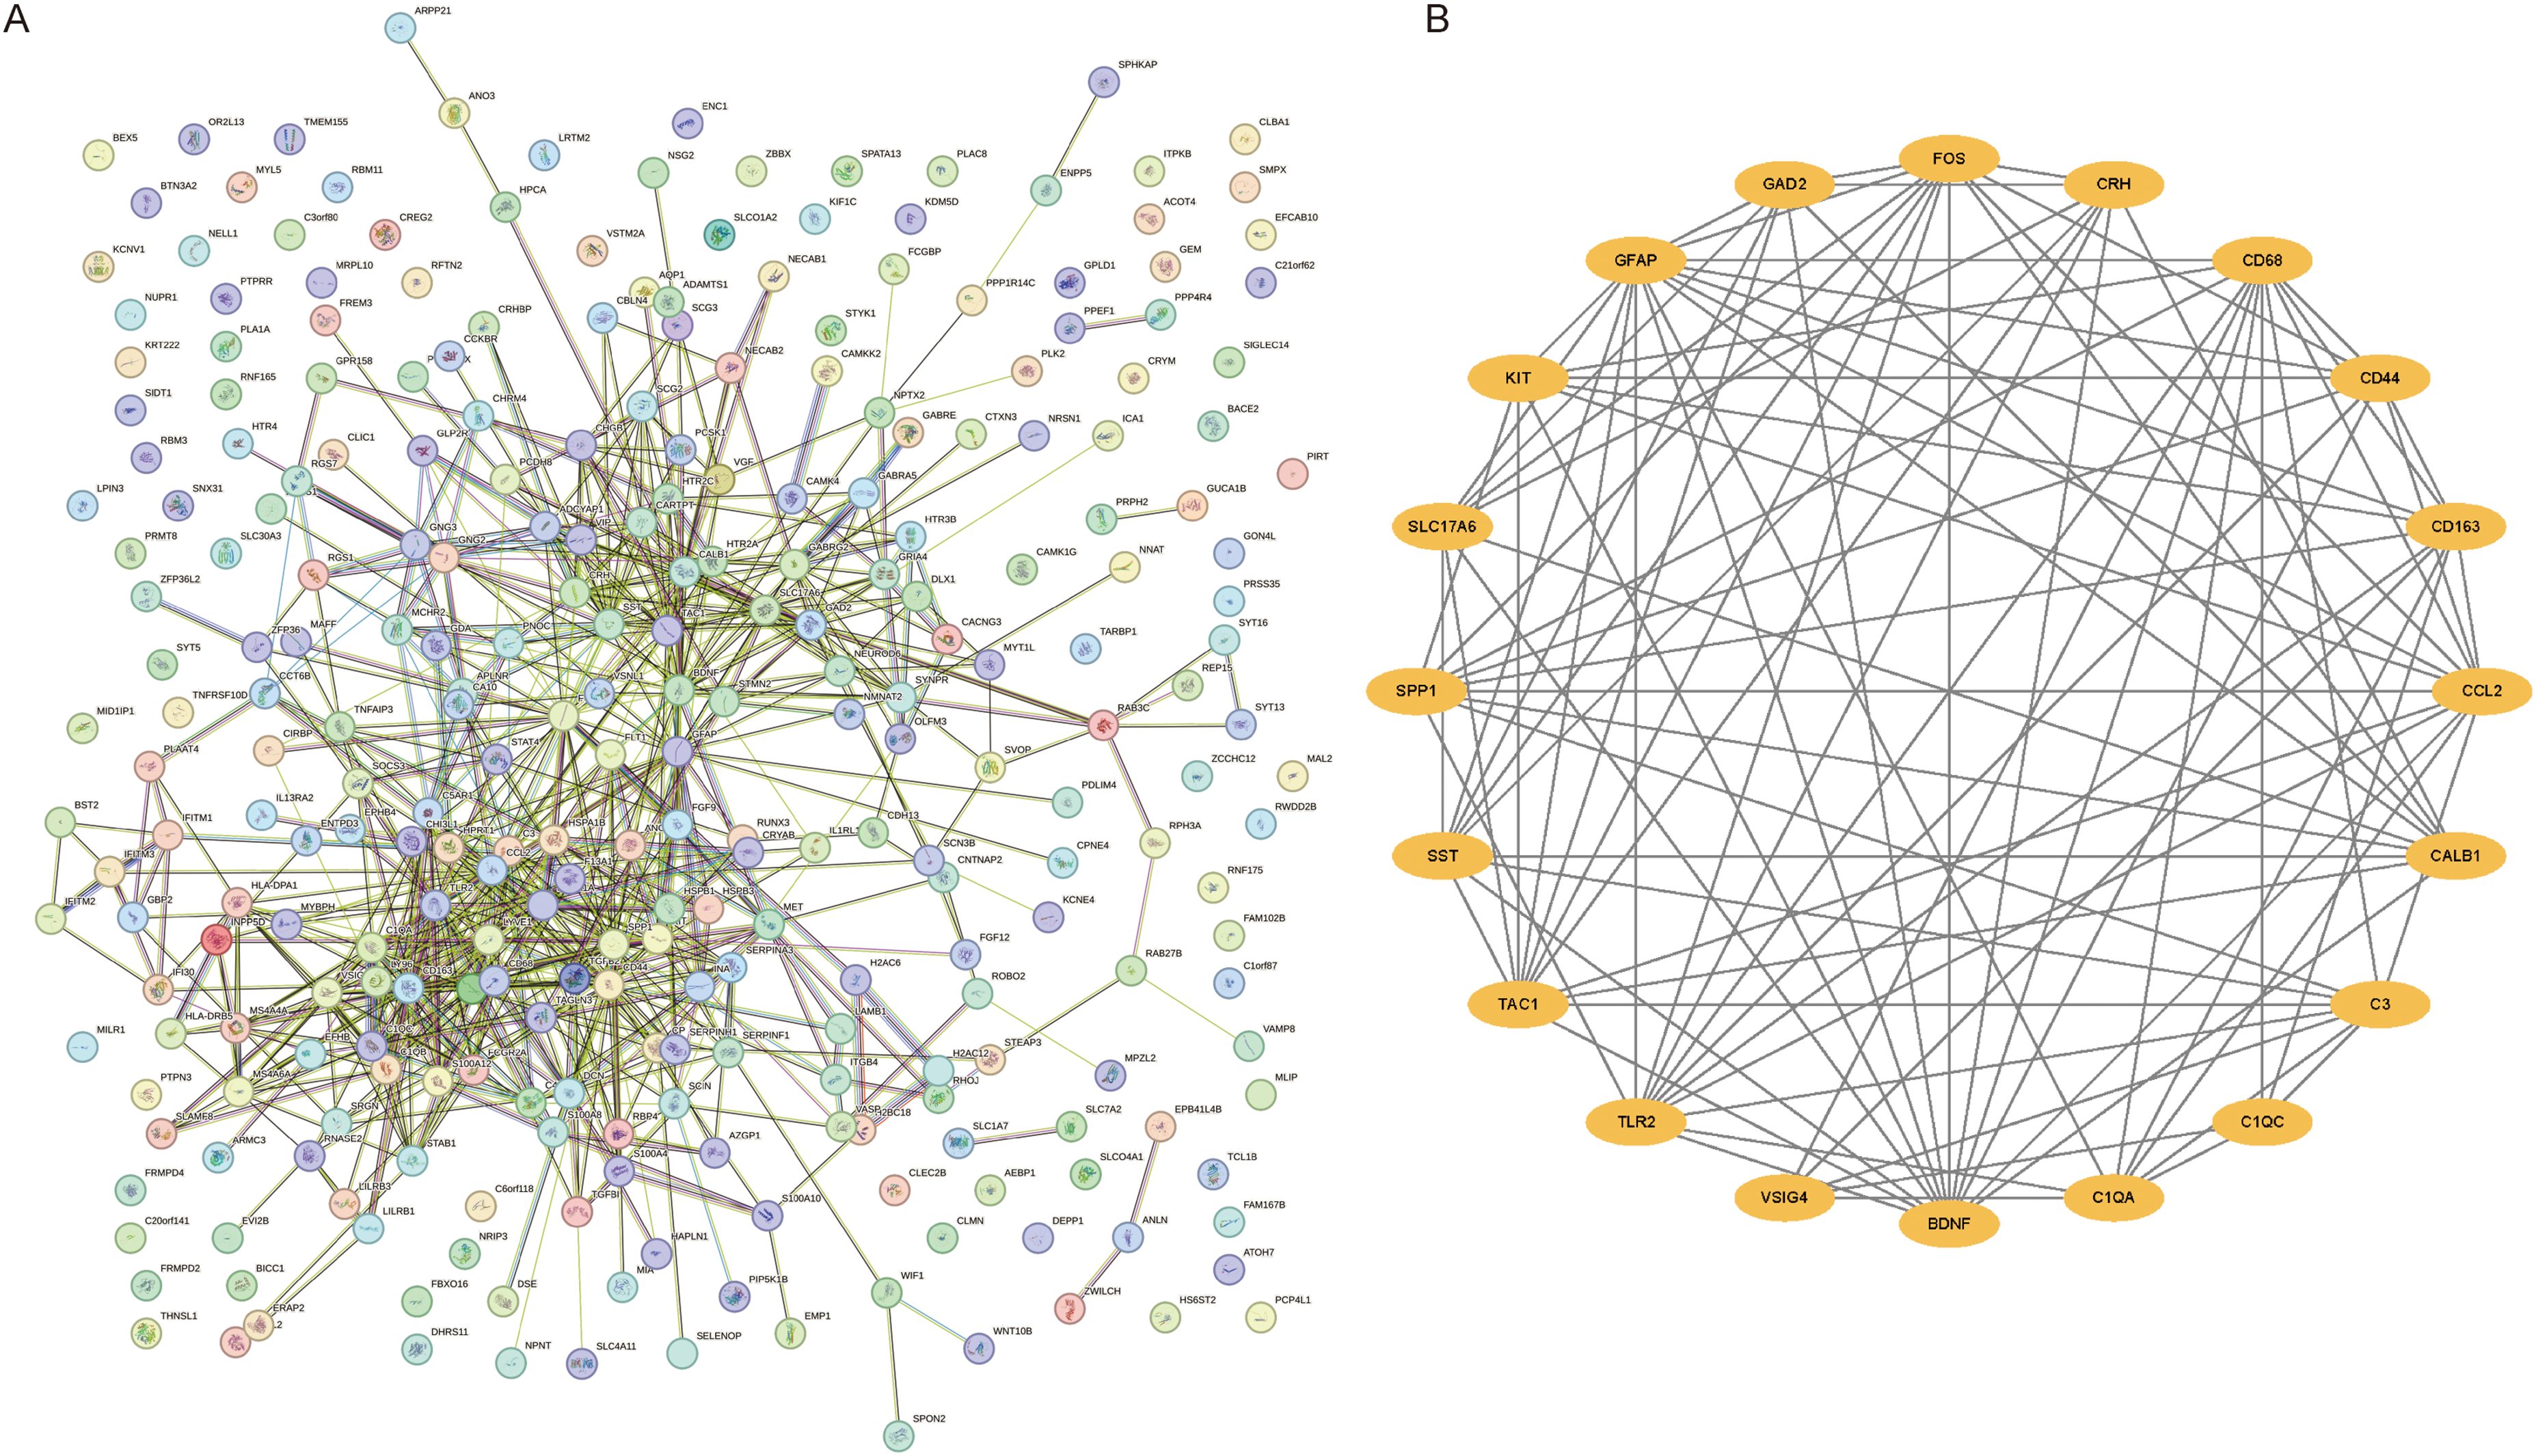
PPI network and Hub gene screening. (A) PPI network diagram. (B) top 20 hub gene interactions.
Validation of NETs and marker genes in peripheral blood
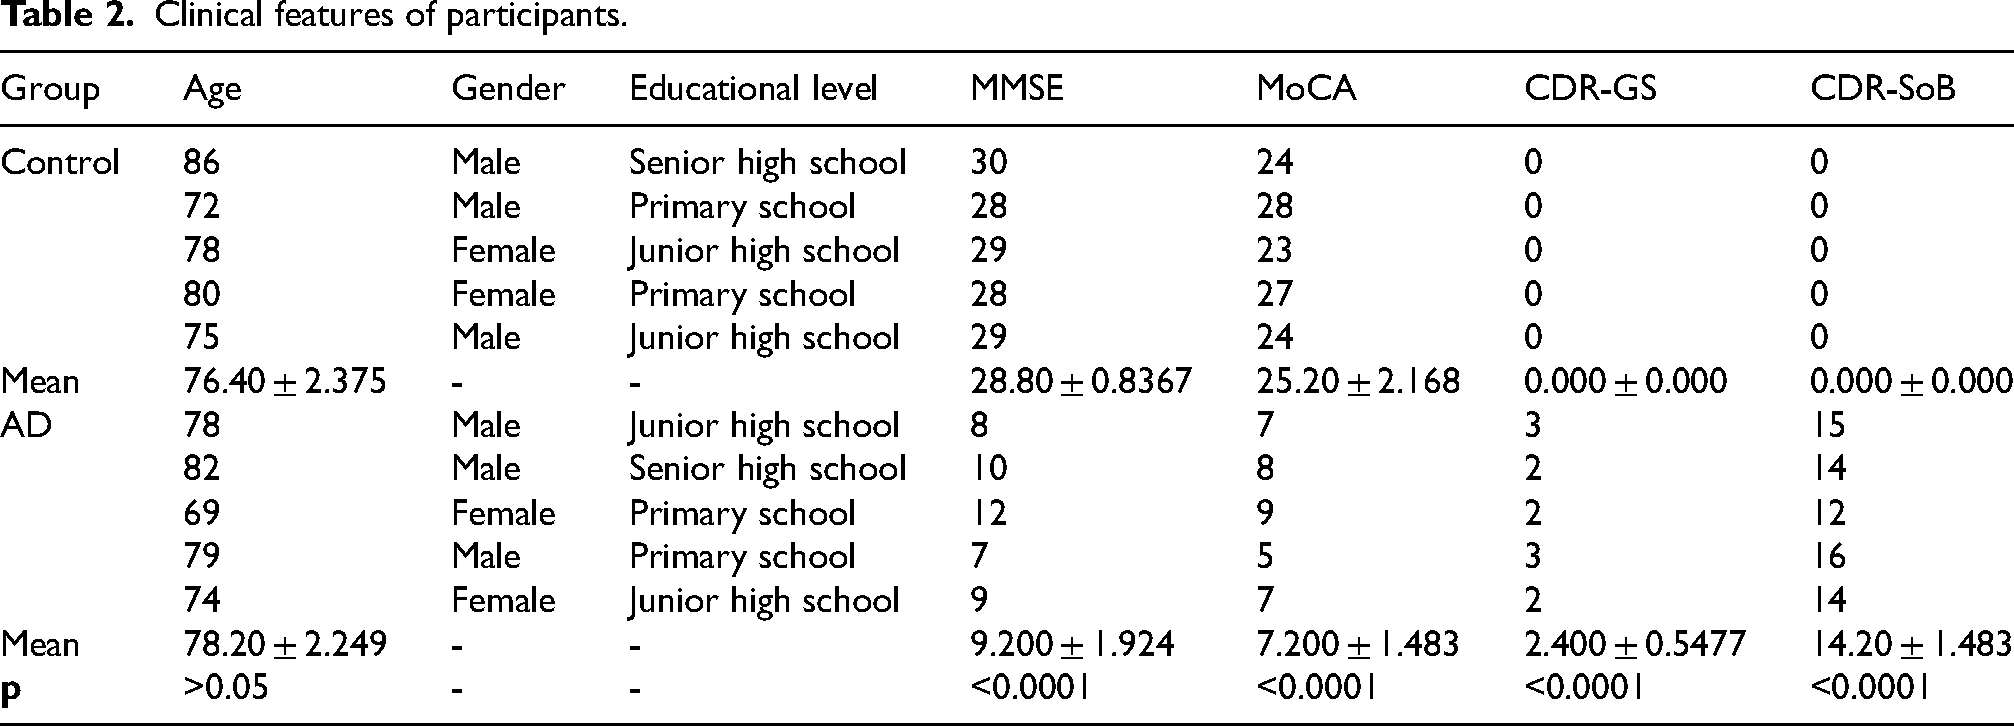
Based on the in-silico analysis, we assessed the NET content in the peripheral blood of patients with AD using ELISA kits. As shown in Table 2, the age, gender composition, and educational level between AD and control groups had no significant differences (p > 0.05). The Mini-Mental State Examination (MMSE) and Montreal Cognitive Assessment (MoCA) scores of AD patients were significantly lower than healthy individuals (p < 0.0001), whereas Clinical Dementia Rating scale - global sum (CDR-GS) and Clinical Dementia Rating scale - sum of boxes (CDR-SoB) scores were significantly higher (p < 0.0001).
Clinical features of participants.
Since we identified 18 DEGs in the above bioanalyses, we randomly selected 3 genes for validation, including BDNF, CCL2, and TLR2. The protein expression of BDNF was significantly decreased, whereas the expressions of CCL2 and TLR2 significantly increased in AD patients comparing with control (p < 0.001, Figure 10A-C). Consistently, RT-qPCR analysis also revealed higher transcription of BDNF in the AD group and lower transcriptions of CCL2 and TLR2 (Figure 10D-F). As previously reported, the formation of NETs can be detected by myeloperoxidase (MPO)-DNA complex ELISA. 21 The obtained results demonstrated a significantly higher level of NETs in the AD group than in the healthy control group (Figure 10A).
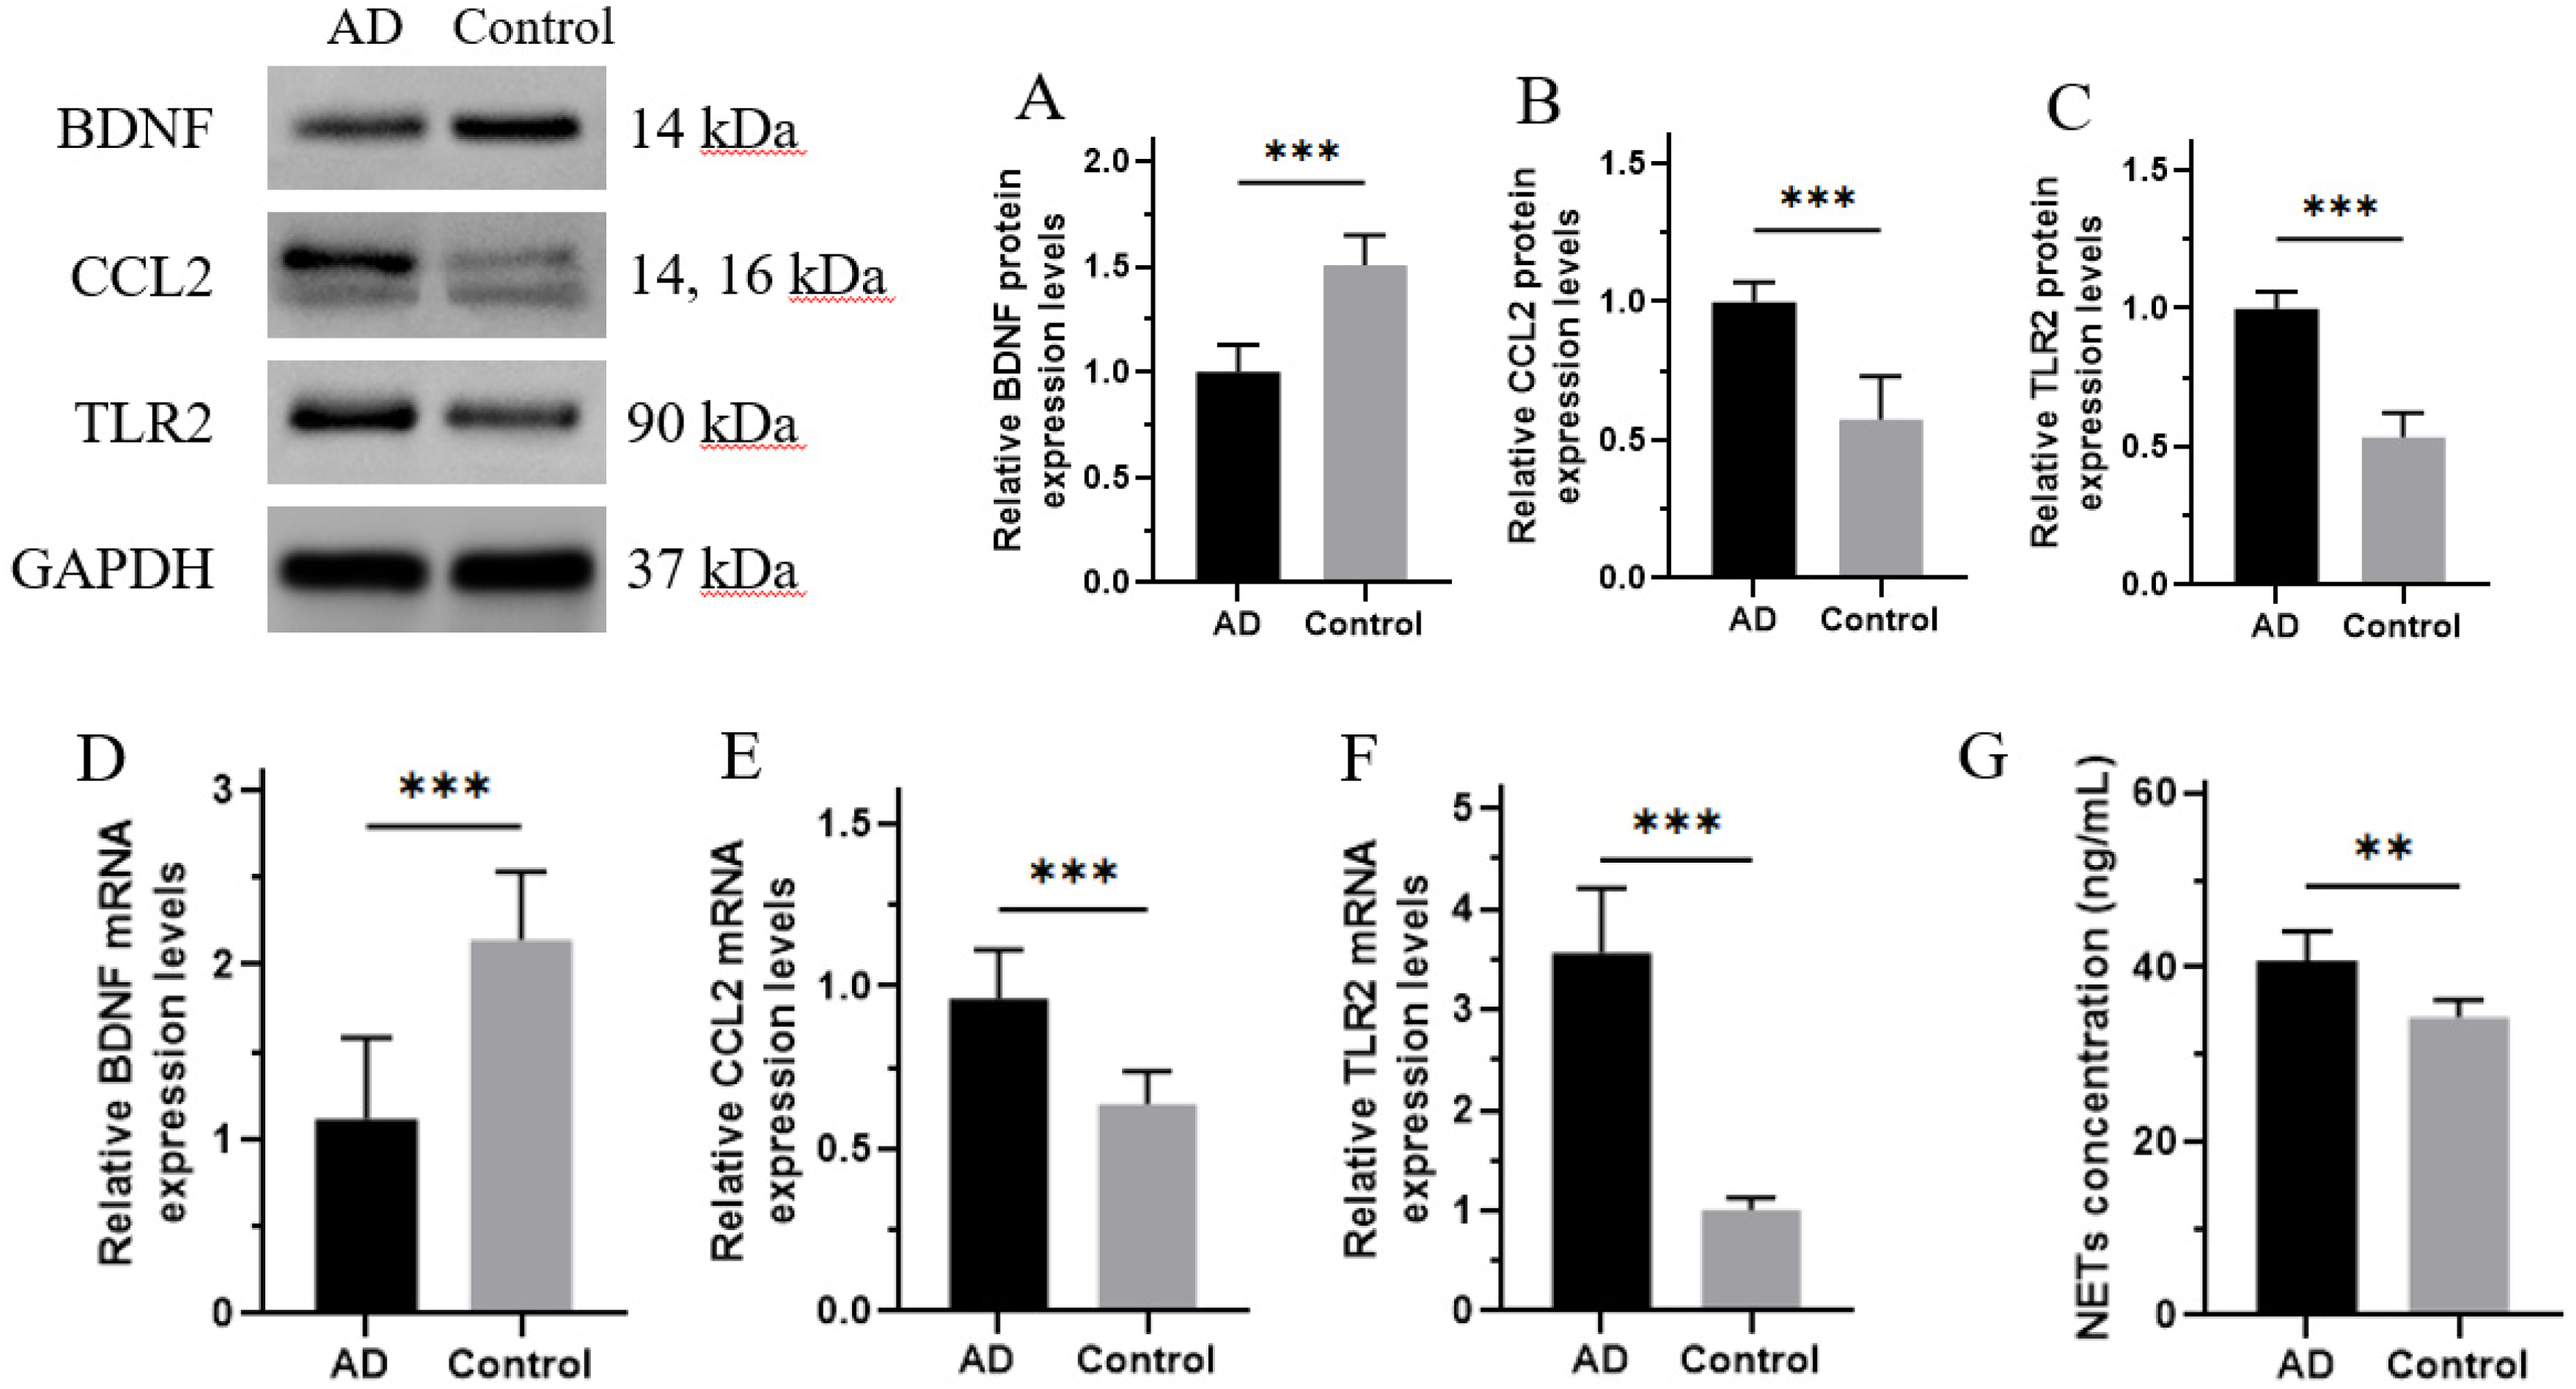
The NETs concentration as well as BDNF, CCL2, and TLR2 expression in peripheral blood of AD patients. (A-C) The relative protein expressions of BDNF, CCL2, and TLR2 were detected by western blot; GAPDH was used as a loading control. (D-F) The relative mRNA expressions of BDNF, CCL2, and TLR2 were detected by RT-qPCR. (G) Detection of NETs using ELISA with plasma samples from healthy and AD patient donors. Data are shown as mean ± SD, n = 3, *p < 0.05, **p < 0.01, ***p < 0.001.
Discussion
AD is a neurodegenerative disorder characterized by progressive cognitive decline and memory loss. 1 It is the most common cause of dementia, accounting for a significant burden on individuals, families, and healthcare systems worldwide. 22 The exact cause of AD is still not fully understood, but it is believed to involve a complex interplay of genetic, environmental, and lifestyle factors. Currently, there is no cure for AD. Treatment approaches primarily aim to manage symptoms and improve quality of life for affected individuals. Medications may be prescribed to help alleviate cognitive symptoms and manage behavioral changes. 23 Therefore, understanding the molecular mechanisms underlying AD progression is crucial for the development of effective therapeutic strategies. In our research, we explored whether NETs related genes are dysregulated in AD.
NETs are web-like structures composed of DNA, histones, and antimicrobial proteins that are released by activated neutrophils. 15 Originally identified as a defensive mechanism against microbial infections, NETs have since been implicated in various physiological and pathological processes.18,24 In an AD mouse model, the researchers found that the neutrophils released NETs in the areas with Aβ deposits, suggesting that NETs may contribute to the inflammatory milieu in the AD brain. In human AD patients, the researchers also observed the presence of NETs in the brain parenchyma, further supporting a potential role for NETs in the disease process. 25 Abundant NET release can activate and recruit more immune cells, further amplifying the local inflammatory response. The persistent inflammatory state may be a key pathological mechanism in the development of AD.17,26 Studies have shown that treatment with DNase I, an enzyme that can degrade NETs, can mitigate neuronal damage and improve cognitive function in AD mice. 26 Therefore, NETs might be may be a key pathological mechanism in the development of AD, further investigating its underlying mechanism is in need. In this study, we employed gene expression profiling and bioinformatics analysis to identify 21 DEGs associated with NETs in patients with AD compared to healthy controls. These genes are BDNF, CHGB, TGFBI, CCL2, SST, MET, CRH, HAPLN1, HTR2A, PRPH2, VIP, FCGR2A, TLR2, SCG2, ANGPT2, CP, CCKBR, FOS. To assess their diagnostic potential, we conducted receiver ROC analysis, revealing that all 18 genes exhibit the capability to serve as biomarkers for targeted treatment strategies. Among these genes, BDNF, CCL2, and TLR4 genes were randomly selected for verification in the human blood samples. It is suggested that the decrease of BDNF is linked to Aβ accumulation, tau phosphorylation, neuroinflammation, and neuronal apoptosis in the pathogenesis of AD. 27 The CCL2/CCR2 chemokine axis is implicated in neurodegenerative diseases, as it recruits and migrates immune cells like monocytes and macrophages, inflicting damage on nerves and CNS cells. 28 Recent study also highlighted that blocking the TLR4 mediated Rac1/NLRP3 pathway suppressed Aβ-triggered activation of microglia, reduced pro-inflammatory mediators, and ameliorated cognitive deficits in AD mice. 29 In consistence with these findings, we observed the significantly reduced BDNF and elevated CCL2/TLR2 levels in AD patients, and the alterations of these NETs genes suggested the vital role of NETs in AD progress.
Previous study identified 153 differentially expressed, immune-related genes associated with AD, including various immune cell types such as T cells, B cells, macrophages, NK cells, and others. 30 Similarly, we identified immune-related genes, and further categorized patients with AD into two distinct subgroups with disparate immune infiltration patterns. The AD_2 subgroup exhibited elevated levels of naive B cells, eosinophils, and activated NK cells, whereas the AD_1 subgroup displayed a higher abundance of activated dendritic cells, monocytes, and neutrophils. The presence of distinct immune cell populations in AD subgroups implies a complex interplay between the immune infiltration and neurodegenerative processes. Indeed, immune infiltration, specifically the involvement of immune cells in the brain, has gained significant attention in the context of AD. 31 While traditionally considered a disease primarily driven by neuronal dysfunction and pathology, emerging evidence suggests that immune cells play a crucial role in the progression and pathogenesis of AD. 32 Studies have shown the presence of T cells, B cells, and monocytes/macrophages in the brains of AD patients, in consistence with our AD_2 subgroup.33–35 These infiltrating immune cells can interact with microglia, modulate neuroinflammation, and influence disease progression. Microglia, the resident immune cells of the CNS, are known to be activated in AD. 36 These cells are involved in the clearance of amyloid-beta and other debris, and they also release inflammatory molecules. In AD, microglia can adopt either a pro-inflammatory or anti-inflammatory phenotype, depending on the disease stage and context. In addition to microglia, peripheral immune cells can infiltrate the brain in response to AD-related pathology. 37 Disruption of immune responses in the brain can lead to chronic inflammation, exacerbating neuronal damage and impairing synaptic function. Conversely, immune cells may also contribute to the clearance of toxic protein aggregates and facilitate tissue repair. Therefore, targeting specific immune cell subsets or modulating their activation states holds promise for impeding the progression of AD and alleviating associated cognitive impairments. A comprehensive understanding of the dynamic nature of immune infiltration in AD is vital for the development of innovative therapeutic strategies.
We proceeded to conduct an in-depth exploration of the DEGs between the two subgroups of AD. Our analysis unveiled a total of 297 DEGs, which exhibited functional enrichments in diverse processes, notably involving the modulation of chemical synaptic transmission, channel activity, and neuroactive ligand‒receptor interaction. These findings underscore the significant heterogeneity present within AD, posing formidable challenges for its treatment. Moreover, by constructing a protein‒protein interaction network, we identified 18 hub genes among the DEGs. The identification of these hub genes offers potential targets for therapeutic intervention in AD patients. However, there are limitations in our study. Firstly, the different brain regions the samples come from are available in the RNA data from GEO repository. Due to the limitations in sample collection and experimental design, the sample size and data quality we did not analyzed the differences between brain regions. Also, since we only obtained 10 blood samples from AD patients, the sample size of our study may not be sufficient to verify the gene changes in AD pathogenesis that we observed from the GEO repository. Therefore, a larger cohort might reveal additional DEGs from different brain regions and provide a more comprehensive understanding of the molecular mechanisms underlying AD heterogeneity. Additionally, the functional enrichments we observed are based on computational predictions and require further preclinical experimental validation to confirm their biological relevance. Furthermore, our protein-protein interaction network analysis may overlook important interactions or pathways due to inherent biases in available data or network construction methods. Future studies incorporating multi-omics data integration and functional experiments are warranted to validate our findings and provide further insights into potential therapeutic targets for AD.
In conclusion, our study provides evidence of dysregulated expression of NET-related genes in AD and suggests that NETs may contribute to AD pathogenesis. Further investigations are needed to fully understand the role of NETs in AD and to explore the potential of targeting these pathways for AD diagnosis and treatment.
Supplemental Material
sj-docx-1-alz-10.1177_13872877241295374 - Supplemental material for Identification of key neutrophil extracellular trap genes in Alzheimer's disease
Supplemental material, sj-docx-1-alz-10.1177_13872877241295374 for Identification of key neutrophil extracellular trap genes in Alzheimer's disease by Hengming Pan, Ge Wang, Zhichao Bi, Chao Lai and Min Wang in Journal of Alzheimer's Disease
Footnotes
Acknowledgments
The authors have no acknowledgments to report.

Author contributions
Funding
The authors received no financial support for the research, authorship, and/or publication of this article.
Declaration of conflicting interests
The authors declared no potential conflicts of interest with respect to the research, authorship, and/or publication of this article.
Data availability
The data supporting the findings of this study are available on request from the corresponding author. The data are not publicly available due to privacy or ethical restrictions.
Supplemental material
Supplemental material for this article is available online.
References
Supplementary Material
Please find the following supplemental material available below.
For Open Access articles published under a Creative Commons License, all supplemental material carries the same license as the article it is associated with.
For non-Open Access articles published, all supplemental material carries a non-exclusive license, and permission requests for re-use of supplemental material or any part of supplemental material shall be sent directly to the copyright owner as specified in the copyright notice associated with the article.
