
Abstract
Background
Alzheimer's disease (AD) is characterized by complex pathological mechanisms, with pyroptosis potentially contributing to neuroinflammation.
Objective
To identify pyroptosis-related genes (PRGs) in AD and explore their role in neuroinflammation, aiming to provide potential biomarkers and therapeutic targets for precision medicine in AD treatment.
Methods
Transcriptomic data from AD brain tissues (GEO database) were analyzed using multi-omics integration and machine learning. Key PRGs were screened via weighted gene co-expression network analysis (WGCNA), LASSO regression, random forest, and SVM-RFE algorithms. Molecular subtypes and therapeutic potential were assessed through unsupervised clustering and molecular docking.
Results
Analysis identified 609 differentially expressed genes (DEGs), with upregulated genes enriched in DNA transcription and mitosis-related pathways. Six core PRGs (MIB1, TUG1, GATA1, CA1, CFH, IL17A) demonstrated strong diagnostic accuracy (AUC > 0.85). Unsupervised clustering revealed two AD subtypes: a high-risk subtype with activated pyroptosis-inflammatory pathways and distinct immune microenvironment features (p < 0.05). Molecular docking confirmed stable binding between CFH and the anti-AD drug candidate fludrocortisone (binding energy < −7 kcal/mol).
Conclusions
Pyroptosis modulates neuroinflammation to drive AD progression. CFH and other PRGs serve as promising biomarkers and therapeutic targets, advancing precision strategies for AD subtyping and intervention.
Keywords
Introduction
Alzheimer's disease (AD) is a neurodegenerative disorder characterized by a gradual decline in cognitive function, with a significant increase in incidence as age progresses.1,2 It is estimated that there are currently over 50 million people worldwide with dementia, with approximately 60–70% being AD patients, and this number is projected to rise to 150 million by 2050. 3 The hallmarks of AD include the deposition of beta-amyloid protein in the brain, neurofibrillary tangles, neuronal loss, and brain atrophy.4–7 The prevalence of AD is rising at a significant rate globally, posing unprecedented challenges to the global public health system.8,9
Pyroptosis is a form of programmed cell death closely associated with inflammatory responses, characterized by the formation and activation of inflammasomes, leading to the formation of pores in the cell membrane, ultimately causing cell lysis and the release of inflammatory mediators. 10 In recent years, studies have suggested that pyroptosis may play a role in a variety of neurodegenerative diseases, including Parkinson's disease and amyotrophic lateral sclerosis.11–13 For example, in Parkinson's disease, GSDMD-mediated pyroptosis occurs in the substantia nigra striatal pathway of animal models. 14 In AD, the abnormal aggregation of host protein deposits can activate the NLRP3 inflammasome, triggering an innate immune response that exacerbates inflammation and leads to cell death. 15 These studies indicate that pyroptosis not only participates in the pathological processes of neurodegenerative diseases but may also serve as a potential target for their treatment.
In biomedical research, machine learning, especially in gene expression data analysis, have become a key tool for identifying disease-related biomarkers and therapeutic targets.1,16 By analyzing gene expression data for specific diseases, such as prostate and breast cancer, machine learning models can identify key genes that distinguish normal from tumor samples and reveal the heterogeneity of diseases.17–19 For instance, the PAM50 gene expression profiling technique, applied in breast cancer research, not only helps identify patients with different pathological subtypes of breast cancer but also provides a basis for the formulation of personalized treatment plans.20,21 The application of such technology demonstrates the potential of machine learning in disease classification and the formulation of treatment strategies, especially in complex diseases like AD, where it may help identify early biomarkers, predict disease progression, and guide the development of new therapeutic approaches.
This study will use high-throughput gene expression data and machine learning to not only conduct an in-depth analysis of the molecular typing of AD but also explore the potential roles of pyroptosis and immune cell infiltration in AD, providing new research directions and molecular markers for the diagnosis and treatment of AD. These findings are expected to pave new avenues for future research and clinical applications in AD.
Methods
Data download
We initially utilized the GEOquery package in R to download gene expression datasets GSE18309, GSE132903 and GSE97760 from the GEO database. 22 Subsequently, we preprocessed the data, which included checking data categories, extracting expression matrices, and conducting preliminary visualization analysis using box plots. Then, we applied the normalizeBetweenArrays function from the limma package to standardize the data and performed logarithmic transformation to stabilize variances. To match gene expression data with gene symbols, we extracted gene annotation information from the GPL6947 platform annotation file and merged it with the expression data, removing duplicate gene symbols to ensure data accuracy. Additionally, we extracted clinical information from the GEO dataset and divided the samples into control (CTL) and AD groups based on the status:ch1 field.1
Batch effect removal
We integrated gene expression data from GSE18309 and GSE97760 to eliminate batch effects and proceed with subsequent analysis. First, we extracted gene lists from each dataset, identified the intersection of genes, and merged the datasets into a single data frame based on these common genes. Then, we used the ComBat function to correct for batch effects in the merged data to reduce technical variations between different datasets. Furthermore, we defined a bioPCA function to perform principal component analysis (PCA), which read the merged and standardized data file, executed PCA, and visualized the results as a PCA plot using the ggplot2 package, where different project types are represented by different colors and confidence ellipses are added. Finally, we also further filtered specific gene expression data.
Differential analysis
In this study, we first loaded the data file containing gene expression data and sample grouping information, ensuring data consistency. Then, we employed the limma package to fit a linear model and perform Bayesian statistical tests to identify differentially expressed genes (DEGs). Based on P-values and logarithmic fold changes (logFC), we filtered and categorized significantly DEGs. Additionally, we used the ggplot2 and cowplot packages to plot volcano plots to visualize gene expression changes and quickly identify statistically significant DEGs through color coding and reference lines. Lastly, we selected the most significantly upregulated and downregulated genes from the DEGs dataset and generated a heatmap using the pheatmap function to visually display the expression patterns of these genes across different sample.
Enrichment analysis
We utilized the org.Hs.eg.db and clusterProfiler packages to convert the gene list from gene symbols to Entrez IDs and filtered out genes with valid Entrez IDs. Then, we performed Gene Ontology (GO) enrichment analysis on these genes using the enrichGO function, setting thresholds for P-values and q-values, and filtered out significantly enriched GO terms. 23 To visualize these enriched GO terms, we used the dotplot function to draw a GO dot plot, showing the distribution of genes across various GO terms; subsequently, we generated a network diagram between GO terms using the cnetplot function to reveal the interrelationships among these enriched GO terms.
Weighted gene co-expression network analysis (WGCNA)
We first loaded the data containing gene expression and sample grouping information, and selected highly variable genes by calculating the variance and choosing genes with variance in the top 50%. Then, we performed a series of systems biology analyses using functions from the WGCNA package, 24 including quality control of samples and genes, sample clustering to identify outlier samples, and gene clustering based on the topological overlap matrix. We determined the optimal power value to construct the topological overlap matrix and performed dynamic tree cutting to identify distinct gene modules. Additionally, we conducted correlation analysis between modules and phenotypic data, and visualized these relationships.
Venn diagram
In this study, we first read the gene list of the module with the highest correlation from WGCNA. Then, we extracted the list of DEGs and selected genes with significant expression changes. Furthermore, we extracted a list of genes related to pyroptosis from GeneCards. Subsequently, we used the ggvenn package to draw a Venn diagram of these three gene sets to visually display their intersections and differences. Finally, we calculated the intersection of these three gene sets using the Reduce and intersect functions.
Machine learning
In this study, we comprehensively applied three advanced statistical methods: Least Absolute Shrinkage and Selection Operator (LASSO) regression, Random Forest (RF), and Support Vector Machine Recursive Feature Elimination (SVM-RFE), aiming to identify key genes closely related to sample grouping. By loading the relevant datasets, setting a random seed to ensure reproducibility of results, and using the glmnet package to determine the optimal regularization parameter λ value in LASSO regression, we successfully extracted a significant set of genes. Additionally, the RF model constructed using the randomForest package further identified the most important genes in gene expression data, while the SVM-RFE method aided in feature selection and evaluated model performance under different numbers of features, recording and plotting error rates and performance charts. Furthermore, we assessed the diagnostic efficacy of specific genes in distinguishing different sample states through Receiver Operating Characteristic (ROC) analysis, providing important reference indicators for clinical applications.
Immune infiltration analysis
We loaded data containing sample clustering information, cell marker gene sets, and filtered gene expression matrices. Then, we used the GSVA algorithm to perform ssGSEA analysis on the gene expression matrix to assess the level of immune cell infiltration in samples. The analysis results were combined with clustering information, converted into a data format suitable for ggplot2 input, and boxplots were drawn using ggboxplot to compare differences in immune infiltration levels among different clustering groups, with Wilcoxon rank-sum tests to evaluate the statistical significance of inter-group differences. Additionally, we conducted a correlation analysis on the selected key gene sets, generated a correlation matrix, and used the corrplot package to draw a correlation heatmap. Finally, we converted the correlation results between gene expression data and immune infiltration levels into a data format suitable for ggplot2 and drew a heatmap with correlation sizes and significance markers to visually display the relationship between gene expression and immune infiltration levels.
Molecular typing
We selected six key genes and used ConsensusClusterPlus for clustering the expression data of these genes to explore the potential structure between samples. We set the maximum number of clusters to 6 and performed 1000 resamplings, using the PAM algorithm and Ward.D2 linkage method based on Euclidean distance for clustering. Then, we conducted PCA to reduce data dimensionality and visualized the PCA results using the factoextra package to show the distribution of different clustering groups. Additionally, we combined the clustering results with gene expression data and used ggplot2 and ggpubr packages to draw boxplots to compare differences in gene expression among different clustering groups, and performed Wilcoxon rank-sum tests to evaluate the statistical significance of inter-group expression differences.
Molecular docking
To delve into the expression patterns of key genes and identify potential small molecule compounds for therapeutic use, we initially screened for drugs with complete data through the CMap database. We then selected the top-scoring drugs based on their drug scores and the logarithmically transformed p-values, which indicate a higher score for better therapeutic potential and a larger value for a smaller p-value, respectively. Subsequently, we obtained the 3D structures of these drugs from the PubChem database and saved them in pdb format. Concurrently, we retrieved the protein structures encoded by the key genes from the PDB database and used Pymol software to dehydrate these protein structures in preparation for molecular docking. We then imported the processed proteins and small molecule drugs into AutoDockTools to construct the docking grid box and visualized the docking results using PyMOL software. This process aims to uncover the interactions between key genes and small molecule compounds, providing a scientific basis for the discovery of new therapeutic methods.
Quantitative reverse transcription polymerase chain reaction (qRT-PCR)
This study collected serum samples from three patients with AD and three healthy controls at the Fourth Hospital of Changsha. All subjects provided written informed consent, and the study was approved by the Ethics Committee of the Fourth Hospital of Changsha ((Ethics review number: CSSDSYY-YXLL-SC-2024-03-25). Serum samples were collected after routine clinical examinations and immediately centrifuged (3000×g, 10 min, 4°C). The supernatants were separated and stored at −80°C for subsequent RNA extraction. All experiments in this study used TransGen Biotech reagents. RNA was extracted using a serum RNA extraction kit and its purity (A260/A280 ratio) was determined by a NanoDrop spectrophotometer, all above 1.8. Subsequently, RNA was reverse transcribed into cDNA using a reverse transcription kit for qRT-PCR analysis. Data analysis was performed using the 2−ΔΔCt method to calculate the relative expression levels of target genes, with GAPDH as the reference gene for normalization. p < 0.05 was considered statistically significant.
Results
Integrated analysis of AD and CTL group expression profiles reveals key differential genes and their functions
We obtained expression profile data from 28 patients using GSE18309 and GSE97760, including 13 controls and 15 AD cases (Figure 2A). After batch effect removal, we obtained merged data without batch effects for both groups (Figure 2B). Upon differential analysis of this merged data, we identified 609 differential genes between AD and control groups, with 307 downregulated genes and 302 upregulated genes, which are presented in the form of a volcano plot (Figure 2C) The top 20 differential genes were displayed using a heatmap, and it was observed that they exhibited significant differences between the control and AD groups (Figure 2D). Subsequent GO enrichment analysis revealed that the upregulated genes were primarily enriched in pathways related to mitotic nuclear division, DNA binding transcription activator activity, and other related processes (Figure 2E).
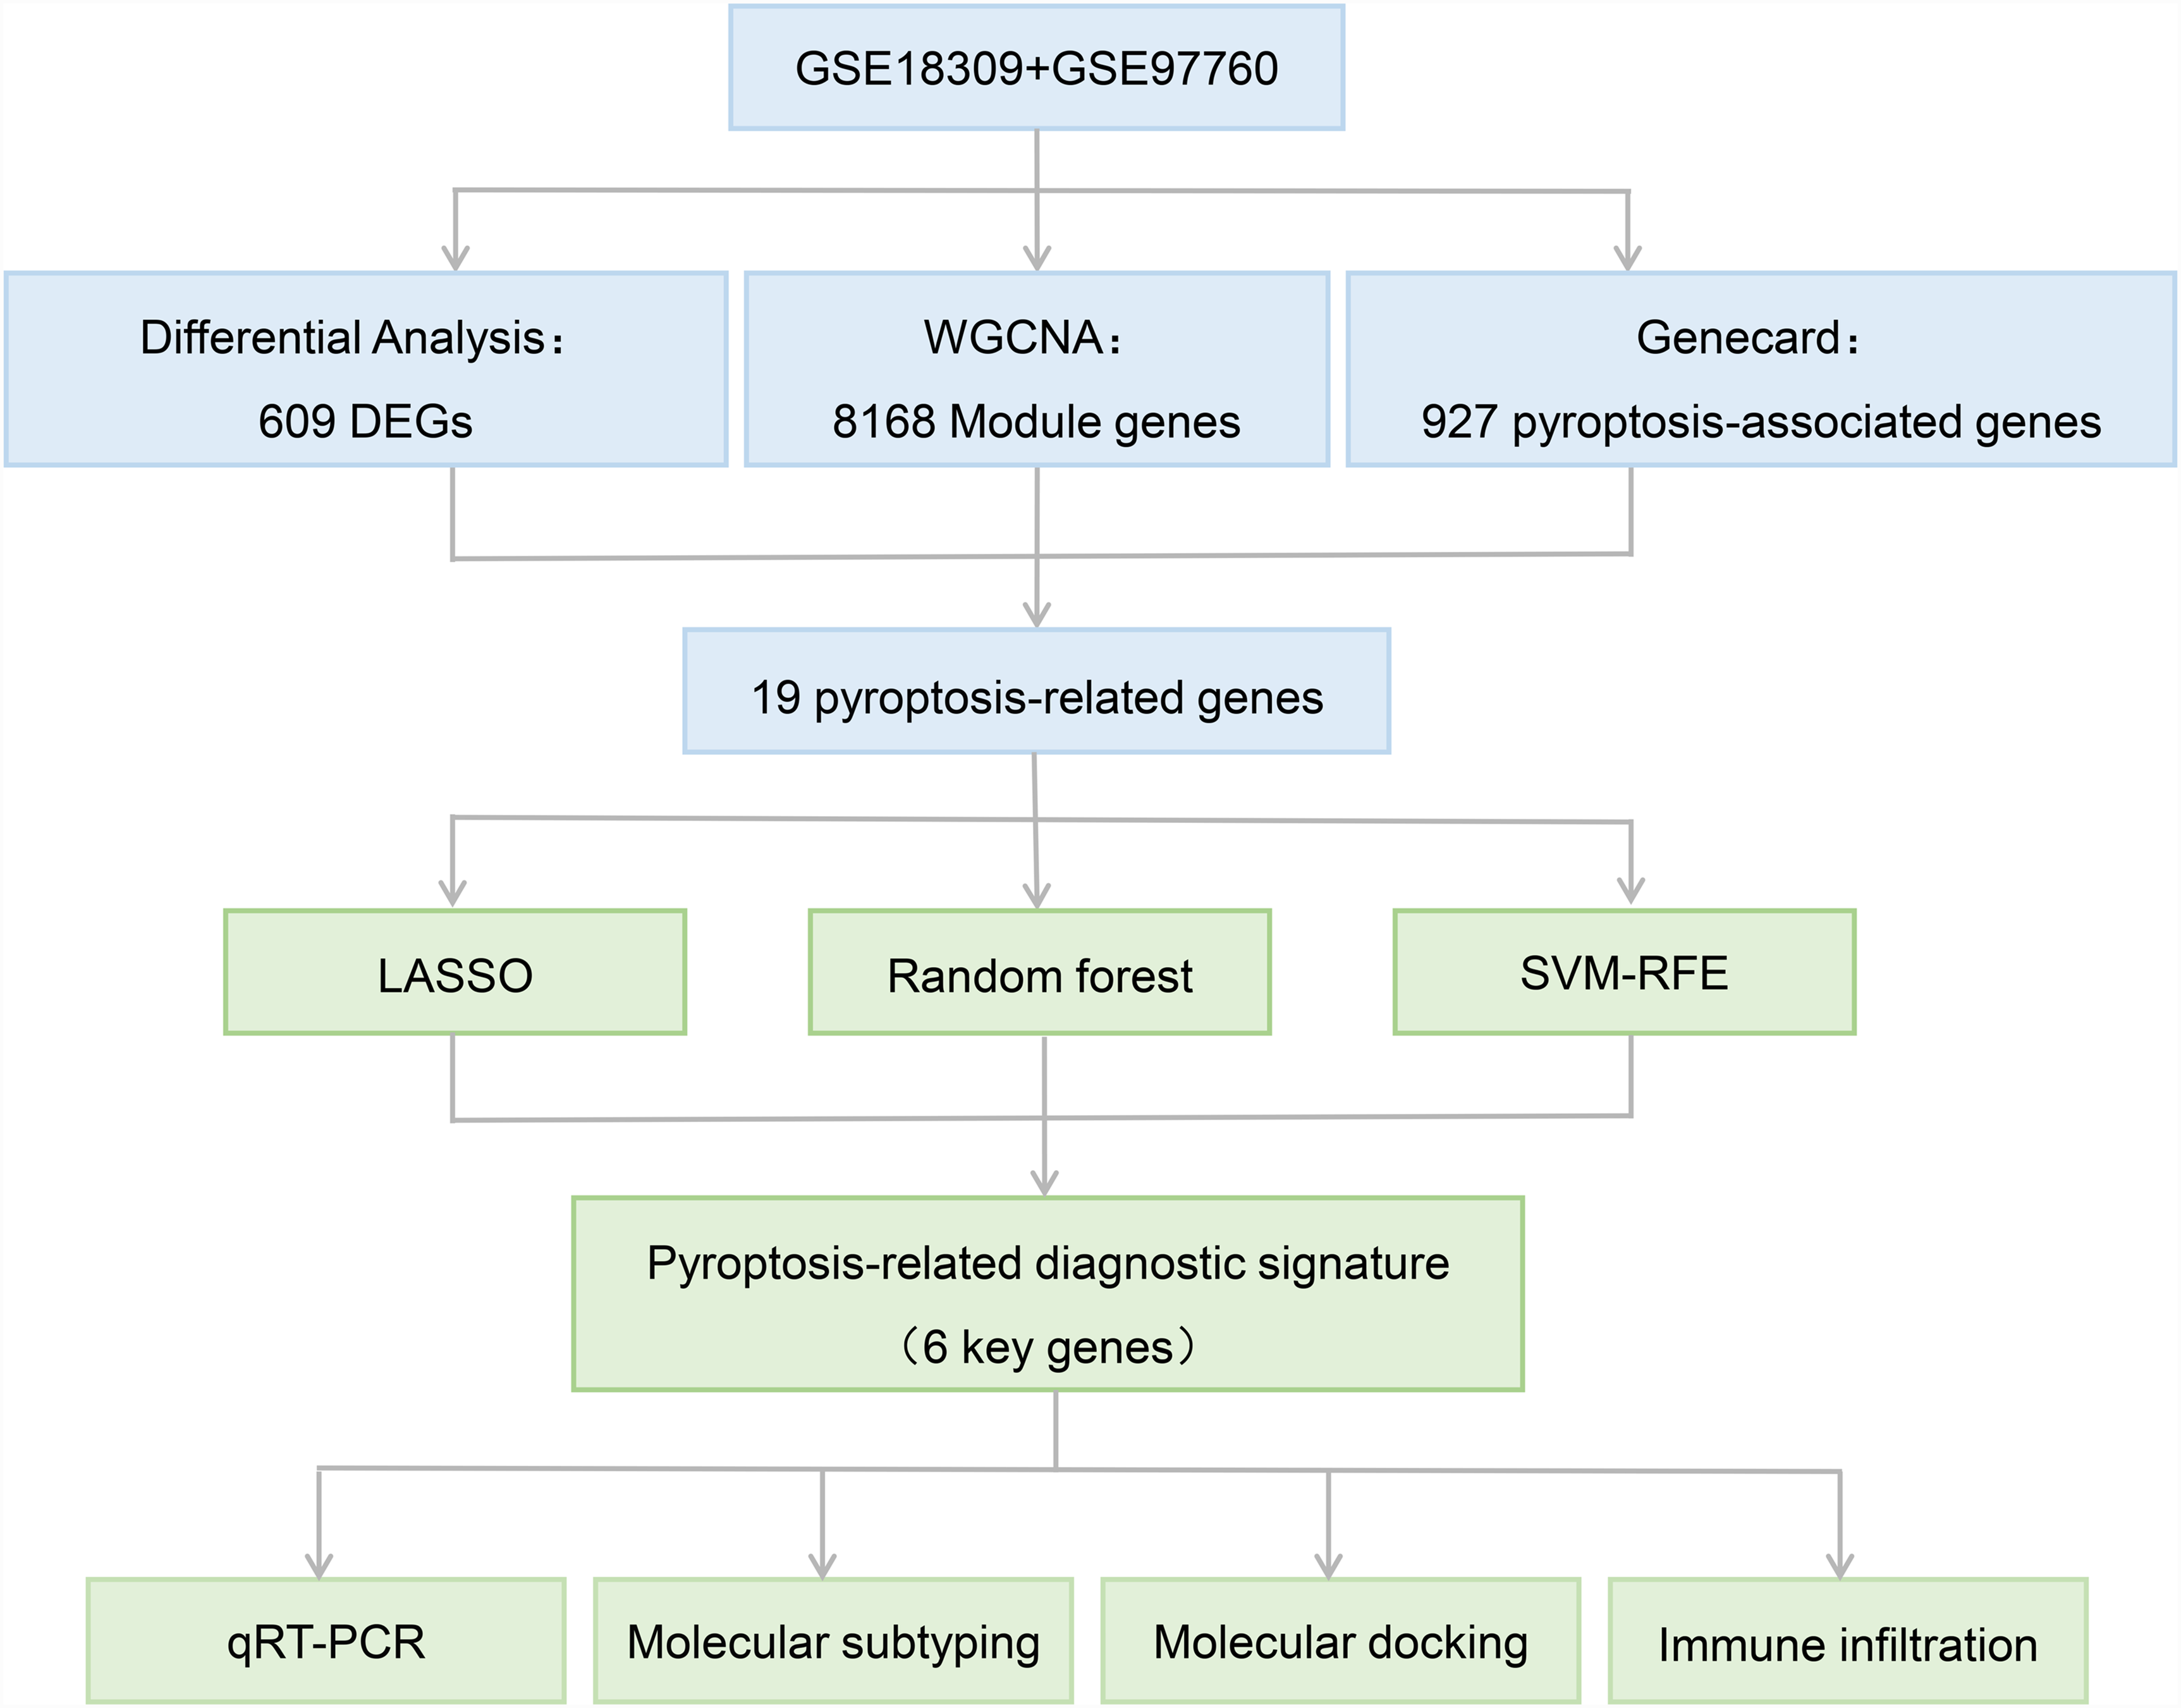
Flowchart.
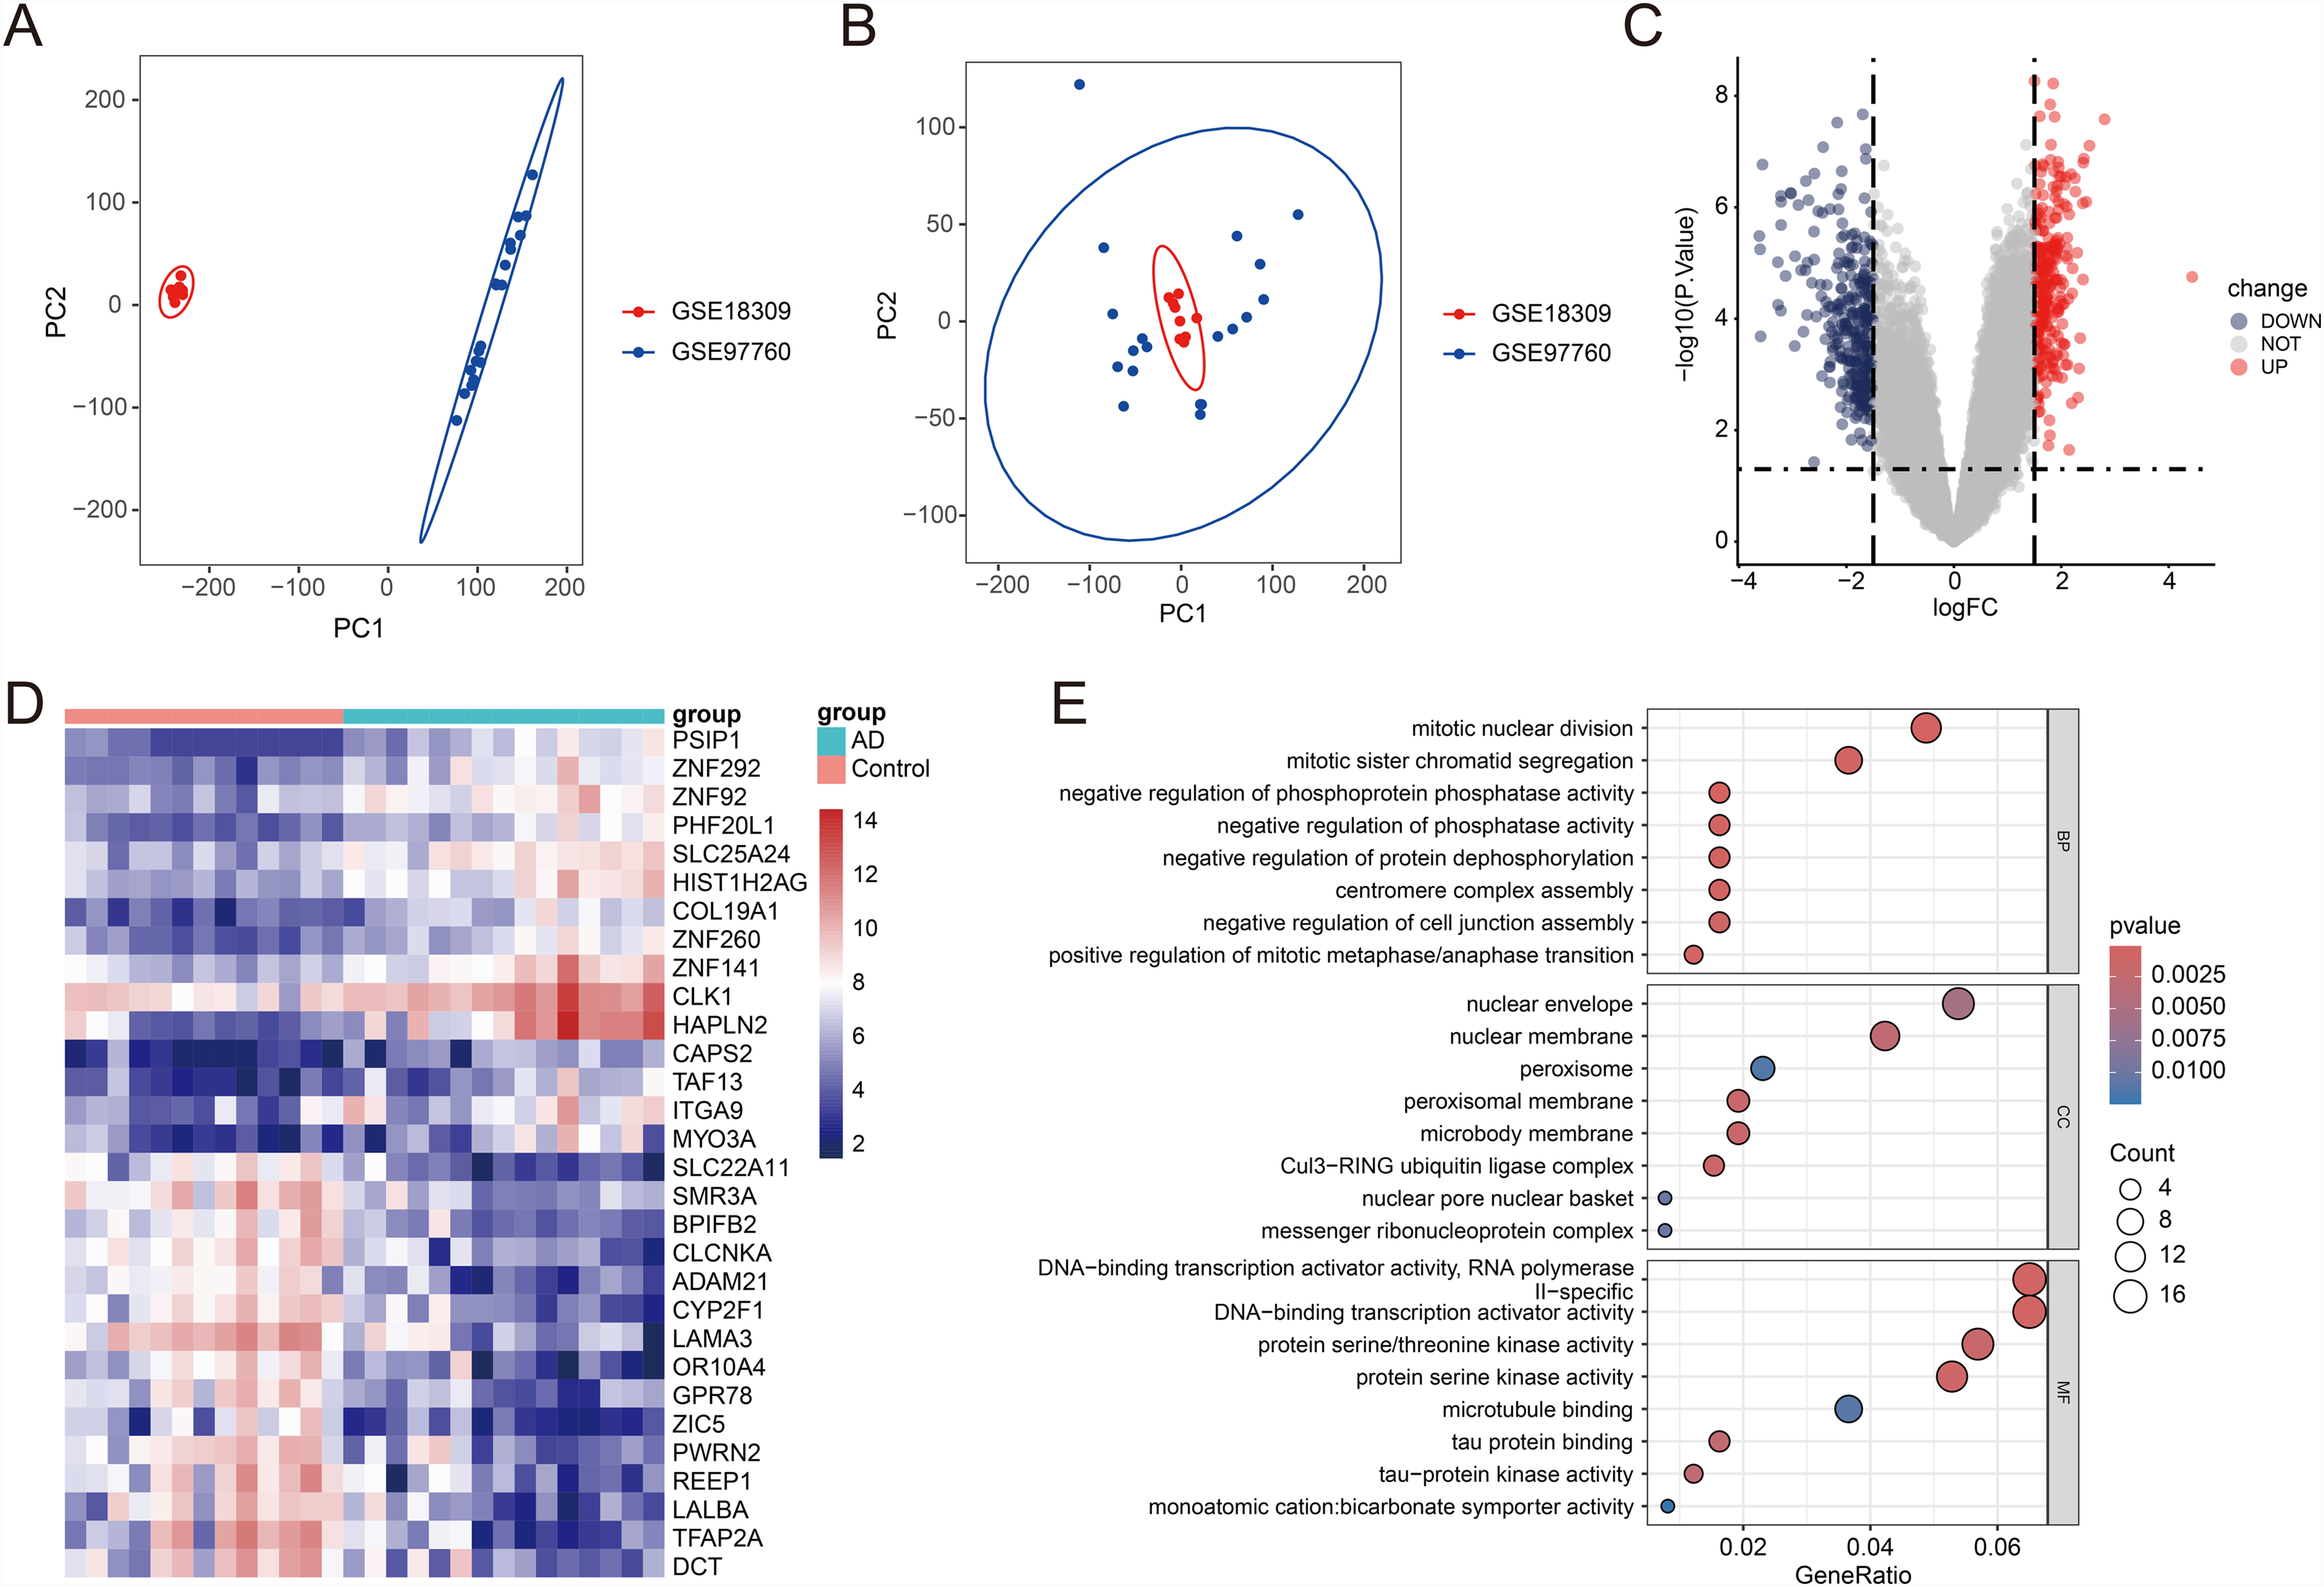
Gene expression analysis revealed differences between AD and CTL groups. (A) PCA plots showed the distribution of GSE18309 (red) and GSE97760 (blue) gene expression data. (B) The PCA plot further illustrated the distribution of GSE18309 and GSE97760 datasets in the PC1 and PC2 dimensions. (C) Volcano plot showed the significance of differentially expressed genes between the control and AD groups. (D) Heatmap showing the expression pattern of differentially expressed genes. (E) GO set enrichment analysis diagram.
Constructing WGCNA to identify key genes associated with AD
To identify genes associated with AD, we extracted the AD patient data from the previously merged data for constructing a WGCNA. First, the soft-thresholding power was determined (Figure 3A, B), and when the minimum module size was set to 100, five distinct co-expression modules were obtained through dynamic tree cutting (Figure 3C, D). Subsequently, a correlation analysis was performed between each module and clinical characteristics. The MEblue and MEturquoise modules showed the highest positive correlation with AD, while the MEbrown module showed the highest negative correlation with AD (Figure 3E). We selected the MEblue and MEturquoise modules, which included 8168 genes with the highest absolute correlation coefficients, for further analysis. By intersecting differential genes, module genes, and pyroptosis-related genes (PRGs), we identified 19 hub genes (Figure 3F).
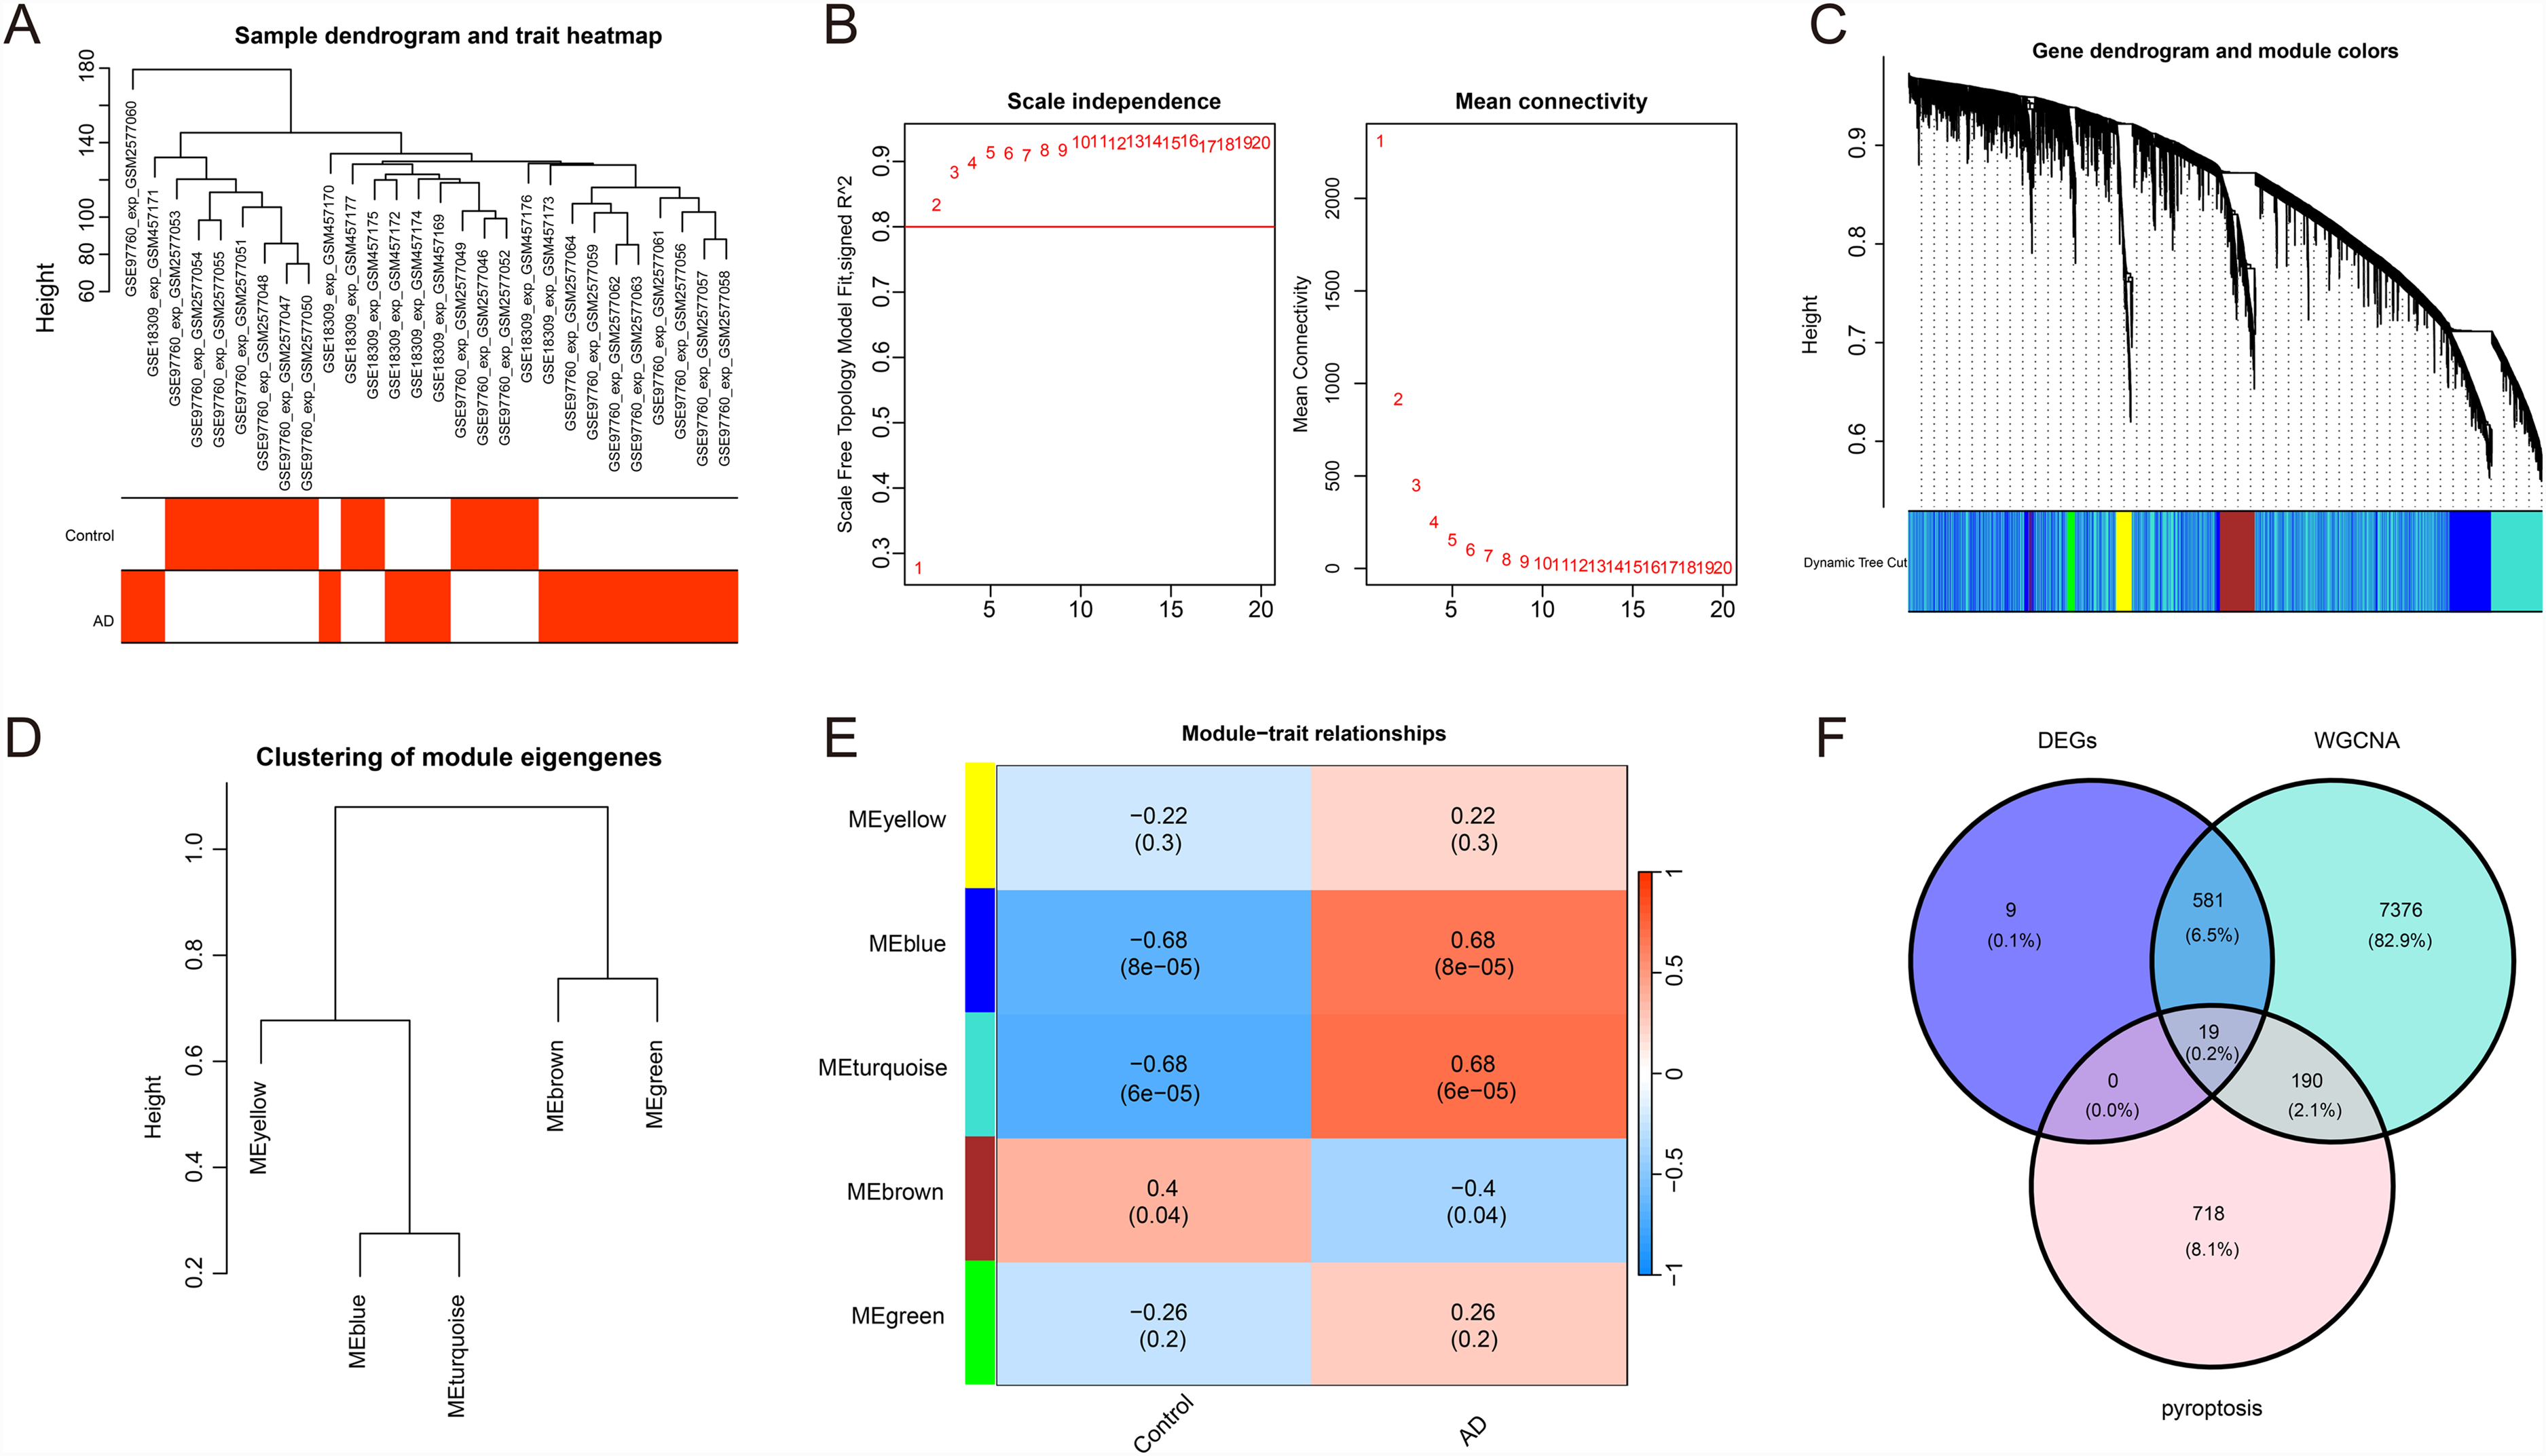
WGCNA reveals AD-related key modules and hub genes. (A, B) Determination of the soft-thresholding power; (C, D) Acquisition of five distinct co-expression modules; (E) The MEblue module and MEturquoise module show the highest positive correlation with AD, while the MEbrown module shows the highest negative correlation with AD; (F) Venn diagram, intersection of differential genes, module genes, and PRGs, resulting in 19 hub genes.
Machine learning algorithms for the selection of AD diagnostic biomarkers
Two different machine learning algorithms, LASSO and RF, were used to screen candidate diagnostic biomarkers from AD. The LASSO algorithm successfully identified 6 feature variables when the lambda value was minimized (Figure 4A, B). On the other hand, the RF algorithm effectively identified 10 feature genes by selecting the minimum cross-validation error (Figure 4C). Validation was performed using SVM-RFE, and it was found that when the number of genes was 6, the model had an accuracy of 0.908 and an error rate of 0.0924 (Figure 4D, E). Integrated algorithms identified six AD characteristic biomarkers (MIB1, GATA1, TUG1, CA1, CFH, IL17A; Figure 4F), demonstrating high diagnostic accuracy with AUC values of 0.964, 0.944, 0.938, 0.897, 0.892, and 0.877, respectively (Figure 4G-L).

Machine learning identification and efficacy analysis of AD molecular markers. (A, B) LASSO regression analysis, resulting in 6 feature variables; (C) RF, effectively identifying 10 feature genes; (D, E) SVM-RFE, when the number of genes is 6, the model has an accuracy of 0.908 and an error rate of 0.0924. (F) Venn diagram identifying 6 AD characteristic biomarkers, namely MIB1, GATA1, TUG1, CA1, CFH, and IL17A; (G-L) ROC curve of six key genes MIB1, GATA1, TUG1, CA1, CFH and IL17A in training cohort.
Validation of key genes
Validation in an independent cohort confirmed the predictive accuracy of the six AD-related genes (MIB1: AUC = 0.726; TUG1: 0.697; GATA1: 0.701; CA1: 0.706; CFH: 0.748; IL17A: 0.707; Figure 5A-F). Significant enrichment of PRGs in processes such as immune regulation and cell differentiation, along with enrichment of AD-related genes in processes like neuroinflammation and misfolded protein handling, suggests that pyroptosis may play a crucial role in the pathogenesis of AD by modulating immune responses and affecting protein metabolism (Figure 5G). The qRT-PCR experiment also demonstrated that, compared with the normal control group, MIB1, TUG1, GATA1, CA1, CFH, and IL17A were highly expressed in the AD group (Figure 5H-M). Further screening through the CMap database identified the drug with the highest relevance—fludrocortisone. Molecular docking demonstrated that there was a stable binding site between the gene CFH and the drug fludrocortisone, with a binding energy of −7.53 kcal/mol. This suggested that the drug fludrocortisone may be able to target the gene CFH and thus be beneficial for the treatment of AD (Figure 5N).
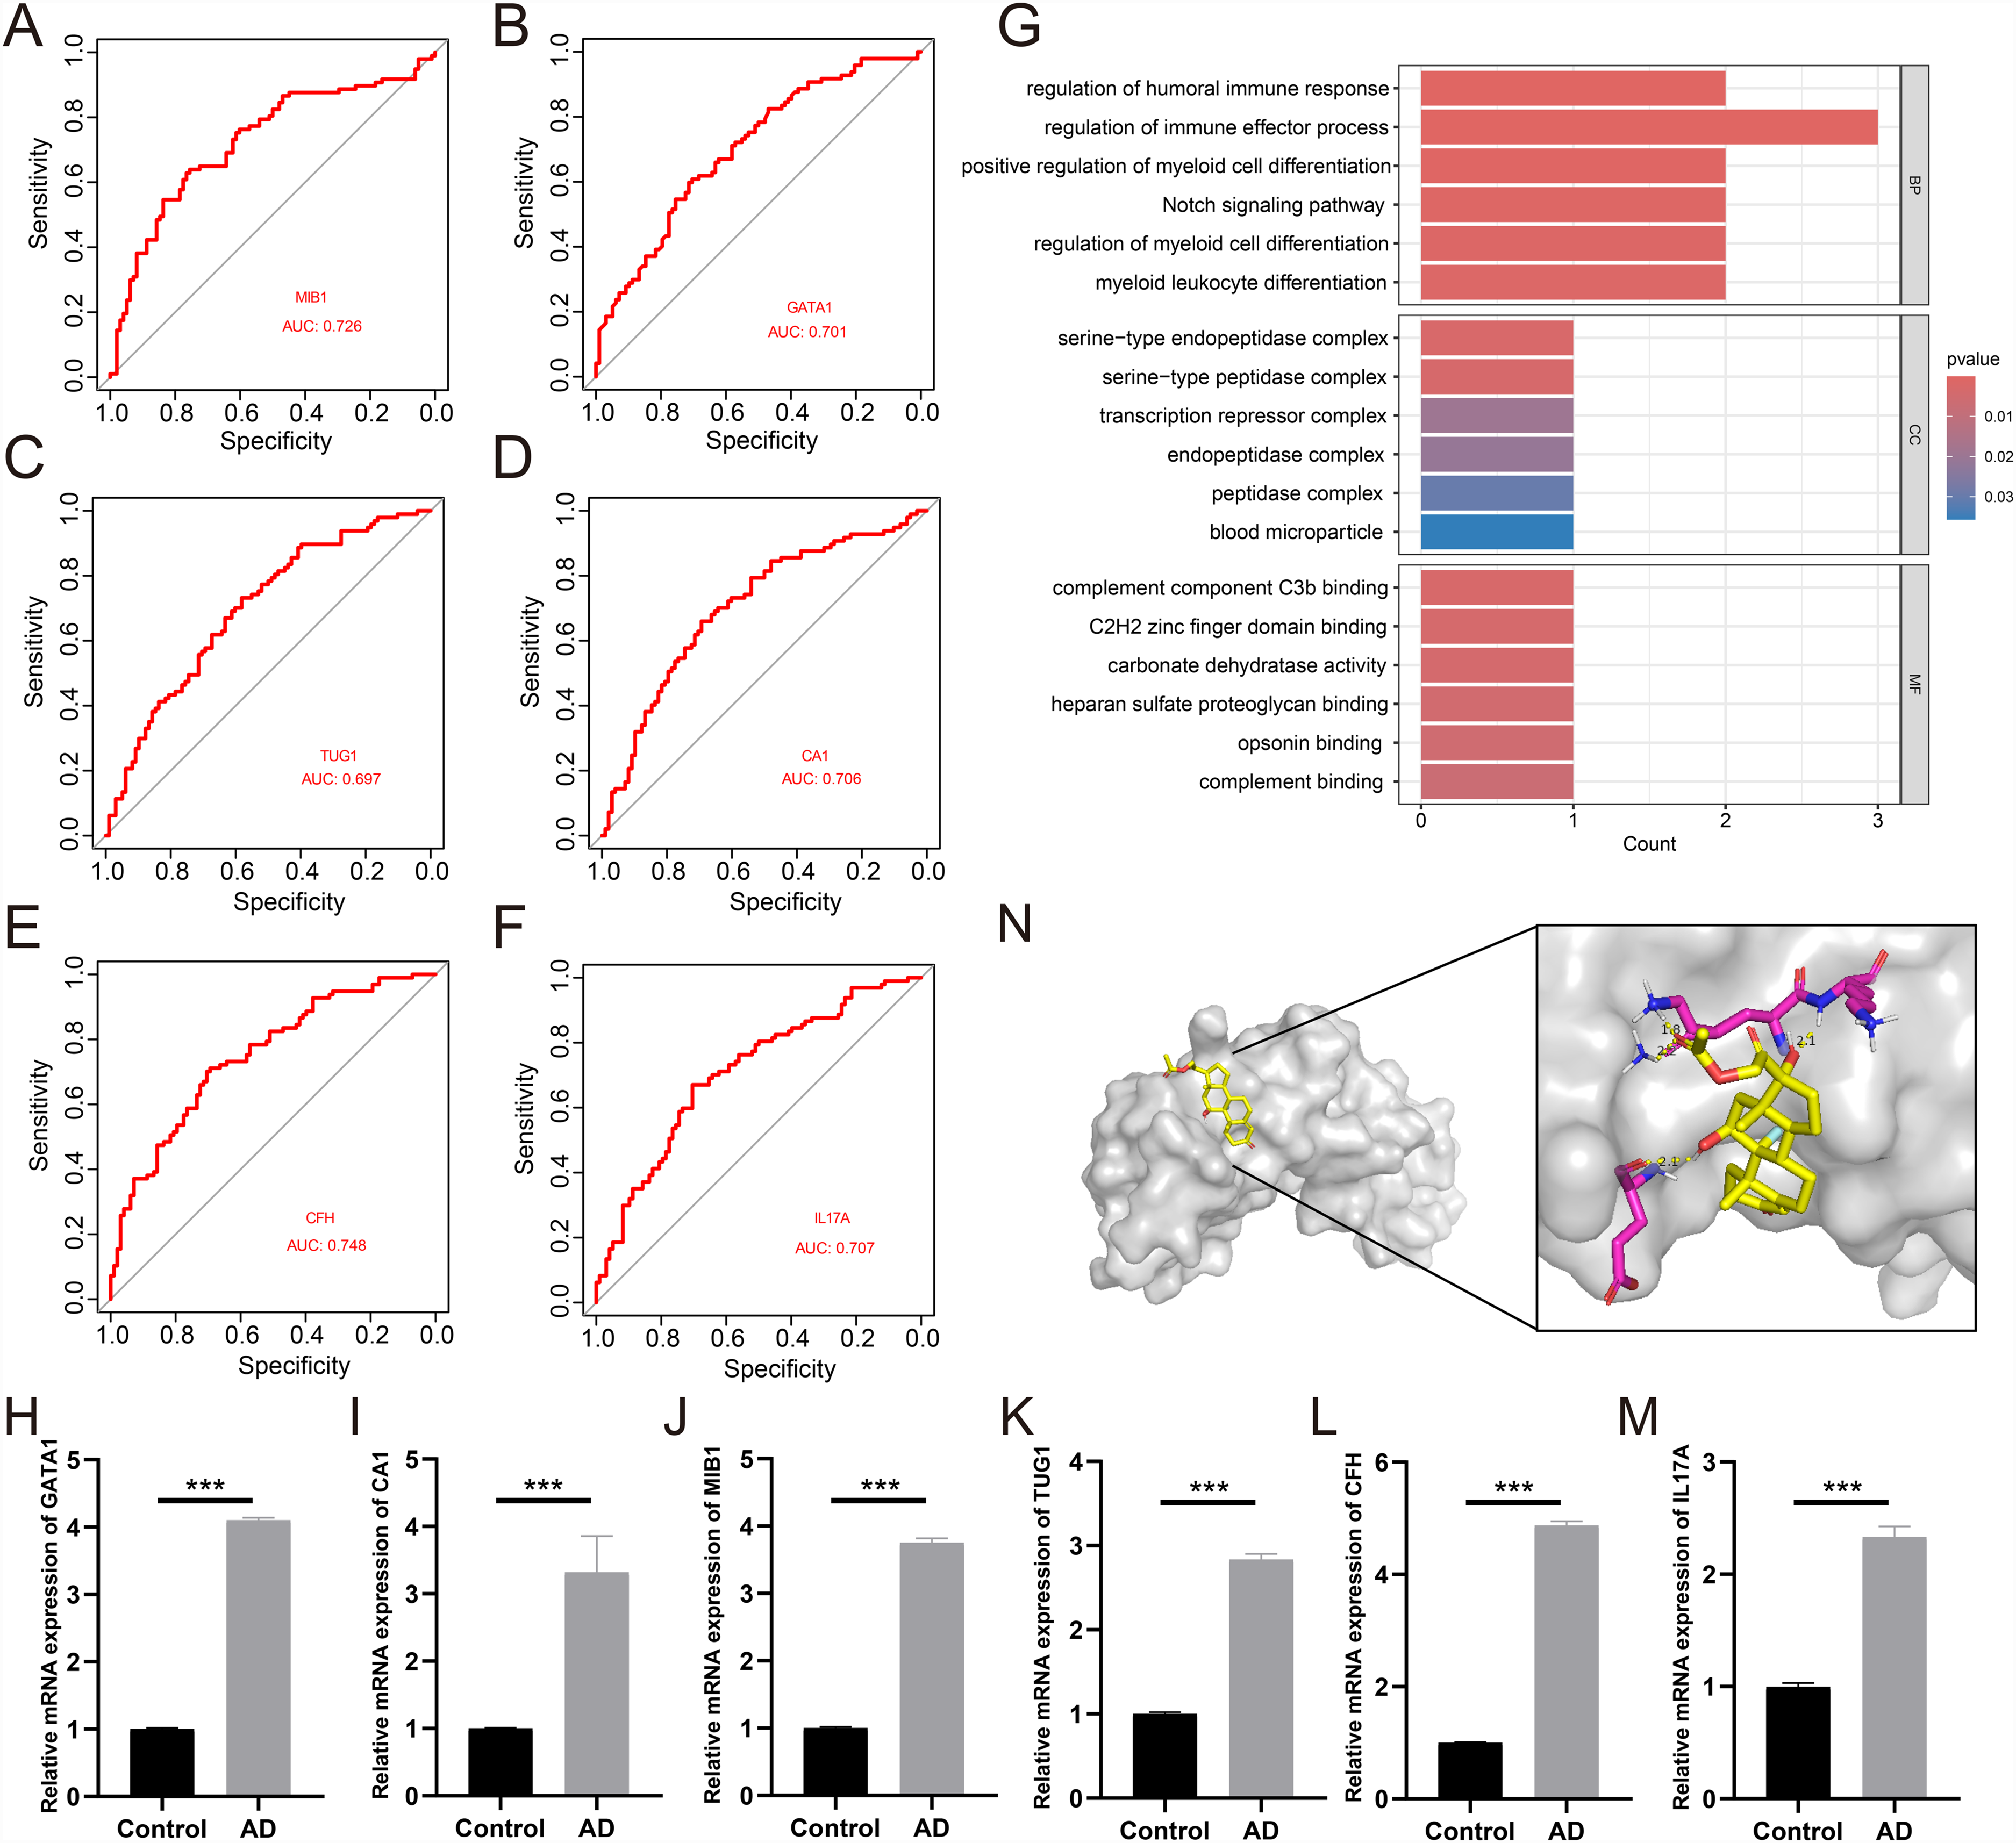
ROC curve analysis, qRT-PCR of genes and molecular docking. (A-F) ROC curve for the six key genes MIB1, GATA1, TUG1, CA1, CFH, and IL17A in validation cohort; (G) GO set enrichment analysis diagram; (H-M) qRT-PCR experiments showed the relative expression levels of the six genes in the AD group and the normal control group; (N) Molecular docking of CFH and the drug fludrocortisone.
Consensus clustering based on PRGs expression
We employed consensus clustering to investigate the molecular typing of AD based on the assessment of pyroptosis expression differences. The analysis results showed that at k = 2, there was a clearer distinction between the two sample clusters, leading to the establishment of two distinct clusters (Figure 6A-G). PCA analysis confirmed that the two clusters were well classified (Figure 6H). We further explored the expression differences of the six key genes between the two clusters, specifically finding that MIB1, TUG1, GATA1, CA1, CFH, and IL17A exhibited different expression patterns between the clusters. GATA1 and IL17A had higher expression levels in Cluster 1, while CFH had higher expression levels in Cluster 2 (Figure 6I).

Application of consensus clustering analysis and PCA in the classification of AD samples. (A) CDF plots of different modules showed the consistency of gene connectivity within the modules. (B) A plot of data regions showed the selection process for soft thresholds to ensure the scale-free nature of the network. (C-G) k = 2–6 showed the clustering and expression patterns of genes in different modules. (H) The PCA plot showed the distribution of the two modules (Cluster 1 and Cluster 2) in the principal component space. (I) Box plot showed the gene expression levels of key genes (MBI1, GATA1, TUG1, CA1, CFH, IL17A) in different modules. (*p < 0.05, **p < 0.01, ***p < 0.001, non-significant difference in ns).
Immune infiltration and immune-related factors
In the boxplot, there is a significant difference in the level of immune cell infiltration between the disease group and the normal group. In the disease group, the infiltration levels of activated CD4 T cells, CD8 T cells, effector memory CD8 T cells, effector memory CD4 T cells, central memory CD4 T cells, immature B cells, immature dendritic cells, and type 1 helper T cells are significantly increased, which may imply that these immune cell subsets play a key role in the immune response and pathological processes of the disease. In contrast, the infiltration levels of activated dendritic cells, CD56 dim natural killer cells, monocytes, and type 17 helper T cells in the disease group are lower than in the normal group, which may reflect the suppression or dysfunction of these cell subsets in the disease state (Figure 7A). The correlation heatmap shows activated CD8 T cells and effector memory CD8 T cells, which may act synergistically in the immune response. The relationship between regulatory T cells and effector T cells indicates an opposite relationship, which may reflect a regulatory mechanism to prevent excessive immune activation (Figure 7B). The heatmap highlights a strong correlation between activated CD8 T cells and the CFH gene, suggesting a significant link between CFH gene expression and the activity of these cells in the progression of AD (Figure 7C). The boxplot reveals that in Cluster2, the infiltration levels of activated CD8 T cells, effector memory CD8 T cells, immature B cells, and type 2 helper T cells are higher than in Cluster1, which may indicate a more significant involvement of these cells in the immune response or disease state of Cluster2 (Figure 7D). The correlation heatmap further suggests that there may be synergistic effects between activated CD8 T cells and activated B cells, as well as between effector memory CD8 T cells and central memory CD8 T cells, indicating their coordinated functions in the immune response (Figure 7E). At the same time, some cell types, such as natural killer cells and certain types of T helper cells, may have a negative correlation, which may imply that they play a role in mutual regulation within the immune system. The heatmap shows that the CFH gene has significantly increased expression levels with activated CD8 T cells, effector memory CD4 T cells, and effector memory CD8 T cells, which may indicate that these genes or conditions are closely related to the activation and proliferation of these immune cells (Figure 7F).
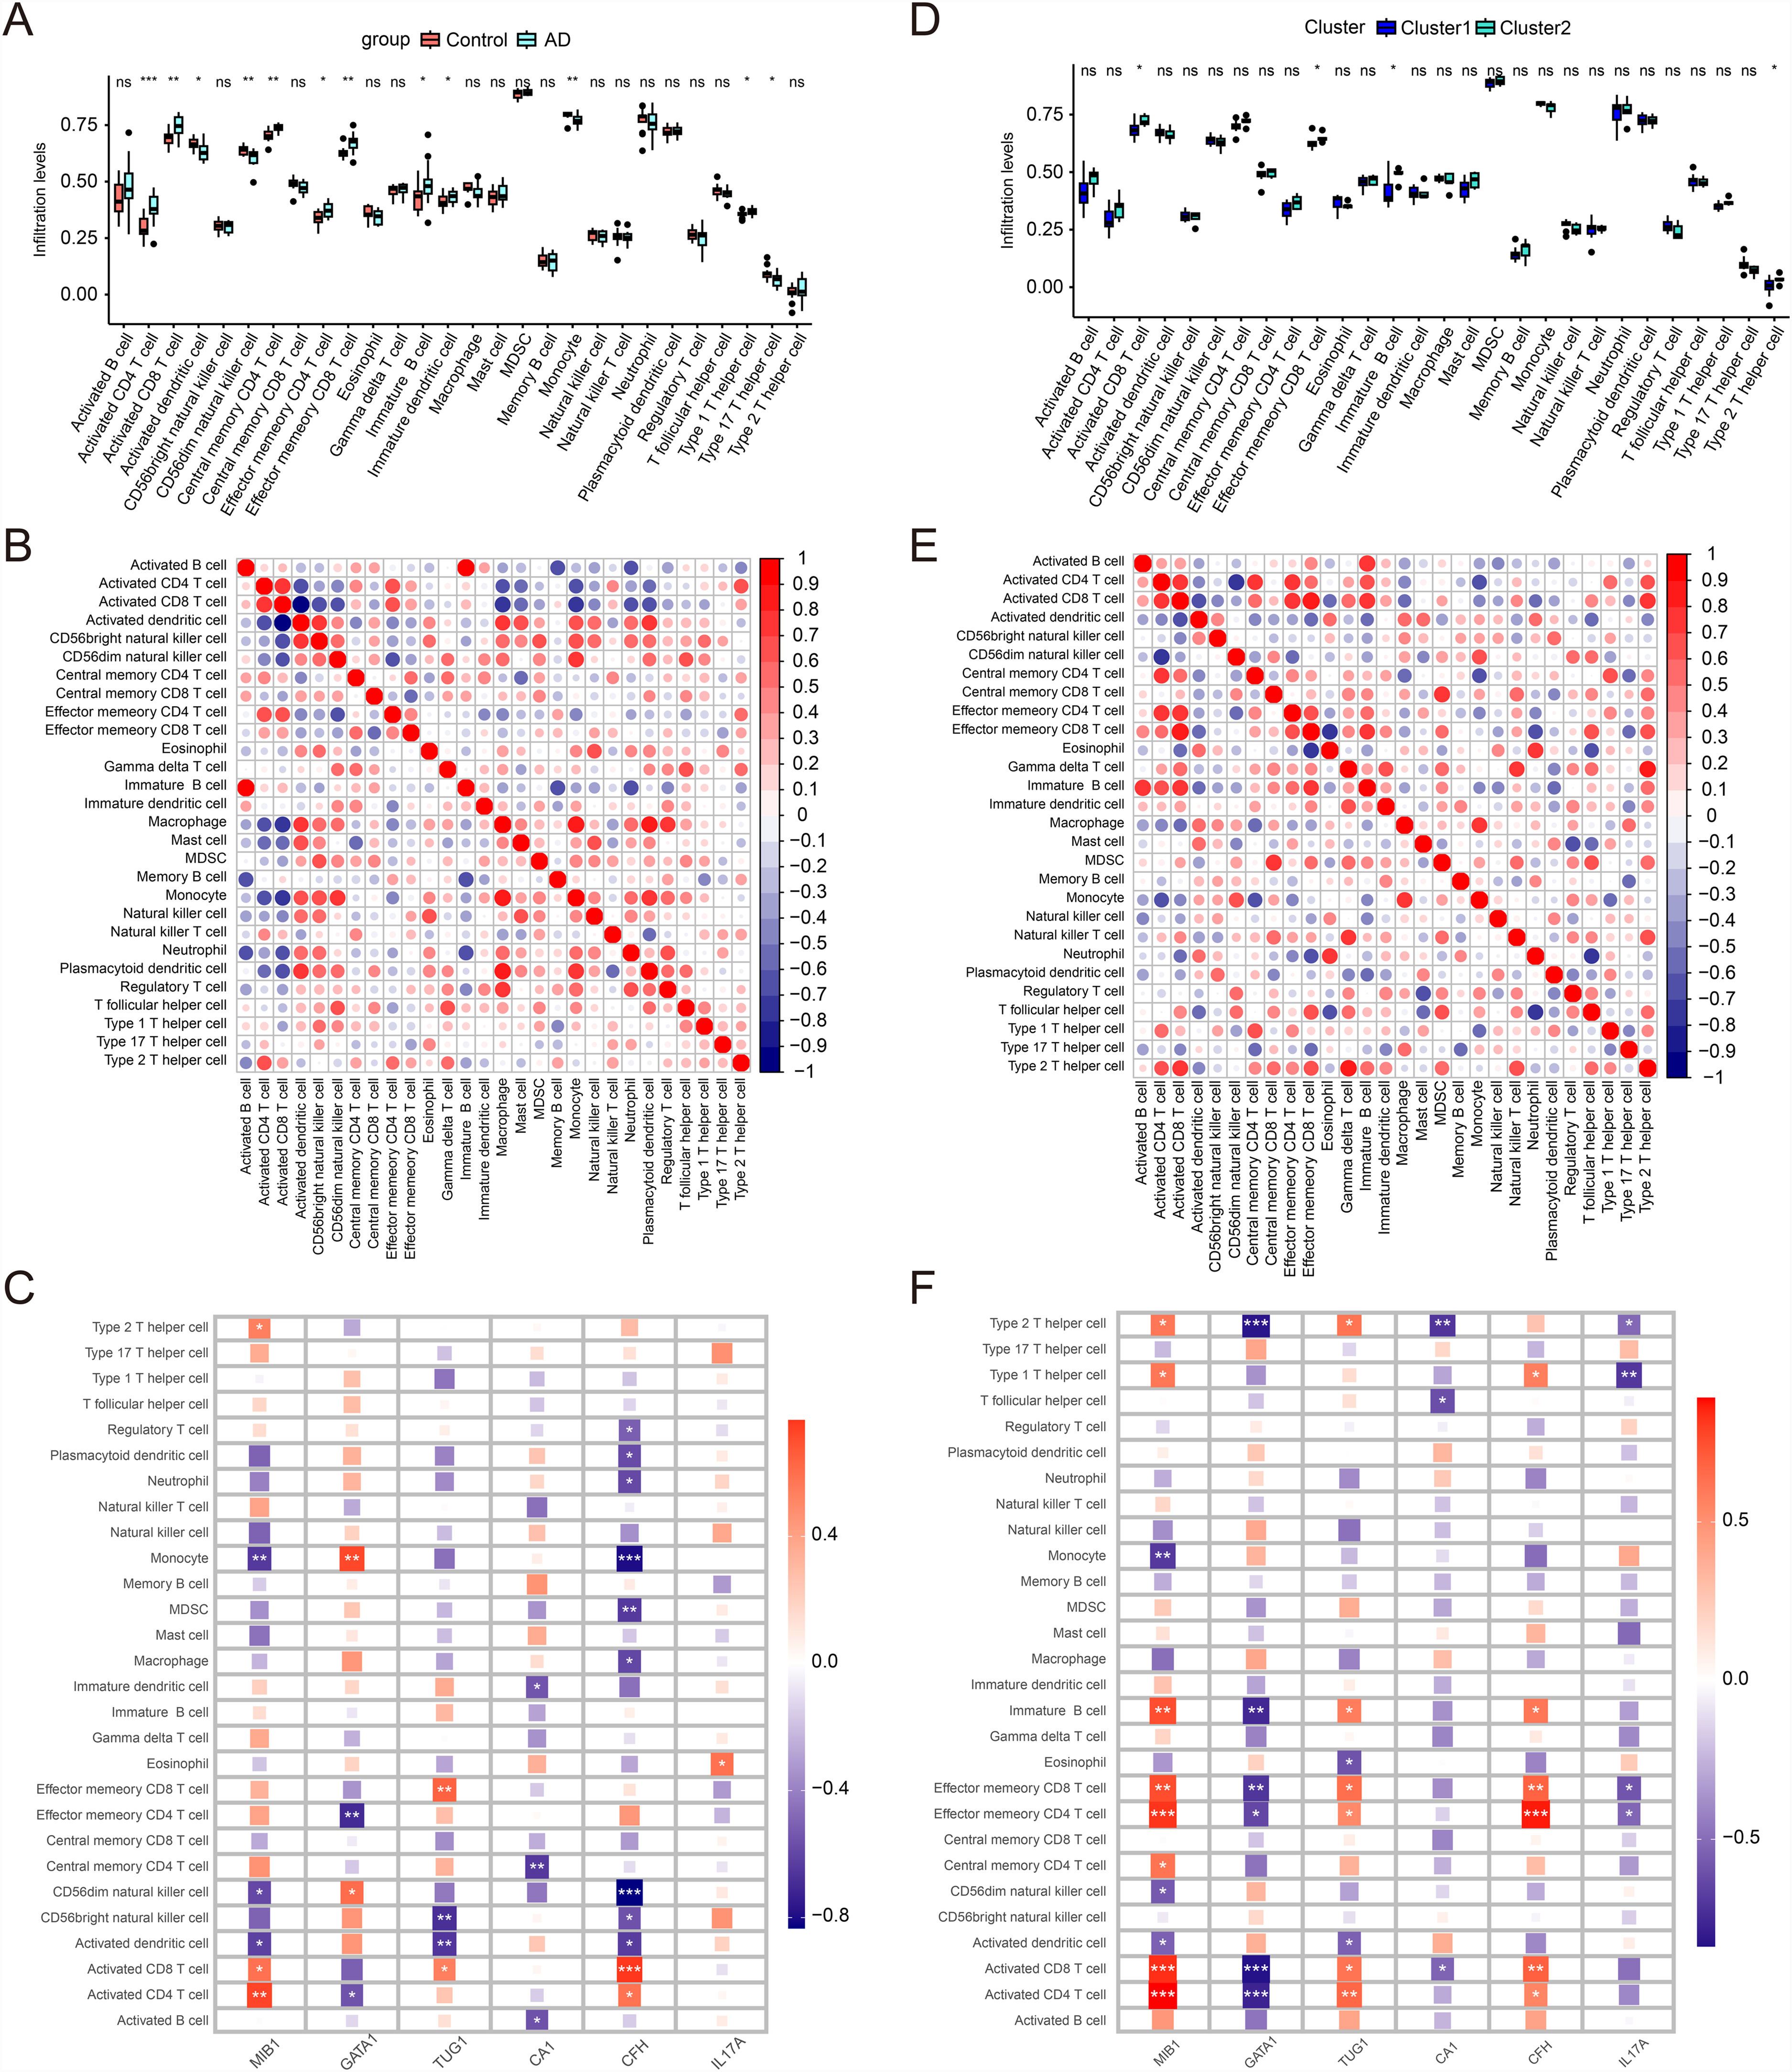
Immune microenvironment analysis. (A) Boxplot comparing the levels of immune cell infiltration between the AD group and the control group; (B) Correlation heatmap showing the correlation or expression levels of specific immune cell subsets between the AD group and control group; (C,F) Heatmap displaying the Spearman correlation between six key genes (MIB1, GATA1, TUG1, CA1, CFH, IL17A) and various immune cell types; (D) Boxplot comparing the levels of immune cell infiltration between the Cluster 1 and Cluster 2;(E) Correlation heatmap showing the correlation or expression levels of specific immune cell subsets between the Cluster 1 and Cluster 2. (*p < 0.05, **p < 0.01, ***p < 0.001, ns = non-significant difference).
Discussion
In this study, we delved into the role of pyroptosis in the pathogenesis of AD and identified potential biomarkers and therapeutic targets associated with AD. Our findings further emphasize the importance of pyroptosis in neurodegenerative diseases and provide new perspectives for future research and treatment.
In this study, we utilized high-throughput gene expression data analysis to successfully screen 609 DEGs. Notably, we observed the involvement of some upregulated genes in core biological processes such as DNA transcription and mitosis, which are closely related to neuronal damage and death in AD. The abnormal expression of these genes may disrupt the normal physiological functions of cells, thereby triggering neurodegenerative changes. The role of these upregulated genes in DNA transcription and mitosis and their connection to neuronal damage and death in AD provide us with a new perspective to deeply understand the pathological mechanisms of AD. During the transcription process, the upregulation of genes may lead to the overproduction of certain key proteins, which could directly or indirectly affect the function and survival status of neurons. 25 For instance, the upregulation of the APOE gene is closely related to the immune response of neurons and the pathological characteristics of tau protein, while the upregulation of the MHC-I gene may indicate that neurons are facing clearance by the immune system. 26 In addition, the imbalance of DNA damage and repair mechanisms may lead to the cumulative damage of neuronal DNA, thereby affecting the health of neurons. Epigenetic modifications, such as differential modifications of 5 hmC, are related to changes in the expression of genes associated with neural development, which may play a key role in the development of AD. 27 Through WGCNA, we successfully identified gene modules that are highly correlated with the clinical phenotypes of AD, with a correlation coefficient as high as 0.68. This significant correlation suggests that these gene modules may play a central role in the pathological processes of AD. Furthermore, we employed various machine learning algorithms, including LASSO regression, random forests, and SVM-RFE, to screen for six key genes from DEGs, module genes, and PRGs, which are MIB1, TUG1, GATA1, CA1, CFH, and IL17A. ROC curve analysis showed that the AUC values of these genes are all above 0.69 in both training and validation cohort, indicating their high diagnostic value. qRT-PCR experiments also demonstrated that six key genes were highly expressed in the AD group compared with the normal control group. As an E3 ubiquitin ligase, MIB1 may influence AD-related pathological processes by regulating protein ubiquitination and degradation; the ubiquitin-proteasome system plays an important role in neurodegenerative diseases.28,29 TUG1 plays a role in various tumors, and although its specific role in AD is not yet clear, long non-coding RNAs have been implicated in neurodegenerative diseases and may participate in the pathological process of AD by regulating gene expression and protein function.30–32 GATA1 primarily functions in the hematopoietic system, but studies have shown that abnormal expression of GATA1 may be related to neurological diseases. 33 CA1 plays a role in regulating acid-base balance and neurotransmitter release. In AD, CA1 may be involved in the pathological process by affecting neuronal metabolism and the neurotransmitter system, although the specific mechanisms still require further research.34,35 CFH is a complement regulatory protein that may play a role in the pathogenesis of AD by modulating the activity of the complement system, affecting inflammatory responses, and the function of immune cells.36,37 IL17A is a pro-inflammatory cytokine that participates in the induction of AD by increasing the infiltration of neutrophils into the brain, inducing neuroinflammation, increasing FASL and amyloid-β deposition, and activating microglia. IL-17A can be considered an immune therapy target for AD.38,39 The relationship between these genes and AD involves various biological processes, including inflammatory responses, immune cell function, neurotransmitter systems, and protein degradation, and they may participate in the pathological process of AD through different mechanisms. Further research will help clarify the specific roles of these genes in AD and provide potential targets for the development of new therapeutic strategies.
Unsupervised clustering analysis revealed differences between different AD samples, which may reflect the heterogeneity of AD. Immune infiltration analyses further elucidated the functions of these genes, providing important clues for our understanding of the molecular mechanisms of AD. These analysis results suggest that PRGs may play a role in AD through multiple biological pathways, including inflammatory responses, cell death, and neuroprotection. Lastly, we discovered through molecular docking technology that CFH and the drug fludrocortisone have clear binding sites, providing a new perspective for drug development. CFH, as a complement system regulatory protein, its binding with drugs may affect the pathological process of AD. This finding suggests that modulating the complement system may have a positive impact on the treatment of AD. In summary, this study integrated various machine learning techniques and bioinformatics methods to deeply analyze the molecular typing of AD and explore the potential roles of pyroptosis and immune cell infiltration in AD. Our research not only provides new molecular markers for the diagnosis and treatment of AD but also offers new directions for future research. Future studies can further explore the specific mechanisms of these genes in AD and how they affect the progression of the disease. In addition, the discovery of these genes also provides possibilities for developing new treatment strategies, including drug therapy and gene therapy targeting these genes. We look forward to these findings bringing new breakthroughs in the treatment of AD and ultimately improving the lives of patients.
However, our research still has some limitations. The datasets for this diagnostic signature come from public databases, and its accuracy requires more clinical data and validation, as well as updates based on the latest technological developments. What role does pyroptosis play in the development of AD, and how can we apply pyroptosis to personalized precision therapy? All of these encourage us to validate the correctness of this signature through more clinical data and further explore the role of relevant genes in the progression of AD.
Conclusions
This study delved into the role of pyroptosis in AD and identified potential biomarkers and therapeutic targets. Through high-throughput data analysis and machine learning techniques, we discovered 609 DEGs and used WGCNA and ROC curve analysis to screen for six key genes that hold significant value in the diagnosis and treatment of AD. The study also revealed the heterogeneity of AD samples and suggested that modulating the complement system could be beneficial for AD treatment. These findings provide new insights into the molecular mechanisms of AD and point the way for the development of future therapeutic strategies.
Supplemental Material
sj-docx-1-alz-10.1177_13872877251360033 - Supplemental material for Application of machine learning reveals diagnostic biomarkers related to pyroptosis in Alzheimer's disease and analysis of immune infiltration
Supplemental material, sj-docx-1-alz-10.1177_13872877251360033 for Application of machine learning reveals diagnostic biomarkers related to pyroptosis in Alzheimer's disease and analysis of immune infiltration by Yujuan Huang, Tu Xu, Li Wang, Ruping Xiang, Meijun Zhou, Huiyun Yu, Dong Liu and Zhicheng Chen in Journal of Alzheimer's Disease
Footnotes
Acknowledgments
The authors have no acknowledgments to report.
Ethical considerations
This study was approved by the Fourth Hospital of Changsha Research Ethics Committee (approval no. CSSDSYY-YXLL-SC) on March 25, 2024.
Consent to participate
All participants provided written informed consent prior to participating.
Author contributions
Funding
The authors disclosed receipt of the following financial support for the research, authorship, and/or publication of this article: Financial support was provided by Hunan Provincial Health Commission (Grant. 202203073343).
Declaration of conflicting interests
The authors declared no potential conflicts of interest with respect to the research, authorship, and/or publication of this article.
Data availability statement
The datasets presented in this study can be found in online repositories. The names of the repository/repositories and accession number(s) can be found in the article.
Supplemental material
Supplemental material for this article is available online.
References
Supplementary Material
Please find the following supplemental material available below.
For Open Access articles published under a Creative Commons License, all supplemental material carries the same license as the article it is associated with.
For non-Open Access articles published, all supplemental material carries a non-exclusive license, and permission requests for re-use of supplemental material or any part of supplemental material shall be sent directly to the copyright owner as specified in the copyright notice associated with the article.