



Abstract
Background
Mild cognitive impairment (MCI) represents a stage between cognitively normal and Alzheimer's disease. Despite much published research on MCI, there continues to be a knowledge gap of volumetric brain changes in MCI versus cognitively normal (CN) in racially diverse, community-based samples.
Objective
The study aimed to understand differences in volume of selected brain regions in individuals with MCI versus those who are cognitively normal.
Methods
This was a cross-sectional study with 1835 participants, which sampled all cognitively impaired participants (n = 667) and a subsample of cognitively normal participants from the ARIC neurocognitive study (ARIC-NCS). All individuals underwent a brain MRI. Two models (5 versus 22 regions of interest [ROI]) were built to analyze differences in brain volume between cognitively normal and MCI, and among 3 cognitive domains (memory, language, executive function). Using previous visits data, we estimated the standard deviations of 20-year cognitive decline equivalent to the difference in brain volume between MCI and CN.
Results
Every lobe was significantly smaller in individuals with MCI, with the largest difference observed in the temporal lobe. Moreover, there was a significant difference between MCI and CN in every subregion within the temporal lobe. The difference in volume between CN and MCI was equivalent to the total brain volume difference associated with a 1.24 standard deviation greater long-term cognitive decline.
Conclusions
Loss of volume in all cortical lobes, but particularly in the temporal lobe, was associated with MCI. Additionally, significant volume differences were observed in the temporal lobe in all three cognitive domains.
Introduction
Despite much published research on mild cognitive impairment (MCI) during the last few years, 1 there is a gap in knowledge of the broader range of volumetric brain changes in MCI versus normal cognition (NC) in community-based samples.2–4 In particular, there is a paucity of precise, quantitative, imaging-based studies of the differences in regional brain volumes with MCI in representative Black and White resident populations of older age.3,5–7 Knowledge regarding volume differences associated with poor performance in specific cognitive domains is also lacking in such populations.
Furthermore, the current state of the published literature is constrained by small sample sizes, varying and sometimes imprecise ways to operationalize and diagnose MCI versus NC, and unrepresentative populations.1,5,8,9 There is a clear need to address and reduce this knowledge gap. The ARIC-NCS is primed to do so given its 10-test battery of cognitive tests, well developed criteria for MCI operationalized in advance of study initiation, large sample size and a racially diverse population. 10
Research in the Atherosclerosis Risk in Communities Neurocognitive Study (ARIC-NCS) and other studies has quantified the rate of cognitive decline associated with various exposures.11–15 Still, reviewers often ask, “how important are the declines of the magnitude reported?”. One of the goals of this study is to provide a useful scale by which to answer that question. Work by Orlando et al. characterized the regional volume differences associated with prior 20-year decline in a 3-test combined cognitive score in ARIC-NCS. Interestingly, the pattern of volume decrease suggested one expected from memory loss more than from a loss in other domains. 16 Therefore, it is of interest to compare that pattern with brain volume differences between NC and MCI participants. To this end, a useful comparison could be derived by quantifying, based on total brain volume, as reported by Orlando et al., the difference in brain volume of 20-year cognitive decline equivalent to the difference in brain volume seen in this study between a recognized MCI syndrome and NC, with both estimates from the same images and from the same population. 16
Study objectives
This study is largely descriptive. It aimed to show the differences in a broad range of regional brain volumes associated with MCI, as well as those associated with impairments in specific cognitive domains. We further performed race-stratified analysis as a secondary objective. First, we estimated differences in volume of selected brain regions in non-demented individuals with MCI versus those who are cognitively normal. Second, we estimated differences in those who showed failure in only one of three cognitive domains evaluated within ARIC-NCS (memory, language, executive function), as compared to cognitively normal individuals. Finally, we estimated the number of standard deviations of 20-year cognitive decline equivalent to the difference between MCI and NC, using volumes from various regions of interest as the metric of comparison. We performed additional analyses stratified by race to estimate differences in volume of selected brain regions in non-demented individuals with MCI versus cognitively normal.
Methods
Study design and study participants
This study used data from both the Atherosclerosis Risk in Communities Study (ARIC), and from the ARIC neurocognitive ancillary study (ARIC-NCS). 17
ARIC is a large-scale cohort that has been measuring a range of cardiovascular related risk factors since it began in 1987. 18 Since 2011, the ARIC-NCS has been measuring a range of neurocognitive outcomes in late life which have been investigated primarily in relation to vascular health. 10 At its inception, the ARIC study recruited approximately 16,000 middle-aged adults from four United States communities (Forsyth County, NC; Jackson, MS; selected suburbs of Minneapolis, MN; and Washington County, MD). 18 Data for this analysis are from ARIC's first 7 visits, with visits 5- 7 having an ARIC-NCS component. 18 For this study, clinical, demographic and imaging data were obtained from visit 5 alone (2011–2013).
Protocol approval and patient consent
Every participant signed written informed consent. This study was approved by the institutional review boards of all ARIC affiliated centers.
The study protocol was approved by the Johns Hopkins School of Public Health Institutional Review Board; IRB number 12998.
Inclusion and exclusion criteria for this analysis
Inclusion criteria included the following: (1) Individuals in ARIC who completed visit 5 (2011–2013); (2) Having an ARIC diagnosis of MCI or NC at visit 5; and (3) Having undergone a brain MRI scan at visit 5. Exclusion criteria included the following: (1) Individuals with dementia at visit 5; (2) Participants without data for education or race, which was measured at visit 1.
MCI diagnosis
All study participants who were assessed at ARIC-NCS underwent a sequential evaluation. An algorithm was built to diagnose three cognitive states, including cognitively normal, MCI, and dementia. The algorithm was based on dementia and MCI definitions from the National Institute on Aging-Alzheimer's Association (NIA-AA) workgroups, and the Diagnostic and Statistical Manual of Mental Disorders, 5th Edition (DSM-5), utilizing the following data: Mini-Mental State Examination (MMSE), Clinical Dementia Rating (CDR), Functional Activities Questionnaire (FAQ), and 1 or more cognitive domain failures based on scores from the neuropsychological 10-test battery. 19 Criteria for cognitive domain failures were age- race, and education level-adjusted z-scores of −1.5 relative to a robust normal group of 803 ARIC participants who met stringent criteria for normality, including no prior stroke, dementia, or other neurological diagnosis, not depressed, not APOE4 homozygous, no reported memory problems, no current low MMSE score, no medications for dementia, and lack of prior substantial cognitive decline based on the ARIC 3-test evaluation. Algorithmic diagnoses were changed, if necessary, after review from an ARIC panel of experts. For two tests, the Boston naming test and digit span backward test, norms were obtained, not from the ARIC normative sample but from the National Alzheimer's Coordinating Center.10,19 For a more detailed description, please refer to the article by Knopman et al., where all assessment methods and diagnostic algorithms for ARIC-NCS have been described thoroughly. 10
Lastly, all visit 5 participants with potential MCI or dementia were invited to receive an MRI along with a random sample of persons who were CN.
Cognitive domain scores were derived using the following tests: for the memory domain, Immediate and Delayed Logical Memory, Incidental Learning, and Delayed Word Recall tests; for the language domain, the Controlled Oral World Association, Animal Naming and Boston Naming tests; for the executive function domain, the Digit Symbol Substitution and Digit Span Backwards. Factor analysis was used to derive scores for each domain. A detailed description of how these variables were defined can be found elsewhere.19,20
Brain MRI
The MRI scans were site-specific and were performed using 3-T Siemens scanners, using a typical set of sequences, including 3D volumetric Magnetization Prepared Gradient Echo (MPRAGE) and fluid-attenuated inversion recovery (FLAIR). All MRI scans were processed at the MAYO Clinic Alzheimer's and Dementia Imaging Research Lab. Freesurfer 5 (https://surfer.nmr.mgh.harvard.edu/) was used to derive total and regional cortical volumes. The scans were conducted with the intent of having imaging data for analysis, as well as complementing clinical diagnoses. 19 First, we compared volume differences for 5 ROIs (4 lobes and subcortical grey matter) Separately, we included the brain volumes studied (measured in cm3) by Schneider et al. and Orlando et al. as a second set of outcome variables.16,19 Specifically, brain volume of 22 anatomical regions associated with the following cognitive domains: memory (medial temporal lobe, posterior cingulate, amygdala, entorhinal cortex, hippocampus); language (left inferior frontal gyrus, left superior temporal gyrus); executive function/speed of processing (prefrontal cortex, anterior cingulate, subcortical); other (pericalcarine fissure, basal ganglia, fusiform gyrus, Heschl's gyrus, insula, lingual gyrus, cuneus, precentral gyrus, precuneus, postcentral gyrus, paracentral gyrus, supramarginal gyrus, thalamus).
All outcomes were expressed in terms of percent differences in volume compared to the mean of the cognitively normal population in the study group.
Covariates
The following covariates were included: (1) age (modeled continuously in years); (2) sex (male versus female); (3) race (Black versus White); (4) education (less than high school, high school or equivalent, greater than high school); (5) intracranial volume (cm3, modeled continuously).
Statistical analysis
Given the large number of ROIs, there was the possibility of spurious associations due to type I error (multiple comparisons). Modeling each outcome of interest with a separate linear regression model increased the probability of type I error and, given that regional volumes within an individual were related to one another, would have failed to make full use of all available data.
Therefore, we used linear mixed models to estimate marginal differences in brain volumes associated with MCI, accounting for the correlation of regions within an individual using a subject-specific random effect. We utilized the same model to estimate marginal differences in brain volumes associated for individuals who only show failure in one cognitive domain (i.e., memory, language, executive function). Our first model included 5 ROIs (4 lobes and subcortical grey matter) and our second model included all 22 anatomical regions of interest (as per Schneider et al.). 21 We included both a subject specific random effect and a random effect for each region to allow estimated mean differences to vary within individuals and across regions. We assumed an unstructured correlation matrix for the random effects. Models adjusted for age, sex, race, education, and intracranial volume.
Results
Study population characteristics
There were 6385 participants who completed ARIC visit 5. Of these, 3283 participants were selected to undergo a brain MRI and 1962 participants completed the MRI.
Participants who were not Black or White (14), had missing data for education (11) or neurocognitive test performance (1), or met the criteria for dementia (95), were excluded. The final sample for this study included 1835 participants, of which 1168 were cognitively normal and 667 had MCI.
Characteristics of the study population at visit 5 (2011–2013) are shown by MCI status in Table 1. On average, participants were 76.3 years old; women slightly younger, at 76.1 years, and men older, at 76.5 years. 39.9% of participants were male, and 60.1% were female. 86.9% of participants had at least a high school education. 72% of participants were Black, while 28% were White.
Demographic characteristics by MCI status, Atherosclerosis Risk in Communities Study, 2011–2013, N = 1835.
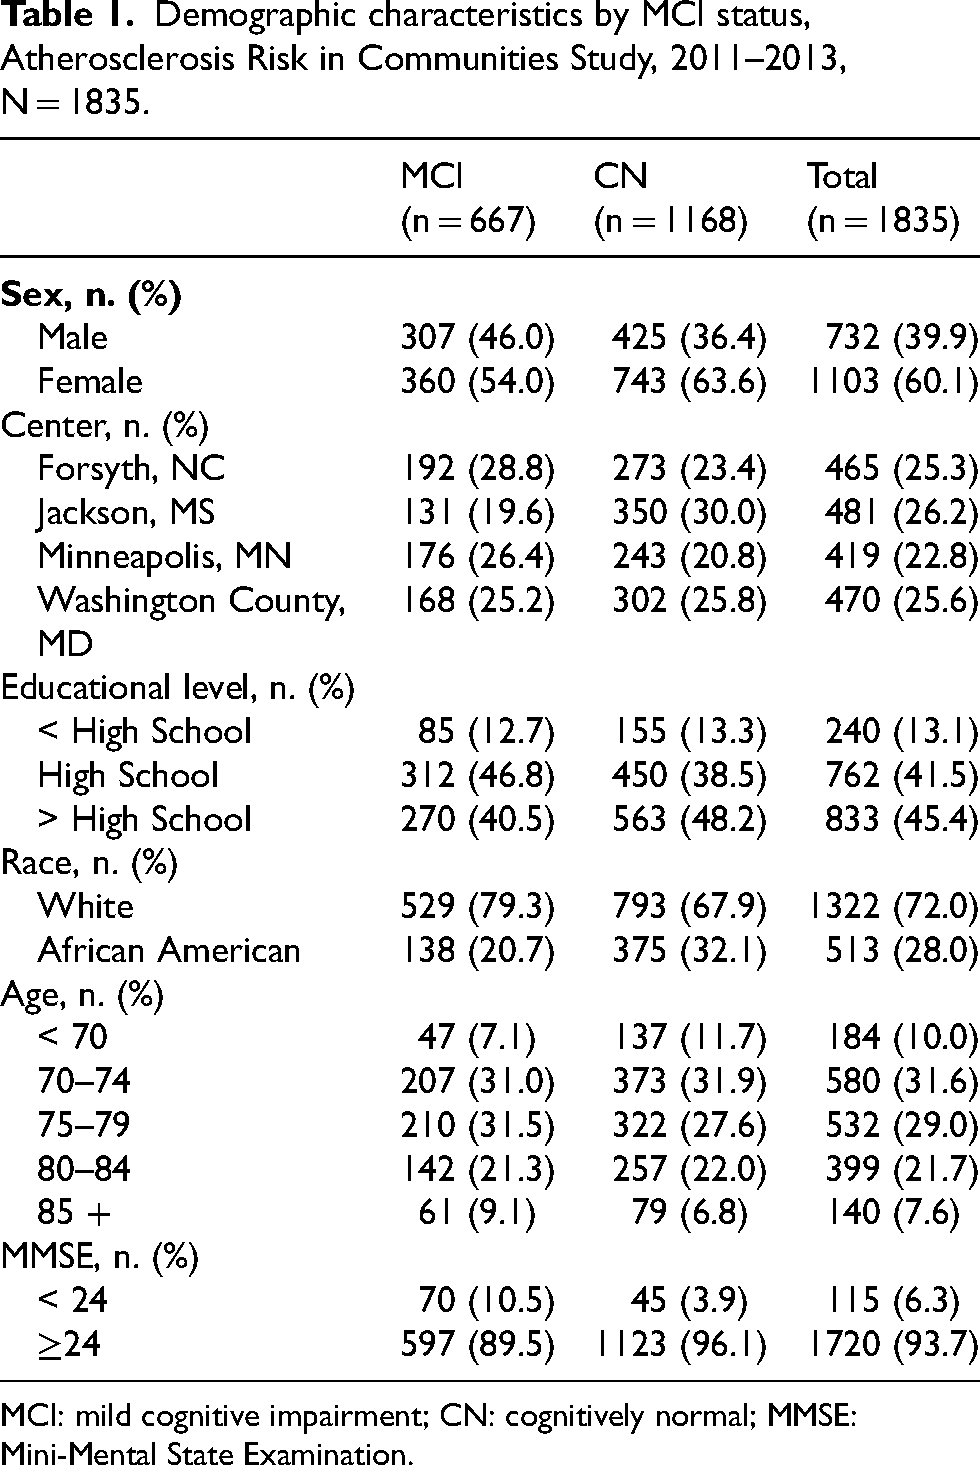
MCI: mild cognitive impairment; CN: cognitively normal; MMSE: Mini-Mental State Examination.
Cognitive domains
From our study population, 1126 (61%) individuals did not show failure in any single domain (memory, language, executive function). 702 (39%) showed failure in at least one domain, and 7 (<1%) individuals had missing data for cognitive status. Out of the 702 individuals with failure in at least one domain, 228 presented with failure in memory only, 218 with failure in language only, and 93 with failure in executive function only (Figure 1).

Individuals with failure across three cognitive domains (memory, language, executive function).
Adjusted differences in brain volume between MCI and CN (5 regions of interest)
Average volumes for individuals with MCI were significantly smaller than those who were CN in adjusted analysis for all 5 ROIs: by 1.4% (95% CI; 0.7%, 2.1%) in the frontal lobe, 2.9% (95% CI; 2.2%, 3.6%;) in the temporal lobe; 1.3% (95% CI; 0.6%, 2.0%) in the parietal lobe; 1.2% (95% CI; 0.5%, 1.9%) in the occipital lobe, and 1.3% (95% CI; 0.6%, 2.0%) in the deep grey matter (Figure 2).
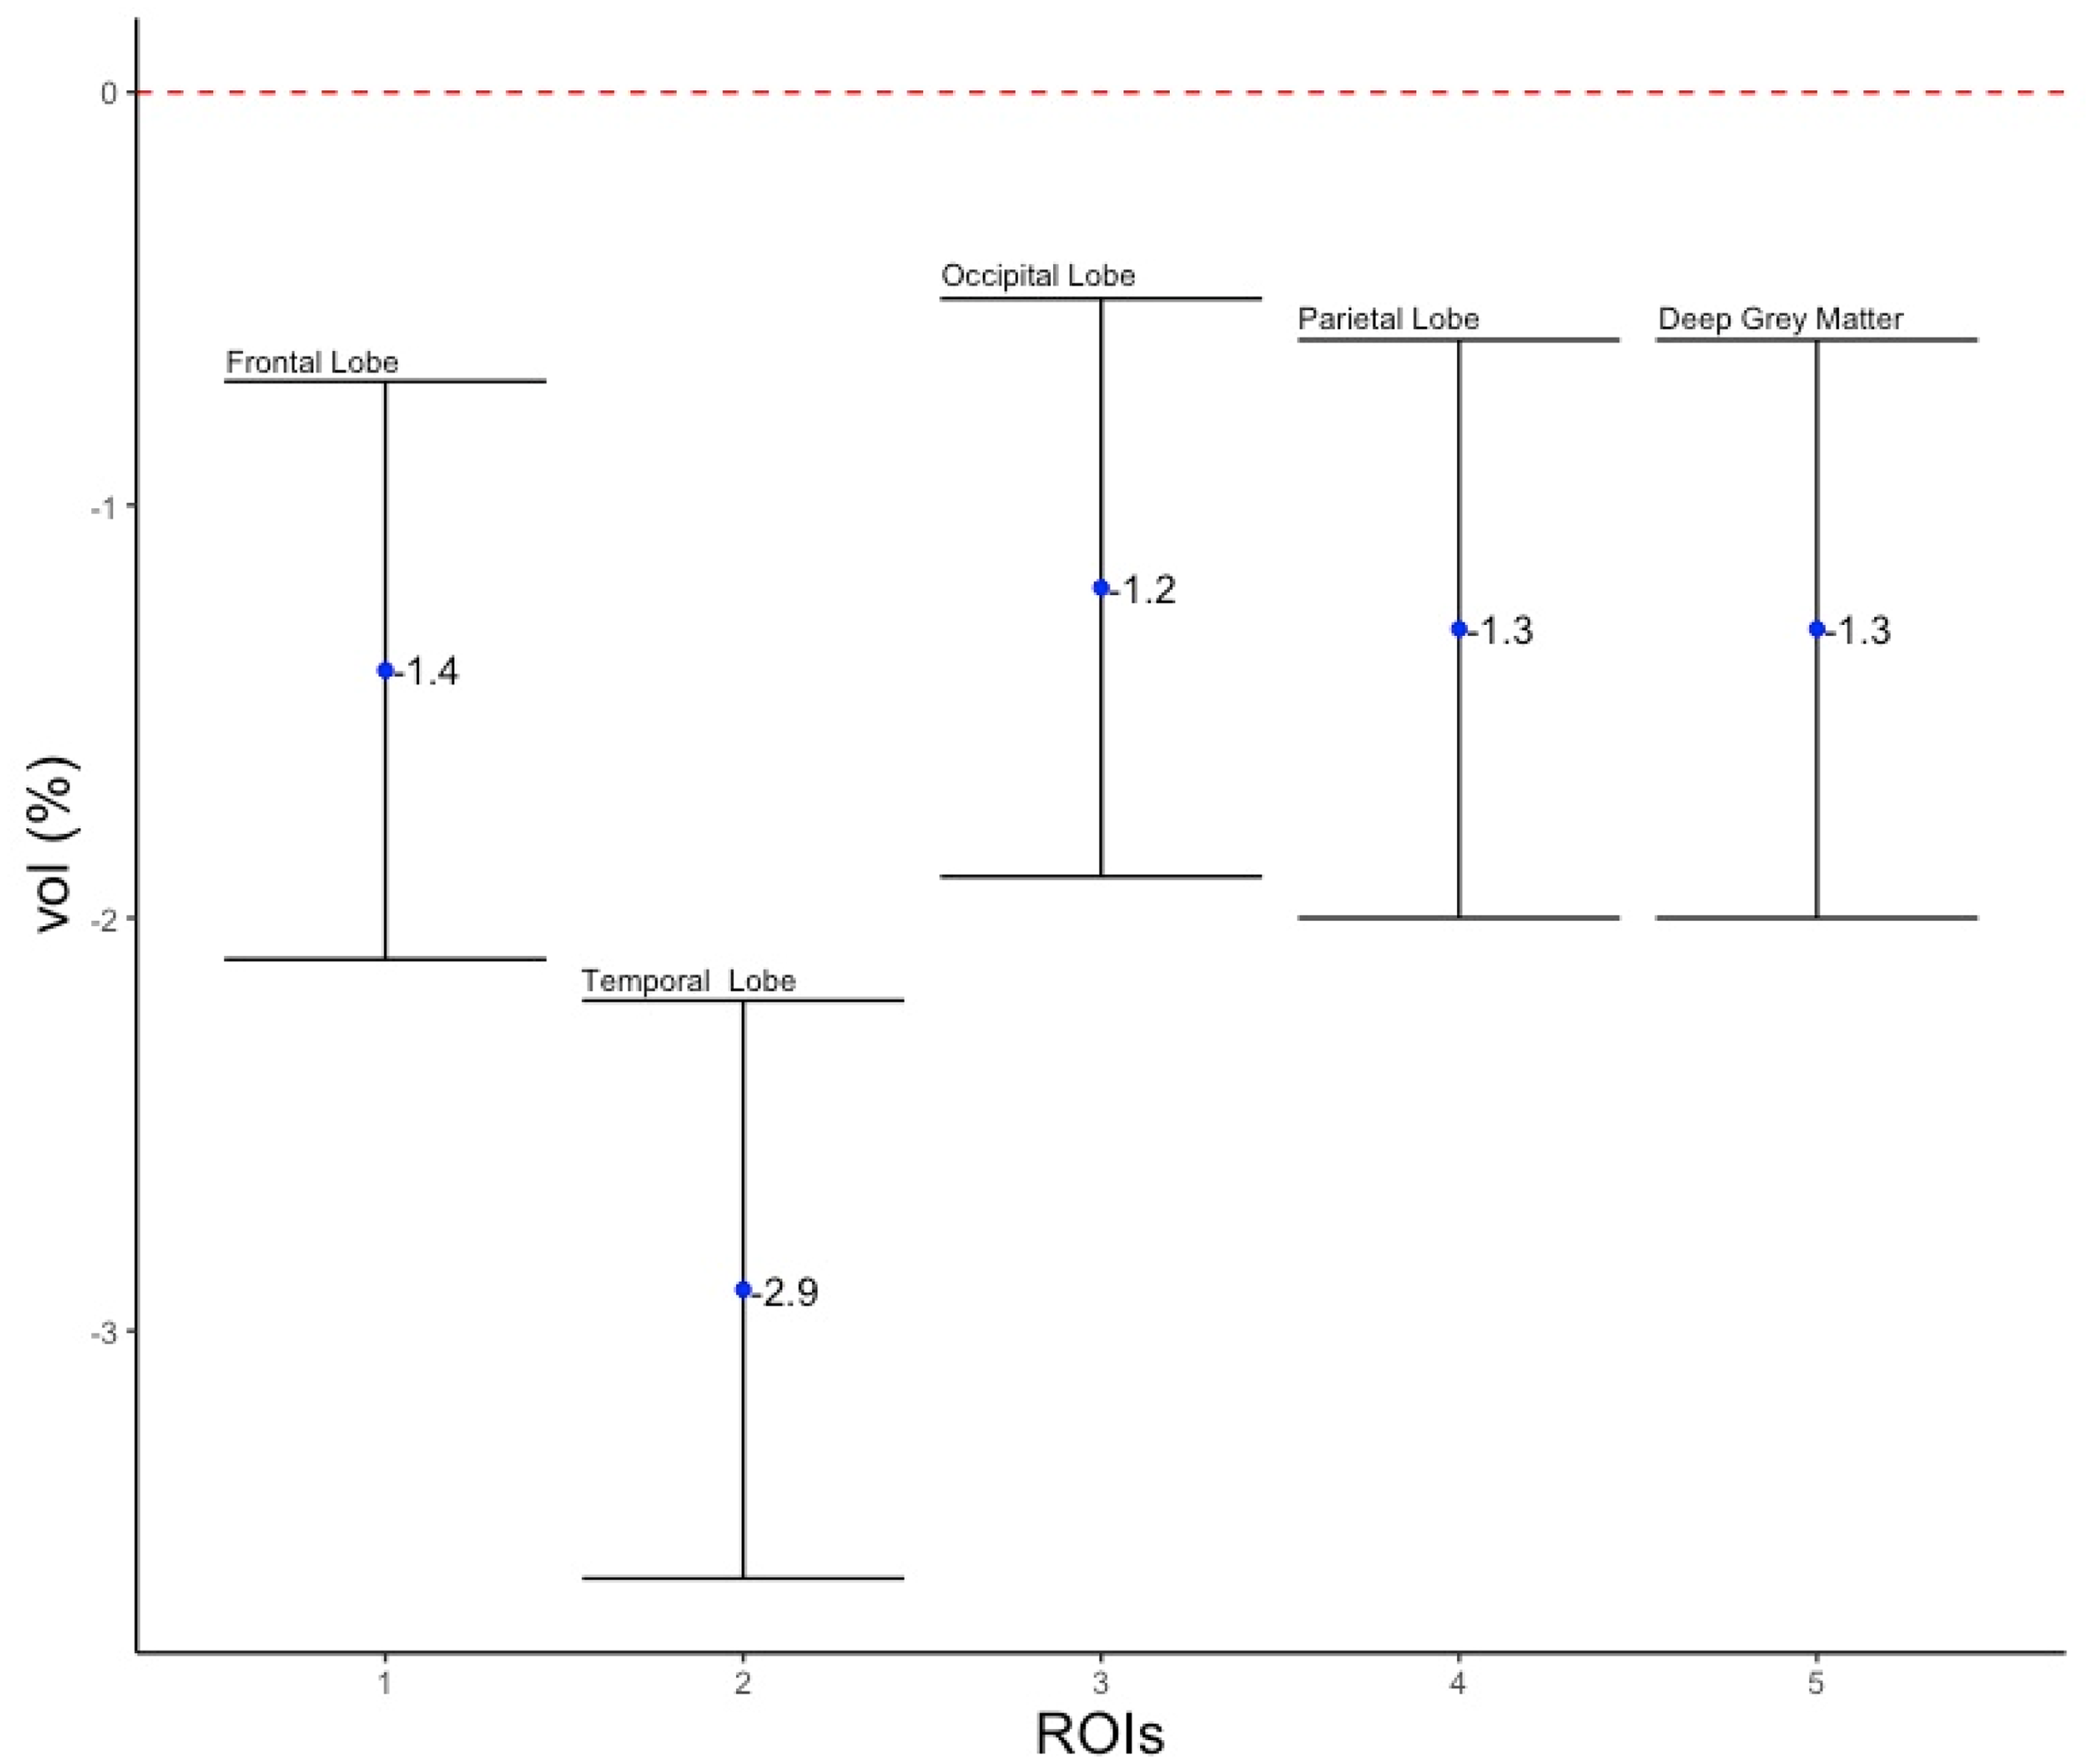
Brain volume differences between CN and MCI.
Adjusted differences in brain volume between failure in one cognitive domain versus failure in no domains (5 regions of interest)
Memory
In adjusted analysis, mean volumes for individuals with memory failure were significantly smaller than those who showed no failure in any domain by 2.0% (95% CI; 1.0%, 3.1%) in the temporal lobe, and by 1.4% (95% CI; 0.3%, 2.4%) in the deep grey matter (Figure 3(a)).

Brain volume differences between no failure in any domain and failure in a single domain only (memory, language and executive function domains).
Language
On average, in adjusted analysis, volumes for individuals with language failure were significantly smaller than those who showed no failure in any domain by 1.4% (95% CI; 0.3%, 2.5%) in the temporal lobe; by 2.1% (95% CI; 1.0%, 3.2%) in the occipital lobe; and by 1.6% (95% CI; 0.5%, 2.7%) in the parietal lobe. The deep gray matter was significantly larger in individuals with MCI compared to CN by 1.7% (95% CI; 0.7%, 2.8%) (Figure 3(b)).
Executive function
In multivariable-adjusted models, average volumes for individuals with executive function were significantly smaller than those who showed no failure in any domain in all 5 ROIs; by 1.6% (95% CI; 0.1%, 3.2%) in the frontal lobe, 2.7% (95% CI; 1.2%, 4.3%) in the temporal lobe, 1.8% (95% CI; 0.3%, 3.4%) in the occipital lobe, 1.8% (95% CI; 0.2%, 3.3%) in the parietal lobe, and 1.8% (95% CI; 0.3%, 3.4%) in the deep grey matter (Figure 3(c)).
Adjusted differences in brain volume between MCI and CN (22 regions of interest)
Within the frontal lobe, average volumes for individuals with MCI were significantly smaller than those who were CN by 1.1% (95% CI; 0.04%, 2.3%; p = 0.04) in the anterior cingulate, and by 1.6% (95% CI; 0.4%, 2.7%; p = 0.008) in the precentral gyrus (Supplemental Figure 1). In the temporal lobe, every subregion was significantly smaller in individuals with MCI compared to those who were CN. The largest differences were observed in the amygdala, which was 3.7% (95% CI; 2.6%, 4.8%; p = <0.001) smaller, and in the hippocampus, which was 5.5% (95% CI; 4.3%, 6.6%; p = <0.001) smaller (Supplemental Figure 2). In the occipital lobe, the lingual gyrus was significantly smaller in individuals with MCI compared to individuals who were CN by 2.0% (95% CI; 0.9%, 3.2%; p = 0.001) (Supplemental Figure 3). In the parietal lobe, the precuneus was significantly smaller in individuals with MCI compared to those who were CN by 1.4% (95% CI; 0.3%, 2.5%; p = 0.026) (Supplemental Figure 4). Finally, in the deep gray matter, volumes for individuals with MCI were significantly smaller than those were CN by 2.4% (95% CI; 1.3%, 3.5%; p = <0.001) In the thalamus, and by 1.6% (95% CI; 0.5%, 2.7%; p = 0.011) in the basal ganglia (Supplemental Figure 5).
Adjusted differences in brain volume between MCI and CN stratified by race (5 regions of interest)
In analyses stratified by race, average volume differences between individuals who were cognitively normal and those with MCI were smaller in White compared to Black individuals in all 5 regions of interest However, except for the frontal lobe, such differences were not statistically significant (Supplemental Figure 6).
Adjusted differences in brain volume between failure in one cognitive domain versus failure in no domains (temporal lobe sub-regions)
Furthermore, we conducted a separate set of analyses where we explored brain volume differences within the temporal lobe sub-regions between failure in one cognitive domain (memory, language, executive-function) versus failure in no domains. When comparing failure in the memory domain versus failure in no domains, the largest difference in volume was found in the hippocampus (6.13%). Significant differences were also found in the entorhinal cortex and the amygdala. Meanwhile, the largest differences between those with failure in the language domain and individuals with no failure in any domain were observed in the entorhinal cortex (3.5%), and in Heschl's gyrus (2.64%), while for the executive function domain the fusiform gyrus showed the largest difference (4.55%). The full results can be found in Supplemental Figures 7–9.
Standard deviations of long-term decline equivalent to the difference between CN and MCI
An estimate of the number of standard deviations of 20-year cognitive decline equivalent to the difference between MCI and NC is presented in Table 2.
Cognitive decline SD equivalency to volume difference between CN and MCI, 2011–2013, N = 1835.

SD: standard deviations; CN: cognitively normal; MCI: mild cognitive impairment.
The total brain volume difference between individuals with CN and MCI in the present study was equal to the loss of volume associated with 1.24 standard deviations of long-term cognitive decline in Orlando's results. 16 The largest decreases were observed in the temporal lobe and in the deep grey matter, where the loss of volume associated with 1.62 and 2.18 standard deviations of 20-year cognitive decline was equivalent to the difference in brain volume between cognitively normal individuals and those with MCI. The area with the smallest decrease was the occipital lobe, were only a loss of volume associated with 0.85 standard deviations of long-term decline was equivalent to the difference between CN individuals and those with MCI.
Discussion
In this cross-sectional study comparing brain volumes in MCI versus cognitively normal Black and White older adults from a population-based cohort study, all brain lobes were statistically significantly smaller in individuals with MCI compared to individuals who were cognitively normal, and, consistent with prior work 16 the greatest difference was in the temporal lobe. However, contrary to the neuropsychological literature which typically suggests a dominance of temporal lobe processes affecting memory function, in our study, the temporal lobe was uniformly smaller across every domain tested (memory, language, executive function). 16
Findings from our study largely confirm previous findings. As with our study, Fletcher et al. found that MCI and CN differed broadly throughout all brain regions but more in the temporal lobe than other regions. 7 A systematic review conducted by Jafari et al. found a greater loss of volume in MCI participants within the hippocampus, the entorhinal cortex, and the brain overall. 3 We similarly found the most significant differences between CN and MCI in the temporal lobe and, more specifically, in the hippocampus, the amygdala, Heschl's gyrus, and the entorhinal cortex.
Our study found significant, region-specific volumetric differences between failure and no failure in 3 cognitive domains, largely in accord with previous reports. McDonald et al. assessed the association between region-specific atrophy rates and cognitive decline over two years. 22 For the memory domain, they found a significant association in the temporal lobe, specifically in the entorhinal cortex. Similarly, we found the largest difference between no failure and failure for memory in the temporal lobe. For language, they found a significant association in the left lateral temporal lobe and the left inferior temporal gyrus. In this study, we also observed the largest difference between no failure and failure in the language domain to be within the temporal lobe. However, we observed the largest difference within the language domain to be in the occipital lobe, followed by the parietal lobe. Lastly, they found a significant association for executive function to be in the dorsolateral frontal lobe. However, in our study, we found all lobes to be significantly different when comparing no failure to failure in executive function, with the largest difference being found in the temporal lobe.
Our study highlights several points worth mentioning with regards to racial differences. A previous ARIC study demonstrated greater dementia prevalence but similar MCI prevalence in Black compared to White individuals. 10 Several reasons could explain such contrasting findings. First, it could be that criteria to diagnose MCI were less sensitive in Black versus White participants, thus ascertaining purely more severe MCI cases. However, as shown in our findings, on average, Black individuals have a smaller volume difference between CN and MCI compared to White individuals, so this does not seem to be the case. Second, Black individuals could be progressing from MCI to dementia more rapidly than White individuals. However, previous research does not seem to support this scenario. For example, a study by Rajan et al. showed a slower decline in Black than White participants once the point of a more rapid cognitive decline than average had started. 23 In another paper by Gao et al., there was a similar rate of progression from MCI to dementia in Black compared to White individuals. 24 A third and more plausible possibility based on our results is that MCI diagnoses could be less accurate in Black than White individuals. Because the cognitive tests used to define and operationalize MCI and dementia were developed and validated in White individuals, they may relate more strongly to White than Black life experiences within persons with MCI (rather than to the brain pathology underlying MCI). Another important point vis-à-vis the race-stratified analysis is that this research has allowed for an examination of ROI pattern comparing Blacks and White participants. We found a similar pattern of volume loss among different ROIs, the most significant difference being observed in the temporal lobe. Still, because confidence intervals were too wide, it would be premature to ascertain whether the pattern of loss does not differ between Black and White participants.
Since the inception ARIC-NCS, there have been several studies that have estimated the rate cognitive decline based on various exposures. However, it is sometimes difficult to conceptualize the magnitudes of cognitive decline reported in such articles. With this in mind, we set out to create a simple scale that would allow us to understand magnitude of cognitive decline in relation to total brain volume. Concretely, this comparison is meant to highlight the brain volume decrease associated with 20-year cognitive decline equivalent to the brain volume decrease between MCI and CN. So, for example, ARIC participants with 1.24 standard deviations greater cognitive decline across a period of 20 years had an equivalent brain volume decrease to the difference in brain volume between ARIC participants who were cognitively normal and those who had MCI.
Strengths of our study include its neuropsychological battery to define MCI and well operationalized criteria for MCI diagnosis and a large, diverse population. However, there are limitations. There is a need to be aware of the general limitation that the construct of MCI poses and the current lack of a standardized set of diagnostic criteria. 25 The diagnostic criteria and approaches used to operationalize and diagnose MCI within ARIC are quantitative and very precisely described based on a robust within-study normative sample.10,19 However, it is important to bear in mind that there is wide-ranging variation in methods and diagnostic criteria in the literature, and in research and in clinical settings in how MCI is ascertained and defined, and what norms were used to define cognitive failure.7,8,26–28
We also recognize that, beyond the utility of having well-operationalized criteria and a thorough neuropsychological battery in this study, the exact methods used to diagnose MCI in both a clinical and research contexts are not standardized and, therefore, can vary substantially.7,8,26–28 Thus, it can be difficult to make comparisons between studies that analyze volumetric brain changes, and the way MCI is ascertained and defined should always be considered when doing so. Without standardized criteria for MCI diagnosis, these factors will continue to be a challenge when reading current literature.
In summary, brain volume was significantly lower in individuals with MCI compared to those who were cognitively normal in every lobe of the brain, with the largest difference being observed in the temporal lobe. Similarly, the temporal lobe was uniformly smaller when comparing failure to no failure in the memory, language, and executive function domains. Both Black and White participants showed the largest CN-MCI differences in the temporal lobes; however, our data is only cross-sectional and longitudinal studies, as well as studies with larger populations would be helpful in helping us further understand whether the patterns observed across several regions of interest in the present study hold and confirm such findings.
Supplemental Material
sj-docx-1-alz-10.1177_13872877251313816 - Supplemental material for Differences in brain volume in individuals with mild cognitive impairment and normal cognition across different anatomical regions: The Atherosclerosis Risk in Communities (ARIC) study
Supplemental material, sj-docx-1-alz-10.1177_13872877251313816 for Differences in brain volume in individuals with mild cognitive impairment and normal cognition across different anatomical regions: The Atherosclerosis Risk in Communities (ARIC) study by Fernando Mijares Diaz, Alessandro Orlando, Andrea LC Schneider, James R Pike, Clifford R Jack, Jennifer A Deal and A Richey Sharrett in Journal of Alzheimer's Disease
Footnotes

Authors contributions
Fernando Mijares Díaz (Conceptualization; Formal analysis; Investigation; Methodology; Project administration; Visualization; Writing – original draft; Writing – review & editing); Alessandro Orlando (Conceptualization; Supervision; Writing – review & editing); Andrea LC Schneider (Data curation; Formal analysis; Methodology; Supervision; Writing – review & editing); James R Pike (Conceptualization; Data curation; Methodology; Writing – review & editing); Clifford R Jack (Data curation; Methodology; Writing – review & editing); Jennifer A Deal (Conceptualization; Data curation; Funding acquisition; Investigation; Methodology; Project administration; Resources; Supervision; Writing – review & editing); A Richey Sharrett (Conceptualization; Data curation; Funding acquisition; Methodology; Project administration; Supervision; Writing – review & editing).
Funding
The authors disclosed receipt of the following financial support for the research, authorship, and/or publication of this article: The Atherosclerosis Risk in Communities Study is conducted as a collaborative study supported by National Heart, Lung, and Blood Institute contracts (HHSN268201700001I, HHSN268201700002I, HHSN268201700003I, HHSN268201700005I, HHSN268201700004I). Neurocognitive data are collected by U01 2U01HL096812, 2U01HL096814, 2U01HL096899, 2U01HL096902, 2U01HL096917 from the NIH (NHLBI, NINDS, NIA, and NIDCD), and with previous brain MRI examinations funded by R01-HL70825 from the NHLBI. Dr Deal is supported by grant K01AG054693 from the National Institute on Aging. There was no involvement in any of the funding sources in the writing of this manuscript.
Declaration of conflicting interests
The authors declared no potential conflicts of interest with respect to the research, authorship, and/or publication of this article.
Data availability
Supplemental material
Supplemental material for this article is available online.
References
Supplementary Material
Please find the following supplemental material available below.
For Open Access articles published under a Creative Commons License, all supplemental material carries the same license as the article it is associated with.
For non-Open Access articles published, all supplemental material carries a non-exclusive license, and permission requests for re-use of supplemental material or any part of supplemental material shall be sent directly to the copyright owner as specified in the copyright notice associated with the article.
