



Abstract
Introduction
Alzheimer's disease and related dementias (ADRD) are neurodegenerative disorders caused by atrophy in higher-order learning and memory centers including the hippocampus and prefrontal cortex. ADRD is characterized by issues in cognitive functioning including memory loss, confusion, visuospatial processing, and other executive functions (e.g., attention, task switching, planning and problem solving). Mental health issues including depression, apathy, anxiety, agitation, and psychosis are also hallmarks of the disease. Additionally, individuals with ADRD may socially withdraw and have limited ability to interact with others at both the verbal and non-verbal level, causing problems in social health and wellness. Importantly, because the individual with ADRD is often no longer able to perform activities of daily living, this disease affects caregivers and family members of the individual as well. In fact, research has shown that caregivers of individuals with ADRD experience significant mental health issues including stress, depression, anxiety, and sleep problems, with the lower the functional status of the patient, the higher the caregiver burden.1–3 Currently, an estimated 6.5 million Americans aged 65 and older are living with ADRD, with the number of those living with the disease projected to increase to 12.7 million by the year 2050. 4 Approved pharmacological interventions, including acetylcholinesterase inhibitors, can temporarily treat symptoms but do not alter the course of the disease and often have negative side effects including hypermotility, hypersecretion, bradycardia, miosis (i.e., excessive eye pupil constriction), diarrhea, and hypotension (i.e., symptoms of overstimulation of the parasympathetic nervous system). Additionally, antipsychotics that are often prescribed for severe symptoms lead to an increased risk of stroke and premature death. 5 Therefore, non-pharmacological, adjunctive approaches are needed to promote health and wellness in individuals with ADRD, especially those that address the patient-caregiver dyad.
Music is a form of non-verbal communication that involves sensory, motor, and higher-order cognitive processes and is thought to have evolved for the purposes of interpersonal connection. Without verbal language, early humans utilized bodily sounds and rhythms along with early instruments (e.g., rocks and sticks) to communicate and connect with other social cohorts. 6 Schulkin and Raglan (2014) note, “music … can promote human well-being by facilitating human contact, human meaning, and human imagination of possibilities”. As defined by the American Music Therapy Association®, music therapy is, “the clinical and evidence-based use of music interventions to accomplish individualized goals within a therapeutic relationship by a credentialed professional who has completed an approved music therapy program.” 7 Music therapy has been shown to be effective for a range of clinical disorders including neurodegenerative disorders such as Parkinson's and Alzheimer's disease, with improvements in physical (e.g., swallowing, breathing), psychological/emotional, and social health as well as quality of life.8–10
Music may be a particularly excellent therapy for individuals with ADRD as music is accessible, encourages movement, and promotes communication. Additionally, music has been shown to enhance cognitive function and promote healthy aging, especially in terms of short- and long-term memory preservation.11,12 Playing a musical instrument throughout life has also been linked to a decreased risk of developing dementia. 13 Further, music improves affective state and decreases pain, especially during times of physical or psychological stress.14,15 Interestingly, evidence suggests that music memory persists in the presence of cognitive decline because musical brain networks are distinct and more diffuse than traditional temporal lobe networks impacted by ADRD.16–19 Listening to music may also stimulate emotional memory areas (e.g., amygdala) that may help trigger or reactivate memories in individuals with ADRD, especially episodic memories related to an individual's life experiences.20,21
Interpersonal synchrony refers to the ability of individuals to connect both in terms of behavior and timing. In practice, this may mean matching movement or rhythms, or even connecting in terms of emotions, physiological parameters (e.g., heart rate), or hormonal release, a phenomenon known as automatic or autonomic mimicry.22,23 It is thought that through such unconscious interactions with one another, we share each other's internal emotional landscape, which helps develop our sense of empathy and connection with others. Recently, Basso et al. (2020) put forward a hypothesis to describe how creative arts practices may enhance neural synchrony or interbrain synchrony between individuals. 24 This hypothesis states that as we co-create, such as in situations where we produce music or movement together, behavioral synchrony between the duo is increased, which then in turn drives neural coordination. Individuals with ADRD may experience deficits in interpersonal synchrony because of impaired mental and social health, and therefore interventions that target interpersonal synchrony may be especially critical for this clinical population. However, very little research to date has investigated interpersonal synchrony between individuals with ADRD and their caregivers, and no studies to date have investigated the clinical utility of music therapy for this dyad at the level of interbrain synchrony.
Therefore, in this case series, we examined whether the implementation of a 12-week music therapy intervention for individuals with ADRD and their caregivers was possible. Using a human-centered design approach, we assessed the ability to capture and assess behavioral and brain measures. In regard to behavioral measures, we assessed affective state and nonverbal communication through video and audio capture. In regard to brain measures, we assessed the tolerance of electroencephalography (EEG) recordings for participants with ADRD and hyperscanning for the entire music therapy group (i.e., persons with ADRD, caregivers, and music therapist). Additionally, we assessed the ability to capture interbrain synchrony using a low-cost EEG system not inherently designed for hyperscanning. We define interbrain synchrony as the neural coupling or coherence between two individuals, which could be coherence in power, phase, or both. 24 We are interested in this neural metric as interbrain synchrony is hypothesized to be an underlying mechanism of social behavior.24–29 We include pilot data to describe this music therapy intervention and approach to data capture.
Methods
Participants
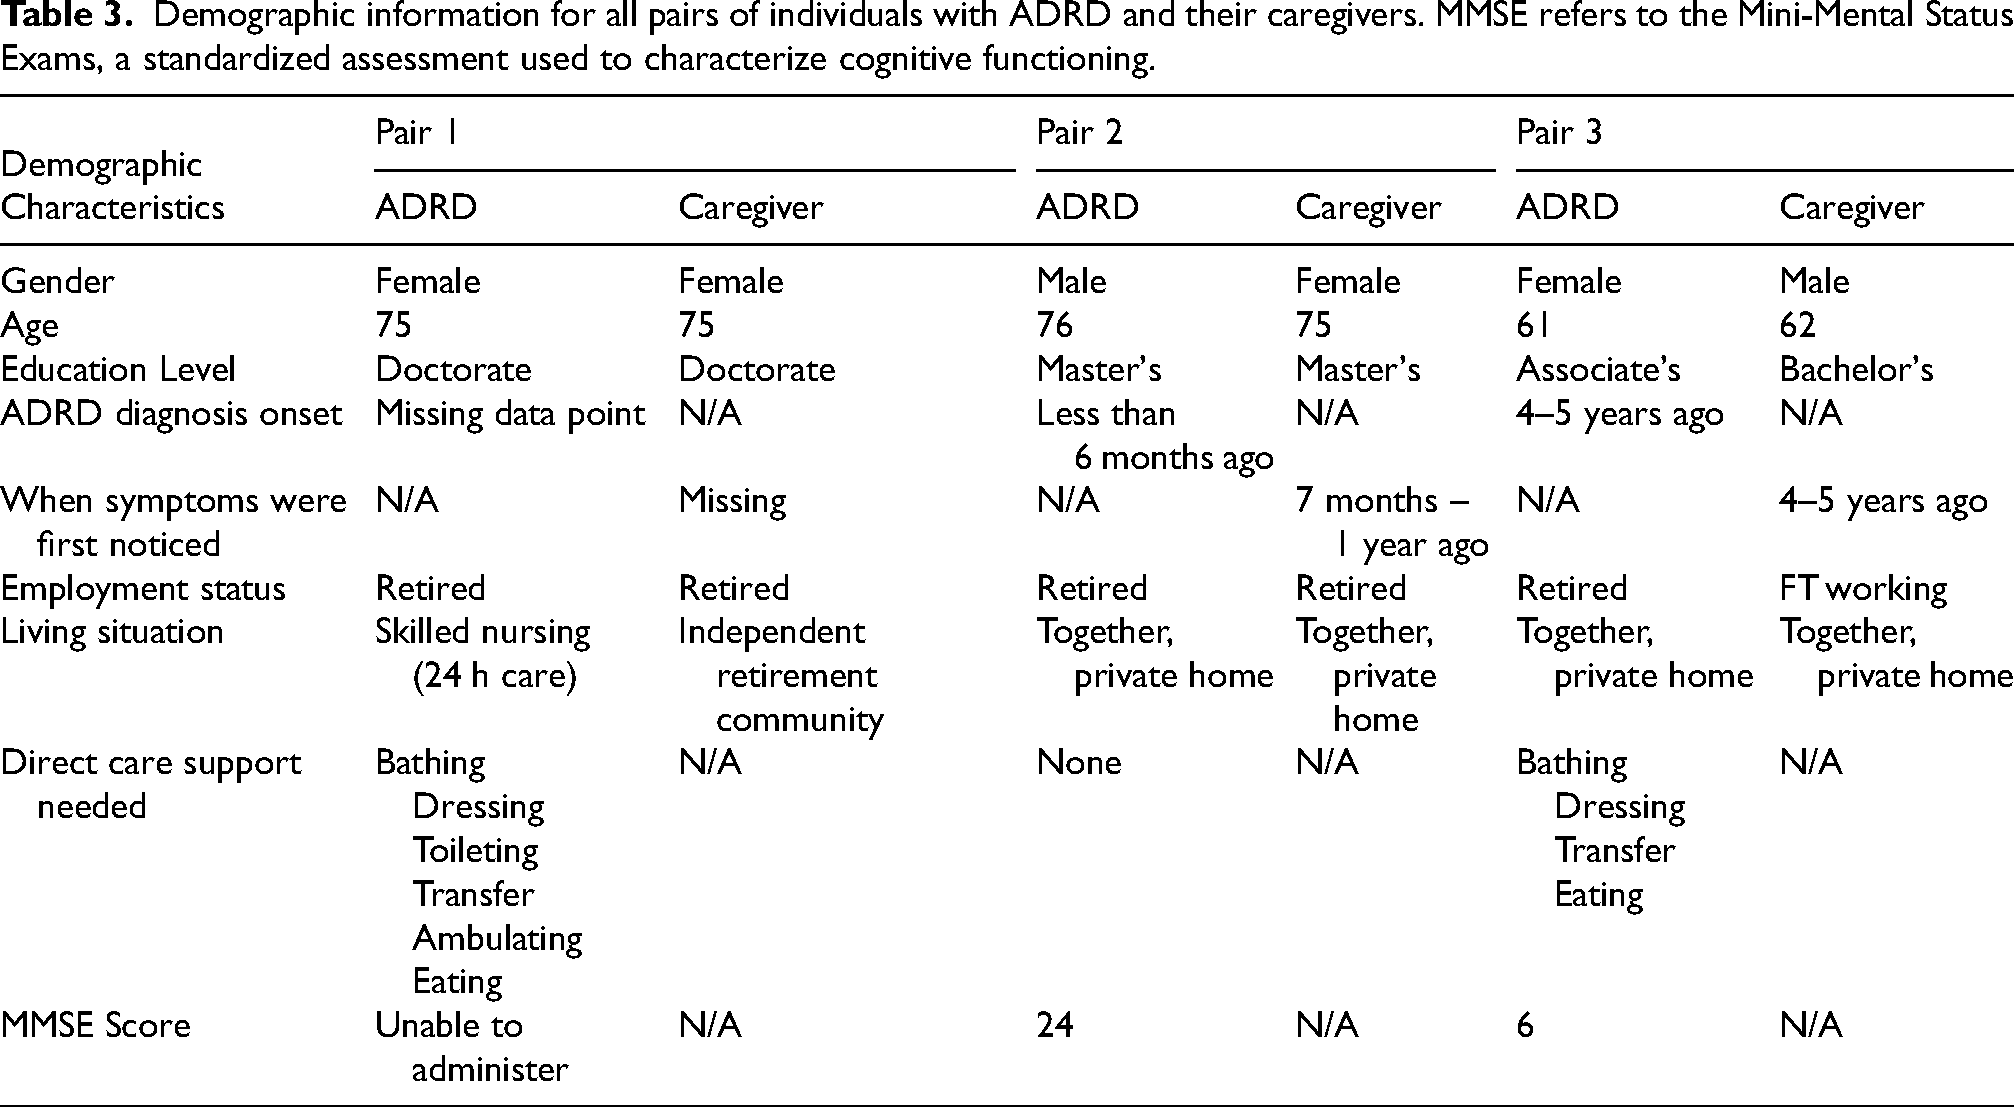
Participants were recruited through word of mouth, flyers posted in the community, and listings on local websites targeted towards older adults in Southwest Virginia over a one-month timespan. Three participant pairs (six participants total) enrolled in the study. Each participant pair met the inclusion criteria consisting of: (1) age 55+; (2) age-matched within five years of each other; and (3) one person having a probable diagnosis of ADRD as verified by their primary care physician and the other person being their primary caregiver. The demographics intake form gathered information about each pair and asked caregivers to provide a timeframe regarding when they began noticing symptoms of ADRD in their participant/partner (Supplemental Figure 1). This information was gathered to give researchers an idea about when the onset of the disease began. This information, listed as “ADRD diagnosis onset” in the table below, is missing for one participant pair as the caregiver did not provide this information (Table 3). This study was approved by the Virginia Tech Institutional Review Board. All participants signed informed consent before participating in any study procedures.
Team science approach
This collaborative effort leverages the strengths and expertise of a wide range of investigators to address how to best invite individuals with ADRD and their caregivers to participate in research. Our team of creative arts therapists, neuroscientists, dementia care experts, creative technologists, and gerontology experts contributed to this case series.
Undergraduate research assistant training
A team of interdisciplinary undergraduate research assistants (URAs) were trained to support data collection. Their training and involvement in this project was paramount to the data collection process. In addition to confidentiality and protocol training, URAs completed the Dementia Friends® program 30 and communication training with the researchers. In communication training, URAs learned and practiced strategies on how to engage effectively with individuals experiencing ADRD utilizing person-centered care approaches 31 and validation techniques. 32 URAs also learned to detect nonverbal cues that could indicate distress from a person with dementia to help alleviate potential anxiety.
Each URA was intentionally paired with a participant—either an individual with ADRD or their caregiver—serving as their key support throughout the 12 weeks of data collection. In addition to welcoming participants at the start of each session, they conducted a pre-session intake to gather information on potential changes and medication/caffeine consumption prior to arrival and donned/doffed EEG caps. URAs also verbally assented each participant prior to every session, to assure their comfort and readiness to engage in the process, as well as offered opportunities for debriefing at the conclusion of each session. During the music therapy sessions, URAs did not participate in music making, but observed the sessions from a catwalk above (see Figure 1(a) for the view URAs experienced during the data collection sessions). URAs dressed in dark clothing and moved discreetly on the catwalk to avoid drawing attention from the research participants below. The lighting in the space was dark so that the URAs were not easily visible. The catwalk was available on both sides of the space and URAs were evenly distributed to be able to observe the front/face of their assigned participant to log “moments of interest,” described later in this manuscript. In addition to these direct interactions with participants, URAs received training in recognizing nonverbal communication and movement, 33 guided by a board certified Dance-Movement Therapist. This was done to support live observational data logging using a novel system that was integrated into the wireless EEG caps, which was developed with our creative technologists.
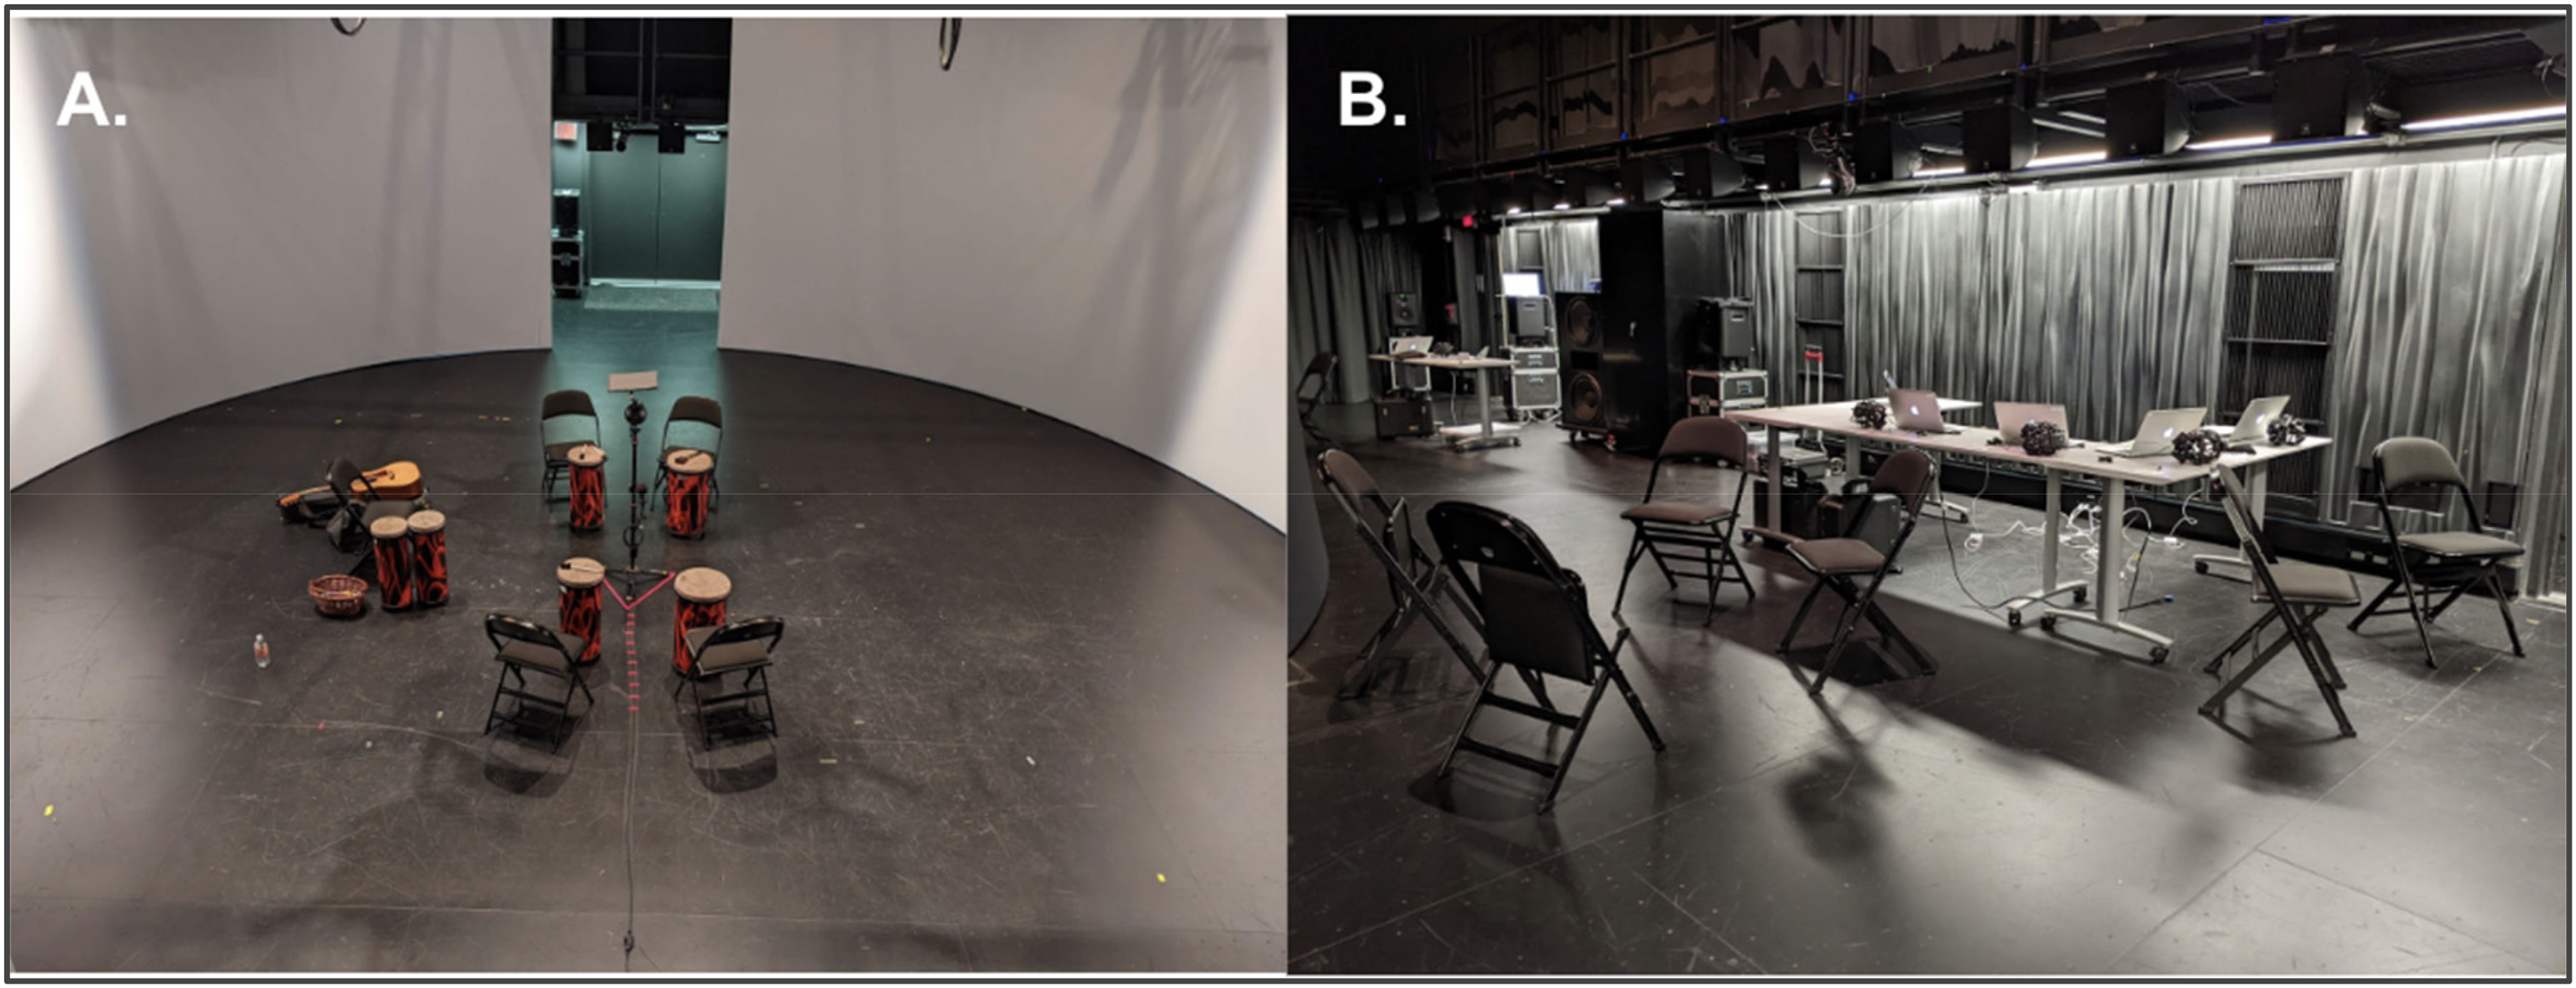
The Cube at Virginia Tech: (a) music therapy set up within the cyclorama; (b) electroencephalography recording set up, located outside of the cyclorama.
Setting and procedures
Participant pairs were initially screened for eligibility by the researchers via email or phone inquiry. Once eligibility was verified, an information meeting was held with each participant pair to review the research procedure and consent forms. Participants were then introduced to the EEG caps that would be used during the session, with their function and purpose in the study explained. Participants were invited to explore and try on the cap to help desensitize them to the physical sensations of the cap. A follow-up meeting was held one-week later to answer any additional questions and obtain consent. At this time, participants completed an intake demographics survey, a musical preferences survey, and were given a diagnosis verification form to be completed by the participant with ADRD's primary care physician.
Once three participant pairs were consented, twelve weekly group music therapy-informed sessions were scheduled, with a goal of collecting viable data from at least eight sessions. Sessions were planned for consistent days and times. Sessions were held in The Cube at Virginia Tech, a five-story, highly adaptable space for research with technology capabilities to support data capture (https://icat.vt.edu/studios/the-cube.html; Figure 1). Data collection sessions lasted approximately 1-h each week, as follows:
Upon arrival, participants were greeted, assessed for any important changes and completed a daily intake form to determine medication (prescription and over the counter) or caffeine consumption earlier in the day with their assigned URAs (Supplemental Figure 2). URAs verbally assented participants prior to donning EEG caps, which were checked and verified by EEG Technicians (i.e., graduate students trained in EEG application and analysis). Participants then engaged in approximately 30 min of protocolized active and/or passive group music therapy informed experiences (design and sessions outlined below) by a board-certified music therapist. EEG caps were removed, and participants were given an opportunity to debrief.
At the conclusion of the 12 sessions, participant pairs met with the researcher again for a debriefing using supportive psychotherapy techniques. 34
Music therapy design
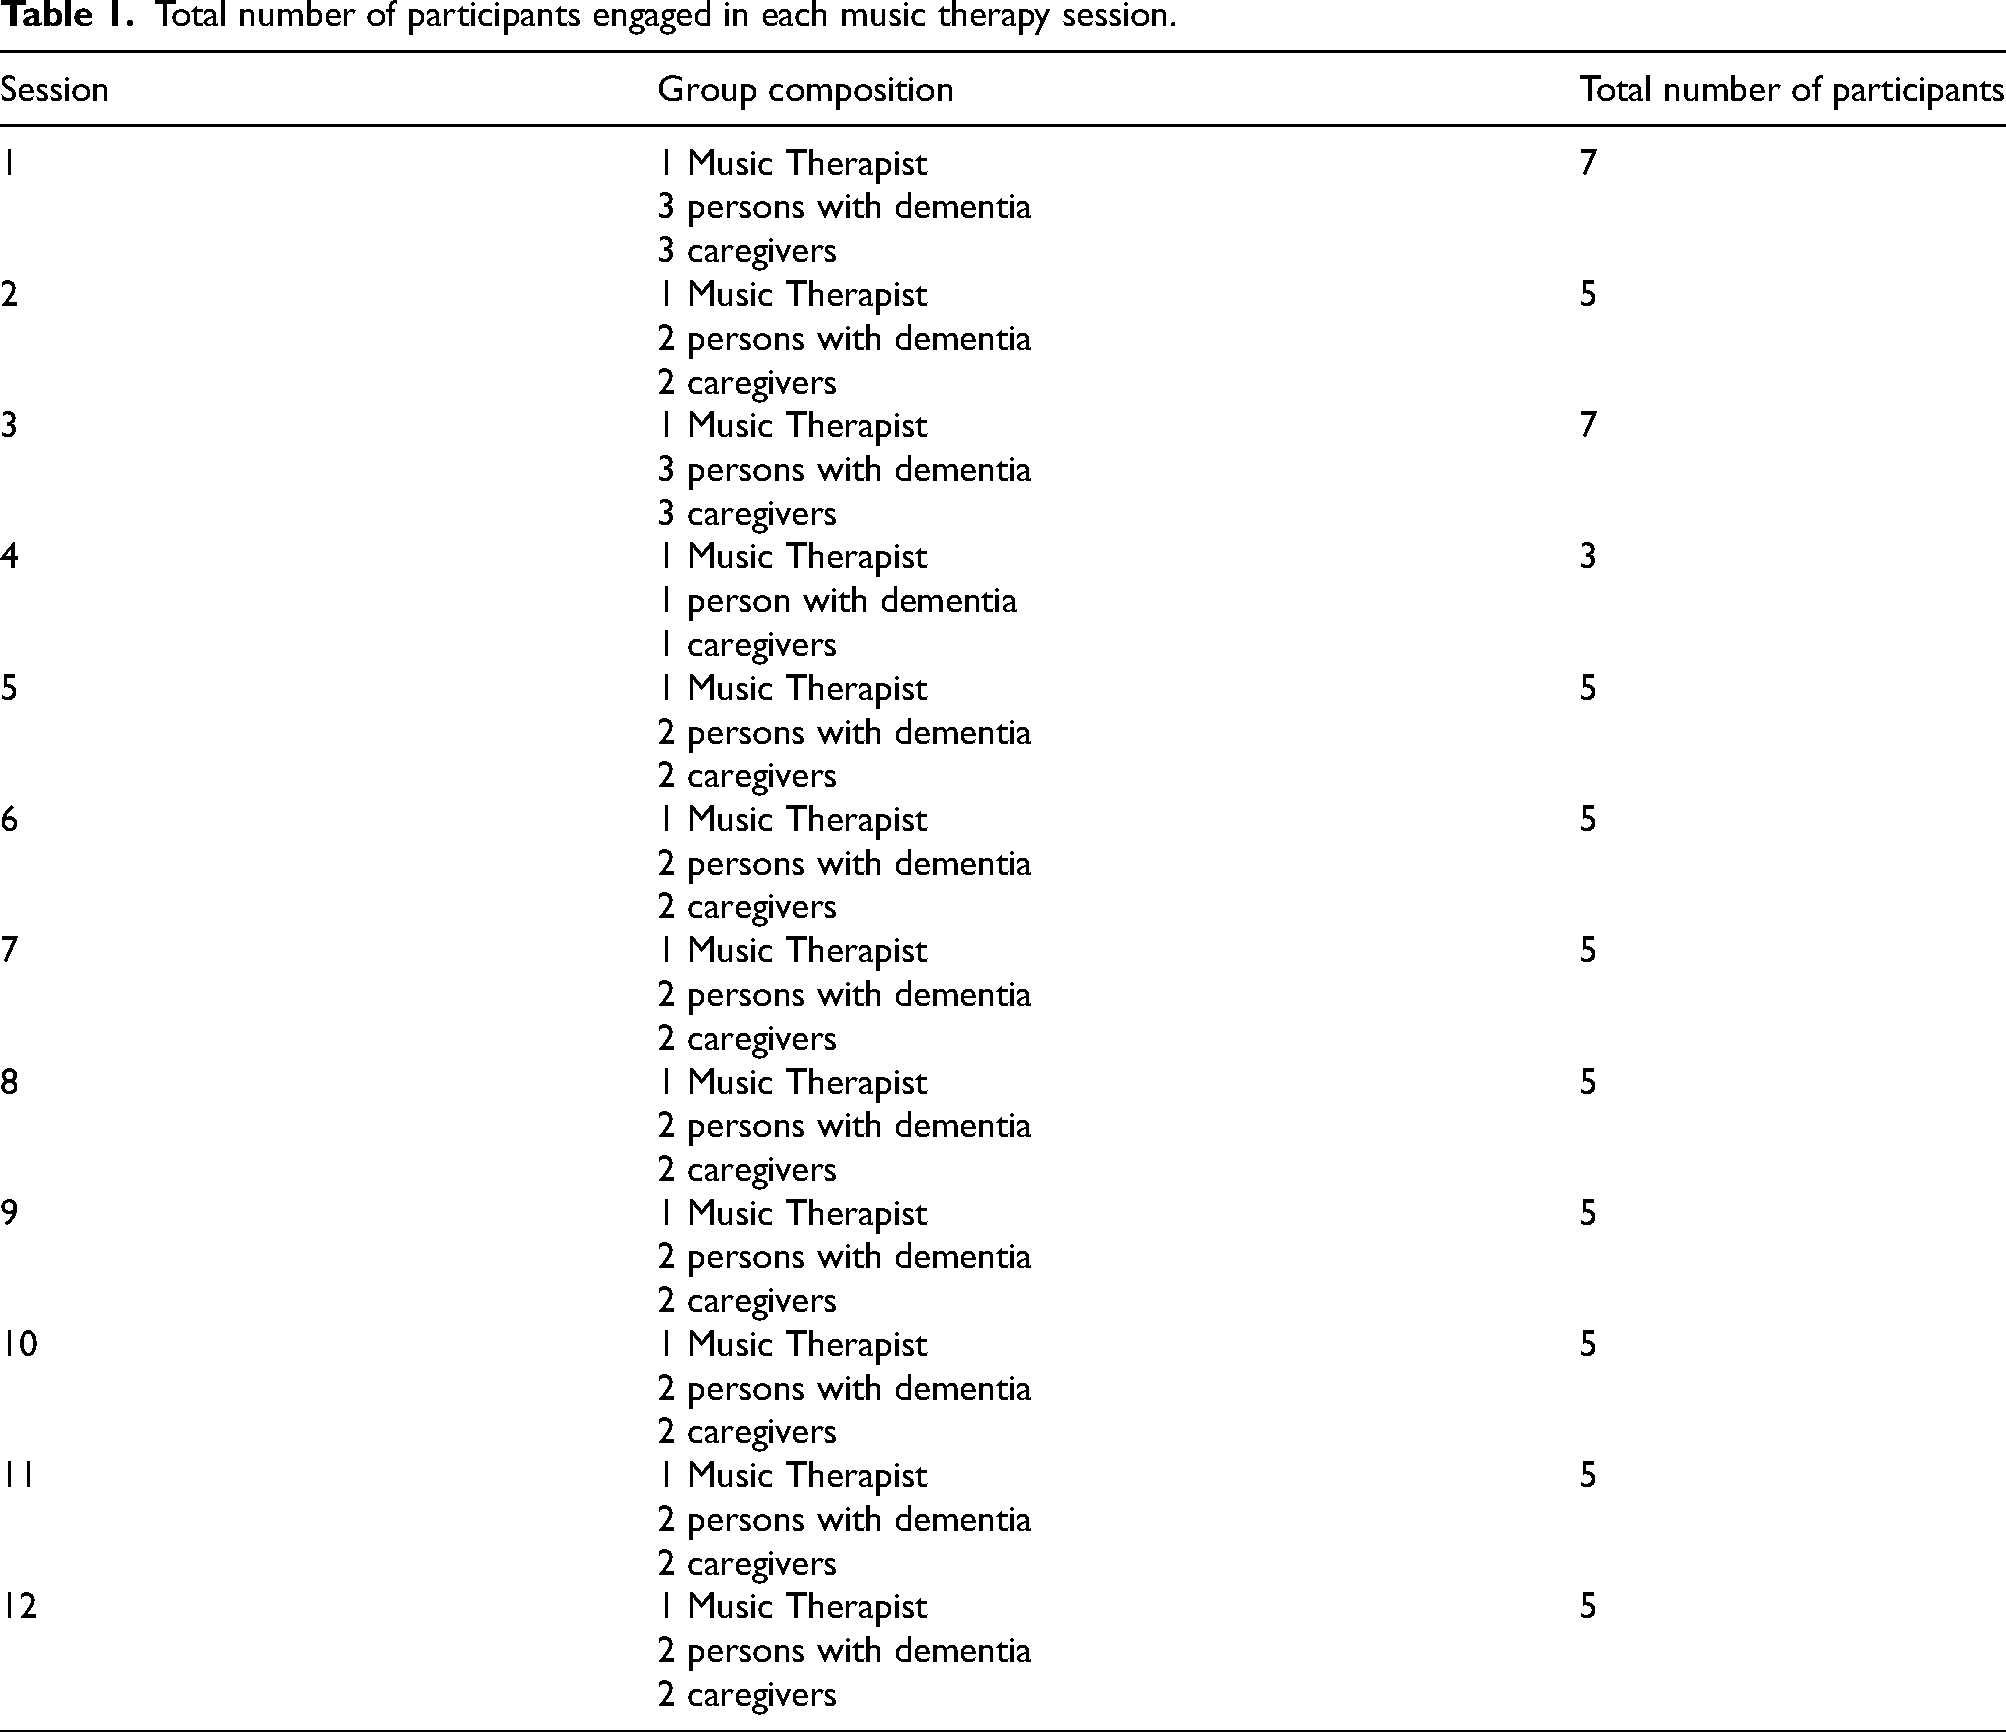
The session facilitator was a board-certified music therapist with 25 years of practice. Our music therapy design was based on a systematic review indicating that active music making experiences such as improvisation and recreative methods, as well as music listening experiences, are effective strategies when working with those with ADRD. 9 This literature also highlighted the importance of music selections based on the preferences of the clients, which is why participants were asked to identify favorite songs or genre preferences through the completion of a musical preferences inventory. Music therapy strategies employed in this protocol consisted of four main music methods which included, improvisation, recreative, receptive, and composition. Improvisational methods included the extemporaneous creation of music using instruments, voice, or a combination of both. Recreative methods included precomposed music that was performed by a client(s), a therapist, or by client(s) and therapist together. Receptive methods involved listening to music, and included the experiences, thoughts, feelings, fantasies, or body sensations that accompanied the act of listening to and receiving the music. Compositional methods included the creation of original music. 35 Collectively, the study included music interventions that were specifically designed to offer a variety of opportunities for social interaction, solo and group music making, and receptive listening experiences during these group music therapy sessions. Table 1 outlines how many participants were present during each session.
Total number of participants engaged in each music therapy session.
The music therapist implemented a standard protocol across all sessions that included a verbal greeting and check-in with participants, followed by singing a song with guitar accompaniment. Individuals were invited to sing along (active) or listen (receptive). In advance of the study sessions, the music therapist prepared songs that were either specifically requested or were within the same genre as those indicated by participants. After the first few sessions, individuals began requesting specific songs for the sessions and those songs were used in subsequent sessions. Decisions regarding which songs were used during sessions were made through guided conversations with all participants and the music therapist. After the singing experience, the group participated in drumming activities using frame drums with a mallet or hand drums with a mallet or bare hands. The drumming experiences typically included a call and response section with each participant taking turns to “call” a rhythm while the others “responded” with the same rhythm or a novel rhythm. Participants also played synchronously with everyone playing the same rhythm at the same time. The drumming section ended with drumming improvisation in which dyads or the entire group played together by offering their own rhythms simultaneously to create a type of music ensemble. The dyads were always composed of a person with dementia and a person without dementia, but it was not always a caregiver/care recipient pair. This pairing would be decided as the intervention was being prepared through discussion occurring among the group. Initially, pairs were caregiver/care-recipient pairs. Over time, as relationships among the group members developed, intentional music making with other group members and different pairings occurred naturally. Participants then had the option of exchanging their drums for small egg-shaped shakers or keeping the drum and adding the shaker. The music therapist played and sang other songs that were requested by one or more participants. Individuals were encouraged to sing along, play along, move/dance along, or they could choose to sit and listen to the music. At the conclusion, there was a time for a brief conversation and guided verbal/social interaction among group members.
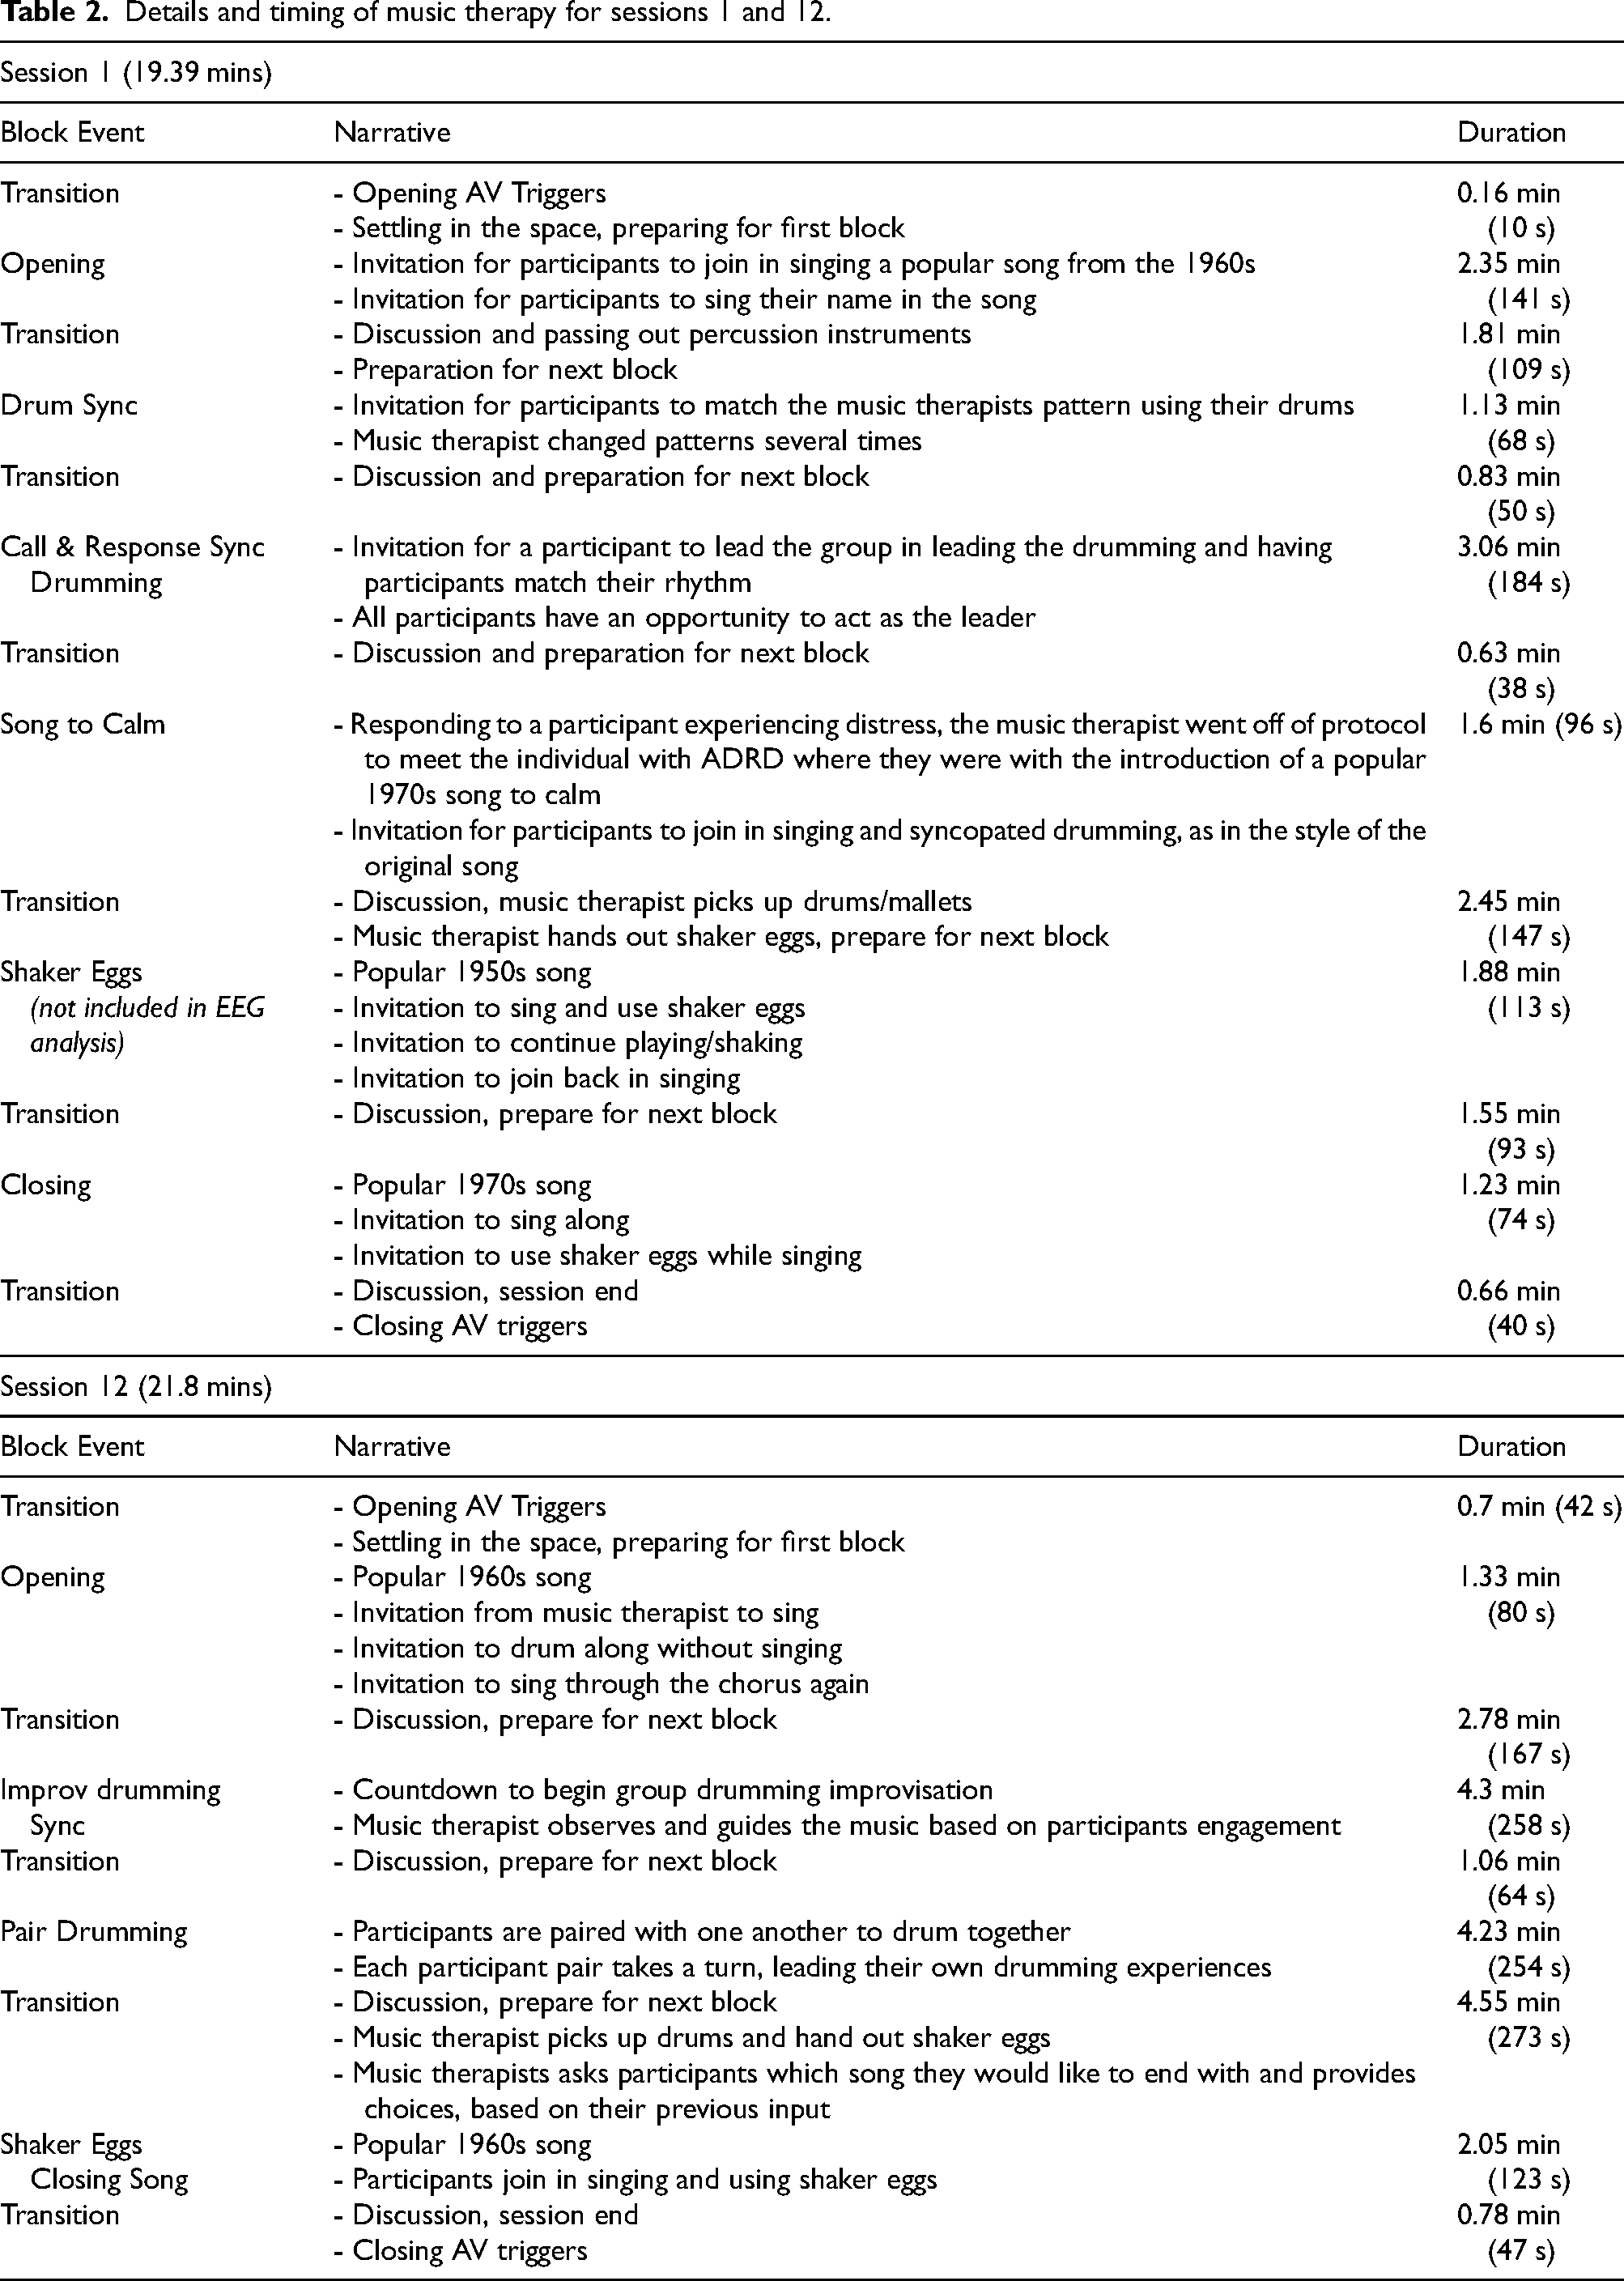
This protocol was developed to access a spectrum of responses from participants. Individuals could receive music passively or engage actively by making music that was melodic and rhythmic or music that was primarily rhythmic. Individuals were encouraged to create both novel musical responses and follow along with someone else; they were also able to recreate familiar music of their choosing. Across all aspects of the session, individuals were encouraged to interact with each other verbally (as able), socially, and musically. The intention was to offer different ways of engaging people that are a normal part of the human experience of making music. The designed music therapy-informed protocol was rehearsed during mock sessions with URAs and other volunteers in the weeks leading up to data collection. As an example, we present all details of sessions 1 and 12 in Table 2.
Details and timing of music therapy for sessions 1 and 12.
Measures completed in the moment, during music therapy sessions
Behavioral data collection using novel media capture for data analysis – 360 audio and video
The investigators deployed an Insta360 Pro 2 360 camera and a Zoom H3VR soundfield microphone to collect audio and video data from each session. Traditionally, video has been collected from the outside looking in with standard HD cameras. With this approach, researchers were able to directly see and code non-verbal communication and movement of all present in the group as well as affective measures of the participant with ADRD during the session at a later time. With the integration of the additional trigger markers, as described below, researchers are also able to align musical elements from the session with EEG and video data.
Observation trigger design, data logging, and integration with Cognionics (CGX)
To synchronize audio, video, and time-dependent data, our Creative Technologist created a Cycling ‘74 Max patch to both locally log trigger events as well as broadcast CGX data to every EEG data logging computer, presented through a graphical user interface (GUI) (Figure 2). This was accomplished by directly addressing the CGX Bluetooth Trigger Transmitter with integer values and Max's [serial] object (Figure 2). In parallel, all trigger events were logged on the Max Trigger Laptop in Max's [coll] object with sub-second accurate timestamps.

Data flow diagram describing how cycling ‘74 max synchronizes audio, video, and time-dependent data.
Several types of triggers were identified by the investigators to log significant events. The first was an audiovisual synchronization trigger, or AV Trigger, which produced test patterns consisting of a screen flash and an audible click. These test patterns (AV triggers) were then printed into the 360-degree camera and soundfield microphone to allow easy alignment of data. The AV Triggers were activated five times at the beginning and end of the session, to support this alignment of video, audio and EEG data and ensure if any bluetooth jitter or lag would need to be addressed (Supplemental Figure 3). The second trigger type was Block Triggers, or Silent Triggers, which were used by the investigators to indicate planned changes in the session, as outlined in the Music Therapy Design.
For the observational data collection, our Creative Technologist used Max to create a simple GUI with one button so each URA could log moments of interest during the session. This GUI, enabled by the miraweb framework within Max, could be accessed with most web browsers, making smart phones and tablets usable input devices for the URAs (Supplemental Figure 4). Each observer's device connected via websocket to the host Max patch on the Cube's in-house 2013 Mac Pro by means of a private wireless network. Clicks were then routed via User Datagram Protocol (UDP) to the Max Trigger laptop computer. Observer clicks were logged both on the Max Trigger laptop computer, as well as through the CGX Bluetooth Transmitters, to every EEG data logging computer (Supplemental Figure 5).
URA “moment of interest” data capture
Prior to data collection, URAs were trained by a Dance Movement Therapist (DMT) to notice and record “moments of interest” on the GUI described above. Guidance for these non-verbal communication/movement moments were based on elements of Laban Movement Analysis (LMA), described later. Elements of LMA were restricted to head/gaze, arms/hands, torso and leg/feet as participants remained seated (for the most part) during music therapy sessions. In addition to observable moments, all URAs, several of whom were musicians, were also advised to listen for audible “moments of interest” in the music being created. These audible moments could include a “feeling of frisson,” which is a phenomenon of chills or goosebumps as a result of music listening. URAs logged both observable and audible “moments of interest” from their observation catwalk position in the space during music therapy sessions through the GUI interface.
Measures completed after session completion, using captured data
Affective state measurements for the individual with ADRD
Completed after the sessions and using the video footage, affective measures for the participant with ADRD were scored using the Apparent Affect Rating Scale 36 (Supplemental Figure 6). This scale is designed to detect signs of pleasure, anger, anxiety/fear, depression/sadness and interest for persons with ADRD. Using the captured video, measures were taken every five minutes, with each category receiving a score that corresponded to how long they were observed in the affective state. Scoring options were as follows: Never, less than 16 s, 16–59 s, 1–2 mins, more than 2 mins or Can’t tell. Pleasure was rated by determining periods in which signs of laughter, singing, smiling, kissing, stroking/gently touching another person, reaching out warmly to another person, or statements of pleasure occurred. Interest was rated by determining periods in which signs of participating in a task, maintaining eye contact, eyes following an object or person, looking around the room, responding by moving or saying something, or turning body or moving toward person or object occurred. Anxiety/fear was rated by determining periods in which signs of shrieking, repetitive calling out, restlessness, wincing or grimacing, repeated or agitated movement, line between eyebrows, lines across forehead, hand wringing, tremor, leg jiggling, rapid breathing, eyes wide, tight facial muscles, or statements of anxiety/fear occurred. Depression/sadness was rated by determining periods in which signs of crying, frowning, eyes dropping, moaning, sighing, head in hand, or statements of sadness occurred. Eyes/head turned down and face expressionless were only counted as sadness if paired with another sign noted above. Anger was rated by determining periods in which signs of physical aggression, yelling, cursing, berating, shaking fist, drawing eyebrows together, clenching teeth, pursing lips, narrowing eyes, making distancing gestures, or statements of anger occurred.
Movement coding with elements of Laban movement analysis
Using the captured video, instances of nonverbal communication through movement coding were measured every 20 s for the duration of each session. Coders were trained in elements of Laban Movement Analysis by a board-certified DMT to recognize signs of nonverbal communication and who they were directed to in the group (toward their partner, toward the facilitator, or toward another group member). Additional guidance regarding dancing, secondary movements and self-focused movements (SF/MR) were also provided in the manual as a resource for coders. Abbreviated definitions of the specific elements to be coded for each participant—whether a person with dementia or their caregiver—are as follows:
Head/Gaze: The observed participant directs the head and/or the eyes toward another person or instrument. Note: Head/Gaze does not include affect, which was coded separately using the Apparent Affect Scale. Torso/Lean: The observed participant leans into another person by rotating the torso and advancing it in the direction of the partner or instrument or by spreading (turning and opening) the torso sideways in the direction of another person or instrument. Alternatively, the observed participant retreats from another person or the instrument by rotating the torso and retreating away from the direction of another person or the instrument. Arms/Hands: The observed participant advances arms/hands forward to reach out to another person or instrument. OR The participant retreats arms/hand away from another person or instrument. Leg/Foot: The observed participant advances their leg/foot forward in space or retreats their leg/foot back in space. The participant moves leg/foot in response to the music.
Upon the completion of coding one practice segment, the DMT met with all coders together to review data entries and continue training. These initial consensus meetings helped the coding manual to be refined, as needed, based on discussion. Coders were assigned additional practice segments, followed by group consensus meetings, until the manual was finalized. Following the coding manual being finalized, coders continued to practice until greater than acceptable (80%) coding accuracy was achieved. Once this level of accuracy to coding to the manual was achieved by all coders, they were divided into coding teams (pairs of coders) and assigned a specific participant to begin coding. Each member of the team completed coding independently. Following their completion of coding a complete session, they held a consensus meeting to confirm internal consistency. These initial meetings were also attended by the DMT to ensure adherence to the coding manual. Upon continued demonstration of acceptable or greater interrater reliability, coding teams (pairs of URAs) continued coding independently and holding consensus meetings following the completion of each session (Supplemental Figure 7).
EEG data collection and analysis
During each music therapy session, persons with ADRD, caregivers, and the music therapist wore an 8-channel dry-electrode EEG cap (CGX, Cognionics, San Diego, CA). The channels were located at Fp1, Fp2, T3, T4, C3, C4, O1, and O2 based on the 10–20 system of electrode placement used for EEG. EEG data was collected at 500 Hz and pre-processed through EEGLAB on MATLAB. 37 The ground and reference electrodes were placed on the earlobes. The data from each person was first filtered with a Hamming windowed sinc FIR filter with cutoffs set at 1 and 45 Hz. Remaining movement artifacts in the data were adjusted and corrected using Artifact Subspace Reconstruction (ASR). 38 Through ASR, segments of data were selected for interpolation if they were 20 standard deviations different from clean/artifact-free segments of the data using a 0.5 s sliding window (50% overlap) principal component analysis (Figure 3).

By implementing a bandpass filter and ASR, significant noise and motion artifacts can be removed by EEG data recording in this setting. We demonstrate an example of preprocessing with a segment of raw data collected from the caregiver (above) and the same data pre-processed with the filter and ASR (below).
As an example of what researchers can do with this data, we compared pre-processed EEG data from one dyad (person with ADRD and caregiver) for sessions 1, 4, 8, and 12. Specifically, we assessed the power of different frequencies of EEG data (1 to 45 Hz) for each electrode for the person with ADRD and their caregiver. The EEGLAB STUDY function allows researchers to compare datasets across different conditions, groups, and sessions. When looking at a specific dyad, researchers can employ a 2-way ANOVA to compare power in different frequency bands across activities that took place during different sessions. If researchers want to generally compare people with ADRD and caregivers across different activities and sessions, they can create a general linear model through the Linear Modelling of MEEG data (LIMO MEEG) toolbox offered as a plugin for EEGLAB.
After pre-processing and analysis through EEGLAB, data needs to be checked for alignment. As an example, we calculated the length of each participant's data from the first observation trigger to the last. To ensure no data was lost throughout other sections of the recording, we calculated the difference in time between observation triggers throughout the entire session. These triggers marked the beginning and end of the sessions, as well as specific activities that took place during the session, including “Call/Response,” “Paired Drumming,” and “Closing Song.”
Sensor-to-sensor connectivity measures in EEG can be used to assess inter- and intra-brain synchrony. These measures can focus on synchrony in power, phase, or coherence. HyPyP is a Python library that calculates these connectivity measures in hyperscanning EEG studies and can be utilized in the music therapy setting to assess neural connectivity between caregivers and people with ADRD. 39 Specifically, .set files exported from EEGLAB on MATLAB can be analyzed with HyPyP on Python using the read_raw_eeglab function from MNE-Python. 40 It is important that data from dyads is properly synchronized, and thus, are of equal length for connectivity to be calculated. As an example of power, phase, and coherence-based connectivity measures possible through HyPyP, we calculated circular correlation, power correlation, and imaginary coherence across activities during different sessions for one dyad (person with ADRD and caregiver). HyPyP displays inter- and intra-brain synchrony through red and blue lines of varying thickness between EEG sensors across individuals (inter) and within an individual (intra). After connectivity is measured across all possible sensors for inter- or intra-brain synchrony, an average connectivity measure is calculated. If a single value of connectivity between a set of EEG sensors is greater than 2 standard deviations from the mean, it will be displayed by HyPyP. Lines that are thicker represent greater distance from the mean, hence, stronger connectivity. Red lines represent positive connectivity and blue lines represent negative connectivity. The threshold of 2 standard deviations can be changed by the researcher, if desired.
Statistical analyses
In this case series, no formal statistical analyses were conducted on the behavioral data; instead, we provide examples of what such data may look like. For future analyses, we recommend using descriptive statistics, t-tests, analysis of variance (ANOVA), and other general linear models to evaluate the behavioral data.
For neural data, statistical comparisons can be made for frequency and connectivity measures. The EEGLAB STUDY function allows researchers to apply statistical analyses when visualizing power spectral density plots across different conditions, groups, and sessions. In the case of comparing a single dyad (person with ADRD and caregiver), researchers can use permutation statistics through a 2-way repeated measures ANOVA and correct for multiple comparisons using the false discovery rate (FDR). Similar statistical methods can be used to compare inter- and intra-brain connectivity measures calculated through HyPyP. In addition to parametric t-tests, permutation tests available through MNE-Python can compare connectivity values calculated for a dyad or for an individual across conditions and sessions.
Results
Participants and adherence to study sessions
Data was collected from n = 3 participants with ADRD-caregiver pairs plus the music therapist (n = 7 participants total). Demographics are presented below in Table 3. The interventionist was a 48 year old female, who is a board certified music therapist with a doctorate degree. For this case series, sample exemplar data is presented. One participant pair completed 12 sessions, one participant pair completed 11 sessions, and one participant pair completed two sessions, dropping out due to transition challenges from their care community to the site for data collection sessions.
Demographic information for all pairs of individuals with ADRD and their caregivers. MMSE refers to the Mini-Mental Status Exams, a standardized assessment used to characterize cognitive functioning.
Measuring the influence of music therapy on affective state in individuals with ADRD
By utilizing 360-degree video capture in combination with the Apparent Affect Scale, we effectively gathered data on the affective states of participants with ADRD. This approach allowed us to explore the impact of music therapy on various positive and negative emotional states both within individual sessions and across multiple sessions. As outlined previously, these measures were taken every five minutes, enabling researchers to easily and sequentially track changes in affect from the beginning to the end of each session. Due to increased exposure and familiarity with the research setting and people, we anticipated a decrease in negatively-associated affective states and/or an increase in positively-associated affective states across the intervention. An example of how these data can be presented is demonstrated in Figure 4.

An example from one individual with ADRD of affective state expression in sessions 1 and 12 using video-based ratings in combination with the apparent affect scale. Ratings were captured every five minutes throughout the session and averaged for these ratings. Values on the y-axis represent the following: 1 = Never; 2 = less than 16 s, 3 = 16–59 s, 4 = 1–2 mins, 5 = more than 2 mins.
Measuring the influence of music therapy on nonverbal communication between group members
By utilizing 360-degree video capture in combination with Laban Movement Analysis, we were able to effectively capture information regarding nonverbal communication. This approach allowed us to explore the impact of music therapy on a range of nonverbal communication strategies including movements of head/gaze, torso/lean, arms/hands, leg/foot towards or away from their partner, facilitator, or other member/s of the group. As outlined previously, these measures were taken every 20 s, enabling researchers to easily and sequentially track changes in nonverbal communication from the beginning to the end of each session. Due to increased exposure and familiarity with the research setting and people, we anticipated that negative forms of nonverbal communication (i.e., movement away from) would decrease and positive forms of nonverbal communication (i.e., movement towards) would increase across the intervention. An example of how these data can be presented is demonstrated in Figure 5.

An example from one individual with ADRD of one element of non-verbal communication (head/gaze) in sessions 1 and 12 using video-based ratings in combination with Laban movement analysis.
Measuring the influence of music therapy on nonverbal communication during music versus non-music
Using the block design as outlined in the Music Therapy Design section of the methods, we were effectively able to capture nonverbal communication during periods of music versus non-music (e.g., silence, transitions, discussion). This design enabled us to test our hypothesis that music may be a significant driver of positive forms of nonverbal communication. An example of how these data can be presented is demonstrated in Figure 6.
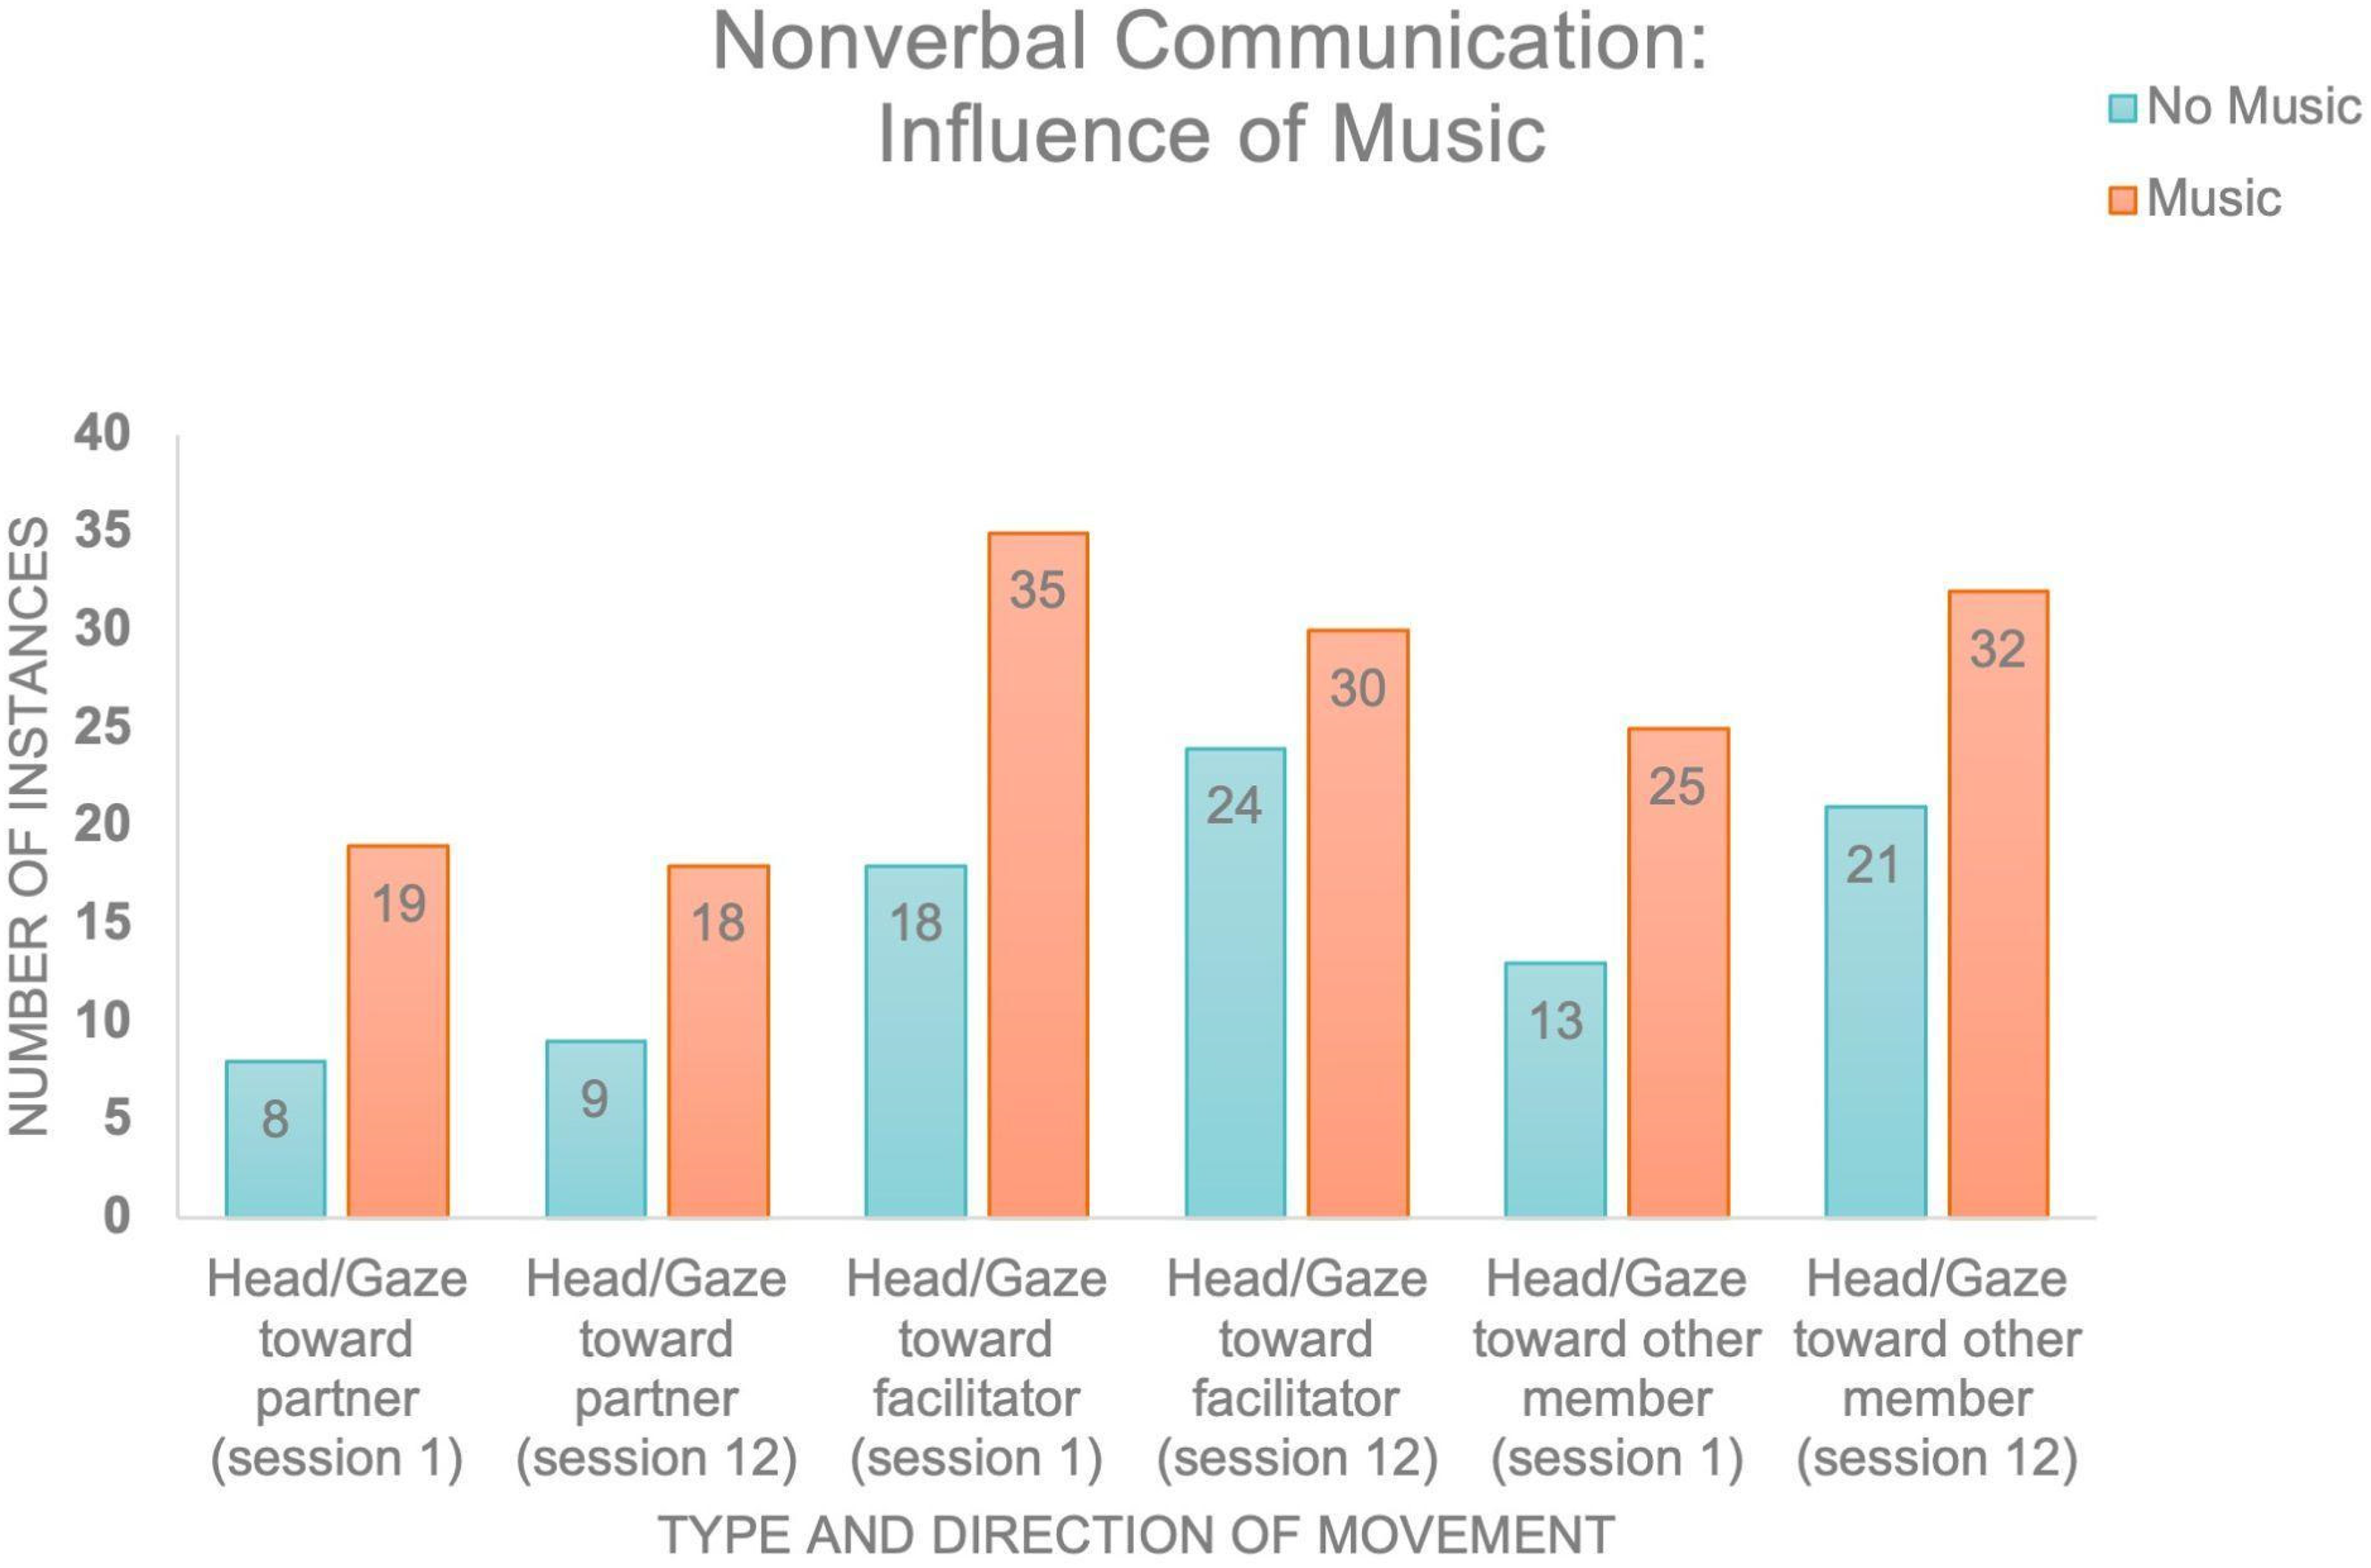
An example of one individual with ADRD of one element of non-verbal communication (head/gaze) during music and non-music periods for sessions 1 and 12.
Measuring the influence of music therapy on interbrain synchrony
Regarding the tolerability of the EEG caps, we found that all participants tolerated wearing the caps well, particularly during the music therapy interventions. The moment the music ended, all participants anticipated having their caps immediately removed, and as such, caps were doffed from the individuals with ADRD first and the caregivers last. After data capture, we were able to effectively recover time stamps such that epochs of relevant time periods were able to be assessed such as “Hello”, “Shake”, and “Sync” analyzed in Figure 7. To demonstrate the cleanliness of EEG data and capacity for analysis, we then assessed the relative power of frequency values between 1–45 Hz across the entire music therapy session for each electrode on each participant. As can be seen in Figure 7, data follows the appropriate 1/f distribution for both the caregiver (top) and person with ADRD (bottom) for sessions 1, 4, 8, and 12. Further, from this data, we were able to effectively analyze the topographical distribution of power in both the caregiver and person with ADRD as well as inter-brain synchrony metrics between this dyad during sessions 1, 4, 8, and 12 (Figure 8).

Power spectral density plots can be created through the EEGLAB study function across sessions for different experiences for the caregiver and person with ADRD.

Interbrain synchrony (HyPyP) and topographical distributions of power (EEGLAB study) can be calculated for different frequency bands. As an example, we calculated imaginary coherence (iCoh) in the alpha frequency band (8–12 Hz) across all electrode pairs between a caregiver (PCG) and a person with dementia (PWD) at four different sessions. iCoh values that are at least 2 standard deviations away from the mean iCoh calculated during that session are displayed. Darker and red lines indicate values that are further from the mean and are positive, respectively. The topographical distributions show Log Power 10*log10(µV2).
Discussion
In this case series, we describe a 12-week music therapy intervention for individuals with ADRD and their caregivers, examining behavioral and electrophysiological outcomes. We had several measures of success, ranging from applied practical techniques associated with data collection to considerations regarding theoretical approaches to working with individuals with ADRD and caregivers (Table 4).
Metrics of success for this study investigating the utility of group music therapy for individuals with ADRD and their caregivers.
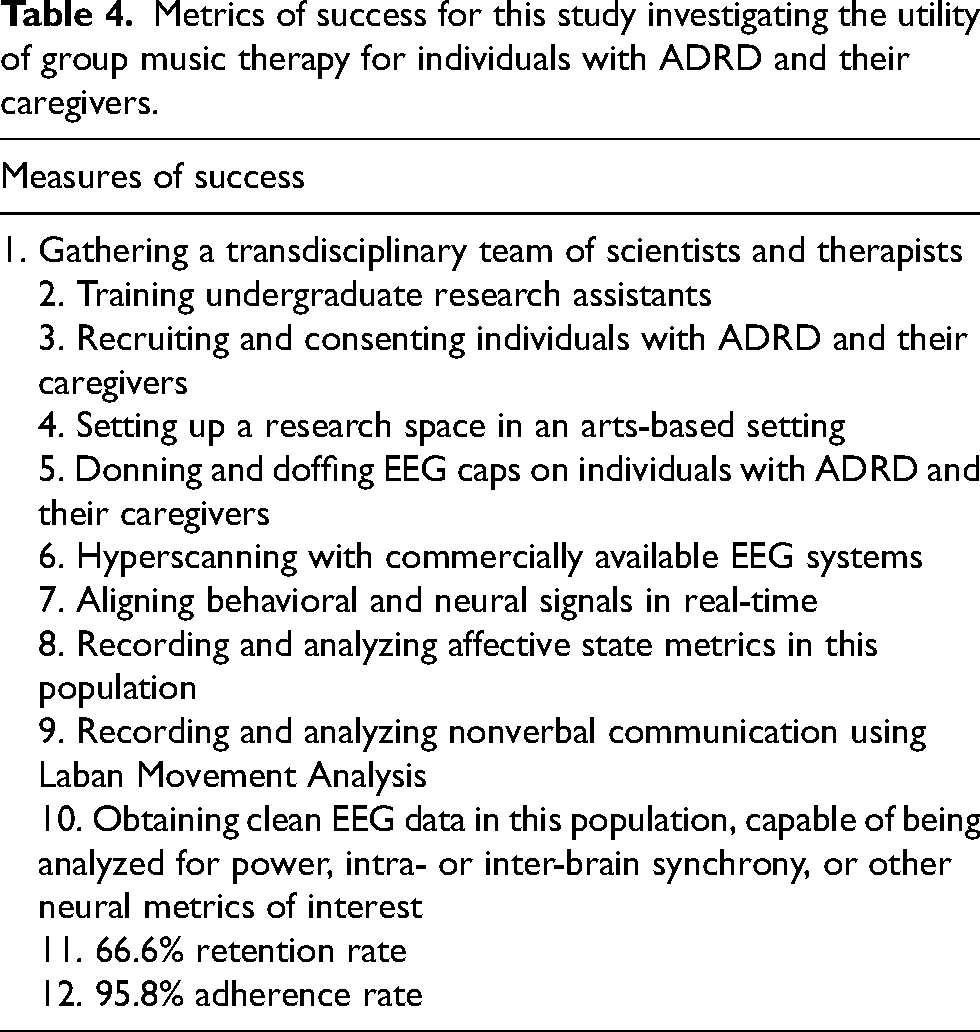
From a scientific perspective, the research team was able to develop and refine approaches to donning and doffing EEG equipment efficiently to minimize discomfort and the amount of time the devices were worn. Additionally, the team was able to develop solutions to synchronize video and EEG data, with devices that were not inherently designed to support hyperscanning. The team also created interfaces to support “moment of interest” marking in data through the GUI interface. We were also able to employ advances in technology through 360-degree video capture to support coding and analysis after data collection sessions. Another significant challenge in collecting behavioral data from individuals with ADRD is their inability to accurately complete self-reported measures (e.g., Beck Depression Inventory, Beck Anxiety Inventory) due to cognitive deficits associated with the condition. To address this, we utilized the Apparent Affect Rating Scale, combined with 360-degree video capture and trained URAs, to effectively capture and analyze affective state metrics. Additionally, the study had a 66.6% retention rate, with 1 out of 3 pairs dropping out. The reported reason for one pair to discontinue data collection was because of transition challenges associated with getting to the data collection site for the PWD from their home environment. In the future, we hope to create opportunities for research to take place in the home environment for persons who experience distress when they leave the home. Importantly, the 2 pairs of participants that completed the study had a 95.8% adherence rate, with 1 pair missing only 1 out of the 12 sessions.
We attribute a significant part of our success to our team-science approach, which brought together creative arts therapists, neuroscientists, dementia care experts, creative technologists, and gerontology specialists, along with a dedicated team of URAs. This multidisciplinary collaboration enabled us to design and conduct a study that addressed the scientific, therapeutic, and practical caregiving needs of individuals with ADRD. Moreover, through extensive training and practice with the URA team, we were able to preserve the personhood of individuals with ADRD, thereby supporting their meaningful participation in the research process.
Importantly, by applying a human-centered design approach, we successfully created a meaningful opportunity to engage individuals with ADRD and their caregivers in the research process, paving the way for further research studies to explore the effects of music therapy on the brain and behavior of individuals with ADRD and their caregivers. Using such a human-centered design approach allowed us to prioritize the needs, experiences, and behaviors of this population, thus ensuring that the final research experience was intuitive, accessible, and aligned to their real-world needs. By meeting individuals with ADRD and their caregivers where they were, they were willing to join us in the research process and participate fully. All members of the team, regardless of their role, completed Dementia Friends and communication training, which enabled the scientific team to create as comfortable of an environment as possible. Future researchers must keep in mind that there are significant challenges associated with researching individuals with ADRD and their caregivers, especially in this type of longitudinal research design that happens at a location away from the place of residence. Such a design requires tremendous efforts from the research participants. Additionally, training a team of undergraduate researchers to support this work poses challenges and issues such as inter- and intra-rater reliability that must be considered. Future research should consider testing the caregivers for cognitive impairment using the MMSE as this would provide a valuable cognitive baseline and help distinguish age-related cognitive changes from dementia-specific decline. We hypothesize that by using a person-centered approach as outlined in this case series, this vulnerable population will be more likely to participate in and complete the study.
In conclusion, given the profound need there is for interventions and support for individuals with ADRD and their caregivers—particularly non-pharmacological approaches—this topic is timely and relevant. This case series serves as an example of how technology and advances in social neurosciences could serve clinical populations. Ultimately, studies such as this with larger sample sizes will be able to test the effectiveness of music therapy intervention on the behavior and brain of individuals with ADRD and their caregivers. Future studies should focus on whether such non-pharmacological approaches can improve the mental and social health of such dyads and if changes in inter-brain synchrony underlie these changes.
Supplemental Material
sj-docx-1-alz-10.1177_13872877251334406 - Supplemental material for Methods for measuring interpersonal behavioral and neural synchrony during group music therapy for individuals with dementia and their caregivers: A case series study
Supplemental material, sj-docx-1-alz-10.1177_13872877251334406 for Methods for measuring interpersonal behavioral and neural synchrony during group music therapy for individuals with dementia and their caregivers: A case series study by Joanna Culligan, Noor Tasnim, Patricia Winter, Tanner Upthegrove, Daniel Fine English and Julia C Basso in Journal of Alzheimer's Disease
Footnotes
Acknowledgments
We would like to thank Dr. Candy Beers for her expertise in dance therapy and Laban Movement Analysis. We would also like to thank Drs. Ben Knapp and Laura Sands for their mentorship and oversight of this project. Finally, we would like to thank Jorg Fachner of Anglia Ruskin University for providing guidance and support on elements of this project.
ORCID iDs

Ethical considerations
This study was approved by and conducted in accordance with the rules and regulations of the Virginia Tech Institutional Review Board.
Consent to participate
Before engaging in any study procedures, all participants provided informed consent.
Consent for publication
Not applicable.
Author contributions
Joanna Culligan (Conceptualization; Data curation; Formal analysis; Funding acquisition; Methodology; Project administration; Supervision; Visualization; Writing – original draft; Writing – review & editing); Noor Tasnim (Formal analysis; Visualization; Writing – original draft; Writing – review & editing); Patricia Winter (Conceptualization; Data curation; Methodology; Supervision; Writing – original draft); Tanner Upthegrove (Methodology; Project administration; Visualization; Writing – original draft; Writing – review & editing); Daniel Fine English (Formal analysis; Supervision; Writing – review & editing); Julia C Basso (Formal analysis; Funding acquisition; Methodology; Supervision; Validation; Visualization; Writing – original draft; Writing – review & editing).
Funding
The author(s) disclosed receipt of the following financial support for the research, authorship, and/or publication of this article: This work was funded through the Virginia Tech Institute for Creativity, Arts, and Technology. This work was also supported in part by the iTHRIV Scholars Program, which is supported in part by the National Center for Advancing Translational Sciences of the NIH (UL1TR003015 and KL2TR003016).
Declaration of conflicting interests
The authors declared no potential conflicts of interest with respect to the research, authorship, and/or publication of this article.
Data availability
The data supporting the findings of this study are available on request from the corresponding author. The data are not publicly available due to privacy or ethical restrictions.
Supplemental material
Supplemental material for this article is available online.
References
Supplementary Material
Please find the following supplemental material available below.
For Open Access articles published under a Creative Commons License, all supplemental material carries the same license as the article it is associated with.
For non-Open Access articles published, all supplemental material carries a non-exclusive license, and permission requests for re-use of supplemental material or any part of supplemental material shall be sent directly to the copyright owner as specified in the copyright notice associated with the article.
