



Abstract
Background
Alzheimer's disease (AD) is influenced by a complex interplay of genetic, immune, and metabolic factors. Identifying plasma proteins causally linked to AD could help clarify these pathways and uncover potential therapeutic targets.
Objective
This study aims to investigate the causal relationships between AD and plasma proteins.
Methods
We conducted a two-stage, two-sample Mendelian randomization (MR) analysis to explore the causal relationships between plasma protein levels and AD risk. In both stages, we used non-overlapping genome-wide association study datasets for exposures (plasma protein levels) and outcome (AD) to ensure robust and independent analyses. We examined both forward (from plasma proteins to AD risk) and reverse (from AD to plasma protein expression) causal effects to elucidate potential bidirectional relationships.
Results
Our MR analysis identified 25 plasma proteins with causal associations to AD, with many implicated in immune and lipid metabolic pathways. These findings reinforce the roles of inflammation and lipid metabolism in AD pathogenesis and offer novel insights into specific proteins that may serve as biomarkers or therapeutic targets.
Conclusions
This study provides further support for the relationship between immune and lipid metabolic dysregulation and AD, advancing our understanding of the molecular mechanisms underlying disease progression and highlighting key proteins for future research and therapeutic development.
Introduction
Alzheimer's disease (AD) stands as one of the most pressing challenges facing healthcare systems worldwide, with its prevalence steadily rising in aging populations.1,2 Effective diagnosis of AD is crucial for timely intervention and management of the disease. However, the pathogenesis of AD is relatively insidious and gradual, which starts to accumulate in the brain approximately 10–25 years before the onset of relative symptoms, hindering the early intervention of this disease.3–5 Biomarkers such as amyloid-beta and tau protein levels in cerebrospinal fluid (CSF), as well as amyloid and tau positron emission tomography (PET) imaging, have shown promise in identifying individuals at risk of developing AD.6–10 Nevertheless, the steep expense of PET scans and the invasive nature of CSF extraction have impeded the widespread adoption of these two tests.11–13
The exploration of blood-based biomarkers emerges as a promising avenue in AD research, offering several advantages over conventional approaches. Blood-based biomarkers are minimally invasive, cost-effective, and readily accessible, making them attractive candidates for large-scale screening and routine clinical use. 11 Moreover, blood biomarkers have the potential to reflect systemic changes associated with AD pathogenesis, encompassing not only neuronal but also vascular and inflammatory processes implicated in disease development and progression. 12 In recent years, several blood-based biomarkers have emerged as potential indicators of AD pathology. Examples include amyloid-beta peptides (Aβ40 and Aβ42), tau protein, neurofilament light chain (NFL), glial fibrillary acidic protein (GFAP), and markers of neuroinflammation such as cytokines and chemokines.12,14–18 These biomarkers reflect underlying molecular changes associated with AD pathogenesis and hold promise in facilitating non-invasive and accessible diagnostic approaches for AD. Although growing evidence have shown the alterations in plasma are associated with AD, the causal link between blood biomarkers and AD remains unclear, further hindering the development of related drugs. Furthermore, traditional observational studies may be susceptible to confounding factors, potentially introducing bias into the results.
Mendelian randomization (MR) employing genome-wide association study (GWAS) summary statistics is a powerful approach in epidemiology and genetics that harnesses the principles of Mendelian inheritance to infer causal relationships between exposures and outcomes. 19 By utilizing genetic variants as instrumental variables, which are randomly allocated during conception and generally unaffected by confounding factors, MR leverages the natural randomization of genetic inheritance to mitigate biases inherent in observational studies. 20 In this study, by leveraging a two-stage two sample MR strategy, we systematically investigated the bidirectional causal relationships between AD and plasma proteomics. We found a total of 25 causal associations between AD and plasma proteomics. Our research provides a valuable perspective for guiding early-stage diagnosis, preclinical prevention of AD through blood proteomics analysis.
Methods
AD GWAS summary statistics data
We firstly downloaded the AD GWAS data conducted by International Genomics of Alzheimer's Project (IGAP) which published in 2019 (here after we called it as IGAP GWAS). 21 IGAP is a large three-stage study based European ancestry. In stage one, 11,480,632 SNPs of 21,982 AD cases and 41,944 cognitively normal controls from four consortia (ADGC, CHARGE, EADI and GERAD/PERADES) were meta-analyzed and 12 loci exceeded the genome-wide significance (p ≤ 5 × 10⁻⁸). In stage two, 11,632 SNPs were genotyped and tested for association in an independent set of 8362 AD cases and 10,483 controls. Meta-analysis of variants selected for analysis in stage 3A (n = 11,666) or stage 3B (n = 30,511) samples brought the final sample to 35,274 clinical and autopsy-documented AD cases and 59,163 controls. Due to the small set of SNPs in stage two and the unavailability of stage three, we downloaded the full summary statistics of stage one from https://www.niagads.org/datasets/ng00075.
We also utilized the AD GWAS data processed by European Alzheimer & Dementia Biobank (EADB) consortium, which published in 2022 (here after we called it as EADB GWAS). 22 In summary, EADB conducted a two-stage GWAS meta-analysis of AD. The first stage involved 39,106 clinically diagnosed AD cases, 46,828 proxy-AD cases, and 401,577 controls from 12 European ancestry cohorts, including EADB-TOPMed, EADB-HRC, EADI, GERAD, Bonn, RS1, RS2, R@ACE/DEGESCO, DemGene, CCHS, NxC and UKBB-P. Variants with a p value less than 1 × 10⁻⁵ in stage one underwent further meta-analysis with three additional cohorts, totaling 111,326 AD cases and 677,663 controls. In total, 75 loci associated with AD were identified, with 42 loci being newly defined. We obtained the full summary statistics data from stage one from the European Bioinformatics Institute GWAS Catalog (https://www.ebi.ac.uk/gwas/) using accession no. GCST90027158, as the data from stage two contained only partial statistics which were unsuitable for MR analysis.
The IGAP GWAS and EADB GWAS had partially overlapping samples, mainly from EADI and GERAD, with an estimated maximum of 5270 AD cases and 13,491 controls overlapping in the two GWASs. The overlapping samples accounted for less than 5% of the EADB, and therefore had less impact on the results of this study.
Plasma proteomic GWAS data
We obtained plasma proteomic GWAS data from the study conducted by Sun et al. 23 In their research, Sun et al. performed protein quantitative trait loci (pQTL) analysis of 2922 plasma proteomic profiles across eight panels (cardiometabolic, cardiometabolic II, inflammation, inflammation II, neurology, neurology II, oncology, and oncology II) comprising 52,363 participants of European ancestry from the UK Biobank. Similar to the AD GWAS approach, Sun et al. conducted a two-stage pQTL mapping, encompassing both cis (within 1 Mb from the gene encoding the protein) and trans (outside 1 Mb or different chromosomes) mapping. In the discovery stage, they analyzed 16.1 million imputed variants for 2922 proteins from participants of European ancestry within the randomly selected baseline cohort (n = 34,557). A total of 14,287 associations across 3760 independent genetic regions passed the multiple testing-corrected threshold of p < 1.7 × 10⁻¹¹. Additionally, employing a less stringent threshold of p < 5 × 10⁻⁸, they identified 29,018 associations across 2519 proteins. In the replication stage, 8092 associations with p < 1.7 × 10⁻⁵ were replicated in 17,806 European participants. We obtained the summary statistics data for 2490 analytes (some proteins were analyzed multiple times in different panels) from the discovery stage via Synapse (https://www.synapse.org/) under accession no. syn51365303.
The second large scale GWAS data of plasma proteins were based on the 35,559 Icelanders. 24 Briefly, Ferkingstad et al. analyzed 4907 aptamers that measure 4719 plasma protein levels with SomaScan multiplex aptamer assay in 35,559 Icelanders with both genotype and phenotype information. Genotype information of 27.2 million variants were discovered through whole-genome sequencing. Then, pQTL mapping were conducted based on the protein levels and genotype information of the 35,559 Icelanders both in cis (within 1 Mb from the gene encoding the protein) and trans (outside 1 Mb or different chromosomes). We downloaded the GWAS summary statistics data of 4907 proteins from https://www.decode.com/summarydata/.
Genetic instrumental variables
We selected the eligible instrumental SNPs as we and others previously described.25–27 Briefly, we firstly extracted independent SNPs associated with exposures using PLINK (version 1.9) clumping method with the following parameters: –clump-p1 5E-8 –clump-r2 0.001 –clump-kb 10000. 28 Genotype information of European samples from 1000 Genomes projects were used as clumping reference panel. 29 Confounding factors in MR can distort causal effect estimates by introducing spurious associations between the exposure and outcome, potentially leading to biased results. To avoid potential confounding, we excluded the IVs which showed significantly associated (p < 5 × 10⁻⁸) with alcohol consumption (drink per week) and smoking status (cigarettes per day). 30 SNPs strongly associated (p < 5 × 10⁻⁸) with the outcome were also removed. Next, the summary statistics data of exposure and outcome were harmonized to ensure that the effect alleles of potential instrumental SNPs in exposure and outcome GWASs were signed to the same alleles. SNPs with ambiguous strands (i.e., A/T or G/C) and intermediate allele frequencies (>0.42) were removed. Finally, to detect and correct for horizontal pleiotropic outliers, the Mendelian randomization pleiotropy residual sum and outlier (MR-PRESSO) approach was used to exclude outlier SNPs. 31 We set the NbDistribution as 1000 to calculate the empirical p-values for the MR-PRESSO distortion test and SNPs with p-value < 0.05 were removed. The remained SNPs were used as IVs for inferring the causality between exposures and outcomes.
Weak instrumental variables in MR analyses can introduce bias, reduce statistical power, and heighten sensitivity to violations of key assumptions, ultimately compromising the reliability and accuracy of causal effect estimates. We calculated the F statistics to measure whether there was week IVs using the following formula: F = R2(N–k–1)/k(1−R2), in which R2 was the sum variance of exposure explained by selected IVs, N was the total sample size of exposure GWAS, k was the number of IVs. 32 We got the Ri2 of each IVi by using the following formular: Ri2 = betai2/(betai2 + s.e.i2 × n), in which beta was the genetic effect size of IVi in exposure GWAS, s.e. was the standard error of effect size and n was the sample size of exposure GWAS. 33 The R2 of all the IVs was the sum of R2 of each genetic IVs. If the F statistic was greater than 10, we assumed that the MR results were less affected by weak instrumental variables. 34
Two-stage and bidirectional two-sample Mr design
We conducted a two-stage and bidirectional two-sample MR study. In the forward study of stage one, the 2922 plasma proteomic profiles from UK Biobank were used as exposures and the AD GWAS summary statistics from IGAP was used as outcome. Both samples of the exposures and outcome were all from European ancestry but had no overlap as they from different consortiums. In the reverse study, we swapped the exposures and outcome, using AD as exposure and 2922 plasma proteomic profiles as outcomes to measure the influence of AD on the expression levels of plasma proteins. In stage two, we leveraged the samples from different consortiums to repeat the study. We used the EADB AD GWAS and GWASs of 4907 plasma proteins from Icelandic population. Both samples of the two datasets originated from European ancestry but had no overlap.
Mendelian randomization estimates
We inferred the causality of exposure(s) on outcome(s) based on five different methods by using the TwoSampleMR R packages (version 0.5.6).35,36 The method of inverse variance weighting (IVW), which combined the estimates from individual genetic variants in a meta-analysis framework, was employed as the primary MR analysis method. 19 This method assumed that all the IVs were valid or horizontal pleiotropy-balanced and provided a weighted average where more precise estimates have greater influence. Other methods, including weighted median, 37 MR-Egger, 38 robust adjusted profile score (MR.RAPS) 39 and weighted mode 40 were used as auxiliary methods to estimate the causality. MR-Egger regression extended IVW method by allowing for the detection and adjustment of directional pleiotropy, where the genetic variants influence the outcome through pathways other than the exposure. 38 The weighted median method provided a robust estimate by taking the median of the IV estimates, weighted by their precision, offering resistance to outliers. 37 The MR.RAPS method further adjusted for weak instrument bias and horizontal pleiotropy, enhancing the robustness of the causal inference. 39 Lastly, the weighted mode method identified the most common causal effect estimate among the genetic variants, assuming that the largest group of instruments with similar effects represents the true causal effect. 40 The p-value of the IVW method was adjusted using the Benjamini & Hochberg (BH) method. A causal relationship was considered significant if the corrected p-value was less than 0.05.
Sensitivity analyses
Since MR relies on three fundamental assumptions and results can be influenced by various factors, particularly pervasive horizontal pleiotropy, we conducted a series of sensitivity analyses to ensure the robustness of our MR findings. First, we calculated Cochran's Q statistic, derived from the IVW estimate, to assess heterogeneity among the instrumental variables IVs. 41 Excessive heterogeneity suggests potential violations of model assumptions or that certain genetic variants may not fulfill the IV assumptions. A heterogeneity test p-value > 0.05 indicates minimal heterogeneity impact on the MR results. Second, we performed a pleiotropy test to determine if genetic variants affect the outcome through pathways unrelated to the exposure. MR-Egger regression was used to test for directional pleiotropy, assessing whether the intercept differed significantly from zero, which would indicate the presence of pleiotropy. A pleiotropy test p-value > 0.05 implies that pleiotropy has minimal impact on the MR results.38,42 Finally, we conducted a leave-one-out analysis to further verify MR result robustness. This approach excludes each IV in turn, using the remaining IVs to evaluate whether the exposure's causal effect on the outcome remains significant, thus helping to rule out any undue influence from single IVs on significant causal relationships.
Results
Causal effect of AD on plasma proteomics
We first detected the causal effect of AD on plasma proteomics. At stage I, the AD GWAS from IGAP project was used as exposure, and plasma proteomics from UKB were used as outcomes. Using IVW as the primary method, with independent SNPs significantly associated with AD as IVs, we identified significant causal effects of AD on 21 plasma proteins after BH correction for multiple comparisons (Figure 1A, Supplemental Table 1). However, one causal effect did not meet the exclusion restriction criterion due to a failed pleiotropy test, and eight causal relationships lacked robustness, failing the leave-one-out analysis (Supplemental Figure 1, Supplemental Table 1). Overall, AD demonstrated significant causal effects on 12 plasma proteins, with one protein showing a decrease and the remaining 11 showing increases (Figure 1A). Additional analytical methods supported these findings, indicating consistent causal directions, as shown β values (Supplemental Table 2). Furthermore, we identified 318 proteins that met nominal significance (IVW raw p < 0.05); however, most of these failed the pleiotropy or leave-one-out tests, with only 49 causal relationships proving robust (Supplemental Table 1).
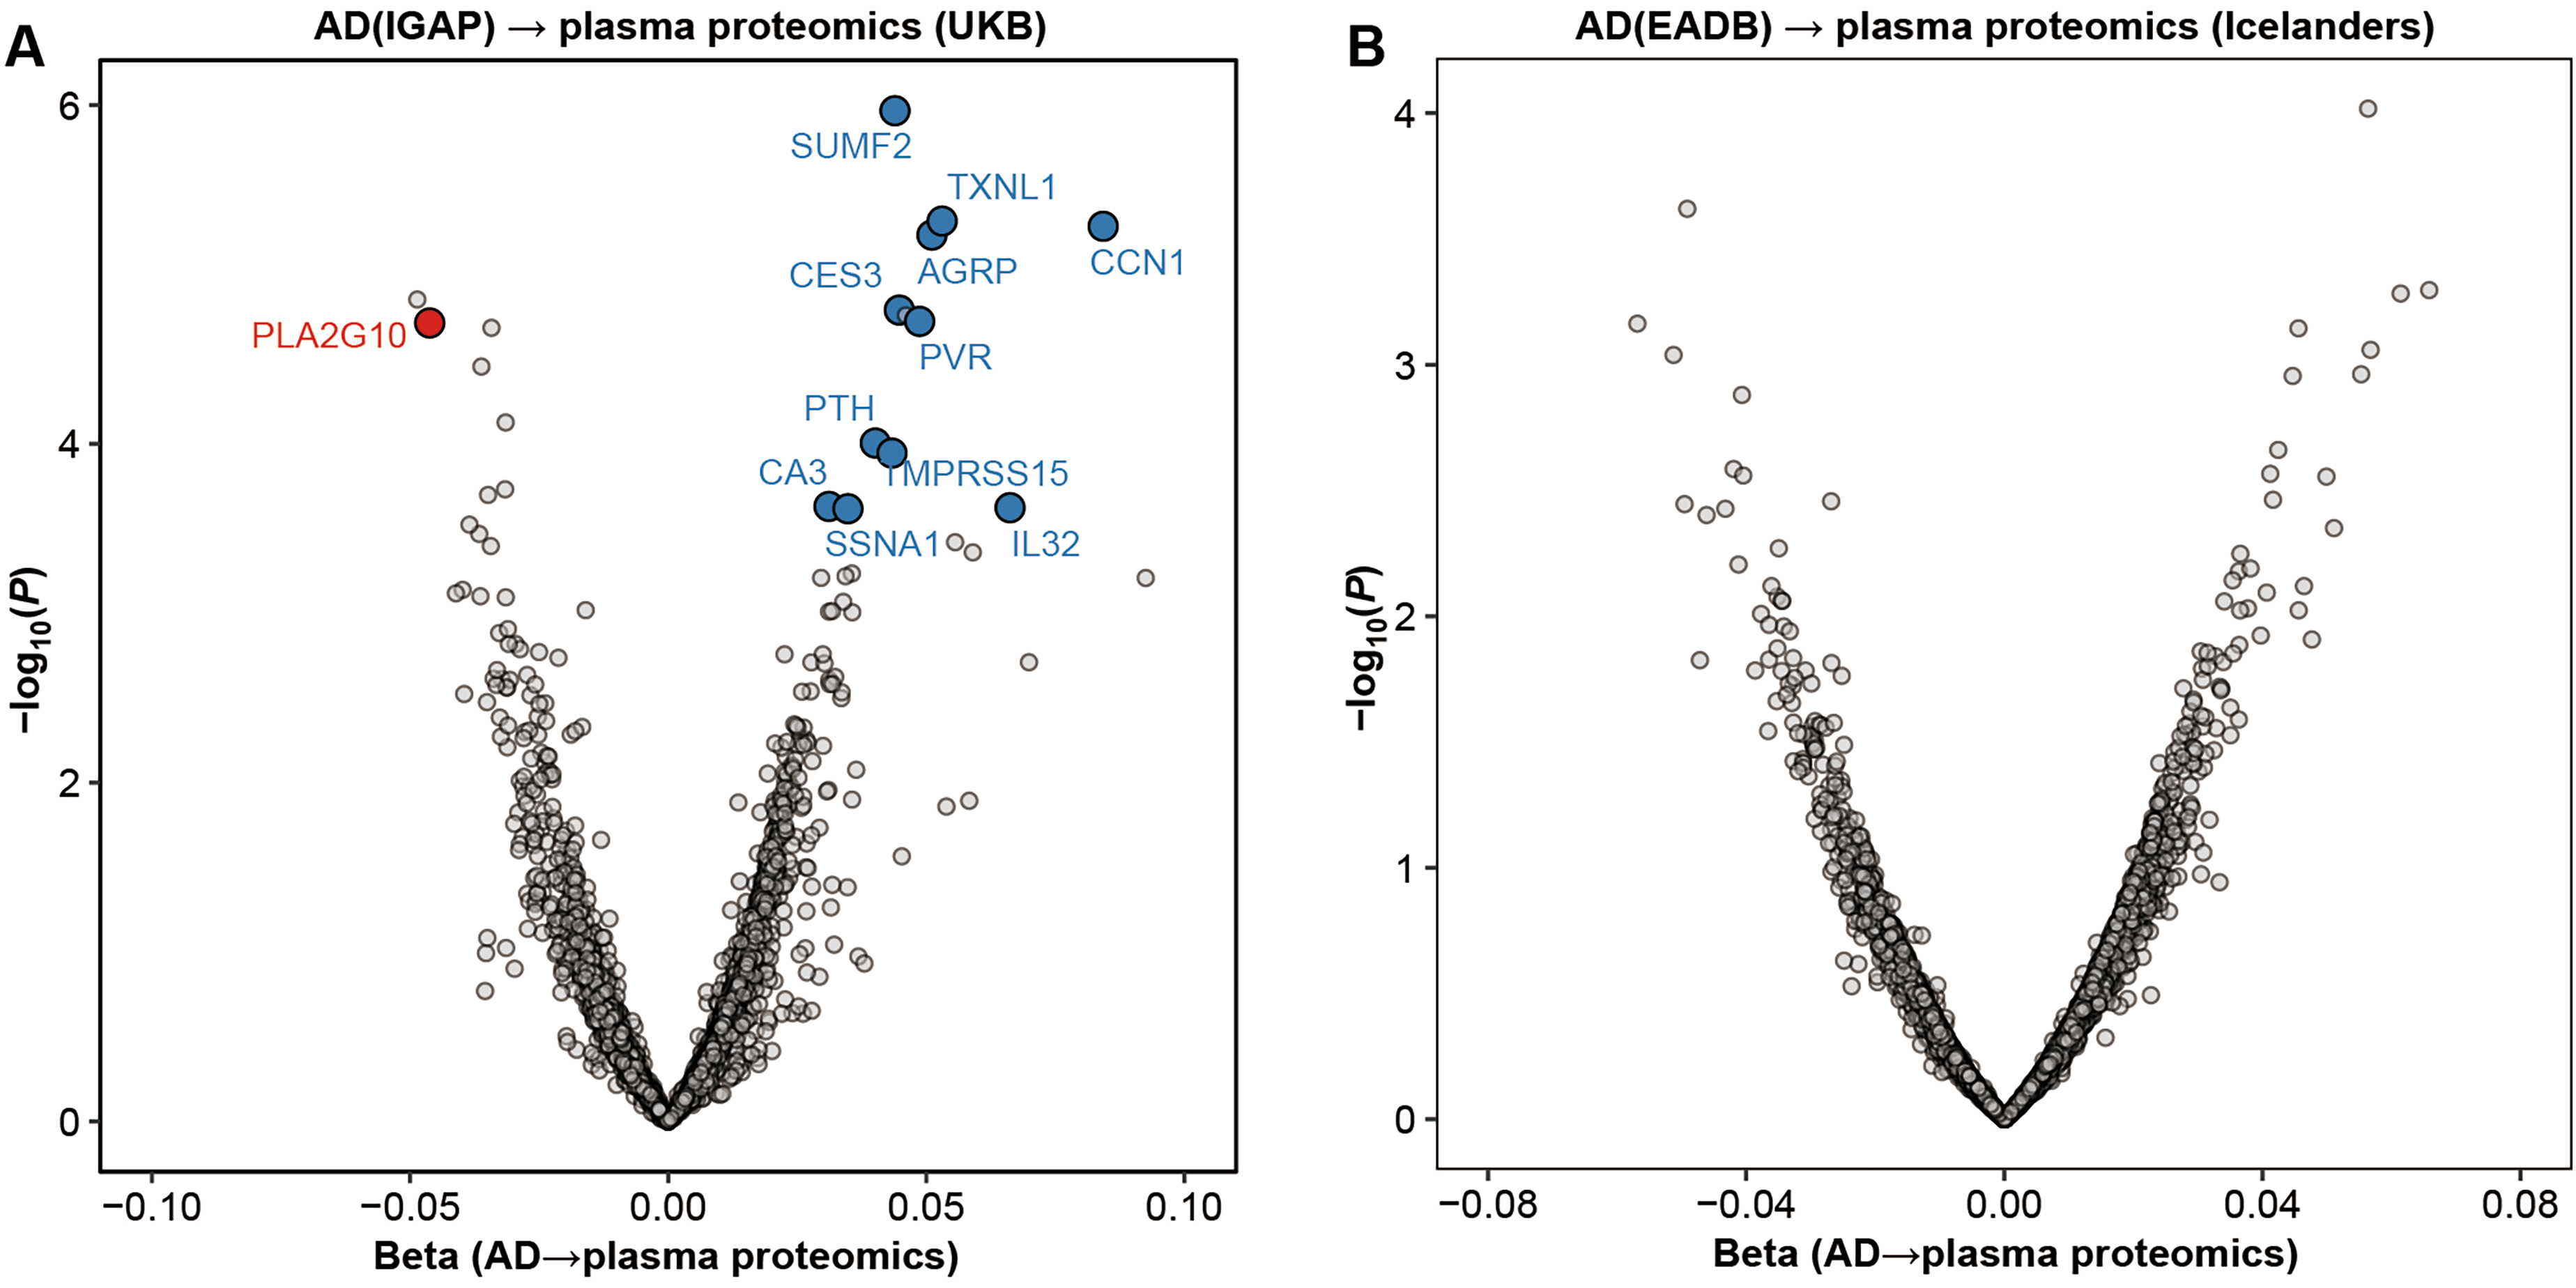
Causal effect of AD on plasma proteomics in stage I (A) and stage II (B). Volcano plot was used to show the MR result. The horizontal coordinate represented the β value estimated by the IVW, and the vertical coordinate was the original p-value. We labeled the significant associations after BH correction, as well as pleiotropy and leave-one-out tests in red (β < 0) and blue (β > 0) enlarged dots.
We replicated the analysis using data from independent studies. In stage II, we utilized AD GWAS data from the EADB project as the exposure and plasma proteomic data from an Icelandic cohort as the outcomes. Although no proteomic associations remained significant after multiple testing correction, 46 proteins achieved nominal significance and passed both pleiotropy and leave-one-out tests (Figure 1B, Supplemental Table 3).
When comparing the findings from stages I and II, we identified two proteins, PLA2G7 and KLKB1, that were nominally significant and exhibited consistent directional effects across both stages (Figure 2A). The IVW method indicated a causal effect of AD on elevated levels of PLA2G7 (Stage I: β = 0.09, p = 6.20 × 10⁻⁴; Stage II: β = 0.05, p = 4.46 × 10⁻³) and reduced levels of KLKB1 (Stage I: β = −0.03, p = 7.22 × 10⁻³; Stage II: β = −0.04, p = 7.59 × 10⁻³) (Supplemental Table 1 and Supplemental Table 3).
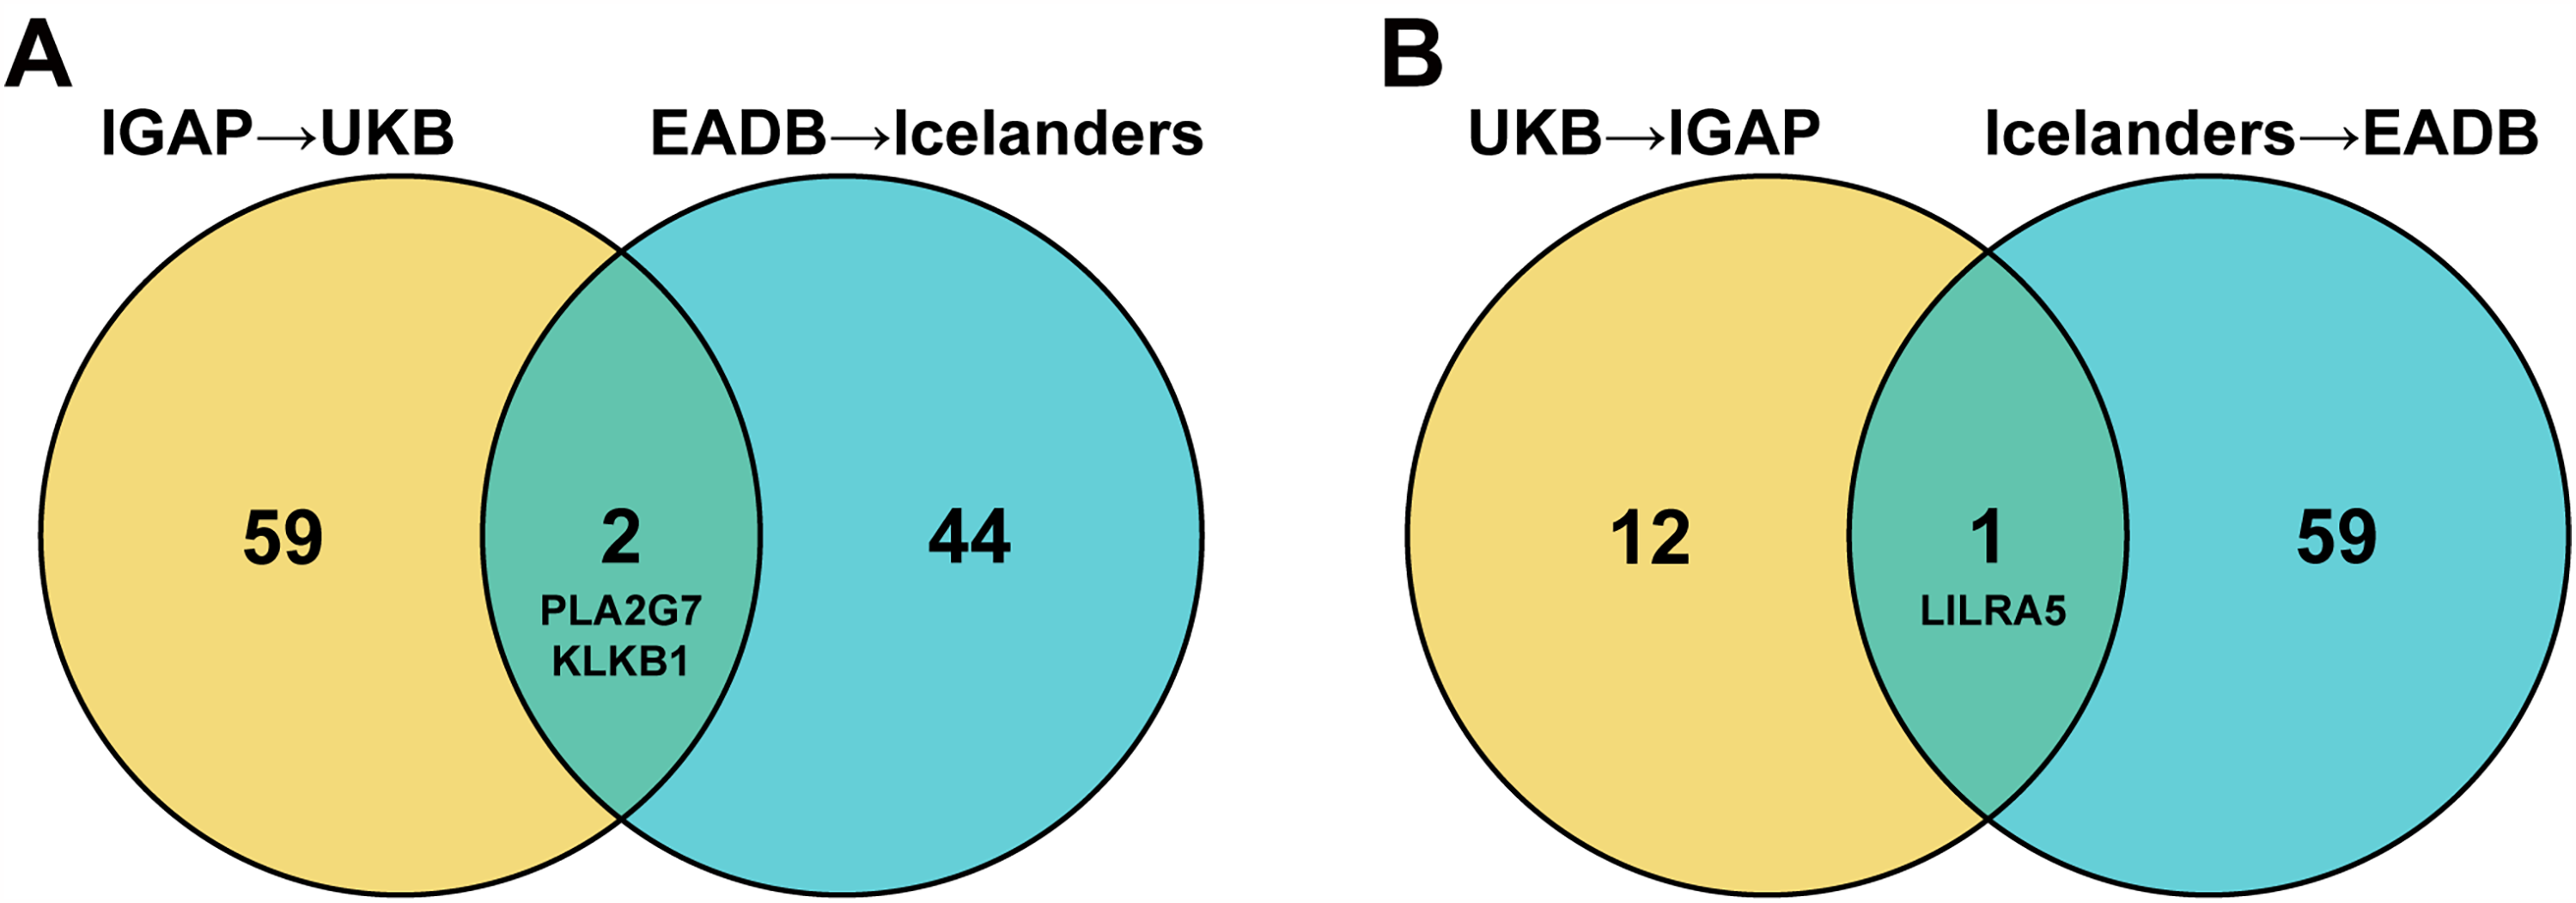
Venn plot showed the overlap of nominal significant causal effect in stage I and stage II. (A) Number of causal effects of AD on plasma proteins in stage I and stage II. (B) Number of causal effects of plasma proteins on AD in stage I and stage II.
Causal effect of plasma proteomics on AD
We next performed MR analysis to assess the causal impact of plasma proteomics on AD risk using a similar two-stage approach. At stage I, plasma proteomic data from the UKB were used as exposures, with AD GWAS data from the IGAP project as outcome. The IVW method identified three proteins with significant associations after BH correction, as well as pleiotropy and leave-one-out tests (Figure 3A, Supplemental Table 4, and Supplemental Figure 2). All three proteins had an odds ratio (OR) below 1, indicating that higher levels of these proteins in peripheral blood were potential protective factors for AD. The protective effects were further supported by four additional MR methods (Supplemental Table 5). Beyond these three BH-corrected proteins, ten additional proteins achieved nominal significance after passing pleiotropy and leave-one-out tests (Supplemental Table 4).
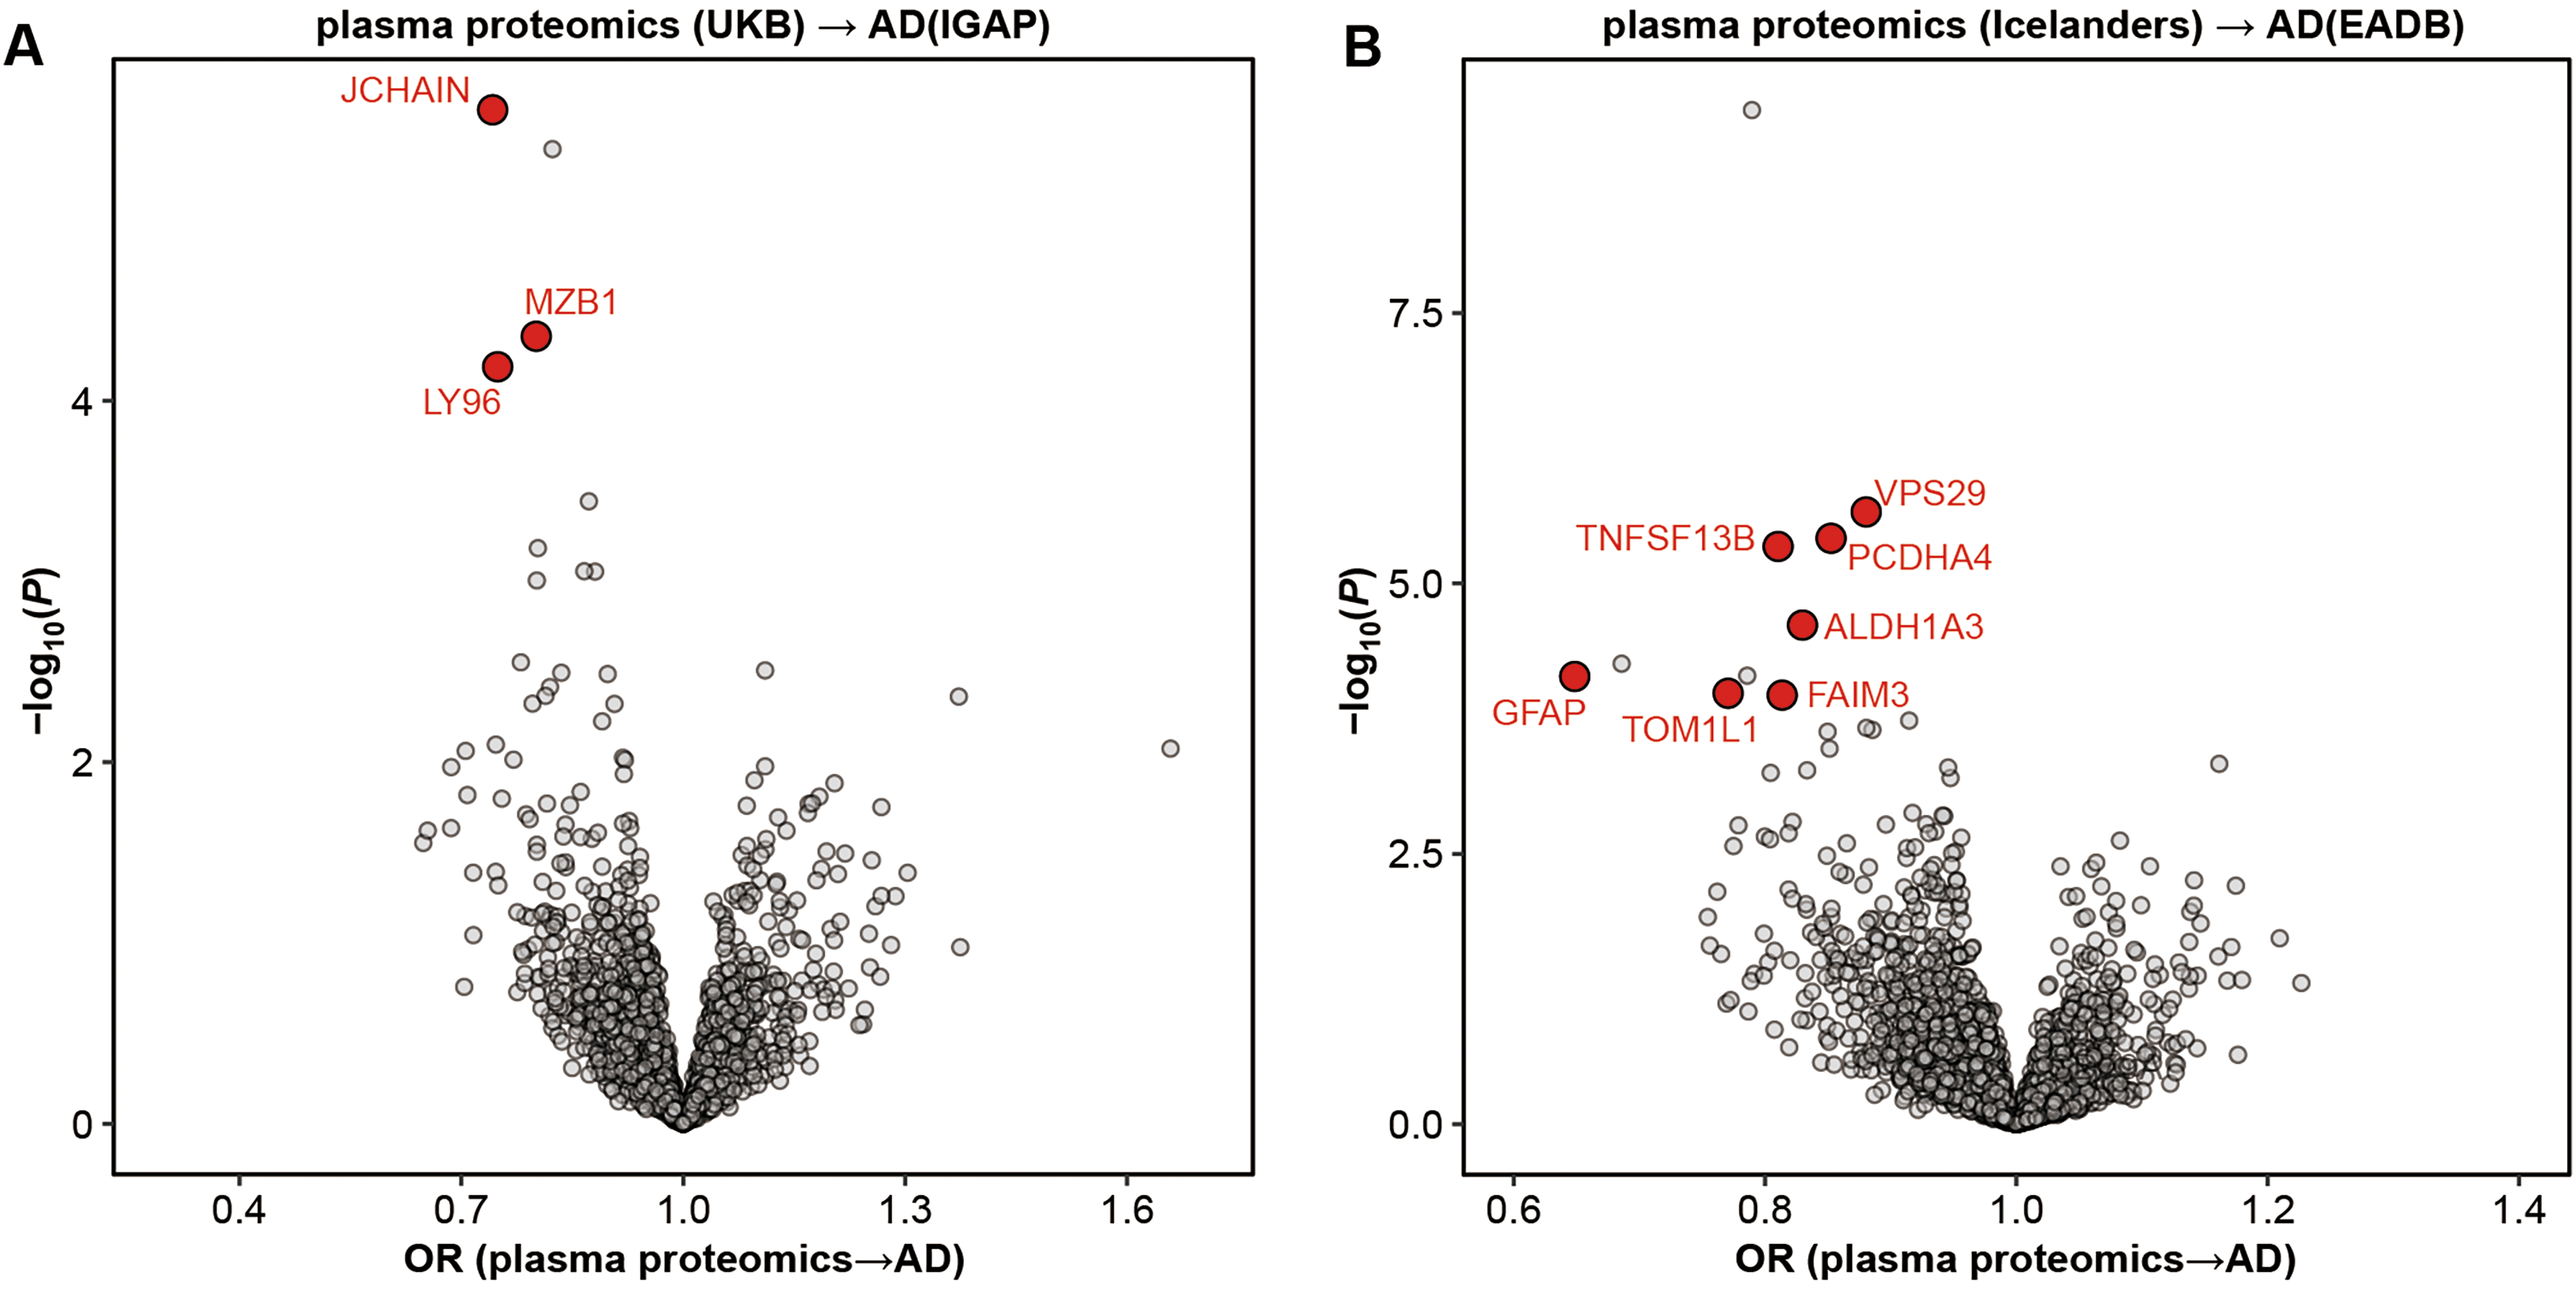
Causal effect of plasma proteomics on AD in stage I (A) and stage II (B). The horizontal coordinate represented the OR value estimated by the IVW, and the vertical coordinate was the original p-value. We labeled the significant associations after BH correction, as well as pleiotropy and leave-one-out tests in red (OR < 1) and blue (OR > 1) enlarged dots.
At stage II, plasma proteomic data from an Icelandic cohort served as exposures, while AD GWAS data from the IGAP project were again used as outcomes. Here, 7 proteins reached significance following BH correction, pleiotropy, and leave-one-out tests (Figure 3B, Supplemental Table 6, and Supplemental Figure 3). All 7 causal relationships had OR less than 1, and the other four auxiliary methods also give the consistent estimation (Supplemental Table 7). An additional 53 proteins achieved nominal significance after passing the pleiotropy and leave-one-out tests (Supplemental Table 7).
Comparing the results from stage I and stage II, we found that LILRA5 was nominal significance and displayed a consistent direction of association across both stages (Figure 2B). Both analyses indicated that high peripheral blood expression of LILRA5 provided a protective effect against AD (Stage I: OR = 0.87, p = 8.78 × 10⁻⁴; Stage II: OR = 0.92, p = 1.32 × 10⁻³) (Supplemental Table 4 and Supplemental Table 6).
Discussion
In this study, we investigated the causal relationships between AD and plasma proteomics using two-sample MR in a two-stage design. Our findings indicated potential causal relationships between certain proteins and AD, suggesting these proteins may either contribute to AD risk or result from AD pathology.
Combined the results of forward and reverse MR analysis, we identified 25 plasma proteomics with causal associations to AD, indicating diverse functional roles spanning immune and metabolic pathways. Many of these proteins, such as IL32, LY96, and TNFSF13B, are pivotal in immune processes, highlighting potential involvement in neuroinflammatory responses that may accelerate disease progression. Others, like PLA2G7, PLA2G10, ALDH1A3 and CA3, contribute to metabolic pathways, supporting theories that metabolic dysfunction may underlie AD pathology. Specially, we found that PLA2G7 and PLA2G10, both linked to lipid metabolism, have causal associations with AD. Phospholipase A2 group VII (PLA2G7) and group X (PLA2G10) are enzymes involved in hydrolyzing phospholipids, playing key roles in lipid signaling and the release of bioactive lipid mediators.43–45 These mediators are crucial in modulating inflammatory responses, oxidative stress, and neurodegenerative processes, which are increasingly recognized as underlying mechanisms in AD.46–48 Dysregulation in lipid metabolism, particularly phospholipid homeostasis, is thought to disrupt membrane integrity, neuronal signaling, and synaptic function—all critical factors in cognitive decline associated with AD.49–51 Moreover, abnormal lipid metabolism can exacerbate neuroinflammation and amyloid-beta deposition. 52 PLA2G7, also known as lipoprotein-associated phospholipase A2, has been shown to influence inflammatory pathways through oxidized phospholipids, which are elevated in AD patients and contribute to atherosclerosis and neurovascular issues. 53 Similarly, PLA2G10, which impacts lipid signaling and inflammatory cascades, could contribute to both peripheral and central lipid dysregulation. 54 This highlights the complex interplay between lipid metabolism and AD pathogenesis, suggesting that these enzymes may serve as potential biomarkers or therapeutic targets to address metabolic dysfunction in AD.
Our MR analysis revealed an inverse causal relationship between elevated plasma GFAP levels and AD risk, suggesting that GFAP was a potential protective factor for AD. However, previous observational studies consistently report that AD patients exhibit elevated plasma GFAP, often interpreted as a biomarker of astrocytic activation and neurodegeneration.16,55 This difference may arise due to the distinct nature of MR analyses, which aim to infer causality by leveraging genetic proxies for exposure (GFAP levels in this case), whereas observational studies only capture association without addressing causation. Elevated GFAP levels observed in AD patients could be a result of the disease process itself-specifically, reactive astrocytosis occurring in response to neurodegeneration. This reactive process might cause GFAP to increase as AD progresses, but this increase does not imply a causal role in initiating the disease. In contrast, MR analysis suggests that genetically predisposed higher GFAP levels might play a neuroprotective role by maintaining astrocyte function or mitigating inflammatory processes that could otherwise lead to neurodegeneration. This apparent discrepancy highlights the need to differentiate between biomarkers that signal the presence of disease and those that influence disease susceptibility. Further experimental studies are needed to elucidate the mechanistic roles of GFAP in AD pathogenesis and to verify whether GFAP elevation could indeed confer resilience in the preclinical stages of AD, as suggested by our causal inference.
We also found that a higher genetic risk for AD could predispose individuals to higher level of NFL when using IGAP AD GWAS as exposure and UKB proteomics as outcomes (p = 0.04, Supplemental Table 1). NFL is a well-known biomarker of neuronal damage, and its association with AD aligns with the neurodegenerative nature of the disease. 15 However, the fact that the p-value did not survive the BH correction indicates that the result may not be robust against multiple testing, which increases the risk of a false positive finding. Additionally, the failure to pass the leave-one-out sensitivity analysis suggests that the result might be driven by specific genetic variants (e.g., outliers or pleiotropic SNPs), undermining the stability of the causal inference.
In our MR analysis, we observed a notable pattern: causal effects with larger IVW p values frequently failed the leave-one-out sensitivity test, while those with smaller p-values often passed, which also partially explained why we got fewer replications in two-stage studies. This discrepancy highlights the critical role of stringent p-value thresholds in identifying robust causal relationships, particularly when conducting extensive MR analyses with multiple traits. The failure of leave-one-out tests for higher p-value results suggests that these associations may be more sensitive to outliers or specific IVs, which undermines their reliability. Smaller p-values, on the other hand, appear more resilient, indicating more stable associations across different subsets of IVs. Therefore, relying solely on nominal p value thresholds may introduce false positives in high-throughput MR studies, as non-robust associations with borderline p-values are more likely to be susceptible to minor variations in the IV set.
We have summarized the following limitations of this study. Firstly, although we conducted cross-analysis using data from different sources to enhance the reliability of the results, we did not observe consistent causal effects after BH correction across different datasets. Secondly, while we excluded smoking and drinking as confounding factors, other unknown confounders may still influence the results. Finally, given these limitations, the direct clinical applicability of our findings remains uncertain. Future studies with larger sample sizes and more comprehensive control for confounders may yield more robust and clinically translatable results.
In summary, our MR analysis provides new insights into the causal roles of plasma proteins in AD, identifying 25 proteins with potential impacts on disease risk. The identified proteins underscore the potential roles of immune dysregulation and metabolic disturbances in AD pathogenesis, providing valuable targets for future research and therapeutic exploration.
Supplemental Material
sj-docx-1-alz-10.1177_13872877251345151 - Supplemental material for Causal relationships between plasma proteins and Alzheimer's disease using bidirectional Mendelian randomization
Supplemental material, sj-docx-1-alz-10.1177_13872877251345151 for Causal relationships between plasma proteins and Alzheimer's disease using bidirectional Mendelian randomization by Yichen Li, Yu-Lin Yao and Yong Wu in Journal of Alzheimer's Disease
Supplemental Material
sj-xlsx-2-alz-10.1177_13872877251345151 - Supplemental material for Causal relationships between plasma proteins and Alzheimer's disease using bidirectional Mendelian randomization
Supplemental material, sj-xlsx-2-alz-10.1177_13872877251345151 for Causal relationships between plasma proteins and Alzheimer's disease using bidirectional Mendelian randomization by Yichen Li, Yu-Lin Yao and Yong Wu in Journal of Alzheimer's Disease
Footnotes
Acknowledgements
We thank the International Genomics of Alzheimer's Project (IGAP) for providing summary results data for these analyses. The investigators within IGAP contributed to the design and implementation of IGAP and/or provided data but did not participate in analysis or writing of this report. IGAP was made possible by the generous participation of the control subjects, the patients, and their families. The i-Select chips was funded by the French National Foundation on Alzheimer's disease and related disorders. EADI was supported by the LABEX (laboratory of excellence program investment for the future) DISTALZ grant, Inserm, Institut Pasteur de Lille, Université de Lille 2 and the Lille University Hospital. GERAD/PERADES was supported by the Medical Research Council (Grant no 503480), Alzheimer's Research UK (Grant no 503176), the Wellcome Trust (Grant no 082604/2/07/Z) and German Federal Ministry of Education and Research (BMBF): Competence Network Dementia (CND) grant no 01GI0102, 01GI0711, 01GI0420. CHARGE was partly supported by the NIH/NIA grant R01 AG033193 and the NIA AG081220 and AGES contract N01-AG-12100, the NHLBI grant R01 HL105756, the Icelandic Heart Association, and the Erasmus Medical Center and Erasmus University. ADGC was supported by the NIH/NIA grants: U01 AG032984, U24 AG021886, U01 AG016976, and the Alzheimer's Association grant ADGC-10-196728.

Author contributions
Funding
The author(s) disclosed receipt of the following financial support for the research, authorship, and/or publication of this article: This work was supported by grants from Exploration Program of Wuhan Natural Science Foundation (grant number 2024040801020383 to Y.W.).
Declaration of conflicting interests
The author(s) declared no potential conflicts of interest with respect to the research, authorship, and/or publication of this article.
Supplemental material
Supplemental material for this article is available online.
References
Supplementary Material
Please find the following supplemental material available below.
For Open Access articles published under a Creative Commons License, all supplemental material carries the same license as the article it is associated with.
For non-Open Access articles published, all supplemental material carries a non-exclusive license, and permission requests for re-use of supplemental material or any part of supplemental material shall be sent directly to the copyright owner as specified in the copyright notice associated with the article.
