
Abstract
Background
The posterior cingulate cortex (PCC) is a metabolic hub within the default-mode network and an early target of Alzheimer's disease (AD) pathology, yet its quantitative relationship with cognition across the normal aging–mild cognitive impairment (MCI)–AD continuum remains incompletely defined.
Objective
In this study we aimed to compare PCC volumes across AD, MCI, and controls, and assess their relationship with cognitive performance.
Methods
In this single-center cross-sectional study, 161 participants (NL = 30, MCI = 60, AD = 71) underwent structural MRI. PCC volumes were automatically segmented and summed. Linear regressions adjusted for age and sex were performed to examine associations between PCC volumes and cognitive measures. False discovery rate correction was applied to multiple comparisons. Additional subgroup analyses were conducted by gender and education level using Mann–Whitney U tests, and ordinary least squares regression models tested for group × education interactions.
Results
Mean Post-cin-T volume declined step-wise from NL (6.05 ± 0.21cm3) to MCI (5.64 ± 0.63cm3) to AD (4.98 ± 1.01cm3; p < 0.001). Post-cin-R and Post-cin-L showed parallel gradients. Higher MoCA scores correlated with larger PCC volumes (e.g., total: β = 0.069, p < 0.001), whereas higher CDR scores were linked to smaller volumes (total: β = –0.705, p < 0.001). Subgroup analyses revealed that higher-education participants showed broader PCC–cognition associations. Interaction analyses indicated no significant moderating effect of education on group–volume relationships.
Conclusions
Quantitative PCC atrophy differentiates NL, MCI and AD and correlates robustly with cognitive performance, particularly in educated individuals. PCC volumetry may serve as a non-invasive MRI biomarker for early diagnosis and disease staging in the AD spectrum.
Keywords
Introduction
Alzheimer's disease (AD) is the most common form of neurodegenerative dementia, leading to the progressive deterioration of various cognitive domains. 1 AD comprises 60–70% of individuals affected by dementia with 32.55 million disability-adjusted life years in 2021.2,3 Despite significant advances in neuroimaging, the exact mechanisms underlying complex brain networks remain unclear. 4 In AD pathology, the deposition of misfolded amyloid-β and tau proteins in distinct anatomical regions is considered a hallmark and is correlated with cognitive dysfunction. 5 Brain pathology typically develops long before phenotypic manifestations become apparent. 6
The prodromal phase of AD, characterized by impaired memory function while daily activities remain normal, is referred to as mild cognitive impairment (MCI) due to AD.7,8 Approximately 10–15% of people with MCI advance to AD each year. 9 Diagnosing MCI is crucial to facilitate early therapeutic interventions and improve patients’ quality of life. In typical AD, neuronal degeneration begins in hippocampus and medial temporal lobe, progressing to the posterior cingulate cortex (PCC) and ultimately affecting the sensorimotor and occipital cortex. 10 This pathway corresponds to the sequential deterioration of clinical symptoms in AD. 11 Furthermore, a relationship between PCC and hippocampus activation during episodic memory encoding has been observed in MCI, leading to functional network deterioration. 12 Impairment of episodic memory is one of the earliest and most profound cognitive alterations in AD. 13
Volumetric assessment of macrostructural changes using MRI provides valuable information about the AD spectrum.14–21 Being non-invasive and readily available in clinical environment, MRI has gained significant attention among neuroimaging techniques in recent years. Most recent research has focused on medial temporal structures’ association with cognitive impairment in AD.22–25 Functional imaging studies have indicated that hypometabolism or hypoperfusion first emerge in AD or MCI.26–29 A study by Lee et al. suggested that PCC was strongly associated with AD progression, and a higher rate of gray matter volume atrophy was correlated with faster cognitive decline. 30 Although previous studies have shown a decline in PCC volume in AD compared to MCI and normal controls, it remains unclear whether the degree of PCC atrophy is associated with cognitive and behavioral performance.
Therefore, the contributions of this investigation were: 1) to compare MRI-derived measurements of PCC volume in patients with AD, mild cognitive impairment, and normal controls, and 2) to correlate the severity of PCC atrophy with cognitive and behavioral performance in individuals.
Methods
This cross-sectional observational study aimed to characterize volumetric differences in the PCC among individuals at varying stages of cognitive impairment and to examine the relationship between PCC volumes and cognitive performance. Ethics approval for this single center cross-sectional study was obtained from the Ethics Committee of the Tehran University of Medical Sciences. All participants provided written informed consent.
Data collection
We analyzed volumetric MRI data from a total of 161 participants, each assigned to one of three diagnostic categories: AD, MCI, or normal cognition (NL). Diagnostic classifications were made according to established clinical and neuropsychological criteria, as documented in participants’ medical records using the NINCDS-ADRDA Alzheimer's Criteria. 31
MRI processing and volumetric analysis
For each participant, PCC volumes were segmented into right (Post-cin-R), left (Post-cin-L), and total (Post-cin-T) components using the Neurotrack AD module (KIOmedical, Tehran/Iran), a proprietary deep learning-based neuroimaging pipeline replicating the anatomical segmentation of FreeSurfer v6.0 with high accuracy and substantially reduced computation time. The core segmentation network is a 2.5D fully convolutional model with competitive dense blocks and competitive skip pathways, incorporating multi-slice spatial information aggregation to enhance cortical folding delineation and subcortical border accuracy, predicting 95 anatomical classes in a single pass.
Preprocessing steps included intensity normalization and resampling to 1 mm isotropic resolution. The segmentation output was mapped directly onto reconstructed cortical surfaces using a spectral spherical embedding, avoiding computationally expensive non-linear spherical registration. Cortical regions, including the PCC, were anatomically defined according to the Desikan-Killiany atlas.
Intracranial volume (ICV) was automatically estimated by the same pipeline, using an approach equivalent to FreeSurfer's eTIV method, and used both to normalize PCC volumes and as a covariate in regression models. For independent validation, automated segmentations generated by the Neurotrack AD module have been compared with those from the volBrain platform in a study of 543 healthy individuals (IXI dataset), showing moderate-to-strong correlations (Pearson/Spearman r = 0.60–0.85, p < 0.01) and good agreement in Bland-Altman analysis, with volumetric differences within ±2 SD limits of agreement (REF).
Statistical analysis
We collected detailed information including age, sex, and education. Education was dichotomized into “≤diploma” and “>diploma”. The reference layer was defined as “≤diploma” in calculation of odds ratio (OR). For sex, the reference layer was defined as female. A second neurologist conducted neuropsychological scale assessments including MoCA, CDR, and ReyAVLT components (i.e., A1, A2-5, A6, DR). The neurologist was blinded to the MRI findings, as well as the confirmatory test results. To minimize the missing rate in our model, the neurologist was trained to extract all the data for these variables.
MRI interpretation was performed by a single radiologist with 14 years of experience using a 3.0T MR scanner. A 24-channel head coil was used to acquire the three-dimensional (3D) high-resolution brain volume T1-weighted imaging, T2 fluid-attenuated inversion recovery (T2 FLAIR), DWI and SWI sequences in the sagittal plane. The participants were instructed to remain awake and quiet and to keep their heads as still as possible. MRI sequence parameters are reported in the Supplemental Material. The images were analyzed using Picture Archiving and Communication System (PACS) system in DICOM format.
Descriptive statistics were calculated for the entire cohort and stratified by diagnostic group to provide summary measures (mean, standard deviation, minimum, maximum, and quartiles) of PCC volumes. To evaluate group-wise differences in PCC volume, we employed one-way analysis of variance (ANOVA) for each volumetric variable, followed by Tukey's honestly significant difference (HSD) post-hoc tests to assess the significance of pairwise comparisons among AD, MCI, and NL groups. In addition to primary volumetric comparisons, we assessed the association between PCC volume and performance on a range of cognitive and clinical measures, including the Montreal Cognitive Assessment (MoCA), Clinical Dementia Rating (CDR), and attention subscales (A1, A2–5), as well as delayed recall (DR). These relationships were analyzed using linear regression, with PCC volume as the independent variable and each cognitive score as the dependent variable. For each model, we reported the regression slope, R-squared value, and p-value. All models were adjusted for age and sex to control for potential confounding effects. To correct for multiple comparisons across the 18 tests performed, we applied a false discovery rate (FDR) correction using the Benjamini-Hochberg procedure.
Moreover, we performed additional subgroup analyses. Participants were stratified by gender (male versus female) and by education level (coded as binary: 0 or 1). Within each stratum, Mann–Whitney U tests were conducted to assess differences in PCC volumes. This non-parametric approach was chosen for its robustness in the face of possible deviations from normality in smaller subgroups. Moreover, we performed multiple ordinary least squares (OLS) regression analyses to assess the effect of group status and years of education on post-intervention cognitive insight scores across three PCC volumes. All models included main effects for group and education, as well as interaction terms between group status and years of education to explore potential moderation effects.
All statistical analyses were conducted using Python, with a significance threshold set at p < 0.05. Results were tabulated, and key findings were visualized using boxplots and regression plots, which were produced and archived using Seaborn and Matplotlib libraries.
Results
Descriptive statistics and group comparisons
The analysis included 161 participants: 71 diagnosed with AD, 60 with MCI, and 30 classified as NL (Table 1). Across the full sample, the mean right PCC volume (Post-cin-R) was 2.80 (SD: 0.48), the left PCC volume (Post-cin-L) was 2.63 (SD: 0.46), and the total PCC volume (Post-cin-T) was 5.43 (SD: 0.88). Stratification by diagnostic group revealed progressive reductions in PCC volume from NL to MCI to AD. For the right PCC, mean volumes were highest in the NL group (3.11, SD: 0.13), intermediate in MCI (2.98, SD: 0.36), and lowest in AD (2.51, SD: 0.51). A similar pattern was observed in the left PCC: NL (2.94, SD: 0.25), MCI (2.66, SD: 0.36), and AD (2.47, SD: 0.53). Total PCC volume mirrored these trends, with NL (6.05, SD: 0.21), MCI (5.64, SD: 0.63), and AD (4.98, SD: 1.01).
Demographic, cognitive, and MRI measures in cognitively normal controls (NL), patients with mild cognitive impairment (MCI) and Alzheimer’s disease (AD).
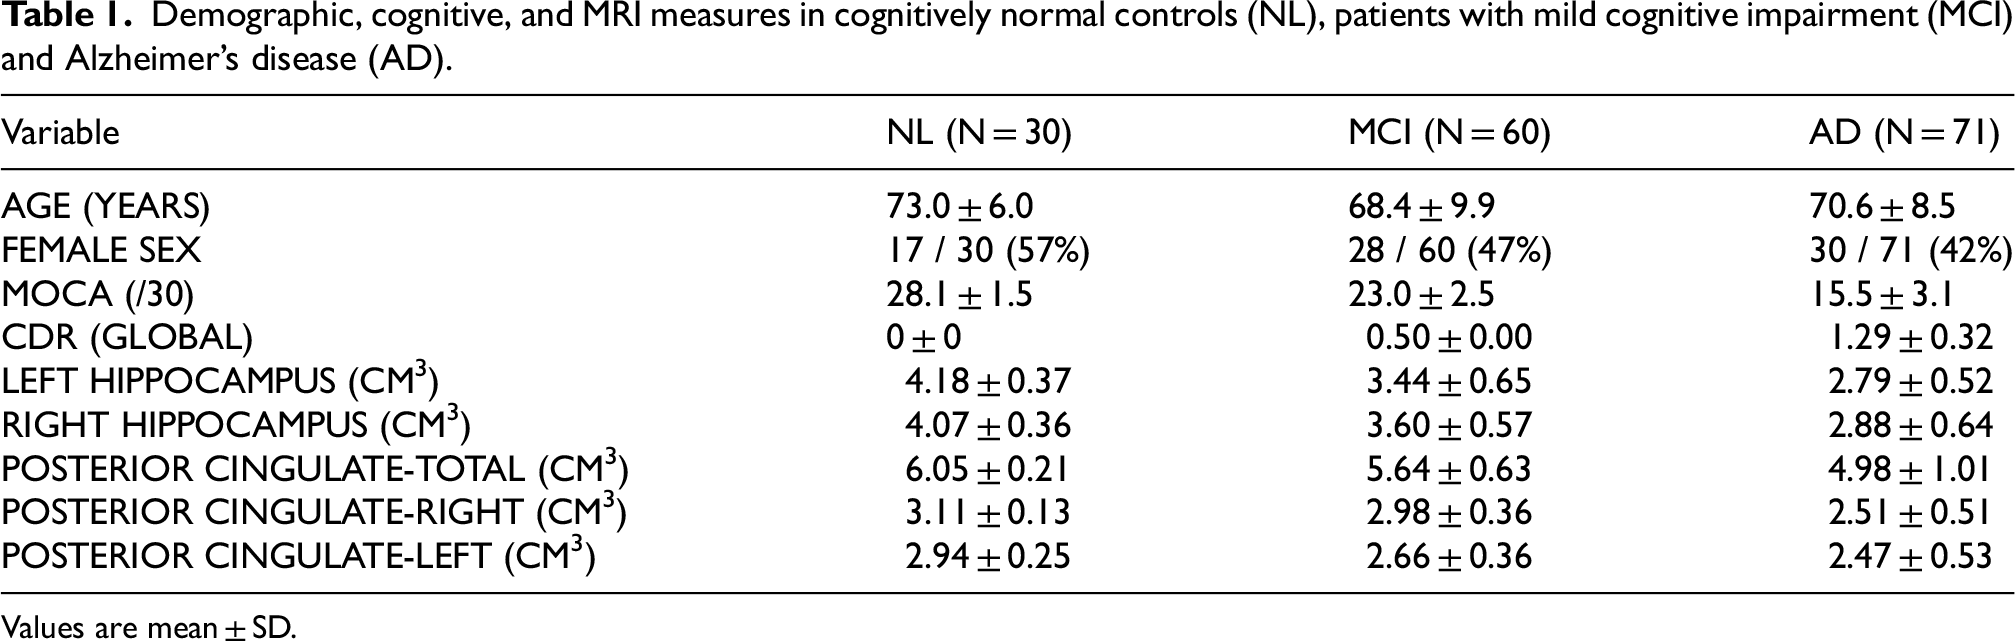
Values are mean ± SD.
ANOVA and post-hoc analysis
One-way ANOVA revealed significant differences in all PCC volume measures across diagnostic groups. Post-hoc Tukey's HSD tests indicated that AD participants had significantly lower total PCC volume compared to both MCI (mean difference: −0.66, p < 0.001, SE: 0.14) and NL (mean difference: −1.07, p < 0.001, SE: 0.17) groups (Figure 1A). The MCI group also showed lower total PCC volume than NL, though this difference was at the margin of statistical significance (mean difference: −0.41, p = 0.051, SE: 0.17). For the right PCC, AD participants had significantly lower volumes than both MCI (mean difference: −0.47, p < 0.001, SE: 0.07) and NL (mean difference: −0.60, p < 0.001, SE: 0.09); the MCI–NL comparison was not significant (mean difference: −0.13, p: 0.32, SE: 0.09); (Figure 1B). The left PCC also showed significant volume differences: AD versus NL (mean difference: −0.47, p < 0.001, SE: 0.09), MCI versus NL (mean difference: −0.28, p = 0.011, SE: 0.10), and AD versus MCI (mean difference: −0.19, p = 0.032, SE: 0.08) (Figure 1C).

Group differences in PCC volume across AD, MCI, and NL. AD showed significantly lower total (A), right (B), and left (C) PCC volumes compared to MCI and NL. MCI also had reduced volumes versus NL in total and left PCC. p < 0.05.
Associations with cognitive scores
Higher MoCA scores were significantly related to greater total PCC volume (β = 0.069, SE: 0.011, p < 0.001, q < 0.001), right PCC volume (β = 0.039, SE: 0.006, p < 0.001, q < 0.001), and left PCC volume (β = 0.029, SE: 0.006, p < 0.001, q < 0.001). Conversely, worse global function as measured by CDR was associated with smaller PCC volumes across total (β = –0.705, SE: 0.114, p < 0.001, q < 0.001), right (β = –0.421, SE: 0.061, p < 0.001, q < 0.001), and left hemispheres (β = –0.284, SE: 0.063, p < 0.001, q < 0.001). In attention subscales, the strongest associations were observed for the right PCC with both A1 (β = 0.066, SE: 0.012, p < 0.001, q < 0.001) and A2–5 (β = 0.017, SE: 0.003, p < 0.001, q < 0.001), though total and left PCC volumes also showed significant effects (A1—total: β = 0.116, SE: 0.022; left: β = 0.051, SE: 0.012; A2–5—total: β = 0.027, SE: 0.005; left: β = 0.010, SE: 0.003; all p ≤ 0.001, q ≤ 0.001). For delayed recall, significant relationships were detected with total (β = 0.074, SE: 0.015, p < 0.001, q < 0.001) and right PCC volumes (β = 0.046, SE: 0.008, p < 0.001, q < 0.001), with a weaker but still significant effect for the left PCC (β = 0.028, SE: 0.008, p = 0.001, q = 0.001). All associations remained significant after false discovery rate correction.
Subgroup and additional analyses
Non-parametric comparisons between AD and MCI groups were performed using the Mann–Whitney U test, stratified by gender and education level. Among females, significant group differences were observed in the total PCC (U = 479.5, p = 0.0477) and right PCC (U = 297.5, p = 4.994e-05), with MCI participants scoring higher than those with AD. The left PCC did not differ significantly (U = 531.5, p = 0.1626). In males, a significant difference was observed in the right hemisphere scores (U = 221.5, p = 0.0016), while both the total (U = 297.0, p = 0.0537) and left hemisphere scores (U = 330.0, p = 0.1582) did not reach statistical significance. When stratified by education level, individuals with higher education showed significant differences across all three domains: total (U = 723.5, p = 0.0058), right PCC (U = 468.0, p = 1.703e-06), and left PCC (U = 795.0, p = 0.0276). Among participants with lower education, only the right PCC showed a significant difference between groups (U = 79.5, p = 0.02397), while total (U = 102.0, p = 0.1332) and left PCC (U = 121.5, p = 0.3857) scores were not significantly different.
In the OLS regression model predicting total PCC, there was no statistically significant interaction between diagnostic group and years of education. Specifically, with AD the reference group, the group [MCI] × education years interaction term yielded a p-value of 0.626, and the group [NL] × education years term yielded a p-value of 0.785. For the right PCC, neither interaction term reached statistical significance. The interaction between MCI and education had a p-value of 0.530, while the interaction between NL and education had a p-value of 0.821. Similarly, in the model predicting left PCC, the interactions were not statistically significant. The MCI × education term had a p-value of 0.807, and the NL × education term had a p-value of 0.768.
Discussion
This investigation assessed the association between the severity of PCC atrophy and cognitive and functional performance. This study reveals a significant correlation between the reduction in the volume of the PCC and a decrease in MoCA and RAVLT scores, highlighting the potential impact of structural PCC atrophy on cognitive functions as assessed by MoCA and RAVLT. On the other hand, in contrast to the aforementioned scores, CDR scores show an increase alongside PCC atrophy. The distinct correlation observed between CDR scores and PCC atrophy is likely attributable to the different purposes of these assessments. CDR is a validated and reliable 5-point scale that offers a comprehensive evaluation of cognitive decline and its effect on daily activities and social interactions. 32 While MoCA is more sensitive to early cognitive dysfunction, particularly in memory, orientation, attention, and executive functions- regions primarily affected by PCC dysfunction.33,34
Our findings align with previous research that highlights the PCC as a key region of neuronal degeneration in dementia. Three earlier volumetric studies unveiled that the PCC volumes show significant reduction among individuals with AD or MCI.35–37 In addition, the morphometric data indicating decreased grey matter density,38,39 along with neuropathological evidence of nerve cell degeneration40,41 within the PCC, further support our results. Notably, the PCC in AD showed three major neuropathological changes, the gray matter atrophy, hypometabolism, and amyloid-β deposition, indicating its greater risk of degeneration in the disease. 42
The PCC is a central hub in the default mode network (DMN), whose metabolism is notably affected in the early stages of AD.28,43,44 The underlying pathophysiological mechanisms involve amyloid accumulation and brain atrophy, following a spatial pattern that is very similar to that of DMN. 45 A study by Greicius demonstrated that, in the early phase of AD, reduced functional connectivity within the DMN disrupts the connection between the PCC and the hippocampus. 46 The high metabolic rate in brain network hubs, including the PCC, makes them susceptible to AD-related neuropathology, as evidenced by pronounced amyloid deposition in this region. 47
To offer a possible explanation for why PCC is initially affected in the course of AD, attention must be given to the distribution patterns of pathological proteins, amyloid-β and TDP-43, within the brain. Research findings have indicated that abnormal forms of these proteins spread trans-synaptically; therefore, the organization of white matter pathways constrains their transmission. These findings help explain the spatial distribution of AD pathology within the DMN. 48 Overall, the pattern of atrophy observed in various neurodegenerative diseases resembles the connectivity patterns of healthy intrinsic brain networks. 49 Consequently, it may be possible to predict the atrophy pattern in AD based on the structure of white matter connections, shedding light on why the highly connected PCC is involved early in the process of the disease. 50
Our regression analysis demonstrated that cognitive performance and PCC volume within each disease group were not significantly influenced by years of education. A review of prior research revealed that, in cases of minimal brain atrophy, higher education is correlated with a slower decline in cognitive capacity. However, as brain atrophy progresses, this pattern reverses, with highly educated individuals experiencing accelerated cognitive decline in the presence of significant gray matter loss. 51 Another study similarly concluded that cases with higher education exhibit faster cognitive decline as brain degeneration advances, and eventually experience greater impairment. 52 The underlying mechanism through which education influences cognition is proposed to involve an increased capacity for performing cognitive functions and greater efficiency in the utilization of neural networks. 53 Therefore, subjects with high cognitive reserve can preserve cognitive abilities despite pathological brain changes predictive of cognitive decline due to this efficient network integration. Nevertheless, as neuropathology begins to disrupt the brain's optimized efficiency and integrated connectivity, decline may accelerate more rapidly than in individuals with lower levels of these neural attributes. 51 Consequently, further investigations with larger sample size and prospective methodology are necessitated in the future to resolve these conflicting results and to better understand the complex interplay between education and cognitive performance across different stages of neurodegenerative disorders.
Beyond volumetric evaluation, functional neuroimaging techniques such as single photon emission computed tomography (SPECT) and positron emission tomography (PET) have provided insights into functional alterations of the PCC across the course of disease progression. Hypoperfusion in the PCC, as evaluated by Tc-99 m SPECT, was more prominently observed in AD patients compared to other dementia types. 54 Moreover, previous 18F-FDG PET studies have reported hypometabolism in the PCC and precuneus regions in patients with MCI and AD relative to healthy controls, even before atrophy is detectable by MRI, 55 with 18F-FDG uptake in these areas showing a correlation with Mini-Mental State Examination (MMSE) scores. 56 Recently, researchers found that combining measurements of PCC glucose with Aβ and tau biomarkers enhances predictive accuracy for the progression from normal cognition to AD. 57 Future studies may benefit from integrating both structural biomarkers (e.g., MRI) and functional biomarkers to improve early detection of PCC dysfunction in the initial stages of neurodegenerative disorders.
Despite the new insights offered by our work, several limitations should be acknowledged. First, the small sample size may limit the generalizability of the results. Second, the ability to interpret the causal relationship or observe the progression of PCC atrophy may be restricted due to the cross-sectional design. As a third point of caution, AD and MCI were diagnosed according to clinical manifestations and cognitive assessments, potentially introducing bias due to the absence of well-described amyloid and tau biomarkers. Incorporating PET alongside MRI would provide a more comprehensive insight of neuropathological processes. Given the considerations, it would be more informative to adopt a longitudinal design for future investigations. Additionally, we recommend that future efforts focus on developing interventions aimed at preventing or mitigating PCC atrophy.
Conclusion
In conclusion, the findings of our study underscore the relationship between PCC atrophy and cognitive and functional impairments in AD, mild cognitive impairment, and healthy individuals. A significant association was found between PCC atrophy and cognitive decline in both AD and MCI. This study suggests a potential novel imaging biomarker for the diagnosis and screening of AD or MCI. Given the gradual progression of AD over time, early diagnosis and intervention for PCC atrophy are crucial for managing and potentially slowing the progression of the disease.
Supplemental Material
sj-docx-1-alz-10.1177_13872877251401612 - Supplemental material for Posterior cingulate cortex atrophy across the Alzheimer's disease spectrum: A cross-sectional MRI study linking volumetrics to cognitive decline
Supplemental material, sj-docx-1-alz-10.1177_13872877251401612 for Posterior cingulate cortex atrophy across the Alzheimer's disease spectrum: A cross-sectional MRI study linking volumetrics to cognitive decline by Iman Kiani, Ghazal Mohseni, Tayyebeh Hassani, Aydin Taghilou, Hamidreza Saligheh Rad and Vajiheh Aghamollaii in Journal of Alzheimer's Disease
Footnotes
Acknowledgements
We would like to express our sincere gratitude to Fereshteh Khodadadi Shoushtari for her valuable contribution to the image analysis component of this study. Her expertise and dedication greatly supported the accuracy and consistency of the imaging assessments.
Ethical considerations
Ethics approval for this single center cross-sectional study was obtained from the Ethics Committee of the Tehran University of Medical Sciences.
Consent to participate
All participants provided written informed consent.
Consent for publication
Not applicable
Author contribution(s)
Funding
The authors disclosed receipt of the following financial support for the research, authorship, and/or publication of this article: This work was supported by the Tehran University of Medical Sciences and Health Services,
Declaration of conflicting interests
The authors declared the following potential conflicts of interest with respect to the research, authorship, and/or publication of this article: This study was funded by Tehran University of Medical Sciences.
Data availability statement
The data that support the findings of this study are available from the corresponding author, upon reasonable request.
Supplemental material
Supplemental material for this article is available online.
References
Supplementary Material
Please find the following supplemental material available below.
For Open Access articles published under a Creative Commons License, all supplemental material carries the same license as the article it is associated with.
For non-Open Access articles published, all supplemental material carries a non-exclusive license, and permission requests for re-use of supplemental material or any part of supplemental material shall be sent directly to the copyright owner as specified in the copyright notice associated with the article.