
Abstract
Background:
Large-scale brain networks such as the default mode network (DMN) are often disrupted in Alzheimer’s disease (AD). Numerous studies have examined DMN functional connectivity in those with mild cognitive impairment (MCI), a presumed AD precursor, to discover a biomarker of AD risk. Prior reviews were qualitative or limited in scope or approach.
Objective:
We aimed to systematically and quantitatively review DMN resting state fMRI studies comparing MCI and healthy comparison (HC) groups.
Methods:
PubMed was searched for relevant articles. Study characteristics were abstracted and the number of studies showing no group difference or hyper- versus hypo-connnectivity in MCI was tallied. A voxel-wise (ES-SDM) meta-analysis was conducted to identify regional group differences.
Results:
Qualitatively, our review of 57 MCI versus HC comparisons suggests substantial inconsistency; 9 showed no group difference, 8 showed MCI > HC and 22 showed HC > MCI across the brain, and 18 showed regionally-mixed directions of effect. The meta-analysis of 31 studies revealed areas of significant hypo- and hyper-connectivity in MCI, including hypoconnectivity in the posterior cingulate cortex/precuneus (z = –3.1, p < 0.0001). Very few individual studies, however, showed patterns resembling the meta-analytic results. Methodological differences did not appear to explain inconsistencies.
Conclusions:
The pattern of altered resting DMN function or connectivity in MCI is complex and variable across studies. To date, no index of DMN connectivity qualifies as a useful biomarker of MCI or risk for AD. Refinements to MCI diagnosis, including other biological markers, or longitudinal studies of progression to AD, might identify DMN alterations predictive of AD risk.
Keywords
INTRODUCTION
The disease process in Alzheimer’s disease (AD) begins decades before dementia onset, making early identification of risk factors of great importance [1, 2]. Examining individuals diagnosed with mild cognitive impairment (MCI), who have a high risk of progressing to AD [3], can help identify such risk factors. This is analogous to cardiovascular disease, where the primary emphasis is on addressing subsyndromal risk factors (e.g., hypertension) rather than heart attack or congestive heart failure.
Researchers have suggested that functional neuroimaging may be particularly valuable for detecting early, preclinical signs of AD [4, 5]. Images collected at rest, rather than during a cognitive task, may be preferred in clinical settings and for impaired patients. Neuroimaging techniques sensitive to spatial patterns of blood flow or blood oxygenation are important tools for investigating the large-scale functional organization of the human brain [6]. Among the functionally-coordinated networks studied to date, the default mode network (DMN) is one of the best characterized [7]. The DMN was first described by Raichle and colleagues in an effort to account for task-related activation decreases in neuroimaging studies [8]. The DMN has increasingly been defined as a network of increased response during a passive state [8] rather than a pattern of regional signals observed in the absence of any task. In this review, DMN is broadly operationalized as described by Buckner and colleagues [9] as a network of brain regions that are reliably correlated during the resting state. This characteristic set of brain regions demonstrate correlated fluctuations of low-frequency activity. Although these correlations do not necessarily indicate functional connectivity, we adopt the term here given its widespread use in the literature. The DMN is generally conceptualized as comprising posterior cingulate and precuneus, inferior parietal lobules, lateral temporal cortex, medial prefrontal/anterior cingulate cortex, and hippocampus [8, 9], although the role of the hippocampus in the DMN is the subject of some debate [10].
Many studies provide evidence of disease-related disruption of the DMN, with some of the strongest evidence coming from studies of AD [7]. Multiple reviews have summarized findings on functional connectivity in AD and MCI [7, 10–23]. Functional connectivity within the DMN tends to decrease with normal aging, with accelerated decreases in AD [7, 24]. Previous reviews of DMN connectivity in MCI have been qualitative and focused on the general pattern of results without systematically cataloging discrepancies (e.g., which connections are affected and in which direction) or study characteristics (e.g., pre-processing steps or connectivity metrics) that might explain variability of findings [10–17, 25]. Results were inconsistent in a recent systematic review and meta-analysis of resting state networks in AD and MCI [23]. The authors used two types of quantitative strategies, network-based meta-analysis and the commonly used procedure of activation likelihood estimation which examines the overlap of peaks of activation differences separately in each direction (i.e., MCI > non-MCI and MCI < non-MCI). They found that those with MCI exhibited both hypo- and hyper-connectivity compared to healthy, non-MCI comparison participants in network-based meta-analyses and no difference using voxel-based activation likelihood estimation. The results were based on 15 resting state studies, not all of which focused on the DMN, and the authors did not systematically address possible sources of heterogeneity of findings. In addition, the techniques used for meta-analysis in this review [23] could not accommodate studies with null findings or consider directionality of differences in a combined analysis, therefore running the risk of overestimating true group differences and obscuring inconsistency in the direction of differences. An older review did use meta-analytical techniques that could accommodate null, positive, and negative findings to analyze 11 resting state DMN studies comparing MCI to HC [26]. Mostly hypo-activations, but some hyper-activations, were found; examination of potential heterogeneity within these studies was limited.
Here we sought to overcome previous limitations by comprehensively and systematically reviewing the literature through February 2018 regarding the extent to which resting function and intercorrelations in the DMN can differentiate individuals with MCI from HC individuals. We elected to focus on the DMN because this network is most often studied in the context of AD-related abnormalities [23]. We aimed to discover if there were any measures of resting functional magnetic resonance imaging (fMRI) connectivity in the DMN that were consistently different between these groups and in a consistent direction, thereby suggesting a potential biomarker of AD risk. We first used a tallying method to evaluate this literature, because there is high variability of analytic methods across studies. We hypothesized that there would be hypo-connectivity in the DMN in MCI, as a precursor to such deficits in AD.
Next, we conducted a voxel-based meta-analysis of group differences in DMN-related connectivity to identify regions of consistent hypo- or hyper-connectivity in MCI compared to healthy individuals. We also examined the consistency of effects within the identified clusters across studies, and whether variation in study characteristics or analytic approach explained heterogeneity in these effects.
METHODS
Using the PubMed search engine in February 2018, we searched articles using the following string: (“mild cognitive impairment” OR MCI) AND (“default mode network” OR DMN) AND (“resting state” OR “resting-state” OR rest). This search yielded 131 primary English-language articles; 196 additional articles were found through references listed in primary articles. We excluded conference abstracts and unpublished studies.
Inclusion/exclusion of studies
We identified 56 published studies (reporting 57 group comparisons) that met the following criteria: 1) primary articles examining a sample of individuals with MCI, and 2) using fMRI to measure DMN functional connectivity during a resting state. Of the total 327 records, 233 were excluded initially based on screening of abstracts; 39 further articles were excluded following full-text reviews. Reasons for exclusion and numbers of articles meeting exclusion criteria at each stage are shown in Fig. 1. We contacted the authors of the two studies with unclear direction of results, but received no response, so these studies were excluded. We did not exclude studies based on quality, but rather recorded various aspects of the study in order to examine their relationship to the findings.
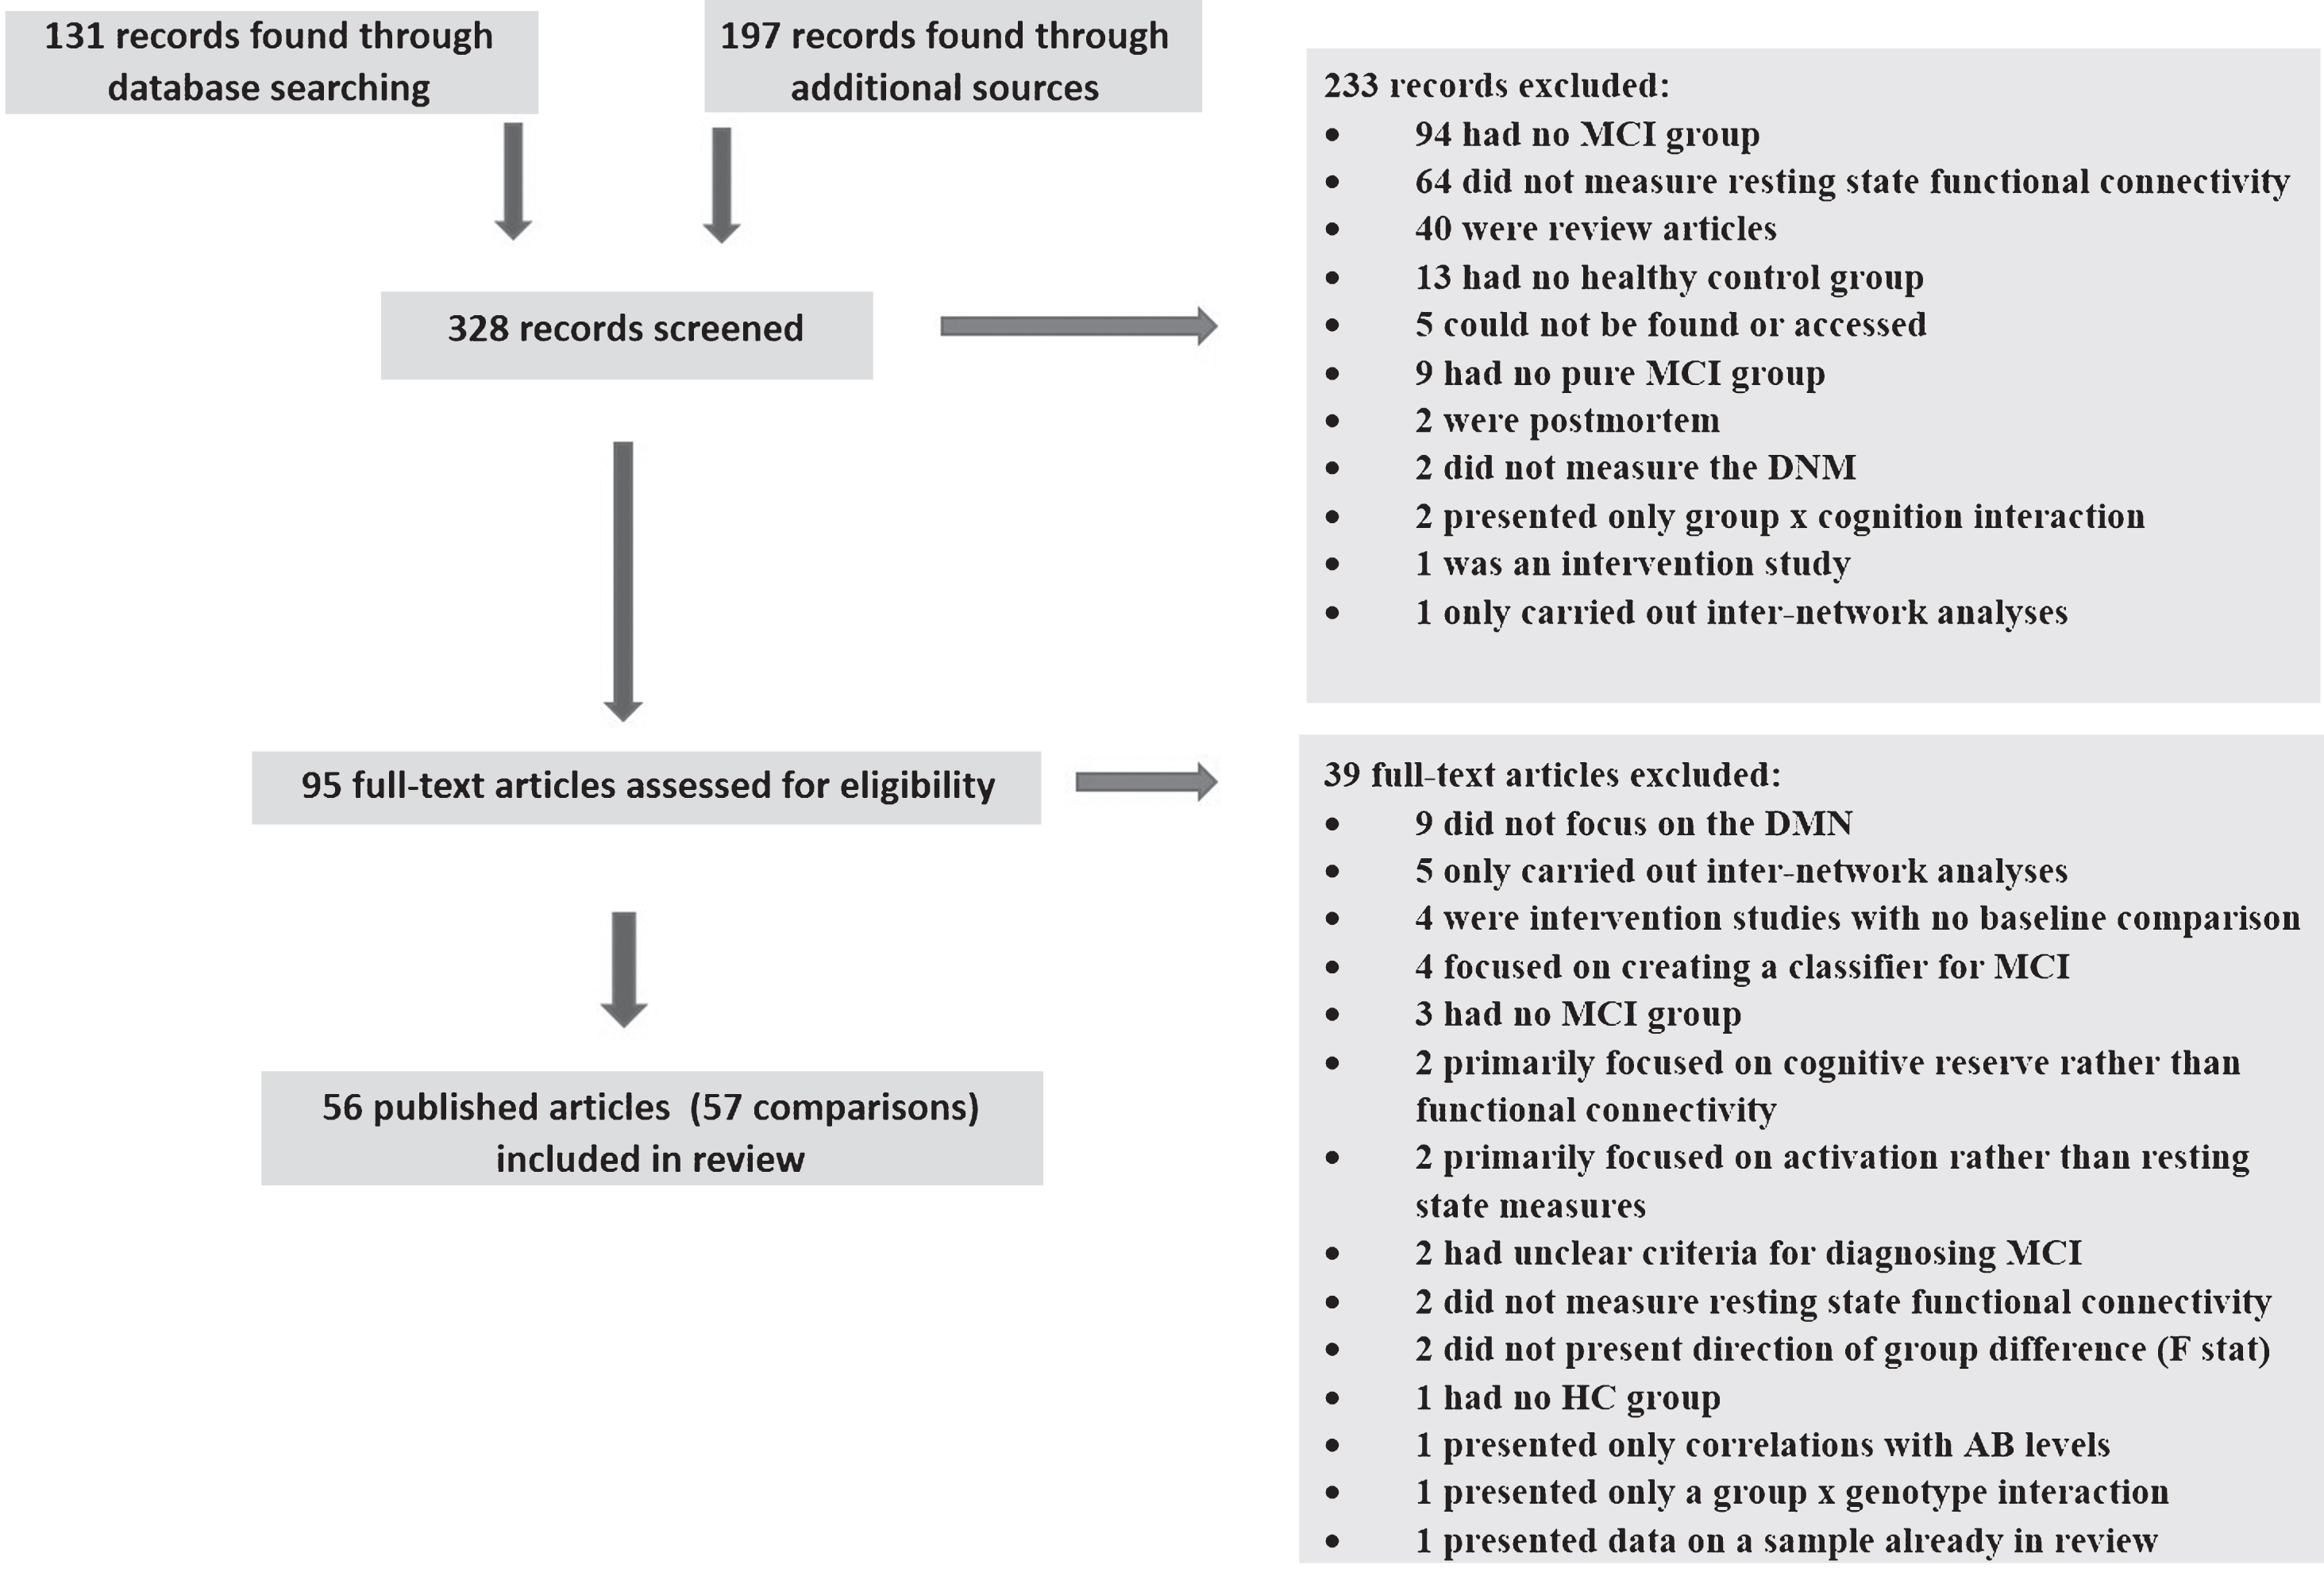
PRISMA flow diagram of review process. MCI, mild cognitive impairment; HC, healthy comparison; DMN, default mode network; AB, amyloid-β
Procedures
The following data were extracted by co-authors (SG, AM, SH, JE, and LE) from the remaining studies: numbers and characteristics of participants; criteria for defining MCI; neuroimaging method; if and how researchers controlled for motion in the scanner; acquisition time of the fMRI scan; whether global signal regression was included in the analysis; neuroimaging analysis approach; exclusion criteria; and general findings. We summarized the brain regions that each study analyzed using resting state functional connectivity measures. We categorized results into three primary directions: greater resting state functional connectivity or nodal signal in MCI compared to HC individuals (MCI > HC); reduced resting state functional connectivity or nodal signal in MCI compared to HC individuals (HC > MCI); or, no significant between-group difference (MCI≈HC). If authors mentioned brain regions in their analysis section but did not report group differences in these regions, it was assumed that there were no significant differences therein.
We then used effect size seed-based d mapping (ES-SDM [27, 28]) to further examine whether there were consistent patterns of hypo- or hyper-connectivity across studies. This method takes into account location and effect size of peak activations within reported clusters from voxel-based studies and their sample sizes to summarize areas of significantly overlapping findings. We chose ES-SDM over similar methods because of its incorporation of effect sizes, ability to account for both direction of effects (hypo- and hyper-connectivity), and ability to incorporate null findings [27]. We elected to include only seed-based, independent components analysis (ICA), and region-of-interest (ROI) studies in this analysis (n = 38) since these were most similar in examining correlations between separate DMN regions. Of these, we could only include studies that performed voxel-based analysis and reported coordinates for clusters of group difference or a null finding (n = 31). Seven studies were excluded for not doing voxel-based analyses or only showing figures of group differences [29–35]; 2 found MCI > HC, 3 found MCI < HC, and 2 found no group difference. Built-in functions for translation between different coordinate systems were used. We calculated maps of mean group differences and used the built-in permutation procedures (n = 10 permutations) to calculate p-values for the observed clusters. The mean map was thresholded at p≤0.005, minimum cluster size of 20, and all Z values within the cluster > 1.0. This protects a whole-brain p-value of approximately p = 0.025 [27]. To further examine the reliability of the clusters, we performed post-hoc jackknife analyses to examine in how many leave-one-study-out subsamples a particular cluster remained significant. This indicates whether some clusters are being driven by only one or two studies, such that when one of these is removed from the analysis, the cluster is no longer significant. Since only one study is left out of the analysis at a time, however, the jackknife analysis does not speak to the consistency of findings across studies within that region.
Thus, to examine the degree of consistency of results between studies, we extracted the mean effect size in each study within each of the clusters of group difference identified by the meta-analysis. For each cluster, we counted how many studies showed a non-zero group difference in the same direction as indicated by the meta-analysis. This is analogous to a follow-up analysis in a clinical trial that counts how many individual patients showed improvement for a measure that showed a significant intervention group effect. If the beneficial treatment effect was driven by a small number of patients showing robust improvements while other patients remained unchanged or went in the opposite direction, then it indicates that the treatment cannot be recommended for everyone. Similarly, if there is heterogeneity between imaging studies within the meta-analytic clusters, this suggests that the observed cluster connectivity deficits are not universally indicative of MCI. In addition, to further illustrate heterogeneity, we mapped, at each voxel, the number of studies with non-zero effect sizes (as determined by the ES-SDM algorithm for translating coordinates to spatial effect size maps).
In an exploratory fashion and to generate further hypotheses, we also examined associations between individual study findings and the following study characteristics: analysis type (seed-based versus ICA versus other), mean age of MCI and HC groups, gender ratio of groups, resting state scan length, whether individuals were excluded for excessive motion, and whether global signal regression was performed. We opted to examine these factors individually, instead of creating a global quality score, in order to understand which methodological elements, if any, related to the magnitude and direction of observed effects. We specifically compared studies that reported a non-zero, directionally-consistent effect to studies that did not show a difference within any meta-analytic clusters in which at least 5 studies showed an effect. This binary approach was used because the mean effect sizes within the meta-analytic clusters were generally not normally distributed across studies, so assumptions underlying a continuous meta-regression approach were not met. T-tests were used to compare studies showing versus not showing an effect on continuous measures; χ2 tests were used for discrete measures. Only in one cluster, where there were 16 studies showing a non-zero effect in the same direction, were we able to correlate continuous study characteristics to the mean effect size or compare effect sizes between discrete study characteristics. Finally, we calculated for each study a “similarity score” which indexed in how many of the meta-analytic clusters non-zero effects were observed in that study. The “similarity score” is thus a measure of the degree to which the distributed, regional patterns of hypo- and hyper-connectivity seen in each study matched the apparent pattern of hypo- and hyper-connectivity that emerged from the voxel-based meta-analysis across studies. We then tested the relationship of this score to study characteristics, to understand if there were factors that predisposed individual studies to observe a pattern of results most like those of the overall meta-analysis. In order to identify any possible study variables related to the findings and generate effect sizes to guide future studies, we did not correct for multiple comparisons.
RESULTS
Study characteristics
Study characteristics and results for all 56 reviewed studies are shown in Supplementary Table 1; summary statistics are presented in Supplementary Table 2. The average sample size for MCI groups was 26 (range: 6–129) and 28 for HC groups (range: 8–114). We considered 18 studies (32%) to have “large” samples based on a total sample size greater than 50. The total N across all studies was 1457 for MCI and 1577 for HC.
The mean age was 70.0 years for MCI samples and 68.5 years for HC samples. Average male:female ratios were 1.11 for MCI and .86 for HC groups. Typical exclusion criteria included presence/history of: psychiatric/psychological disorders, behavioral disorders, or intellectual disabilities (n = 43); neurological disorder (n = 39); and medical disease/disorder (n = 38). All but six studies [34–39] used Petersen Criteria to determine MCI status [40]. Petersen Criteria include a change in cognition, impairment in at least one cognitive domain relative to age and education norms, preserved independence in functional activities, and absence of dementia. Most studies included amnestic MCI, i.e., deficits in episodic memory were required, often in addition to deficits in other domains.
Average acquisition time for resting state fMRI scans was 7 minutes 20 seconds. Thirty studies censored fMRI images for motion; five excluded time points and 28 excluded participants. In 24 studies reporting such information, an average of 8% of participants were excluded for motion. Most studies (n = 40) did not include global signal regression, which may artificially induce negative correlations [41, 42] (but see [43, 44]).
Analytic approaches used (and the number of studies) were: ICA (n = 25), voxel-wise seed-based analysis (n = 10), graph theory (n = 5), regional homogeneity/amplitude of low frequency fluctuations/coefficients of spontaneous low frequency (n = 7), ROI analysis (n = 6), Granger causality (n = 2), sparse statistical parametric mapping (n = 1), and voxel-based functional connectivity strength (n = 1).
Study results
Directionality
Nine of the 57 comparisons found no MCI-HC differences in resting state signal or functional connectivity in any regions examined or for any measure [29, 45–50] (Supplementary Table 1). Of those reporting differences, 30 studies found consistent directionality for all DMN regions or measures reported as significantly different; 13 studies reported no null results in any regions (although 11 did not state explicitly all regions or voxels tested, making it difficult to be confident that there were no regions of null results); 17 reported some null results in addition to the unidirectional ones. Among these studies, MCI > HC was observed in eight [36, 51–57]; MCI < HC in 22 [30, 58–72]. The remaining studies (n = 18) found significant group differences in both directions; six found more clusters of MCI > HC than MCI < HC [22, 73–77] and for 11, the opposite was found [31, 78–84]. Finally, one study found higher intensity but lower cluster size in MCI compared to HC in the posterior cingulate cortex [34].
Effect size seed-based d mapping (ES-SDM)
Coordinates and t-values of peak voxels in above-threshold clusters of group difference from a subset of 31 studies (indicated by an * in Supplementary Table 1) were analyzed with the ES-SDM program [27, 28]: total N = 678 MCI and 784 HC. This review thus analyzed double and triple the number of MCI studies included in previous meta-analyses [23, 26]. A map of the peak voxels from these studies colored by direction of effect (red = MCI > HC, blue = HC > MCI), with dot size indicating relative study sample size, is presented in Supplementary Figure 1. The meta-analysis revealed several clusters of significant group difference in both directions across studies. Figure 2 shows the significant clusters. Table 1 gives the location and size of the clusters, mean effect size, and significance.
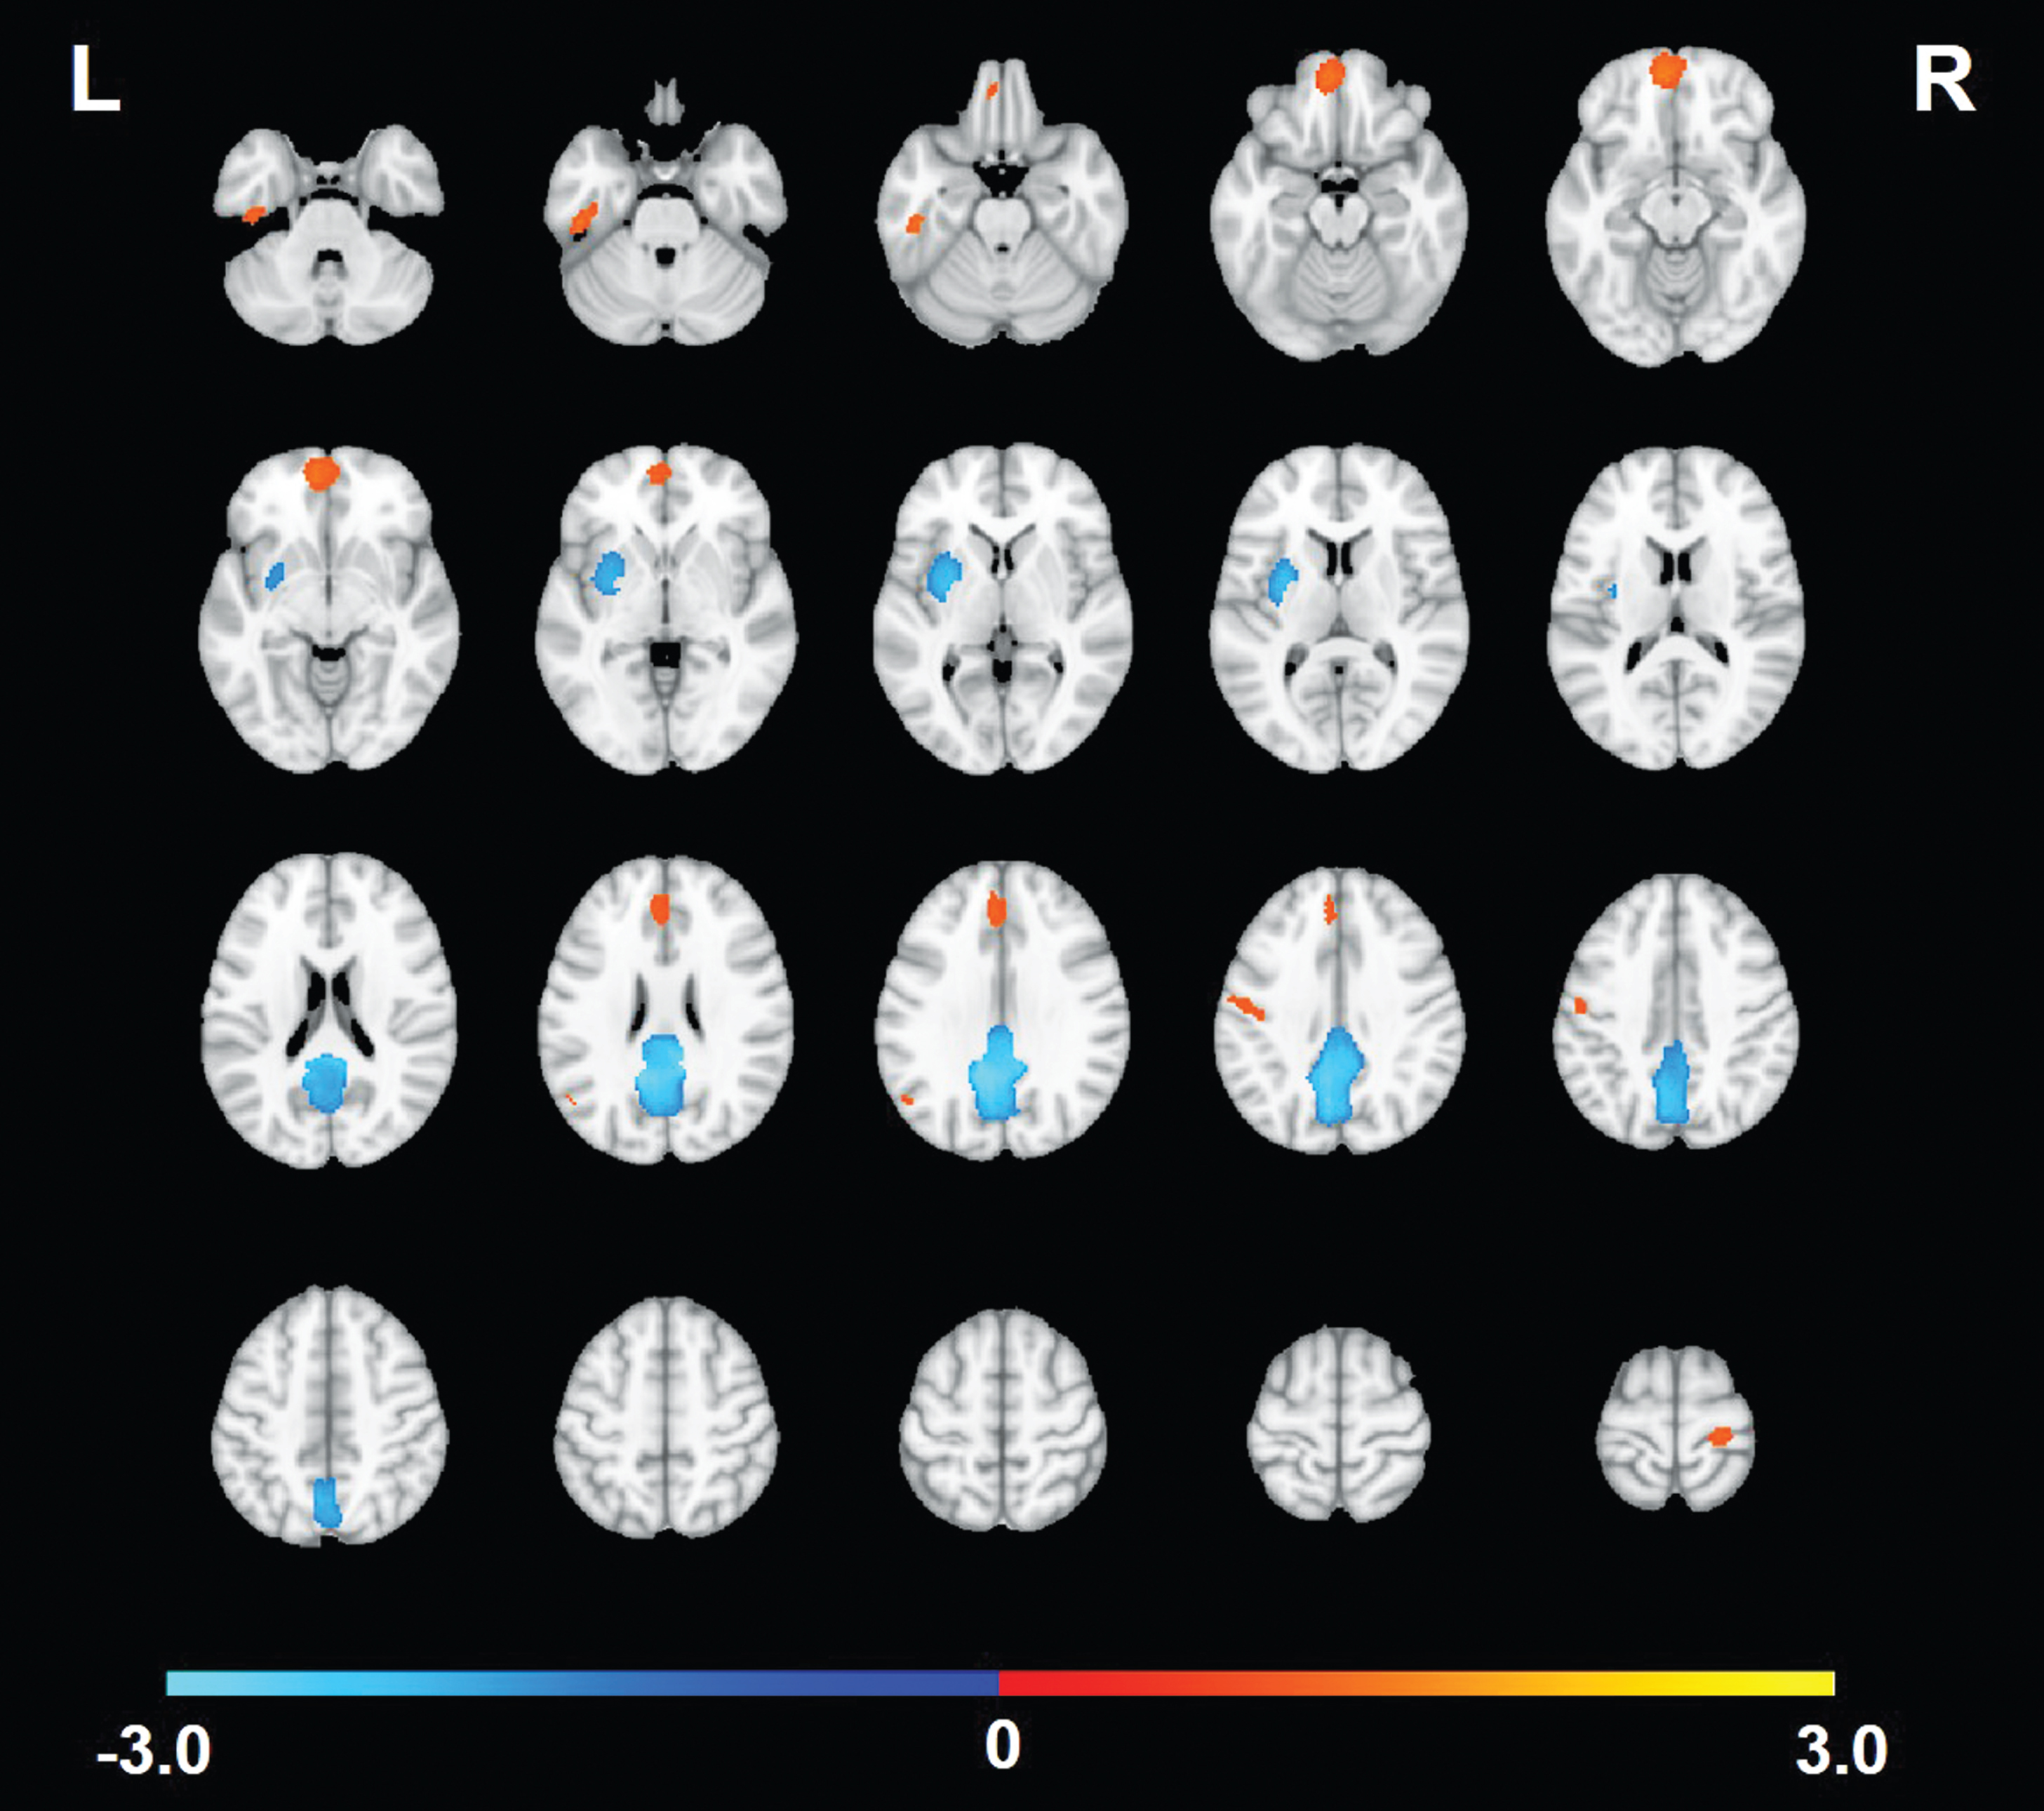
Significant clusters from the meta-analysis of studies comparing DMN resting state connectivity between those with mild cognitive impairment (MCI) and healthy comparison (HC) participants. Warm-colored clusters are regions where the studies indicated greater/more positive correlation strength among those with MCI compared to HC. Cool-colored clusters are regions where the studies indicated lower/less positive correlation strength in MCI compared to HC.
Clusters of Significant Effects Across Studies for the Comparison of MCI to HC and Consistency of Findings Based on Leave-One-Study-Out Jackknife Analyses and Number of Studies with Non-Zero Effects
No., number, *Number of studies showing a non-zero effect in the same direction as the meta-analytic group difference (i.e., MCI > HC, HC > MCI).
The largest and most significant group difference cluster was in midline posterior cingulate gyrus/precuneus with reduced DMN connectivity in MCI compared to HC. This was the most consistent cluster across studies; 52% showed this effect. Another cluster of HC > MCI was found in the left lenticular nucleus/putamen. MCI > HC clusters were also observed, with the strongest and most consistent results found in inferior (BA11) and superior (BA32) medial prefrontal cortex, and in a small region within the left angular gyrus. Only 16–19% of studies showed any evidence of MCI > HC in these regions, however. Four additional clusters of MCI > HC in the left inferior temporal gyrus, left postcentral gyrus (inferior and superior), and right precentral gyrus were significant in the meta-analysis but only observed in < 15% of studies. We further examined degree of consistency versus heterogeneity of the meta-analytic findings across studies by mapping the number of studies exhibiting a non-zero effect size in each voxel (Fig. 3). The maximum number of studies showing a non-zero group difference in the same voxel was 19 (61%), in the peak of the identified posterior cingulate cortex cluster. In most other voxels, including those within significant meta-analytic clusters, only a handful of studies showed significant group differences.
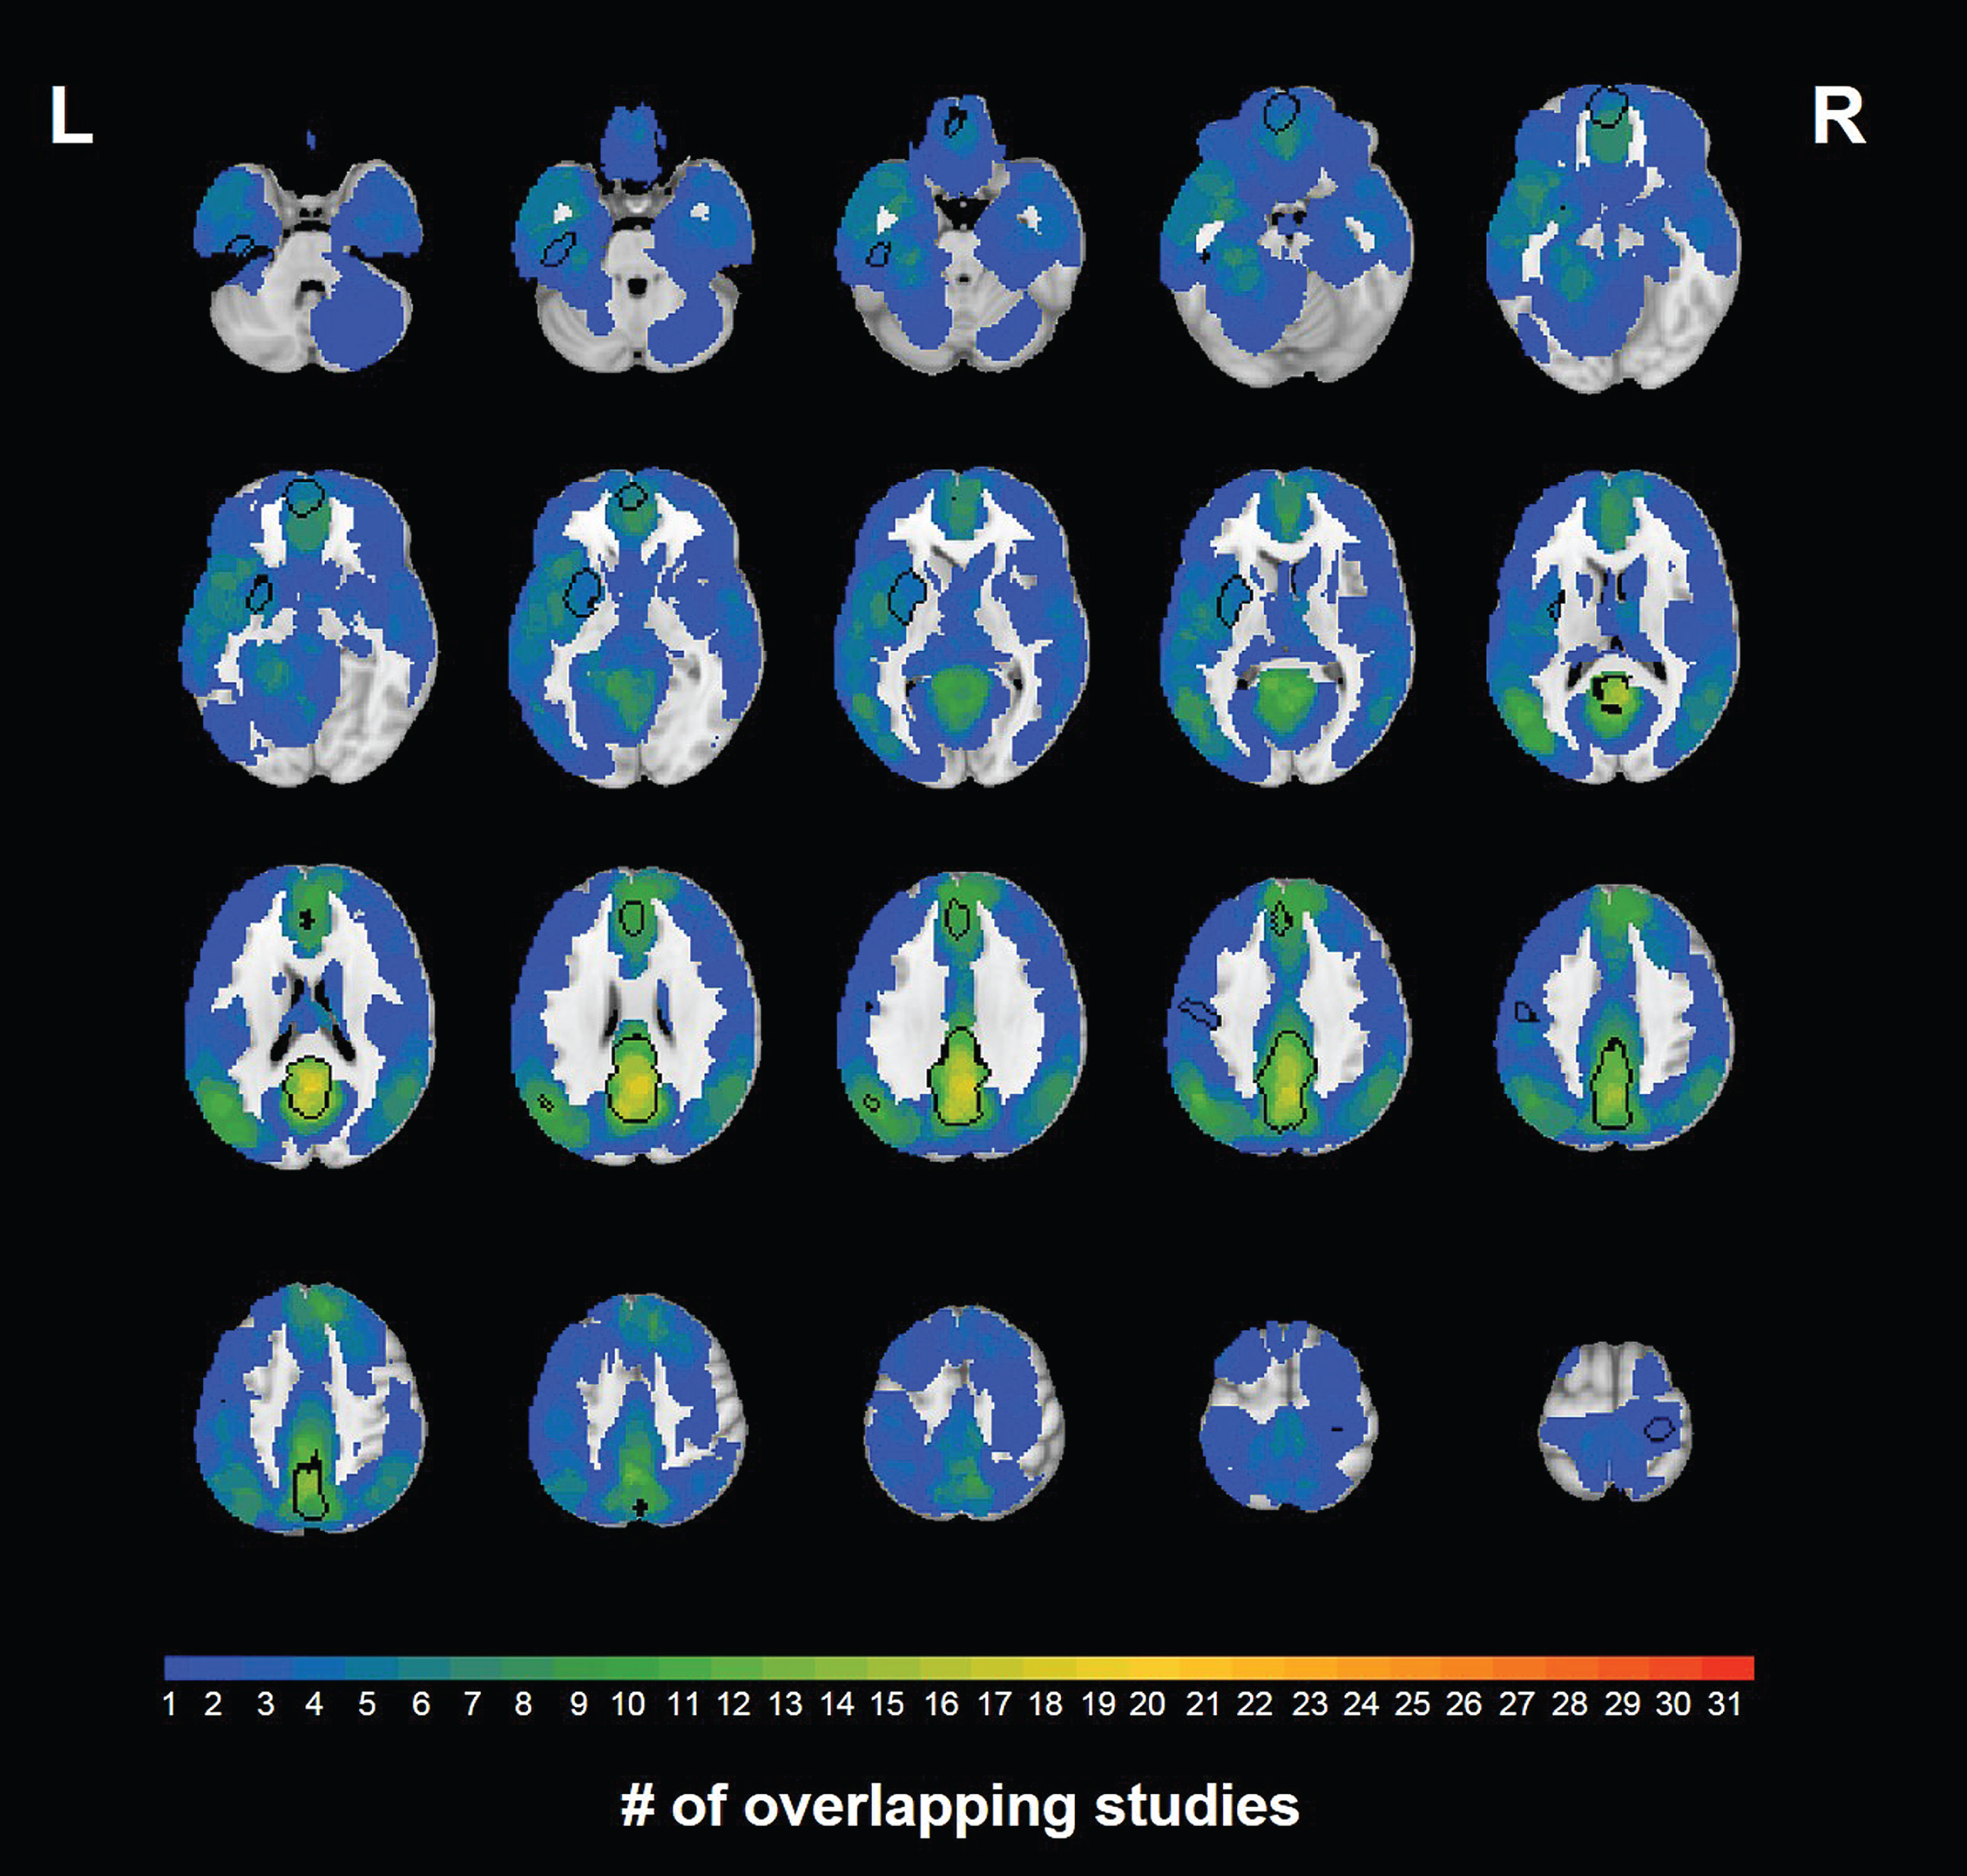
Number of studies out of 24 that showed a non-zero effect in each voxel. Locations of significant clusters from the meta-analysis are indicated with black outlines. The color scale indicates the number of studies with significant non-zero effects, not the effect size.
Finally, we examined the degree to which the whole-brain regionally-distributed pattern of hypo- and hyper-activations observed in the group analysis was also observed in individual studies (Supplementary Tables 3 and 4). For each study, we masked the study’s effect size map by the meta-analytic cluster mask, and counted the number of clusters in which the mean effect was non-zero and in the same direction as the meta-analysis. With 9 significant clusters, this similarity score could be 0–9 for a given study. The mean similarity score was 1.5 (SD = 1.5), with a minimum of 0 (7 studies) and a maximum of 5 (3 studies) clusters in the expected direction of non-zero effect within a study. Only three studies showed the meta-analytic pattern of both HC > MCI in the large posterior cingulate cluster and MCI > HC in the large medial prefrontal cortex cluster.
Sources of heterogeneity (See Supplementary Tables 3–5)
In general, we found very few characteristics that distinguished among the studies in which results were or were not different between groups in agreement with the meta-analysis. There was some evidence that studies finding a non-zero MCI > HC group difference had smaller HC sample sizes and shorter scan lengths. No sample or design characteristics differed between studies that did or did not show effects within the two HC > MCI clusters. In 16 studies finding non-zero HC > MCI effects in the posterior cingulate cortex, the size of the effect was related only to the male:female ratio of the sample. Studies with more MCI women showed smaller HC-MCI differences (r (13) = –0.55, p = 0.03). Finally, we examined correlates of the similarity score (i.e., the number of meta-analytic regions in which a given study showed evidence for group differences in the correct direction). Studies that better matched the meta-analysis result used shorter scan lengths (r (28) = –0.40, p = 0.03); other study characteristics were unrelated to similarity score.
DISCUSSION
Our qualitative review and meta-analysis suggests a far more mixed picture than reported by other reviews. The meta-analytic map based on voxel coordinates of group differences in 31 studies shows 7 regions with MCI > HC and 2 with HC > MCI. However, a proportion of the clusters are not reliably observed in jack-knife analyses, and, in most clusters, only a handful of studies are contributing to the effect. Importantly, the pattern of results of most individual studies do not look like the pattern of results of the meta-analysis, averaging significant effects in only 17% of the observed clusters. Only three showed group differences in at least 5 of the 9 significant regions and the meta-analytic pattern of posterior cingulate/precuneus hypoconnectivity along with medial prefrontal cortex hyperconnectivity.
Thus, evidence is weak for a single predictive biomarker of AD risk from DMN resting-state connectivity that will replicate across studies, or more importantly, be observed reliably at the individual subject level. Within AD, indices that combine regions of hypo- and hyper-connectivity together have been examined, but effect sizes are low compared to other neuroimaging measures [85]. Our findings suggest the same is likely to be true for such an index when applied to MCI samples. Similarly, a mega-analysis included in our review [39] found hypo-connectivity in MCI relative to HC, but effect sizes were only small-to-medium and were not observed reliably within individual samples. They estimated that studies would need 140–600 participants in order to observe similar effects.
Our systematic review revealed much more inconsistency than would be expected given the repeated conclusions of qualitative reviews [10–17, 25]. These reviews did not focus on direction of effects, did not generally include published investigations after 2011, and did not examine potential factors that could explain heterogeneity of findings. One previous quantitative review only found limited DMN differences in varying directions [23], and did not examine sources of variability among studies. Another meta-analysis [26] that included a small subset of the studies reviewed here and similarly included null results and analyzed both directions of group differences, found several areas of hypo- and hyper-connectivity, including hypo-connectivity within the posterior cingulate.
Our meta-analysis showed evidence of reduced connectivity in MCI compared to HC in a posterior cingulate cluster. The posterior cingulate is considered a DMN hub and may be important for switching between task-positive and task-negative networks [86]. Its involvement in MCI is consistent with the cascading networks hypothesis that posits it is an early site for functional disconnection that spreads to other cortical networks later in the course of AD [87]. Reduced posterior cingulate connectivity showed the most across-study consistency, yet it was present in only half of the studies. Further investigation of this important brain region is warranted. A cluster of MCI hyper-connectivity in the medial prefrontal cortex (BA 11) was also observed in the meta-analysis, although it was only observed in 5 studies, 3 of which also showed hypo-connectivity of the posterior cingulate cortex in the MCI group. A similar pattern of posterior DMN hypo-connectivity and medial prefrontal hyperconnectivity has been seen in AD, a finding that was interpreted as consistent with a model of early posterior connectivity disruptions followed by compensatory over-connectivity in prefrontal regions [85]. It has been suggested that heightened prefrontal functional brain response during working memory tasks in MCI may signal an attempt to compensate for declining brain function [88]. At least one study of prefrontal connectivity suggests that such attempts at compensation may not always be successful; enhanced correlations of medial prefrontal cortex with the rest of the DMN were shown to be related to semantic memory deficits in MCI samples [51].
In exploratory analyses, we searched for study features that might explain inconsistencies. In general, there were few methodological differences that could account for the inconsistent results. In some cases, consistency with the meta-analysis was more likely among studies with lower HC sample size or shorter scan time. Since more observations are associated with greater power, these relationships, should they be replicated, only reduce confidence in the pattern of results. Age difference might be important but mean age varied little across the reviewed studies. We were unable to systematically review longitudinal changes in DMN functional connectivity, and no studies examined whether MCI individuals progressed to AD. There may be a period of increased activation and/or functional connectivity as individuals progress from unaffected to MCI with an eventual decline as they progress to AD [89–92]. Thus, it is possible that heterogeneity within or between MCI groups with respect to this trajectory might increase the likelihood of inconsistent findings. Only studies following these individuals to dementia diagnosis will be able to resolve this issue.
Also, no studies in our review used actuarial or neuropsychologically-defined methods of diagnosis, even though the actuarial approach to defining MCI has been shown to result in a group that is more biomarker positive and at higher risk for progressing to AD [93, 94]. The actuarial approach has also been able to identify MCI in middle age [95], with higher AD polygenic risk scores associated with significantly increased odds of having MCI [96].
An additional source of heterogeneity among studies could be the presence or absence of other biomarkers such as amyloid or tau, which were not measured in the majority of the reviewed studies. It is possible that the combination of such biomarkers with resting state DMN connectivity deficits in, for example, the posterior cingulate, might more powerfully predict AD progression than either alone. The A/T/(N) framework emphasizes the value of a biomarker-based diagnosis of AD, with amyloid (A) and tau (T) being the defining pathologies [96]. In this framework, MCI is viewed as prodromal AD in the presence of biomarker positivity, usually defined by amyloid positivity. Biomarker data might help to resolve some of the heterogeneity of the DMN findings for MCI, but they are unlikely to fully account for the inconsistencies. Within regions demonstrating significant effects in the meta-analysis, some findings reflected hyper-connectivity while others reflected hypo-connectivity. Biomarker negative individuals may have MCI that is not due to AD and might be less abnormal, but it seems unlikely that their differences would be in the opposite direction. The A/T/(N) framework is also agnostic to the biomarker sequence, which means that some biomarker negative MCI cases are likely to be false negatives because they may ultimately develop biomarker positivity. Again, the only way that these issues can be resolved is through longitudinal studies that can track biomarker and diagnostic status through to dementia onset.
There are limitations to our review that should be considered. We may have missed some relevant papers with our search terms and our review of the references of the included papers. An advantage of our meta-analysis technique was its allowance for consideration of studies with null results. Publication bias against null studies may have strengthened the meta-analytic results, but that would suggest even greater inconsistency. It is further possible that some included studies contained overlapping samples, which again would serve to reduce heterogeneity, not enhance it. In addition, we considered studies that found MCI > HC versus HC > MCI in the same region to be inconsistent, but some might argue that analyses should be done regardless of direction to identify biomarkers of MCI. It did not appear from our data, however, that considering the absolute value of the group difference would have greatly changed the results. We focused on the DMN because it was the most commonly examined resting network. Consequently, we excluded studies of other networks and inter-network connectivity measures. We restricted our review to resting-state studies because these may hold the most promise for future clinical applications, and the various paradigms employed in task-based studies would have introduced an additional source of heterogeneity. It is possible, however, that task-based connectivity measures would reveal more consistent patterns in MCI. Because of additional inclusion criteria for the meta-analysis, it included only a subset of studies, limiting its power; however, heterogeneity was observed in both the quantitative and larger qualitative systematic reviews. Our review did not address other AD risk factors such as APOE genotype, amyloid-β, or tau burden. There were only two studies in the review that required AD-related biomarkers in addition to clinical diagnosis of MCI, so we could not conduct a sub-analysis to see if results would be more compelling and less heterogeneous among studies with these inclusion criteria. However, results from these two studies clearly did not suggest greater consistency or homogeneity. This meta-analysis thus reflects the current state of the literature; as more studies are added that do require AD-related biomarkers for amnestic MCI diagnosis, future meta-analyses may show greater homogeneity among studies of DMN resting state functional connectivity deficits.
In summary, although we found nine significant clusters of group difference in our meta-analysis, the direction of the differences varied, and, similar to our qualitative findings, there were substantial inconsistencies between studies in the magnitude and topography of connectivity differences between MCI and HC groups. Although reduced posterior cingulate cortex connectivity in MCI was the most robust and consistent finding, being present in 52% of the studies, that also means that it was not reduced in 48% of the studies. Inconsistency was not clearly due to methodological variability. Once people progress to AD, there do appear to be consistent differences in DMN resting-state signal and intercorrelation compared with healthy older adults [23]. Therefore, such measures may yet prove to be a sensitive biomarker of risk for developing AD. This will likely need to be shown with large, longitudinal studies that follow people through conversion, and perhaps combine resting fMRI measures with biomarkers of amyloid or tau deposition. The results to date are too inconsistent, however, to support DMN functional connectivity, as currently measured, as a useful biomarker of risk for AD, as determined by current criteria for MCI.
Footnotes
ACKNOWLEDGMENTS
This work was supported by the National Institutes of Health National Institute on Aging (Grants U24 RR021382, R01 AG050595, R01 AG22381, R01 AG 22982, and R03 AG 046413), National Institute for Mental Health (Grant T32 MH20030), National Institute for Drug Abuse (Grant R01 DA18673), VA Desert Pacific Mental Illness Research Education and Clinical Center, and the VA San Diego Center of Excellence for Stress and Mental Health. Additional support was provided in part by the National Center for Research Resources (Grants P41-RR14075 and the NCRR BIRN Morphometric Project BIRN002, U24 RR021382), the National Institute for Biomedical Imaging and Bioengineering (Grant R01 EB006758), the National Institute for Neurological Disorders and Stroke (Grant R01 NS052585-01), and the Autism and Dyslexia Project funded by the Ellison Medical Foundation. The U.S. Department of Veterans Affairs and the VA Cooperative Studies Program have provided support for the development and maintenance of the VET Registry. The content is the responsibility of the authors and does not necessarily represent official views of the NIA, NIH, or VA. We also acknowledge the cooperation and participation of the members of the VET Registry and their families.