




Abstract
Background
The diagnostic value of blood-based biomarkers for Alzheimer's disease (AD) neuropathology has been demonstrated in individuals with cognitive impairment; however, evidence for reliable preclinical stage diagnostic methods remains insufficient.
Objective
To identify confounding variables that may obscure the interpretation of these biomarkers, we examined their associations with various physiological indices including age, renal function, and cognitive function in Japanese men from the general population.
Methods
Plasma were collected from 845 randomly selected Japanese men participants (aged >40 years) to measure 40- and 42-amino acid amyloid-β (Aβ40 and Aβ42), total tau (T-tau), tau phosphorylated at threonine 181 (P-tau181), and neurofilament light chain (NfL) using an automated immunoassay system. Cognitive function was assessed using the Cognitive Abilities Screening Instrument (CASI). Linear regression models were constructed to estimate association strengths with correction for possible confounding variables.
Results
Plasma Aβ40, Aβ42, T-tau, P-tau181, NfL, and P-tau181/T-tau increased with age and declining glomerular filtration rate (eGFR), whereas Aβ42/Aβ40 decreased with age. Higher T-tau and P-tau181 were associated with lower CASI scores after adjusting for age and eGFR. Individuals in older age groups with Aβ42/Aβ40 ratios less than or equal to a cutoff (“amyloid-positive”) also exhibited higher P-tau181, NfL, and P-tau181/T-tau than amyloid-negative individuals, with no significant difference in mean CASI score.
Conclusions
Our results confirm that plasma AD biomarkers are significantly influenced by age and renal clearance rate. Notably, higher T-tau and P-tau181 were associated with preclinical cognitive impairment. Additionally, a lower Aβ42/Aβ40 was associated with asymptomatic tau pathology and neurodegeneration.
Introduction
Alzheimer's disease (AD) neuropathology is characterized by the progressive deposition of extracellular senile plaques composed of amyloid-β (Aβ) peptides and by intracellular accumulation of neurofibrillary tangles (NFTs) consisting of phosphorylated (P)-tau protein. The presence of senile plaques and NFTs in brain can be detected directly by positron emission tomography (PET) and indirectly by biochemical analyses of cerebrospinal fluid (CSF). A lower Aβ42 to Aβ40 ratio (Aβ42/Aβ40) in CSF is strongly predictive of Aβ deposition in brain, whereas elevated CSF concentrations of P-tau variants, such as tau phosphorylated at threonine 181 and 217 (P-tau181 and P-tau217), are indicative of brain NFTs.1,2 Other CSF markers for brain pathology in AD include total tau (T-tau) and neurofilament light chain (NfL), which are indicative of axonal injury and neurodegeneration. Deposition of these protein aggregates precedes the onset of symptomatic AD by a few decades, suggesting utility as early-stage diagnostic biomarkers.3,4
Early screening and detection of prodromal AD is critical because disease-modifying therapies are most effective when initiated during the preclinical stages of the disease. Blood-based biomarkers are highly advantageous for this purpose due to lower cost compared to neuroimaging and greatly reduced patient discomfort compared to CSF sampling. Moreover, technological advances have overcome the challenges of quantifying the extraordinarily low levels of brain-derived AD biomarkers in the peripheral blood. Emerging evidence indicates that plasma AD biomarkers including Aβ42/Aβ40 ratio, several P-tau variants, NfL can predict cognitive decline and AD development with moderate precision.5–11 However, most such studies have been conducted in clinical settings on selected patients with memory or cognitive impairments, and there is limited evidence regarding the clinical validity of these markers in the general populations.12–14 In addition, the difference in Aβ42/Aβ40 ratio between patients defined as Aβ deposition-positive or Aβ deposition-negative is still relatively small.15,16 Similarly, only modest difference in plasma P-tau have been detected between patients with and without brain NFTs. Hence, confounding factors not directly associated with neurodegeneration may obscure the interpretation of blood-based biomarkers. To improve the interpretation of biomarker measurements for individuals, it is essential to identify such confounding factors through comprehensive statistical analyses.
In this study, we utilized a highly sensitive, automated immunoassay system to measure Aβ40, Aβ42, P-tau181, T-tau, and NfL in plasma samples from a population-based cross-sectional study of middle-aged and older Japanese men, and conducted extensive multivariate regression analyses to identify associations and major confounding factors. Additionally, we examined the associations of these biomarkers with major confounders, and assessed their correlation with brain amyloid deposition and cognitive impairment.
Methods
Study participants
All participants of the current study were enrolled in the Shiga Epidemiological Study of Subclinical Atherosclerosis (SESSA), a population-based prospective study conducted in Kusatsu City, Shiga, Japan, as described elsewhere. 17 In brief, from 2006 to 2008, 1094 Japanese men (40–79 years old) were randomly selected from the general population for assessment of atherosclerosis risk factors. Participants in the baseline survey were then invited for a follow-up survey from 2010 to 2014, of which 853 men participated. Plasma samples of 8 participants were not available, and data from 845 men were included in this study. Cognitive status or other variables were missing for another 53, so the final evaluation included 792 individuals with completed assessments (Supplemental Figure 1). Although individuals with dementia were not excluded from the study, none of the participants had a physician-confirmed diagnosis of dementia. Data were collected in accordance with the Declaration of Helsinki, and the study protocol was approved by the Institutional Review Board of Shiga University of Medical Science (approval number: R2008-061), and all participants provided written informed consent.
Measurement of AD biomarker levels
Fasting blood samples were collected in tubes containing ethylenediaminetetraacetic acid and stored on ice. Samples were centrifuged (4°C, 3000 rpm, 15 min) and 500 μL aliquots of plasma stored at −80°C for further analyses within 90 min of collection. Frozen samples were subsequently thawed for 1 h at room temperature, and concentrations of Aβ40 (pg/mL), Aβ42 (pg/mL), P-tau181 (pg/mL), T-tau (pg/mL), and NfL (pg/mL) quantified using the Automated Immunoassay System HISCLTM-5000 (HISCL analyzer). 18 Quality control tests were performed on a subset of samples before and after measurements. All quality control measurements met our preset internal criteria.
Evaluation of cognitive ability
Cognitive functions were assessed using the Cognitive Abilities Screening Instrument (CASI) (Version J-1.0). 19 Three raters (AF, NM, and YS) independently assessed CASI scores based on recorded responses. The intraclass correlation coefficient across the raters was 0.977 based on the recorded samples of 20 participants.20,21
Other measurements
Data on medical history, medication use, smoking status, drinking status, and other lifestyle factors were collected using a self-administered questionnaire and reviewed by trained research technicians. The participants were divided into three smoking categories (never smoker, past smoker, and current smoker) and three drinking categories (never drinker, past drinker, and current drinker). Ethanol intake (g/day) among current drinkers was also calculated by collecting data on beverage types, portion sizes, and drinking frequency. Body weight and height were measured in light clothing without shoes, and body mass index (BMI) was calculated as weight (kg) divided by height squared (m2). Reported blood pressure (BP) values are the mean of two consecutive measurements in the right arm using an automated sphygmomanometer. BP measurements were taken with the participant in a seated position after they had emptied their bladders and sat quietly for 5 min. Blood samples were collected after overnight fasting at the same time as the surveys were completed. These were then laboratory tested for estimated glomerular filtration rate (eGFR) and the levels of total cholesterol, high-density lipoprotein (HDL) cholesterol, low-density lipoprotein (LDL) cholesterol, triglyceride (TG), hemoglobin A1c (HbA1c), creatinine, lipids, and glucose. Serum creatinine was measured using the enzymatic method. Plasma glucose was measured from sodium fluoride–treated plasma using the hexokinase glucose-6-phosphate-dehydrogenase enzymatic assay. HbA1c was measured using a latex agglutination inhibition assay. Serum concentrations of total cholesterol and TG were measured using enzymatic assays, while HDL and LDL cholesterol levels were measured using the direct method and the Friedewald formula, respectively. 22 Lipid measurements were standardized in accordance with the protocol of the US Centers for Disease Control and Prevention/ Cholesterol Reference Method Laboratory Network. eGFR was calculated for each participant by measuring plasma creatinine according to the following equation: eGFR (mL/min/1.73 m2) = 194 × serum creatinine (mg/dL)−1.094 × age−1.287 × 0.739. 23 Hypertension was defined as systolic/diastolic BP ≥ 140/90 mm Hg or current use of antihypertensives. Diabetes mellitus was defined as a fasting plasma glucose level ≥7.0 mmol/L, HbA1c (National Glycohemoglobin Standardization Program) ≥ 6.5%, or current use of antidiabetics. Coronary heart disease was defined as a history of myocardial infarction or angina pectoris.
Statistical analysis
Continuous variables with approximately normal distributions are expressed as mean ± standard deviation (SD) while continuous variables with skewed distributions are expressed as median (interquartile range). Categorical variables are expressed as n (% of total). Simple linear regression and multiple linear regression with forced entry were used to evaluate the associations of each plasma biomarker (concentration or ratio) with demographic and clinical variables (age, BMI, systolic BP, hemoglobin [Hb], albumin, uric acid, alanine aminotransferase [ALT], γ-glutamyl transpeptidase, HDL cholesterol, TG, LDL cholesterol, HbA1c, eGFR, education, ethanol intake, pack-years, history of coronary heart disease and stroke). Standardized partial regression coefficients were calculated by dividing dependent and independent variables by their respective SDs. Plasma biomarker values were first log-transformed due to skewed distributions. Plasma biomarker concentrations were also compared across age groups (40–49, 50–59, 60–69, 70–79, and ≥80 years) and renal function categories (eGFR: ≥90, 60–90, 45–60, and <45 mL/min/1.73 m2) using the Kruskal-Walls test. In addition, participants were divided into amyloid-positive and amyloid-negative populations according to the Aβ42/Aβ40 cutoff value of 0.102, which yielded a sensitivity of 88% and a specificity of 72% for the prediction of Aβ deposition in our previous study. 18 Linear regression models were used to evaluate the association between each plasma biomarker and CASI score. Logistic regression models were also constructed to estimate the odds ratio and 95% confidence interval (CI) for cognitive impairment (CASI <82) per one SD increase in log-transformed plasma biomarker value. To control for potential confounders, six models were created. Model 1 was adjusted for age and education (years). Model 2 included Model 1 covariates plus smoking status (never/past/current) and drinking status (never/past/current). Model 3 was further adjusted for eGFR. Model 4 was additionally adjusted for BMI, hemoglobin, LDL cholesterol. Finally, Model 5 was further adjusted for diabetes (yes/no), hypertension (yes/no), history of coronary heart disease (yes/no), history of stroke (yes/no). We also conducted a sensitivity analysis excluding participants with eGFR values <45 mL/min/1.73 m2 (n = 33). All statistical analyses were performed using SAS v9.4 statistical software (SAS Institute Inc., Cary, NC), with p < 0.05 considered statistically significant.
Results
Distribution of plasma AD biomarkers
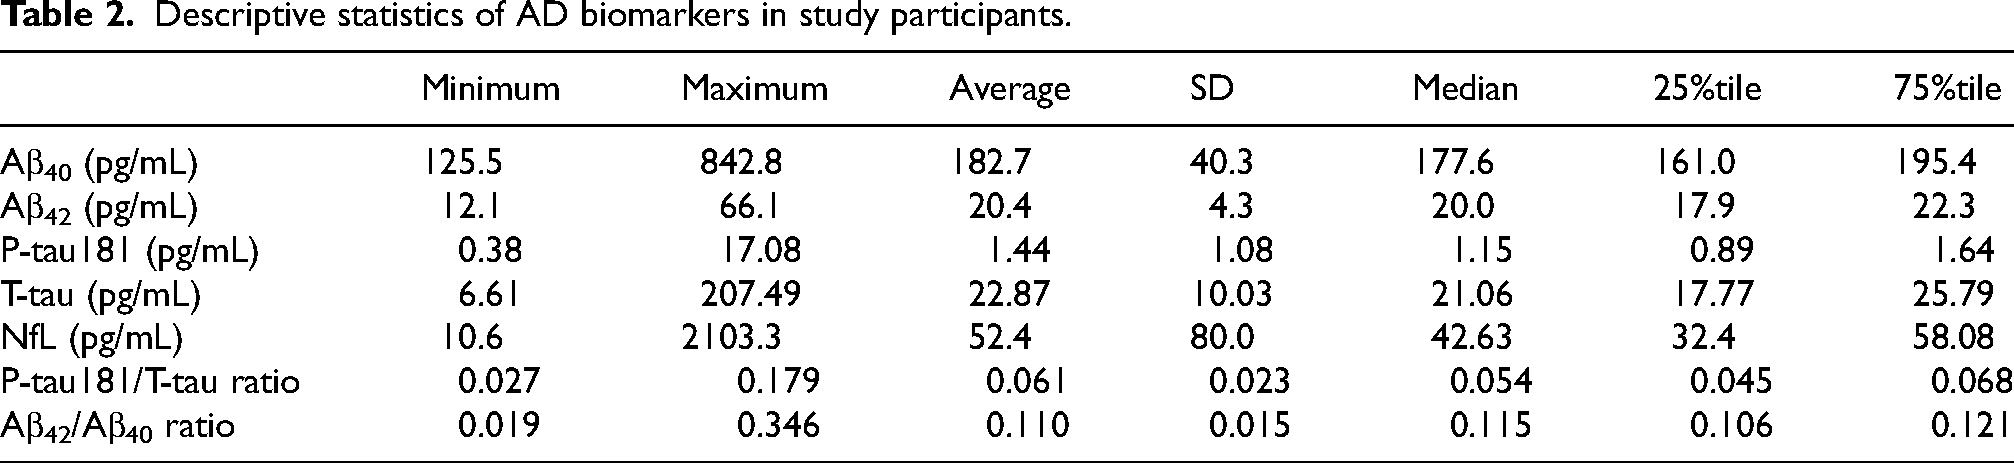
Clinical and demographic characteristics of the study participants are summarized in Table 1. Participant age ranged between 46 and 83 years (68.6 ± 8.4 years) and the majority were current or former smokers and drinkers, more than half were hypertensive, and a substantial minority (23.1%) were diabetic. The distributions of Aβ40, Aβ42, T-tau, P-tau181, NfL, Aβ42/Aβ40, and P-tau181/T-tau are shown in Supplemental Figure 2, and the descriptive statistics are summarized in Table 2. All AD biomarkers exhibited statistically skewed distributions with several outliers (Supplemental Figure 2).
Characteristics of study participants (845 men, 2010–2014, Shiga, Japan).
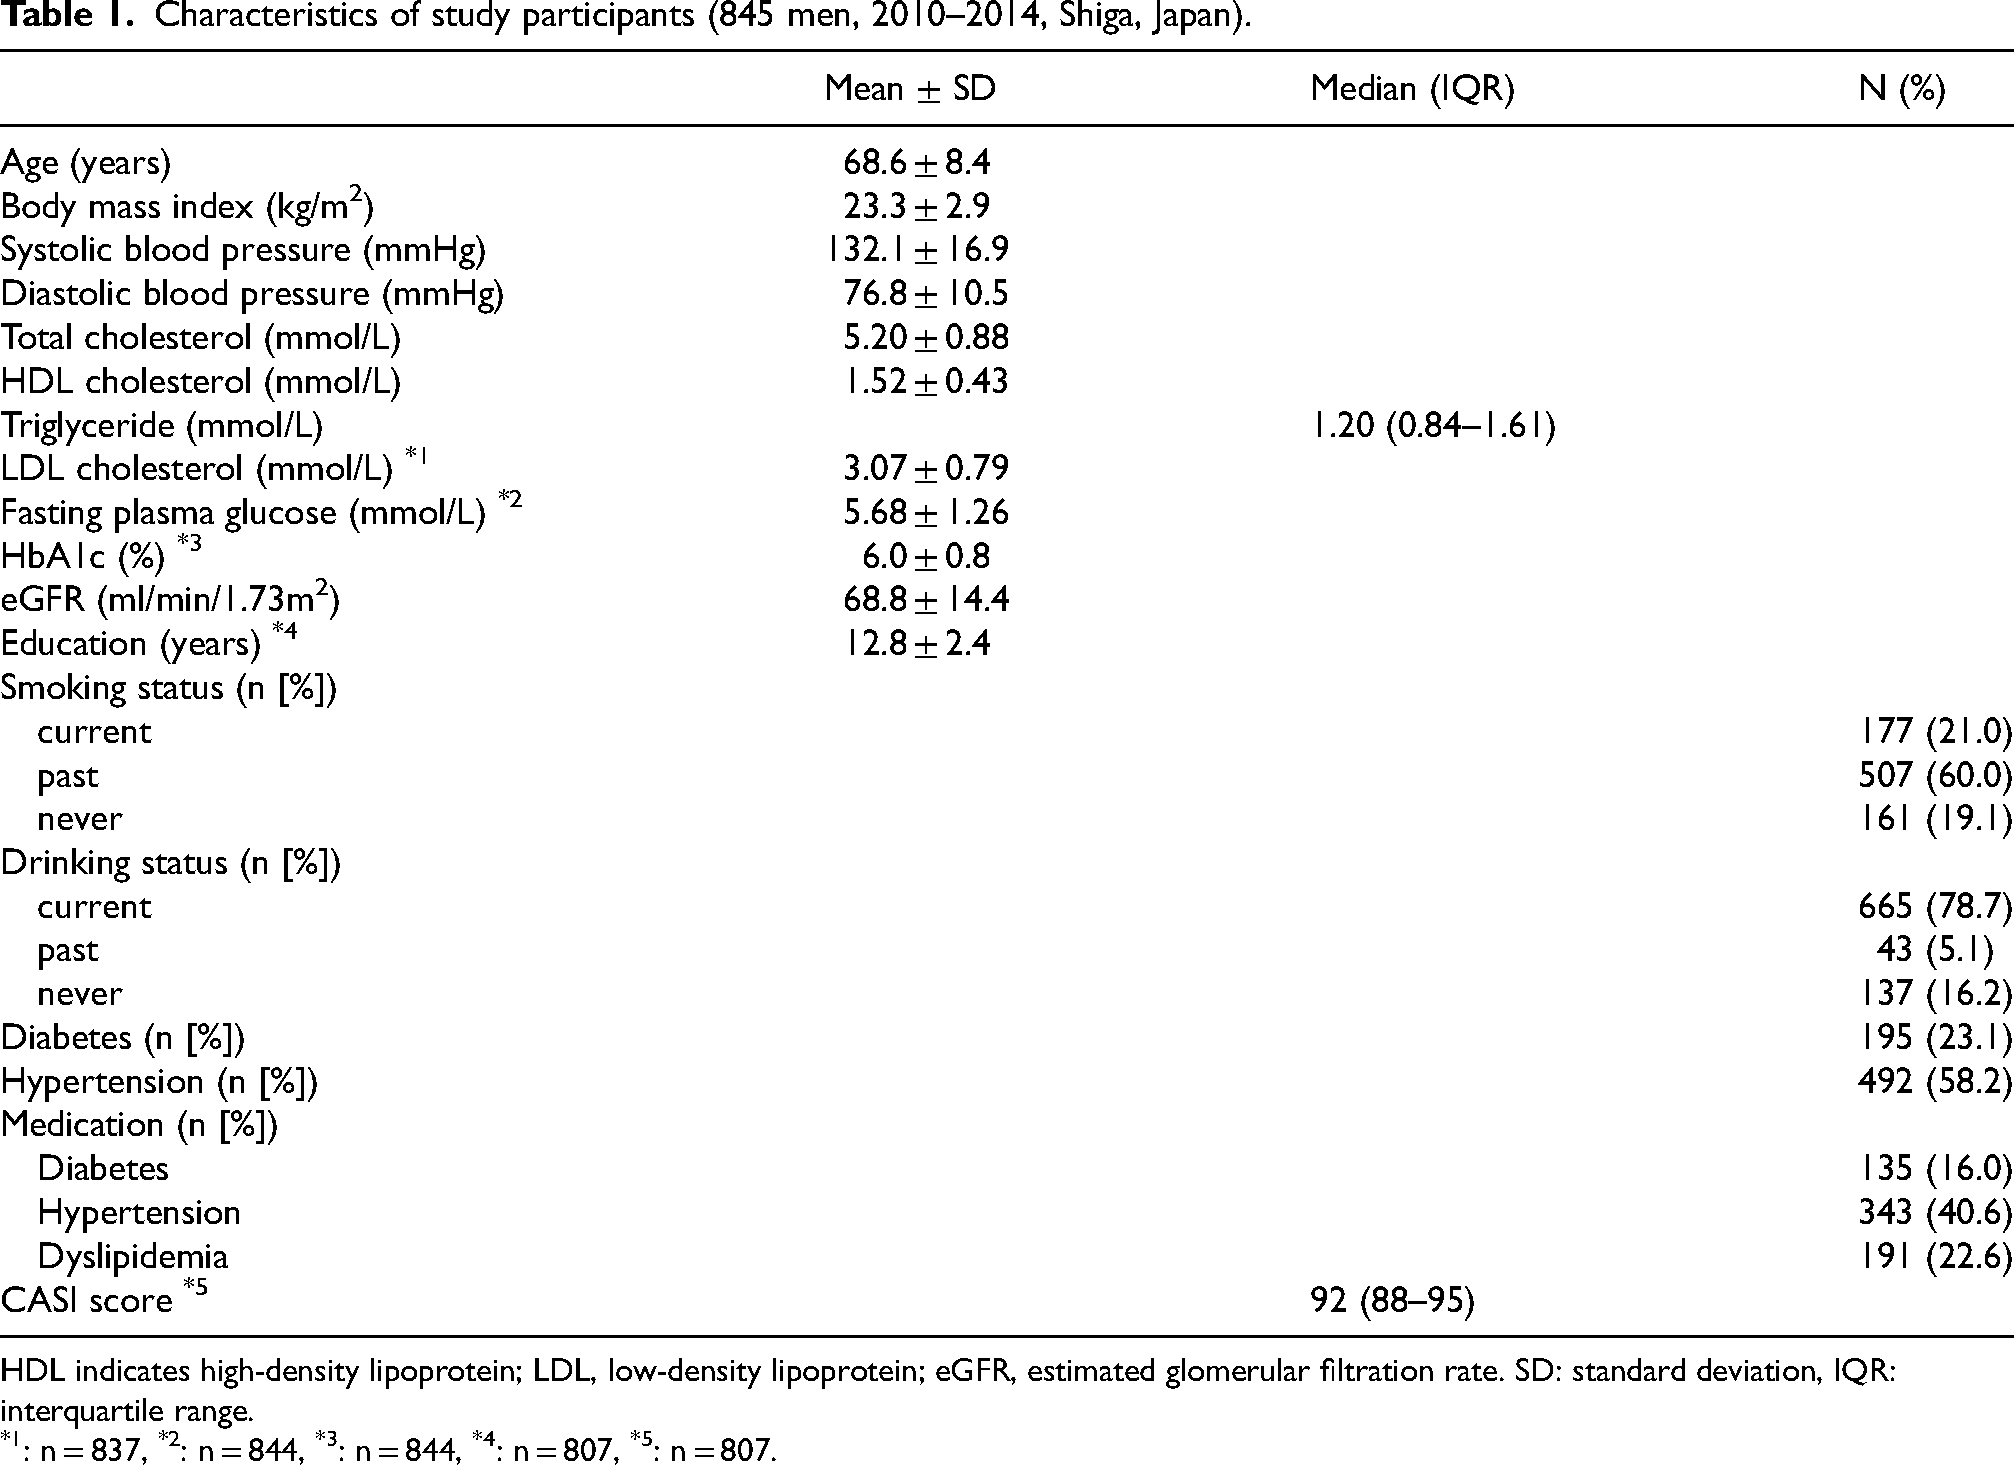
HDL indicates high-density lipoprotein; LDL, low-density lipoprotein; eGFR, estimated glomerular filtration rate. SD: standard deviation, IQR: interquartile range.
: n = 837, *2: n = 844, *3: n = 844, *4: n = 807, *5: n = 807.
Descriptive statistics of AD biomarkers in study participants.
Associations between plasma AD biomarkers and clinical and demographic variables
In the unadjusted models, higher plasma Aβ40, Aβ42, T-tau, P-tau181, and NfL concentrations were individually associated with higher age and lower eGFR (Supplemental Tables 1–7). In age-adjusted models, as well, all markers were inversely associated with eGFR (Supplemental Tables 1–7), suggesting that renal impairment contributes to peripheral biomarker accumulation. Additionally, multivariable-adjusted models indicated significant associations of plasma biomarkers with various subsets of clinicodemographic variables. Systolic BP, uric acid, TG, and HbA1c levels were positively associated with Aβ40, whereas BMI and Hb were inversely associated with Aβ40 (Supplemental Table 1). Systolic BP, uric acid, TG, and HbA1c concentrations were also positively associated with Aβ42 concentration, whereas BMI and LDL cholesterol were inversely associated with Aβ42 concentration (Supplemental Table 2). Plasma HbA1c concentration and history of coronary heart disease and stroke were positively associated with P-tau181 concentration, whereas BMI, Hb, and TG concentrations were inversely associated with P-tau181 concentration (Supplemental Table 3). ALT activity and a history of stroke were positively associated with T-tau concentration, whereas Hb and albumin concentrations were inversely associated with T-tau concentration (Supplemental Table 4). Finally, plasma HbA1c and a history of stroke were positively associated with NfL concentration, whereas BMI and Hb concentrations were inversely associated with NfL concentration (Supplemental Table 5). Multivariable-adjusted analyses revealed that the absolute values of the standardized partial regression coefficients for age and eGFR were substantially higher than those for other variables; therefore, the multivariate models adjusted for age, eGFR, or both as confounders.
Age-adjusted models revealed inverse associations of log-transformed Aβ42/Aβ40 ratio with age and LDL cholesterol (Supplemental Table 6). In the multivariable-adjusted model, age, HbA1c, and a history of coronary heart disease were positively associated with the log-transformed P-tau181/T-tau ratio, whereas BMI and TG were inversely associated with log-transformed P-tau181/T-tau ratio (Supplemental Table 7). We found no significant interaction between age and eGFR in the multivariable-adjusted models for all biomarkers (p > 0.1).
Variations in AD biomarkers across age groups and renal function categories
Comparisons of plasma AD biomarker concentrations across age groups (40–49, 50–59, 60–69, 70–79, ≥80 years) revealed progressive increases in Aβ40 (p < 0.001), Aβ42 (p < 0.001), T-tau (p < 0.001), P-tau181 (p < 0.001), and NfL (p < 0.001) with age (Table 3). Similarly, P-tau181/T-tau was higher in older age groups (p < 0.001), while in contrast, Aβ42/Aβ40 ratio was slightly but significantly lower in older age groups (p < 0.001). Plasma AD biomarker concentrations also varied with renal function as defined by eGFR range (≥90, 60–90, 45–60, <45 mL/min/1.73 m2), with significantly higher plasma Aβ40 (p < 0.001), Aβ42 (p < 0.001), T-tau (p < 0.001), P-tau181 (p < 0.001), and NfL (p < 0.001) concentrations in the lower eGFR groups (Table 4). Similarly, P-tau181/T-tau was slightly higher in the lower eGFR groups (p = 0.002), while there was no significant association between Aβ42/Aβ40 ratio and eGFR (p = 0.186).
Plasma levels of AD biomarkers across age groups.
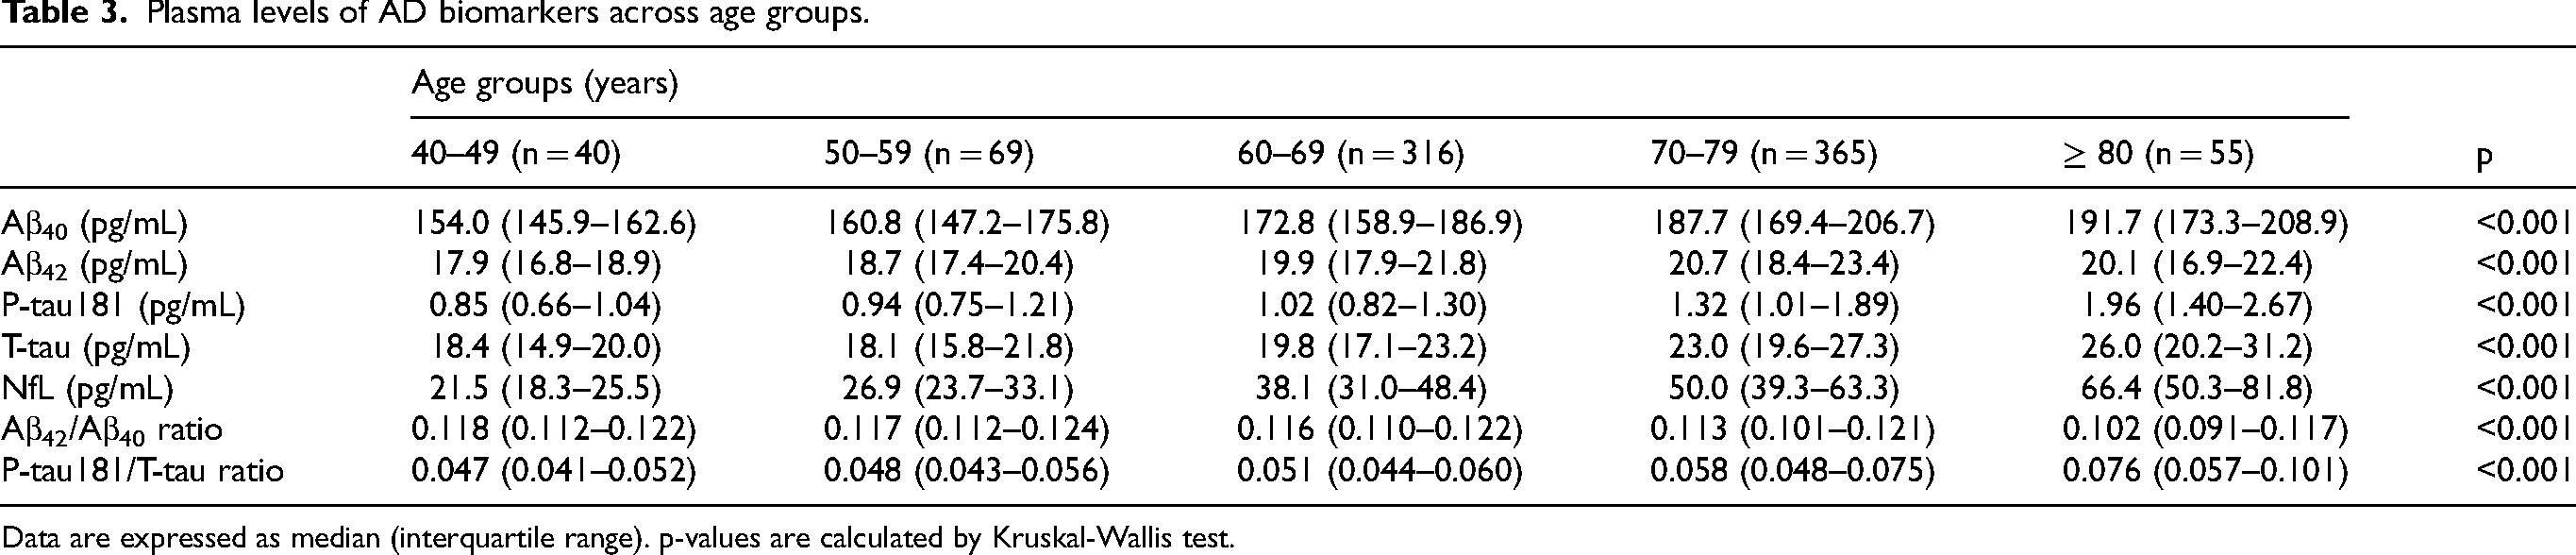
Data are expressed as median (interquartile range). p-values are calculated by Kruskal-Wallis test.
Plasma levels of AD biomarkers across renal function categories.
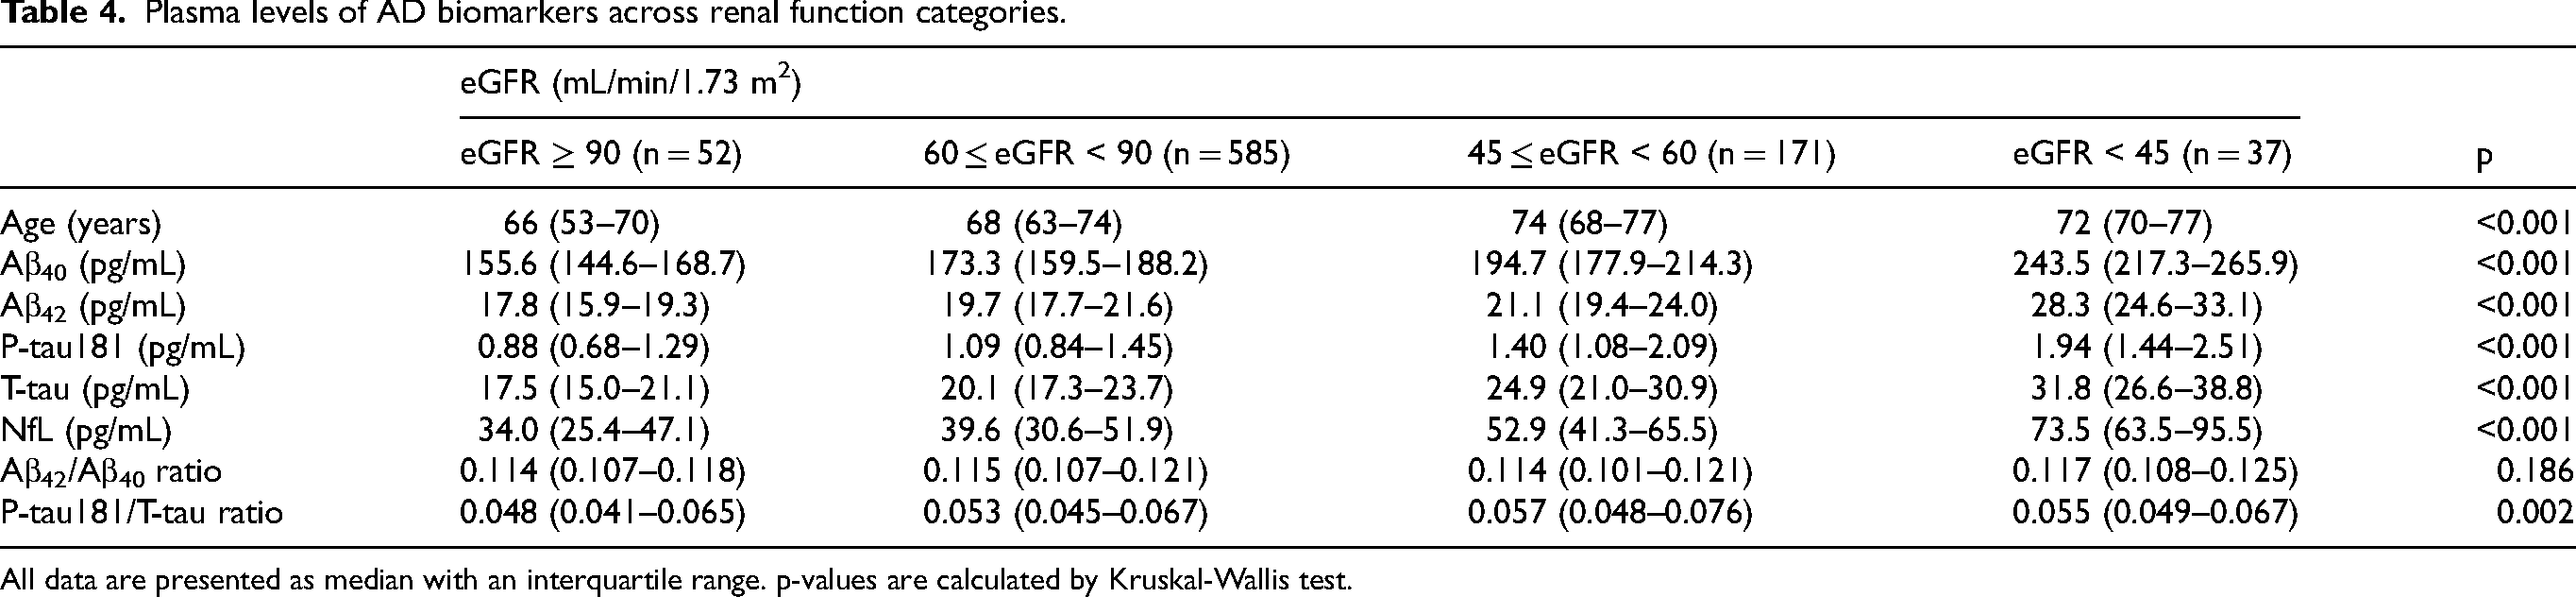
All data are presented as median with an interquartile range. p-values are calculated by Kruskal-Wallis test.
Differences in biomarkers and clinical variables between brain amyloid-positive and amyloid-negative populations
Our previous study using the HISCL immunoassay system determined the optimal Aβ42/Aβ40 cutoff for predicting Aβ deposition as 0.102. 18 In the current study, mean age was significantly higher in the brain amyloid-positive (A+) population defined by Aβ42/Aβ40 ≤ 0.102 (n = 172, mean age: 73.0 years) compared to the amyloid-negative (A–) population (n = 673, mean age: 67.4 years). Hence, subgroup analysis was performed according to age stratified into three groups (≤59 years old, 60–69 years old, and ≥70 years old) (Table 5). The group aged ≤59 years (n = 109) included only 6 A+ individuals. In the group aged 60–69 years (n = 316), neither mean age nor mean CASI score differed between the A+ population (66.0 years old, n = 38, 12.0%) and A– population (66.5 years old). However, P-tau181 (p < 0.001), P-tau181/T-tau ratio (p < 0.001), and NfL (p = 0.009) were all significantly higher in the A+ population. Similarly, in the group aged ≥70 years (n = 420), which included 128 A+ cases (30.5%), P-tau181 (p < 0.001), P-tau181/T-tau ratio (p < 0.001), and NfL (p = 0.005) (but not mean age or mean CASI score) were significantly higher in the A+ population.
Comparison between amyloid-positive and -negative groups in age populations.
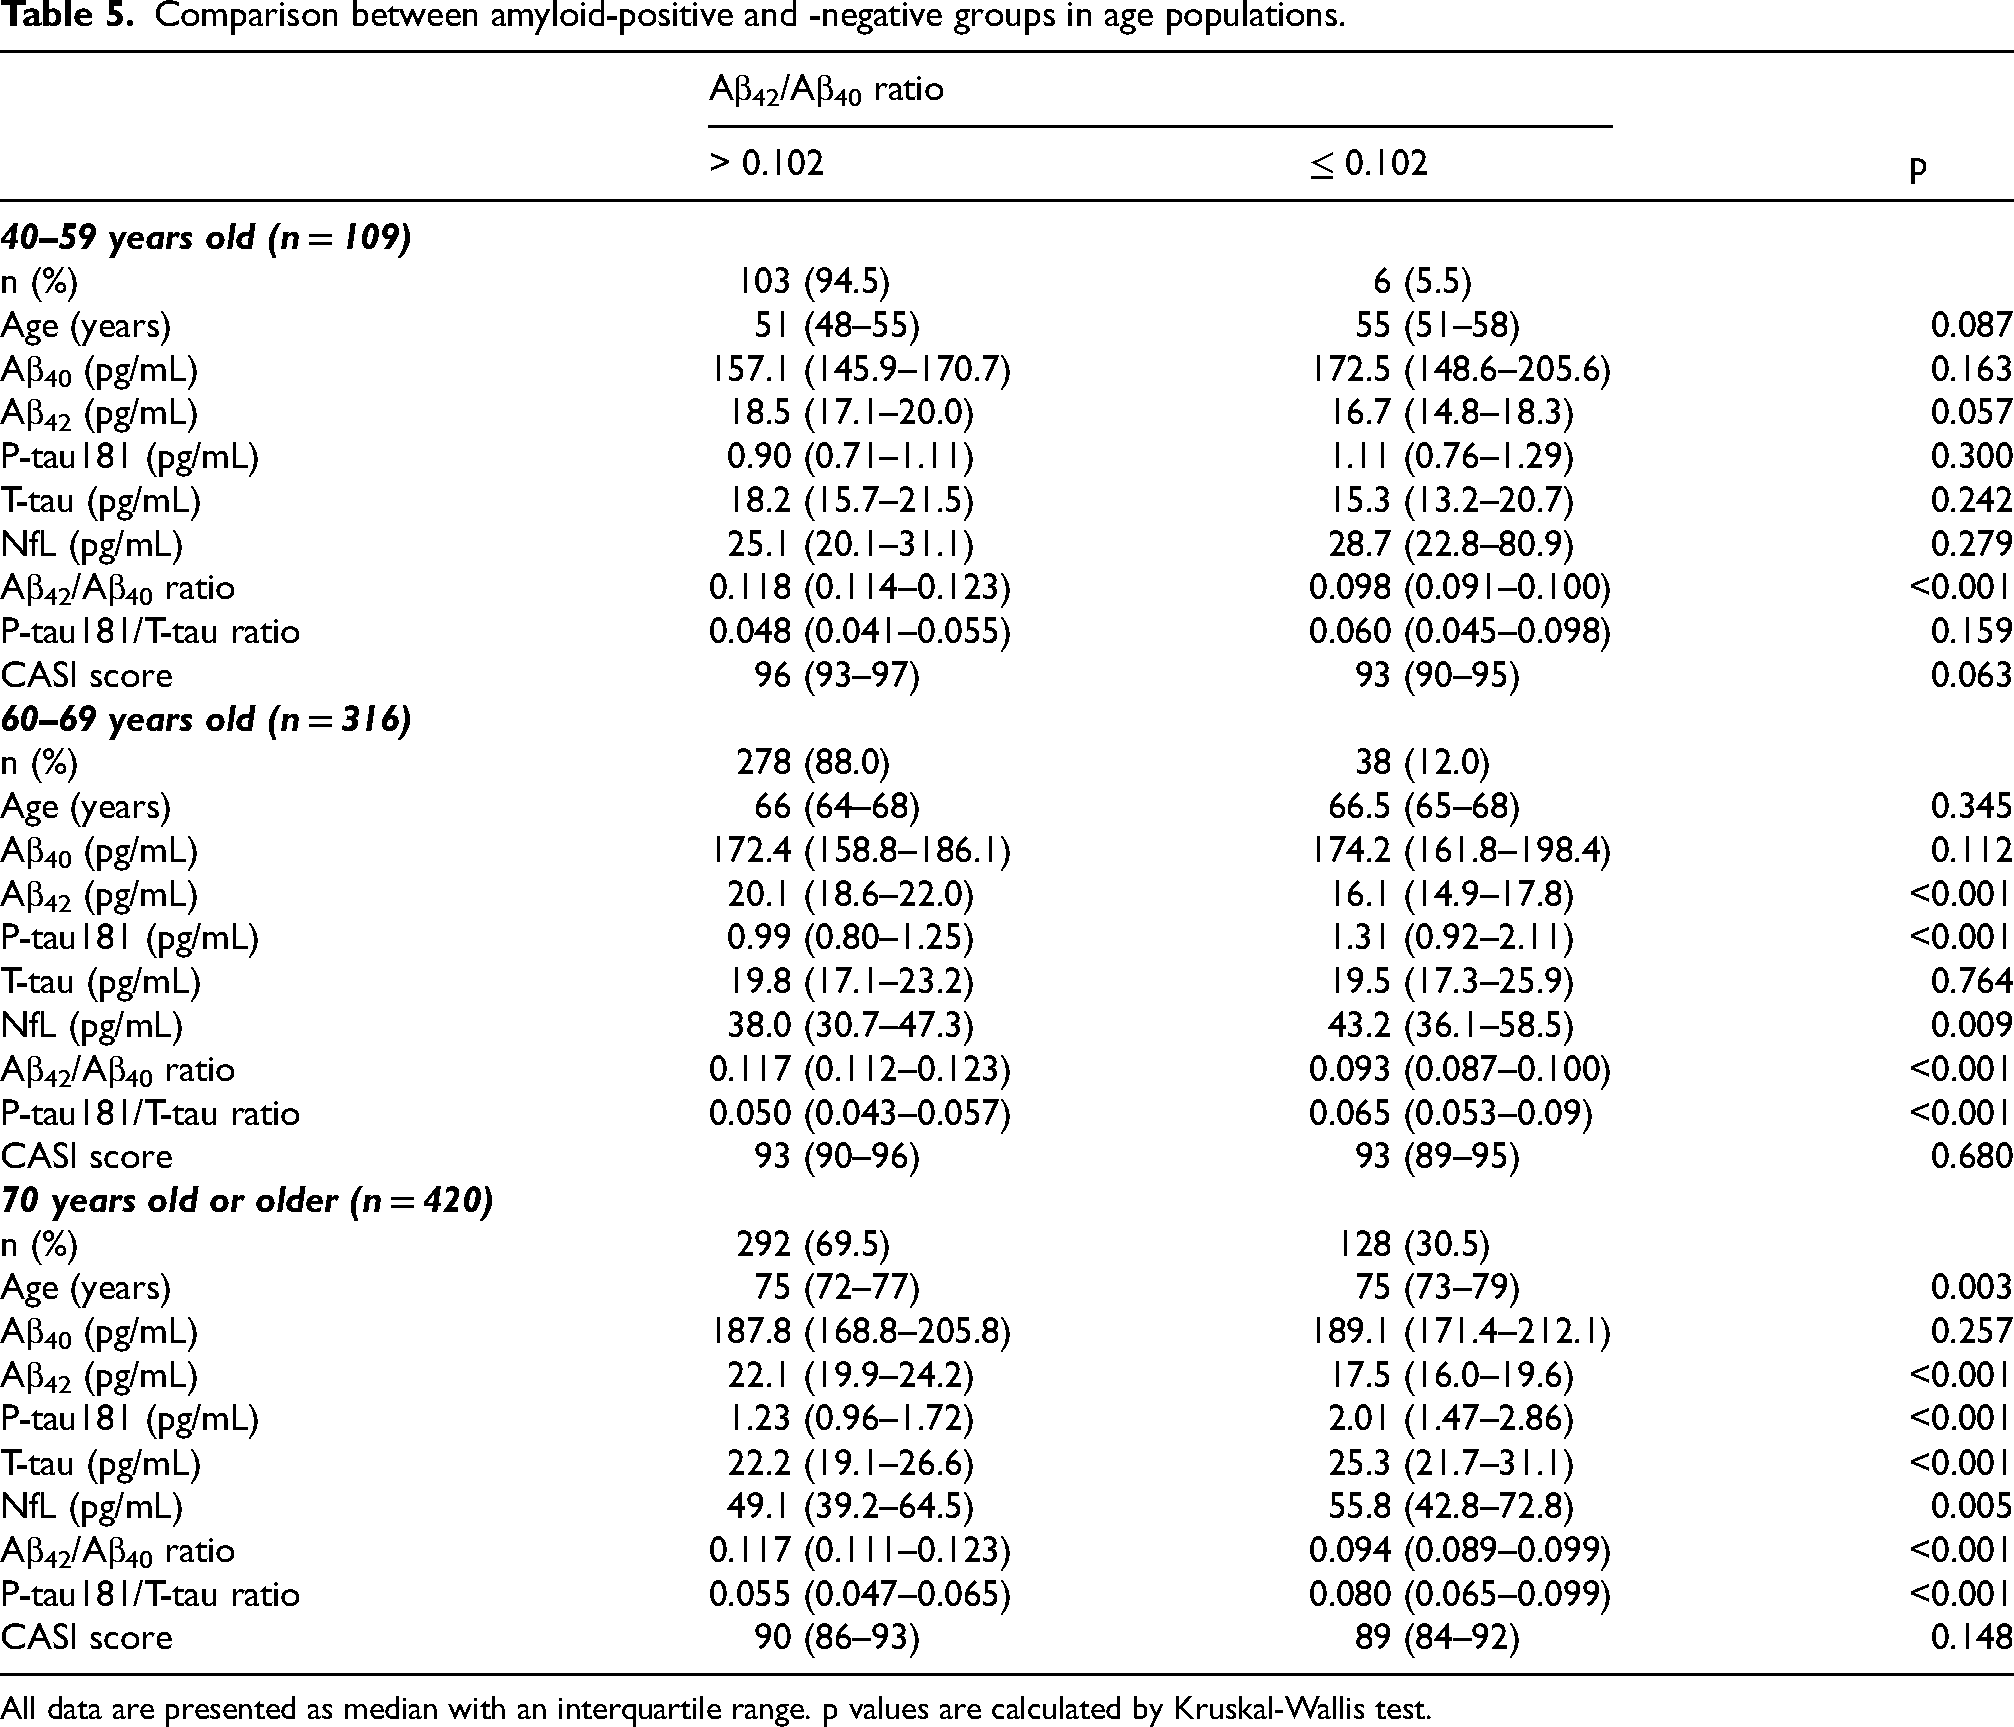
All data are presented as median with an interquartile range. p values are calculated by Kruskal-Wallis test.
Associations between plasma AD biomarkers and preclinical cognitive impairment
Individual CASI scores of 792 participants ranged from 63 to 100 with a mean and SD of 90.8 and 5.9, respectively. In unadjusted linear regression analyses, all AD biomarker concentrations and ratios were significantly associated with CASI scores (Table 6). However, only higher P-tau181 (β = –0.073, 95%CI: −0.142 to −0.003) and T-tau (β = –0.089, 95%CI: −0.160 to −0.017) concentrations were associated with lower CASI scores (cognitive impairment) after adjustment for age, education, smoking status, drinking status, eGFR, BMI, hemoglobin, LDL cholesterol, diabetes, hypertension, history of coronary heart disease and stroke (Model 5). Similar results were obtained after excluding cases showing very low eGFR (less than 45 mL/min/1.73m2) (Supplemental Table 8) or using logistic regression models (Supplemental Table 9).
Association of plasma AD biomarkers with CASI score (792 men, Shiga, Japan).

Model 1 was adjusted for age and education (years). Model 2 was adjusted for Model 1 + smoking status (current, past, never), drinking status (current, past, never). Model 3 was adjusted for Model 2 + eGFR. Model 4 was adjusted for Model 3 + BMI, hemoglobin, LDL cholesterol. Model 5 was adjusted for Model 4 + diabetes (yes/no), hypertension (yes/no), coronary heart disease (yes/no), stroke (yes/no). CI indicates confidence interval.
Discussion
In this study, we measured biomarkers for brain AD pathology, including Aβ deposition, NFT formation, and neurodegeneration, in plasma samples from participants of the SESSA (845 men aged 40 years and over). Plasma concentrations of Aβ40, Aβ42, T-tau, P-tau181, and NfL as well as P-tau181/T-tau rose with age, whereas Aβ42/Aβ40 decreased with age as expected. However, biomarkers showing age-dependent increases similarly rose in response to renal impairment as measured by (lower) eGFR, while Aβ42/Aβ40 was unrelated to eGFR. Plasma P-tau181 and T-tau were associated with subclinical cognitive impairment, and this association remained significant even after adjusting for several other variables. The amyloid-positive population among older participants (as defined by plasma Aβ42/Aβ40 ratio ≤ 0.102) exhibited higher P-tau181, P-tau181/T-tau, and NfL values than the A– population among older age groups, while cognitive function did not differ. Collectively, these findings identify renal dysfunction as a major confounding factor influencing the association between AD biomarker values and disease status. Further, these findings confirm that P-tau181, P-tau181/T-tau ratio, and NfL can reliably reflect ongoing AD pathology in the absence of clinical symptoms among the general population.
The prevalence of AD increases exponentially after age 65. 24 Accordingly, age is recognized as a strong nongenetic risk factor for AD. 25 Previous studies using PET imaging or CSF biomarker measurements have demonstrated a high prevalence of cerebral Aβ deposition among older individuals with or without cognitive impairment, 26 consistent with the current findings of age-associated changes in plasma biomarkers demonstrated to predict Aβ deposition, NFT formation, and (or) neurodegeneration in the brain of subclinical patients (including reduced Aβ42/Aβ40 ratio, elevated P-tau181/T-tau ratio, and higher concentrations of T-tau, P-tau181, and NfL).
Previous studies have documented associations between renal dysfunction and early-stage dementia, including AD-related and vascular dementia, and AD biomarker values in peripheral blood.14,27–29 These associations may be explained by either a direct contribution of renal impairment to AD pathogenesis or by accumulation of biomarkers in peripheral blood independent of disease progression due to reduced renal clearance. Our results showing increases in most AD markers among individuals with low eGFR but no reduction in Aβ42/Aβ40 ratio and no clinical AD symptoms are suggestive of biomarker accumulation from renal dysfunction. Consistent with this finding, a previous report found inverse correlations of eGFR with both plasma Aβ42 and Aβ40, but no correlation with Aβ42/Aβ40 ratio in AD patients. 30 Another prospective population-based study also reported that eGFR less than 60 mL/min/1.73 m2 was associated with increased NfL and P-tau181 concentrations but not with a higher risk of AD and other dementias after adjusting for age and sex. 27 These results further support our contention that eGFR impairment reduces the clearance of plasma AD biomarkers but does not directly contribute to brain amyloid deposition and clinical progression.
A previous study in mice concluded that the liver was the primary organ responsible for the clearance of intravenously injected (peripheral) Aβ, with a half-life of only 2.5–3.0 min, and that hepatocyte-captured Aβ was preferentially catabolized and excreted into the bile. 31 In contrast, AD biomarker concentrations in our human plasma samples were not associated with plasma ALT and γ-GTP activities, which are blood markers of hepatocyte damage and liver dysfunction. This discrepancy between human and murine results may be explained by species difference in liver function. Nonetheless, the clearance routes for AD-associated proteins requires further investigation.
Our results indicate brain amyloid deposition in 12.0% of Japanese men aged 60–69 years and in 30.5% of older than 70 years, which is comparable to the findings of previous studies using amyloid PET imaging.32–34 A blood screening study for preclinical AD also found that 18.6% of the population was brain amyloid-positive by age 70. 35 Cognitively normal, amyloid PET-negative individuals with reduced plasma Aβ42/Aβ40 ratio had a 15-fold higher risk of converting to amyloid PET-positive. 16 The older preclinical A+ population in the current study cohort exhibited higher plasma P-tau181, P-tau181/T-tau ratio, and NfL but showed no differences in CASI score compared to the older A– population. Taken together, these observations suggest that a reduced Aβ42/Aβ40 ratio and elevated plasma P-tau or NfL precede the conversion from amyloid PET-negative to positive, resulting in cognitive impairment, as evidenced by lower CASI scores.16,36,37
This study has several limitations. First, the cross-sectional design did not permit evaluation of biomarker predictive efficacy. Second, only Japanese men were included, limiting generalizability to women and people of other races. Third, in this study, participants were not diagnosed with mild cognitive impairment or dementia using any clinical criteria other than CASI. Fourth, we did not evaluate P-tau217, nor did we stratify participants by P-tau181 or P-tau217 levels. Fifth, a comprehensive assessment of comorbidities was not performed.
In conclusion, this study of Japanese men suggests that renal glomerular filtration efficiency can influence plasma AD biomarker concentrations independently of cognitive impairment severity. However, we also found that higher plasma P-tau181 and T-tau levels were associated with lower cognitive performance in the general population even after controlling for several other variables, including eGFR. In addition, our results suggest that the plasma Aβ42/Aβ40 ratio can reflect asymptomatic brain amyloid-positive status with or without concomitant tau pathology and neurodegeneration.
Supplemental Material
sj-docx-1-alz-10.1177_13872877251409337 - Supplemental material for Plasma biomarkers for Alzheimer's disease in middle-aged and older Japanese men: A population-based cross-sectional study
Supplemental material, sj-docx-1-alz-10.1177_13872877251409337 for Plasma biomarkers for Alzheimer's disease in middle-aged and older Japanese men: A population-based cross-sectional study by Masaki Nakano, Keiko Kondo, Kengo Ishiki, Mohammad Moniruzzaman, Yachiyo Mitsuishi, Aya Kadota, Shunsuke Watanabe, Kazuto Yamashita, Masahiro Miura, Shigeki Iwanaga, Toshiyuki Sato, Masaki Nishimura and Katsuyuki Miura in Journal of Alzheimer's Disease
Footnotes
Acknowledgements
We thank the SESSA participants and the SESSA research group for their collaboration in data collection and management. The SESSA research group members are as follows: Principal investigator: Katsuyuki Miura. Past-principal investigator: Hirotsugu Ueshima (Shiga University of Medical Science). Research members: Yoshihisa Nakagawa, Yasutaka Nakano, Emiko Ogawa, Shinji Kume, Katsutaro Morino, Itsuko Miyazawa, Yoshiyuki Watanabe, Kazuhiko Nozaki, Kazumichi Yoshida, Satoshi Shitara, Ikuo Tooyama, Akihiko Shiino, Masaki Nishimura, Shigeki Banba, Susumu Kageyama, Hisakazu Ogita, Naomi Miyamatsu, Yasuyuki, Nakamura, Yuichiro Yano, Aya Kadota, Keiko Kondo, Sayuki Torii, Takashi Kadowaki, Sayaka Kadowaki, Takahiro Ito, Ayako Kunimura, Hiroyoshi Segawa, Yukiko Okami, Takeshi Shibukawa, Azusa Shima, Mizuki Ohashi, Megumi Kawashima, Yuuichi Sawayama, Yousuke Higo, Maya Oki, Kaori Kitaoka (Shiga University of Medical Science), Akira Fujiyoshi, Aya Higashiyama (Wakayama Medical University), Tomonori Okamura, Naoko Miyagawa (Keio University), Tatsuya Sawamura (Shinshu University), Yasuharu Tabara (Shizuoka Graduate University of Public Health), Akira Sekikawa, Emma JM Barinas-Mitchell (University of Pittsburgh), Daniel Edmundowicz (Temple University), Takayoshi Ohkubo (Teikyo University), Atsushi Hozawa (Tohoku University), Yoshitaka Murakami (Toho University), Nagako Okuda (Kyoto Prefectural University), Hisatomi Arima (Fukuoka University), Yoshikuni Kita (Tsuruga Nursing University), Takashi Hisamatsu (Okayama University), Masahiko Yanagita, (Doshisha University), Seiko Ohno (National Cerebral and Cardiovascular Center), Naoyuki Takashima (Kyoto Prefectural University of Medicine), Takashi Yamamoto (Kohka Public Hospital), Koichiro Azuma (Nerima General Hospital), Yoshino Saito (Aino University).
ORCID iDs

Ethical considerations
This study was carried out in accordance with the Declaration of Helsinki, and the study protocol was approved by the Institutional Review Board of the Shiga University of Medical Science, approval number G2008-061.
Consent to participate
All SESSA participants provided written informed consent before sample collection.
Consent for publication
Not applicable
Author contribution(s)
Funding
The authors disclosed receipt of the following financial support for the research, authorship, and/or publication of this article: This study was supported by a collaborative fund from the Sysmex Corporation. The SESSA was supported by JSPS KAKENHI Grant Numbers JP13307016, JP17209023, JP21249043, JP23249036, JP25253046, JP15H02528, JP18H04074, and MEXT KAKENHI Grant Number JP22H00493.
Declaration of conflicting interests
The authors declare the following financial interests/personal relationships that may be considered as potential competing interests: Kengo Ishiki, Shunsuke Watanabe, Kazuto Yamashita, Masahiro Miura, Shigeki Iwanaga, and Toshiyuki Sato were employees of Sysmex Corporation. Katsuyuki Miura reports that financial support was provided by the Japan Society for the Promotion of Science.
Data availability statement
Data are provided within the manuscript or supplementary information files. The data are not publicly available due to privacy or ethical restrictions.
Supplemental material
Supplemental material for this article is available online.
References
Supplementary Material
Please find the following supplemental material available below.
For Open Access articles published under a Creative Commons License, all supplemental material carries the same license as the article it is associated with.
For non-Open Access articles published, all supplemental material carries a non-exclusive license, and permission requests for re-use of supplemental material or any part of supplemental material shall be sent directly to the copyright owner as specified in the copyright notice associated with the article.
