



Abstract
Background
Alzheimer's disease (AD) is a progressive neurodegenerative disorder with poorly understood molecular mechanisms and limited early detection biomarkers.
Objective
To identify genes causally associated with AD risk using reverse transcriptome-wide Mendelian randomization (revTWMR) and bulk RNA-sequencing (RNA-seq).
Methods
We analyzed publicly available RNA-seq data from peripheral blood samples of patients with clinically diagnosed AD and cognitively normal controls, obtained from the GEO database. Differential expression analysis was performed to identify differentially expressed genes (DEGs). We used revTWMR by integrating genome-wide association study (GWAS) summary statistics with expression quantitative trait loci (eQTL) data to infer causal relationships between gene expression and AD risk.
Results
Using RNA-seq data from peripheral blood samples of AD patients and cognitively normal controls, we identified 126 DEGs. Through revTWMR analysis, we narrowed down to 91 genes with significant causal associations with AD, and further prioritized 5 genes with strong causal effects (|α| ≥ 0.8). Among these, PSMA6, CD19, and CMTM6 have potential roles in AD pathogenesis and may serve as promising blood-based biomarkers for early detection and therapeutic targeting.
Conclusions
Our findings highlight the utility of revTWMR in identifying causally relevant genes in AD and suggest several blood-based candidate biomarkers for early detection and therapeutic development. This integrative approach provides novel insights into the molecular underpinnings of AD.
Introduction
Alzheimer's disease (AD) is a progressive neurodegenerative disorder and the leading cause of dementia globally, posing an escalating public health challenge in aging populations. 1
Despite extensive research, the molecular mechanisms underpinning the onset and progression of AD remain incompletely elucidated. Early diagnosis is hampered by the lack of reliable and non-invasive biomarkers, and current therapeutic options provide only symptomatic relief without modifying disease trajectory. This highlights an urgent need for innovative strategies to uncover early diagnostic markers and actionable therapeutic targets.2,3
In recent years, transcriptome-wide approaches, particularly RNA-seq, have gained traction in identifying gene expression alterations in peripheral blood that may serve as potential biomarkers for AD. Blood-based biomarkers are especially appealing due to the minimally invasive nature of sample collection and the feasibility of large-scale population screening.4,5 However, conventional differential expression (DE) analyses remain correlational, failing to distinguish whether transcriptional changes are causal drivers of disease or secondary consequences of its pathogenesis.
To address this limitation, we employed revTWMR-an integrative framework that leverages GWAS summary statistics and expression quantitative trait loci (trans-eQTL) data to infer the causal impact of gene expression on complex traits. By using genetic variants as instrumental variables, revTWMR estimates the direction and magnitude of causal effects, thereby mitigating biases from confounding and reverse causation. 6 Compared with traditional TWMR, revTWMR adopts a reverse causal design-treating the phenotype as the exposure and gene expression as the outcome-which enables the identification of expression changes that are consequences rather than causes of disease. This helps to disentangle disease-driven transcriptional alterations from true causal effects, thereby improving the biological interpretability of transcriptomic data.
In this study, we integrated large—scale GWAS summary statistics for AD with whole-blood eQTL data from the eQTLGen Consortium, comparing individuals with AD to cognitively normal controls.7,8 Through revTWMR, we identified peripheral blood genes whose expression levels are not merely associated with AD, but may be causally implicated in disease susceptibility. These findings shed light on upstream molecular mechanisms contributing to AD pathogenesis and highlight promising candidates for further investigation as blood-based biomarkers or therapeutic targets.
By disentangling causal expression changes from disease-driven transcriptional responses, revTWMR enhances the interpretability of transcriptomic data in complex disorders such as AD. This approach holds promise for accelerating the discovery of early diagnostic markers and informing therapeutic development aimed at disease modification.
Methods
Data collection
Bulk RNA-sequencing data were obtained from the Gene Expression Omnibus (GEO) under accession number GSE140829, which includes peripheral blood gene expression profiles from individuals diagnosed with AD and cognitively normal controls (CON). 9
For reverse Mendelian randomization analysis, summary-level GWAS data for AD were retrieved from the GWAS Catalog (accession ID GCST90027158), based on large-scale meta- analyses. In parallel, trans-eQTL data were obtained from the eQTLGen Consortium, which provides trans-eQTL associations derived from whole blood in a large cohort of individuals of European ancestry.
Differential gene expression analysis
Bulk RNA-seq data of peripheral blood samples from AD patients and cognitively normal controls were downloaded from the Gene Expression Omnibus. The dataset comprised 198 AD patients and 229 cognitively normal controls. Detailed sample characteristics, including age, sex, APOE genotype, and batch information, are provided in Supplemental Table 2. Raw read counts were normalized using log2 transformation to reduce heteroscedasticity and improve comparability between samples. Differential expression analysis was conducted using the limma package, which fits linear models to each gene and applies empirical Bayes moderation to obtain reliable estimates in large-scale expression datasets. Differential gene expression analysis was performed using the limma package in R (v4.2.0). 10 To address potential confounding factors identified in our cohort characterization, we fitted a linear model adjusting for key covariates: expression ∼ Age + Sex + Batch + Diagnosis, where Diagnosis represents AD status (AD versus control). Age (numeric), Sex (categorical: male/female), and Batch (categorical: sequencing batch) were included as covariates based on their potential to confound gene expression signals. Empirical Bayes moderation was applied to obtain more stable variance estimates.
Comparisons were conducted between AD patients and control individuals. Genes were considered differentially expressed based on a nominal p-value < 0.05 and an absolute |log2FC| ≥ 0.1. In this step, we deliberately did not apply multiple testing correction to include potentially relevant genes for causal prioritization in subsequent analyses. The resulting list of DEGs was used as input for reverse transcriptome-wide Mendelian randomization.
Reverse transcriptome-wide Mendelian randomization
To infer the potential causal effects of gene expression on AD, we employed revTWMR. This approach aims to determine whether genetically regulated gene expression levels are influenced by disease status, in contrast to conventional TWMR which assesses the effect of gene expression on disease risk. In revTWMR, disease-associated genetic variants identified from GWAS are used as instrumental variables, while gene expression serves as the outcome. In our analysis, revTWMR was applied to differentially expressed genes (DEGs) identified from bulk RNA-seq (p < 0.05, |log2FC| ≥ 0.1), integrating trans-eQTL data from the eQTLGen Consortium with AD GWAS summary statistics. We prioritized genes that demonstrated significant genetically predicted expression changes attributable to AD liability (revTWMR p < 0.05).
To highlight genes with robust associations, we further filtered for those with a large estimated causal effect size (|α| ≥ 0.8), representing genes whose genetically imputed expression is strongly modulated by AD-associated variants. These genes were nominated as candidate systemic transcriptional biomarkers and carried forward for downstream biological interpretation and validation.
Area under the curve (AUC) analysis
To assess the predictive ability of candidate genes identified by revTWMR, we performed receiver operating characteristic (ROC) curve analysis based on peripheral blood gene expression data. For each gene, a univariate logistic regression model was constructed using gene expression as the predictor and disease status (AD versus control) as the outcome. Predicted probabilities from the logistic models were used to generate ROC curves and calculate the AUC values. Additionally, a multivariate logistic regression model incorporating all candidate genes was fitted to evaluate the combined predictive power. ROC curves and AUCs for the multivariate model were similarly computed based on the predicted probabilities. Statistical significance of AUC values was assessed using permutation testing (1000 iterations) with random shuffling of disease labels. The p-value represents the proportion of permutations where the permuted AUC exceeded the observed AUC. analysis using their expression levels in all samples. Pairwise Pearson correlation coefficients were calculated to quantify the strength and direction of linear associations between genes. The correlation matrix was visualized using a heatmap with hierarchical clustering to identify potential co-expression patterns. Statistical significance of correlations was assessed using t-tests with Bonferroni correction for multiple comparisons. All correlation analyses were conducted using the cor function in R, and visualization was performed using the pheatmap package. All analyses were performed using pROC package (R. 1.18.4).
Results
Identification of differentially expressed genes in AD blood transcriptome
The analysis included peripheral blood transcriptome data from 198 AD patients and 229 cognitively normal controls from the GSE140829 dataset. Baseline demographic and clinical characteristics are summarized in Supplemental Table 1. The AD and control groups were well-matched for age (AD: 72.92 ± 7.06 years versus Control: 73.51 ± 6.20 years, p = 0.365) and sex distribution (AD: 49.0% male versus Control: 43.7% male, p = 0.316). As expected for an AD cohort, APOE ε4 carrier status differed significantly between groups (p < 0.001), with higher ε4 frequency in AD patients. Technical batch distribution also showed significant differences (p = 0.003), necessitating adjustment in subsequent analyses (Supplemental Table 2). To identify genes associated with AD while controlling for potential confounders, we performed differential expression analysis using the limma package (Figure 1). We implemented a linear model adjusting for key covariates identified in our cohort characterization. In the initial unadjusted analysis, we identified 152 DEGs meeting our threshold of nominal p < 0.05 and |log2FC| ≥ 0.1, comprising 86 upregulated and 66 downregulated genes in AD versus controls (Supplemental Table 3). After comprehensive covariate adjustment, the number of DEGs increased to 221, with 125 upregulated and 96 downregulated genes (Supplemental Table 4).

Differential gene volcano maps for CON and AD groups (unadjusted versus adjusted).
Causal inference of DEGs via revTWMR analysis
To explore whether the observed expression changes in these DEGs were causally influenced by AD status, we conducted revTWMR analysis. This approach allows the estimation of the causal effect of AD on gene expression, leveraging summary statistics from GWAS and trans- eQTL datasets.
We used GWAS summary data from GCST90027158 to derive instrumental variables for AD and trans-eQTL data from eQTLGen Consortium as the expression reference. Of the 126 DEGs identified in bulk RNA-seq, 91 genes were retained after revTWMR analysis based on the following criteria: causal P-value < 0.05 and heterogeneity Phet ≥ 0.05, indicating significant and reliable causal effects of AD on gene expression with minimal heterogeneity among instrumental variables.
These 91 genes represent a subset whose altered expression is likely a downstream consequence of AD pathology, rather than coincidental or confounded associations. Among the 91 genes retained, we further prioritized those with strong directional causal effects based on the magnitude of the estimated alpha. A total of 5 genes, PSMA6, CD19, CMTM6, CD79B, and ST6GALNAC4 exhibited an absolute alpha value (|α|) ≥ 0.8, suggesting a robust causal influence of AD on their gene expression (Figure 2). Among them, PSMA6 and CMTM6 were upregulated, while CD19, CD79B, and ST6GALNAC4 were downregulated in response to AD- associated genetic variants. These genes represent promising candidates as genetically influenced blood biomarkers of AD and warrant further investigation (Supplemental Tables 5–7).
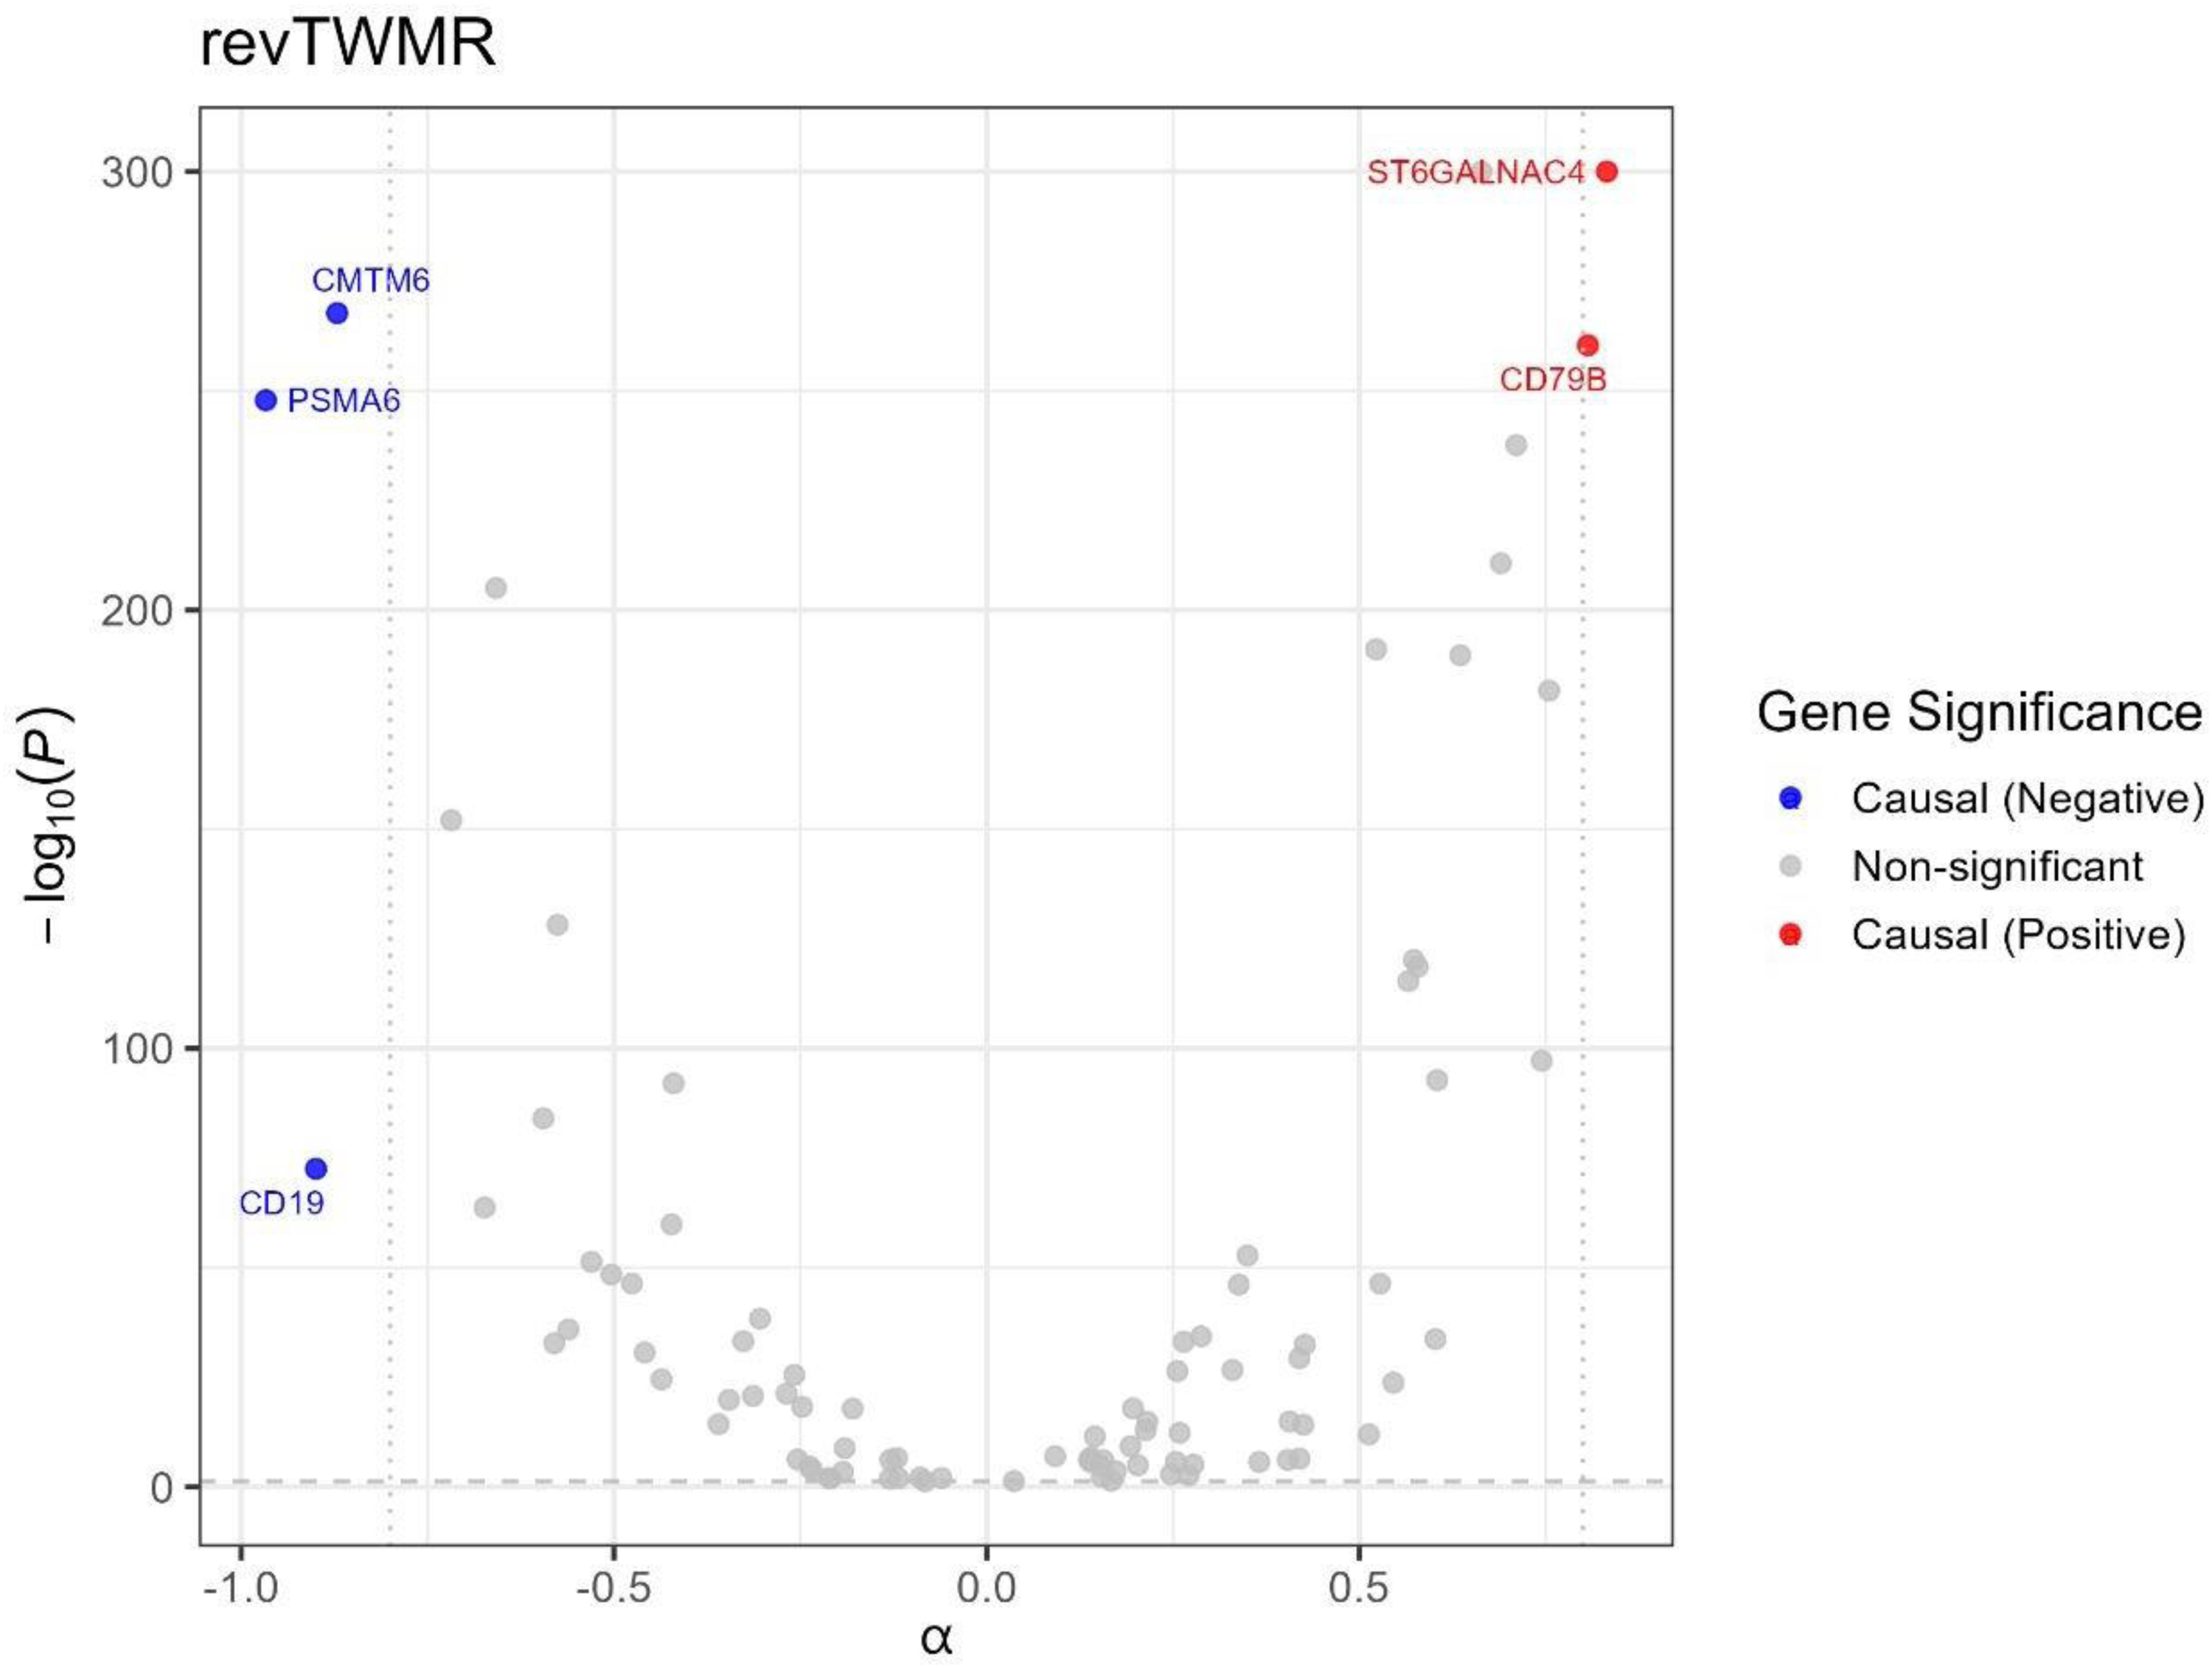
The result of revTWMR.
AUC analysis
ROC curve analysis demonstrated the diagnostic performance of candidate gene expression profiles in discriminating AD patients from healthy controls (Figure 3). Individual gene analysis revealed that CD79B exhibited the strongest predictive ability with an AUC of 0.589 (p < 0.001), followed by ST6GALNAC4 (AUC = 0.580, p = 0.004) and CD19 (AUC = 0.574, p = 0.011). CMTM6 showed moderate discrimination power (AUC = 0.535, p = 0.211), while PSMA6 performed at near-chance level (AUC = 0.521, p = 0.412). The multivariate model combining all five candidate genes achieved enhanced diagnostic accuracy with an AUC of 0.612 (p < 0.001), representing a statistically significant improvement over individual gene predictor (Supplemental Table 8). Permutation testing with 1000 iterations confirmed the robustness of these findings. These results indicate that peripheral blood expression levels of specific genes, particularly when used in combination, hold promise as potential biomarkers for AD diagnosis, with the multigene panel offering superior performance compared to single-gene approaches.
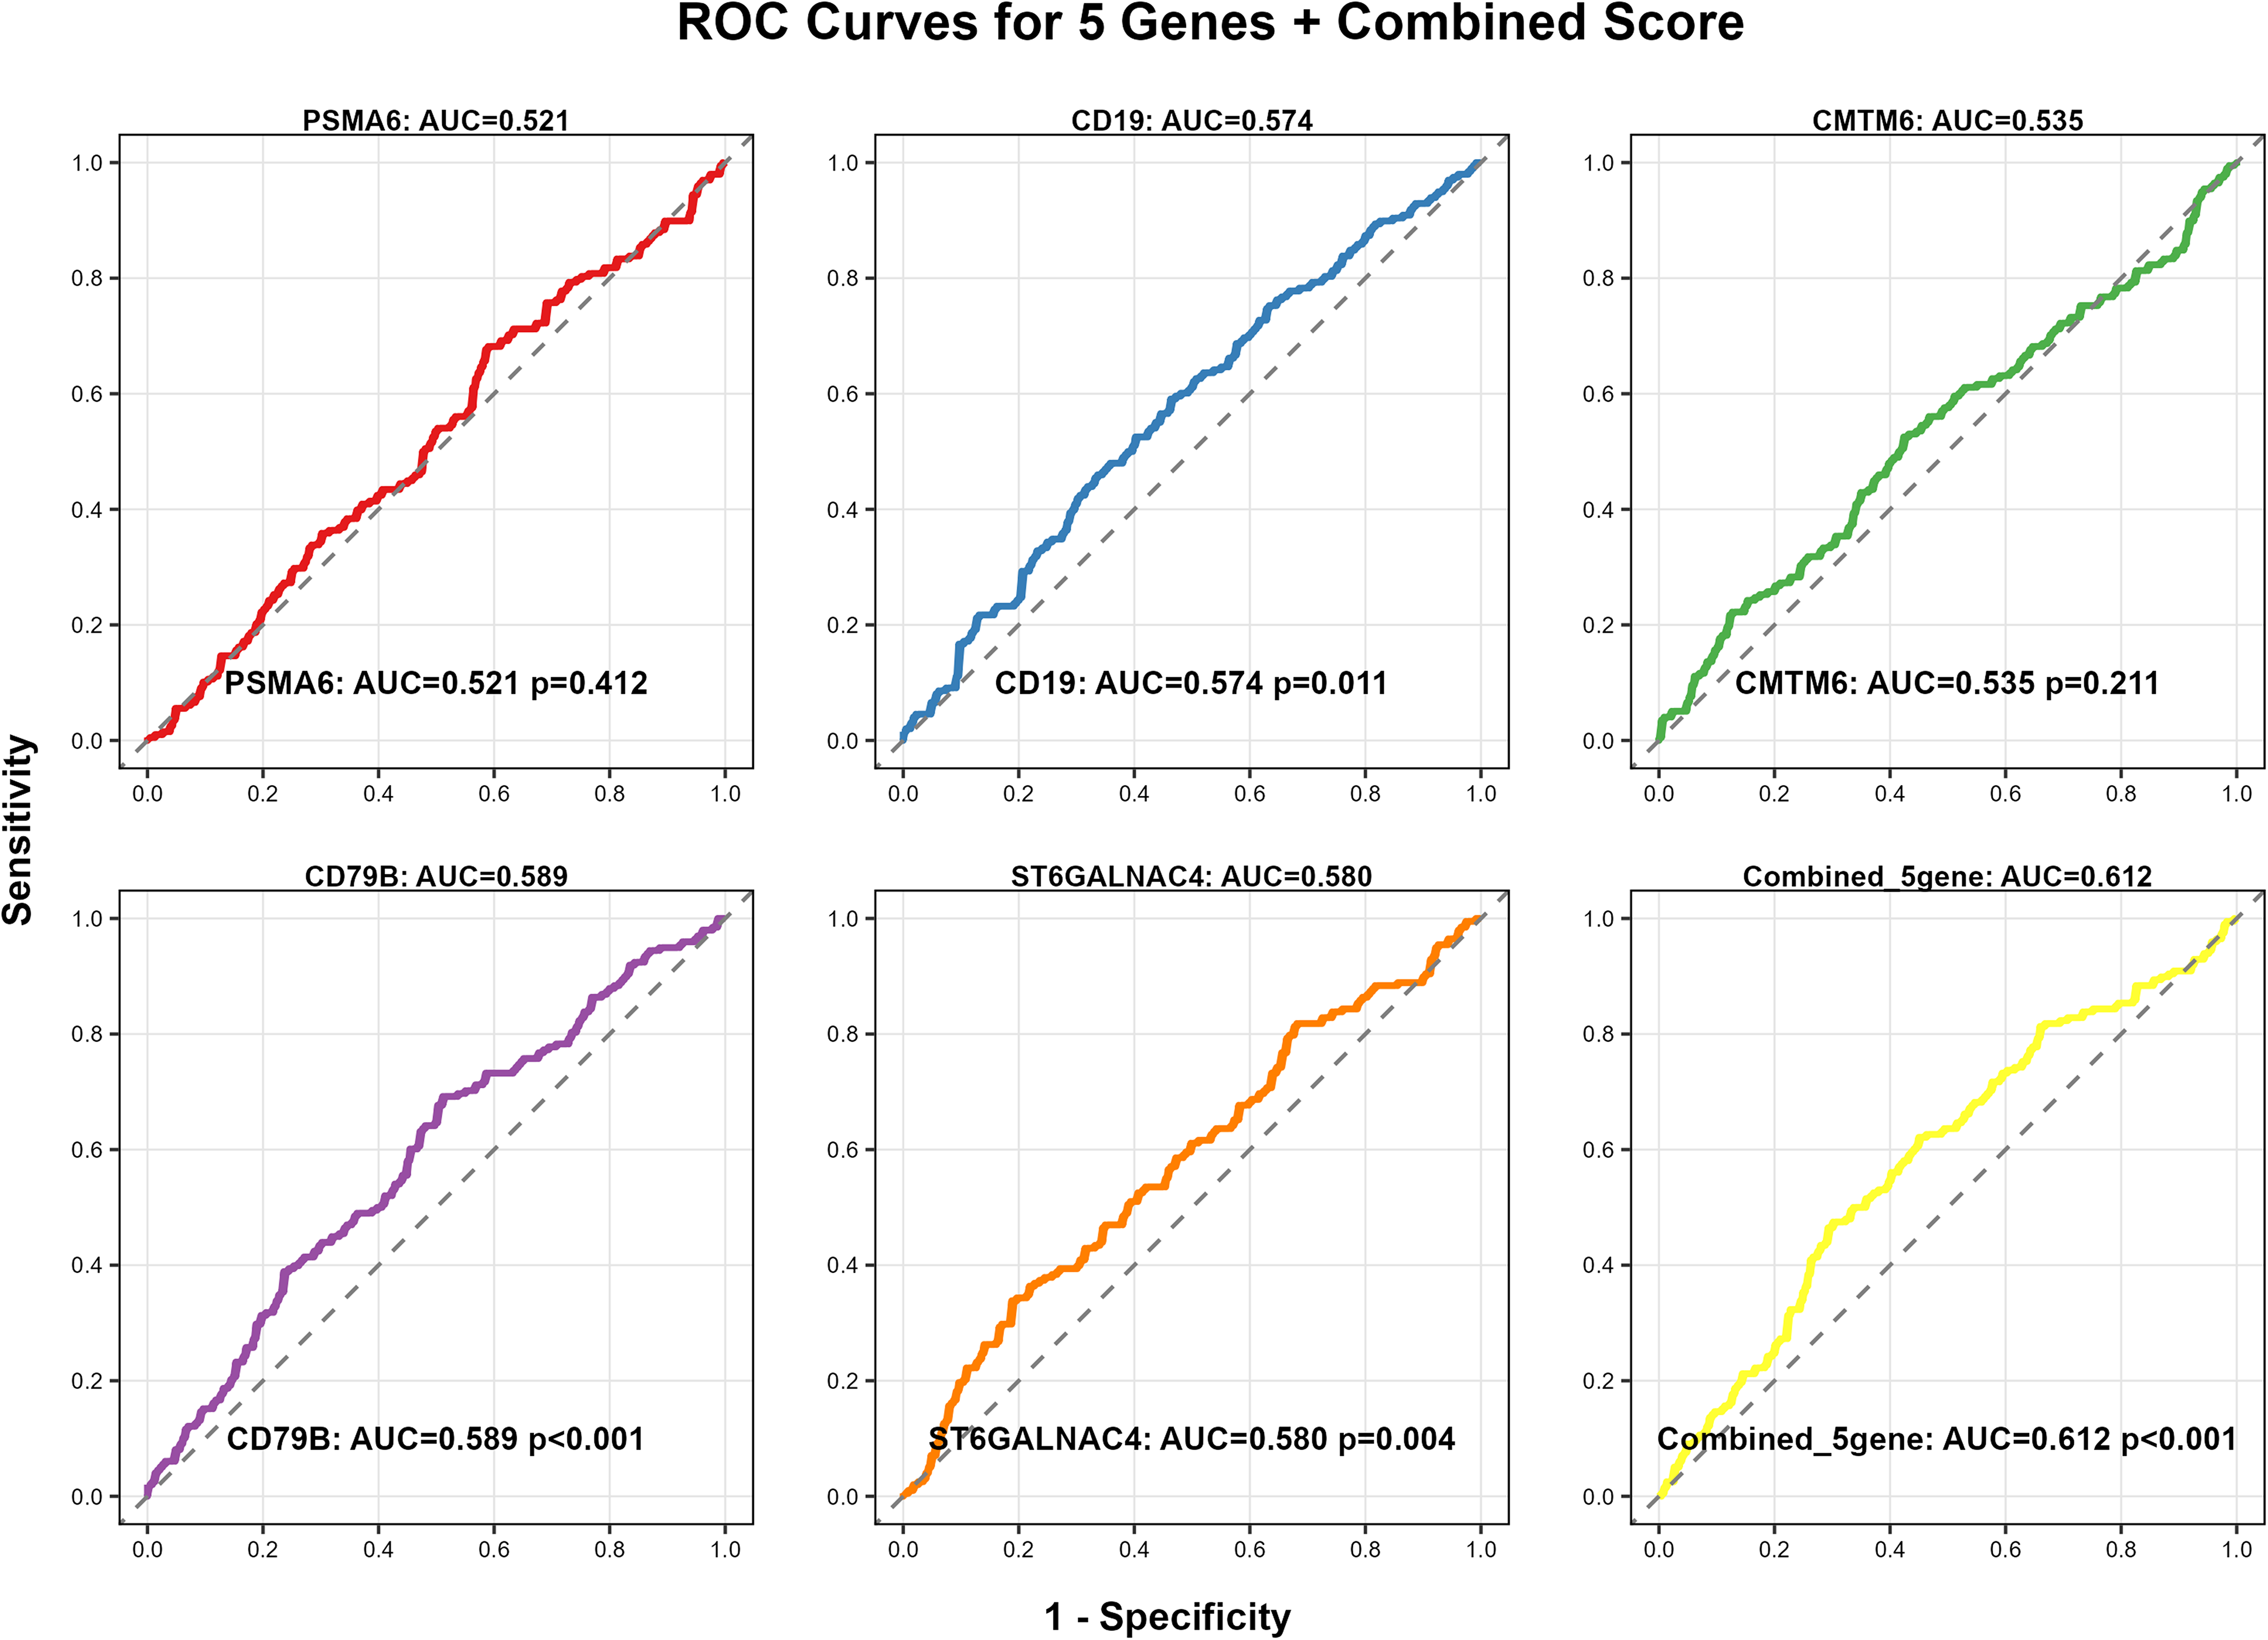
AUC analysis of 5 genes.
Correlation analysis
Correlation analysis among the five candidate genes revealed distinct expression relationships in peripheral blood samples (Figure 4). The strongest association was observed between CD19 and CD79B, which showed a high positive correlation (r = 0.91), suggesting potential co-regulation or functional linkage in B-cell related pathways. Moderate positive correlation was found between PSMA6 and CMTM6 (r = 0.46), while moderate negative correlations were detected between CMTM6 and ST6GALNAC4 (r = −0.45) and between PSMA6 and ST6GALNAC4 (r = −0.36).
Weaker correlations were observed for other gene pairs, with CD19 showing negative correlations with CMTM6 (r = −0.26) and ST6GALNAC4 (r = −0.29), and CD79B exhibiting minimal correlation with ST6GALNAC4 (r = −0.03). The correlation structure indicates that while CD19 and CD79B form a highly correlated pair, the other genes demonstrate relatively independent expression patterns.
These findings suggest that the candidate genes capture both shared and distinct biological processes, which may contribute to the enhanced diagnostic performance of the combined model by providing complementary information for AD classification.
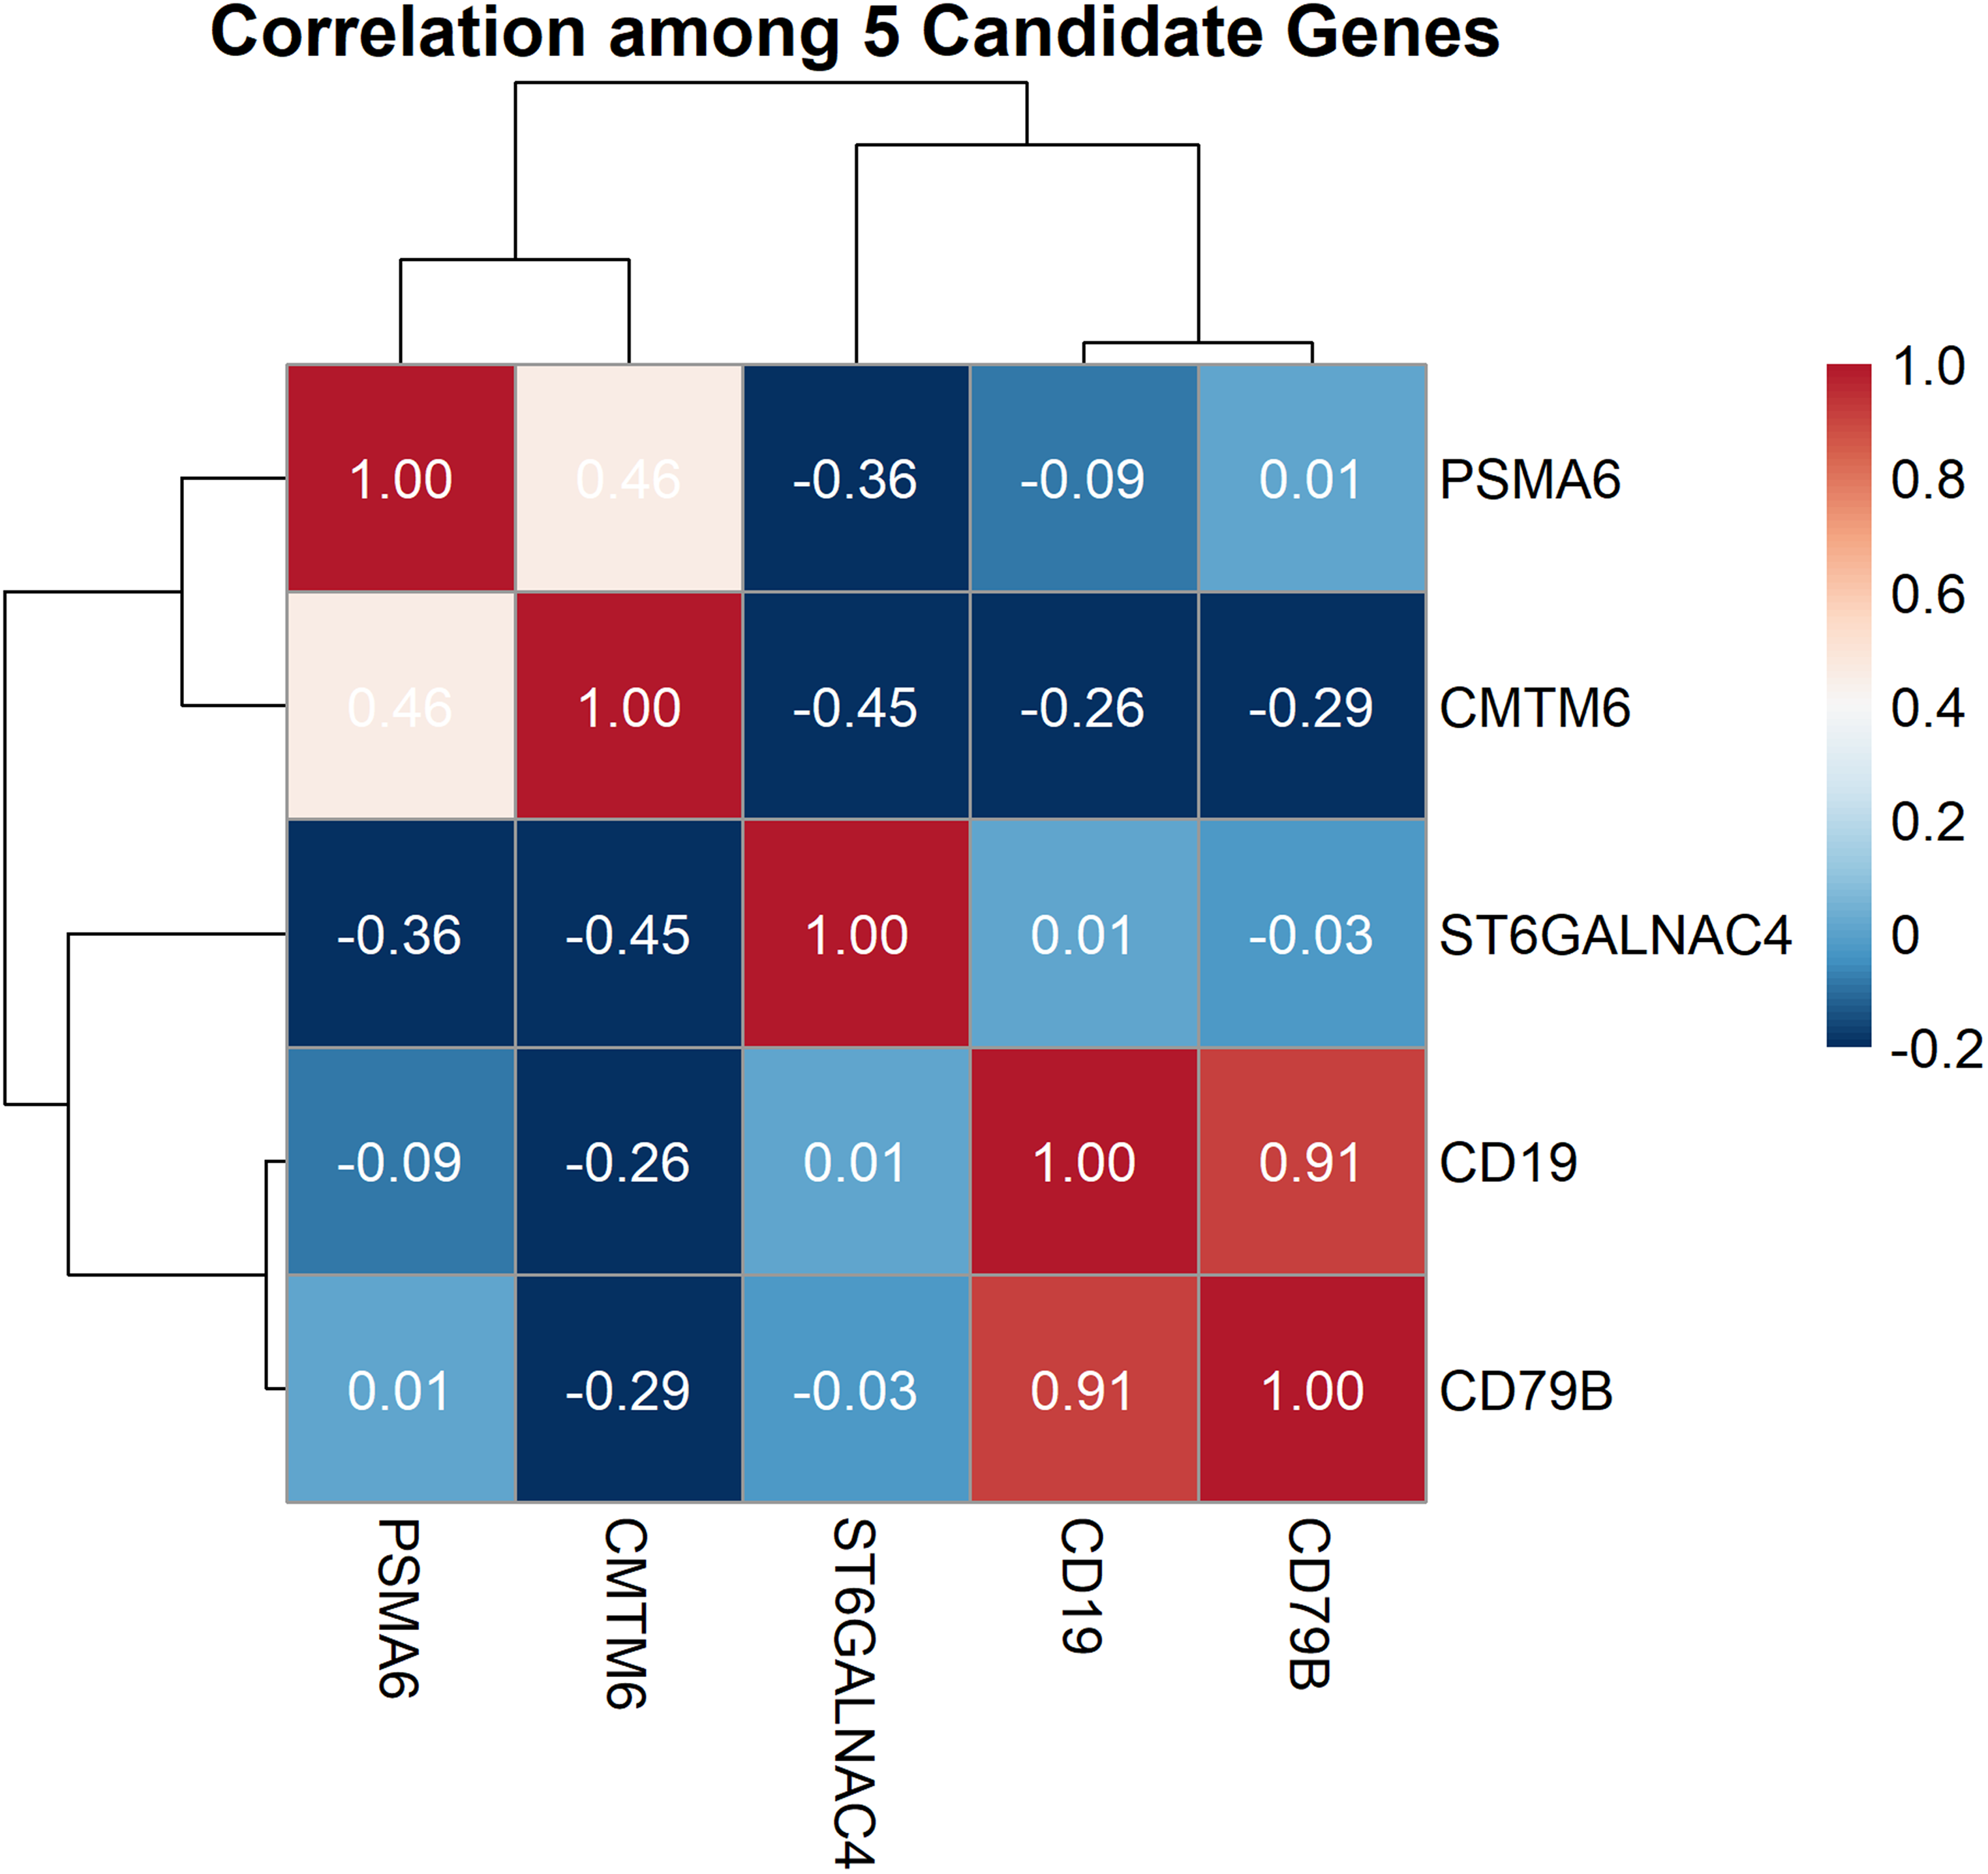
Correlation analysis of 5 genes.
Discussion
To systematically explore peripheral blood gene expression changes potentially linked to the genetic liability of AD, we applied revTWMR. Unlike conventional TWMR or Two-sample Mendelian randomization, which tests whether genetically predicted gene expression contributes to disease risk, revTWMR inverts the directionality-leveraging disease-associated genetic variants as instrumental variables to estimate their impact on gene expression levels. In this framework, gene expression is treated as the outcome, and disease liability serves as the exposure. This approach offers unique advantages for uncovering molecular signatures associated with AD. Specifically, revTWMR enables the identification of genes whose expression levels are genetically driven responses to AD-associated variants, thereby revealing downstream transcriptional features that may reflect early systemic consequences of disease-related genetic risk. Compared to DE analyses, which are inherently correlational and susceptible to confounding, revTWMR improves causal interpretability and helps distinguish disease-responsive from reactive or stochastic expression changes.
In our study, we applied revTWMR to identify causal genes among DEGs from bulk RNA-seq profiling of peripheral blood. This was done by integrating two datasets: trans-eQTL data from the eQTLGen Consortium and AD GWAS summary statistics. Using revTWMR, we screened the DEGs to detect those with significant causal relationships with AD. Among the 126 DEGs initially identified (threshold: p < 0.05 and |log2FC| ≥ 0.1), 91 genes passed the revTWMR criteria, indicating robust and reliable causal effects of AD on their expression.
To further refine this candidate set, we applied an additional filter based on effect size, selecting genes with an absolute causal effect estimate (|α|) ≥ 0.8. This threshold emphasizes genes whose expression is strongly and directionally modulated by AD-associated genetic variation, thereby nominating them as putative high-confidence biomarkers with both statistical support and biological plausibility. These prioritized genes, PSMA6, CD19, CMTM6, CD79B, and ST6GALNAC4, were advanced for downstream functional analysis and translational interpretation.
Subsequently, we evaluated the diagnostic performance of these candidate genes based on their expression profiles in peripheral blood. To ensure the robustness of discrimination metrics, we performed 1000-permutation tests to obtain empirical p-values for each gene's area under the ROC curve (AUC).
The results demonstrated variable predictive performance across genes. Among the five candidates, CD19 (AUC = 0.57, p_perm = 0.008), CD79B (AUC = 0.59, p_perm < 0.001), and ST6GALNAC4 (AUC = 0.58, p_perm = 0.004) exhibited statistically significant diagnostic capacity, while PSMA6 (AUC = 0.52, p_perm = 0.412) and CMTM6 (AUC = 0.53, p_perm = 0.231) showed limited discrimination between AD and control samples.
Notably, when integrating the expression levels of all five genes into a combined multigene logistic regression model, the overall predictive accuracy improved (AUC = 0.61, p_perm < 0.001), suggesting that aggregating weak individual signals can yield enhanced diagnostic value. Collectively, these findings indicate that although individual gene expression alone offers only moderate discriminatory power, the permutation-adjusted results identify a subset of statistically supported blood-based biomarkers. Their combined use may improve classification performance and offer potential for diagnostic model development in AD.
This phenomenon may arise because AD is a central nervous system disease, with primary pathological changes occurring in brain tissue. Peripheral blood reflects these changes only indirectly, where gene expression differences tend to be subtle and are influenced by various non-genetic factors such as immune status, inflammation, and individual heterogeneity, which introduce noise and limit sensitivity and specificity in clinical diagnosis. Furthermore, revTWMR captures the long-term causal regulatory effect of genetic variants on gene expression, while expression data reflect instantaneous biological states, and the difference in timescales and signal types may also contribute to the observed limited predictive performance. Nevertheless, given the strong genetic causal support for these genes, they remain important candidates for understanding AD pathogenesis and identifying potential therapeutic targets. Future integration with additional clinical features, multi-omics data, and functional validation may improve the utility of these genes as peripheral blood biomarkers. Among the prioritized genes, PSMA6 emerged as a particularly compelling candidate due to its consistent dysregulation in AD across multiple transcriptomic studies. 11 PSMA6 was identified as a shared dysregulated transcription factor in both AD and diabetes mellitus (DM). Gene regulatory network analysis revealed that PSMA6 exhibited reduced connectivity within a co-expression module (green module) comprising 467 genes, many of which were enriched in pathways relevant to AD pathogenesis, such as the AD pathway (hsa05010), ribosome (hsa03010), and oxidative phosphorylation (hsa00190). 1
Furthermore, this dysregulation was validated in disease-relevant tissues, including AD brain and DM pancreatic tissue, suggesting a systemic role of PSMA6 in disease mechanisms. In another study, PSMA6 was identified as a differentially expressed gene in the peripheral blood of male AD patients. Notably, its expression was significantly reduced in males but not in females, pointing to potential sex-specific regulatory mechanisms in AD. Additionally, PSMA6 was incorporated into a 15-gene diagnostic model constructed via support vector machine (SVM) learning, which achieved high diagnostic accuracy in both training (AUC = 0.919) and validation (AUC = 0.803) datasets. These findings underscore the potential of PSMA6 not only as a downstream transcriptomic target of AD but also as a promising blood-based biomarker, particularly in male patients.12,13
CD19 is a canonical marker of B cells, including regulatory B cells (Bregs), which play key roles in immune modulation. 14 In another study, CD19+ CD5+ IL-10 + regulatory B cells were significantly increased in the peripheral blood of AD patients. 15 These cells are known to produce anti-inflammatory cytokines such as IL-10, potentially contributing to the suppression of neuroinflammation during early AD stages.16,17 Moreover, the proportion of CD19+ Bregs was positively correlated with disease severity, suggesting that their upregulation may reflect a compensatory immune response as AD progresses. In another study demonstrated significant mitochondrial dysfunction in CD19+ B cells during the early stages of AD. Specifically, these cells exhibited reduced mitochondrial DNA content and lower fluorescence intensity of mitochondrial-specific antibodies, indicating mitochondrial depletion. 17 Given the importance of mitochondrial integrity in cellular energy metabolism and immune function, such impairments in CD19+ B cells could contribute to disease progression by compromising immune surveillance or homeostasis. Importantly, this mitochondrial depletion was detectable in early-stage AD, raising the possibility that mitochondrial profiling of CD19+ B cells may serve as an early diagnostic biomarker. Together, these findings highlight a dual role for CD19+ B cells in AD—on one hand as immune modulators through IL-10 secretion, and on the other as potential indicators of early mitochondrial dysfunction—underscoring their potential both as therapeutic targets and as biomarkers for disease monitoring and early diagnosis.
Among the candidate biomarkers identified in this study, CMTM6 emerges as a molecule of potential significance in AD. Transcriptomic analyses have revealed altered peripheral expression of CMTM6 in AD patients, and intriguingly, music-based interventions appear to modulate its expression in a direction negatively correlated with disease-related dysregulation, suggesting a possible compensatory role. 18 In murine models, CMTM6 was downregulated in both AD and aging-associated memory impairment, implicating it in cognitive decline pathways, potentially through Gi signaling. Furthermore, CMTM6 has been shown to regulate axonal diameter in Schwann cells, influencing neural conduction velocity and sensorimotor behavior. Although these findings primarily relate to peripheral nerves, they raise the possibility that CMTM6-mediated axonal modulation could also affect central neural circuit integrity. 19 Collectively, these observations suggest that CMTM6 may not only serve as a biomarker for AD progression but also participate in the molecular mechanisms underlying cognitive dysfunction, warranting further investigation.
While most of the prioritized genes identified through revTWMR could be contextualized within the existing body of AD literature, CD79B and ST6GALNAC4 lack direct experimental or clinical evidence linking them to AD pathogenesis. CD79B encodes a component of the B- cell receptor complex and is primarily involved in adaptive immune signaling. Although B-cell–mediated responses are not traditionally associated with central nervous system degeneration, emerging studies suggest that peripheral immune alterations may contribute to neuroinflammatory cascades in AD. The involvement of CD79B may thus reflect a novel or underexplored immune mechanism that warrants further investigation. 20 Similarly, ST6GALNAC4, a sialyltransferase involved in glycosylation pathways, has not been previously implicated in AD. However, altered glycosylation patterns have been observed in AD and are increasingly recognized as modulators of protein aggregation and immune recognition. The identification of ST6GALNAC4 by revTWMR suggests that genetically regulated changes in glycosylation may play an upstream role in disease susceptibility. 21 The lack of prior association in the literature does not necessarily diminish the potential relevance of these genes; rather, it highlights the strength of our causal inference approach in uncovering novel candidates beyond those identified by correlation-based methods. These findings underscore the value of revTWMR in prioritizing biologically plausible yet previously unrecognized genes for future mechanistic and biomarker studies.
In conclusion, by integrating differential gene expression analysis with revTWMR, our study revealed blood-based transcriptomic features aim that are not merely associated with AD but are potentially downstream consequences of its genetic liability. The prioritized candidates PSMA6, CD19, and CMTM6, offering valuable insights into the systemic manifestations of AD. These biomarkers not only advance our understanding of the disease's molecular underpinnings but also hold translational potential for developing minimally invasive diagnostic tools and personalized therapeutic strategies. While revTWMR methodology suggests these biomarkers may be relevant in early disease stages due to their association with genetic liability, prospective longitudinal validation in preclinical cohorts is required to confirm early detection utility. Future research should aim to validate these findings in independent cohorts and explore the mechanistic roles of these genes in longitudinal and functional studies, ultimately bridging the gap between genetic risk and clinical application in AD.
Supplemental Material
sj-xlsx-1-alz-10.1177_13872877261422501 - Supplemental material for Identification of causally linked blood biomarkers for Alzheimer's disease via reverse transcriptome-wide Mendelian randomization
Supplemental material, sj-xlsx-1-alz-10.1177_13872877261422501 for Identification of causally linked blood biomarkers for Alzheimer's disease via reverse transcriptome-wide Mendelian randomization by Zimo Li, Dong Wang, Fei Xia, Yuchen Liu and Yunyi Liu in Journal of Alzheimer's Disease
Footnotes
Acknowledgements
The authors thank the eQTLGen Consortium for providing publicly available eQTL summary statistics, and OpenGWAS for access to GWAS summary data. We also acknowledge the GEO database for providing the bulk RNA-sequencing datasets used in this study.

Ethical considerations
All data utilized in this study were sourced from the public databases GEO and GWAS Catalog, comprising de-identified public datasets requiring no additional ethical approval. This research is classified as a minimal-risk study.
Consent to participate
Not applicable.
Consent for publication
Not applicable.
Author contribution(s)
Funding
The authors disclosed receipt of the following financial support for the research, authorship, and/or publication of this article: This work was supported by the Guidance Project of the Scientific Research Program of Hubei Provincial Department of Education (grant numbers B2019233).
Declaration of conflicting interests
The authors declared no potential conflicts of interest with respect to the research, authorship, and/or publication of this article.
Data availability statement
The data supporting the findings of this study are all publicly available: Bulk RNA-sequencing data were obtained from the Gene Expression Omnibus (GEO) under accession number GSE140829. Alzheimer's disease GWAS summary statistics were accessed through the OpenGWAS platform, corresponding to dataset ID GCST90027158. Whole-blood trans-eQTL summary statistics were obtained from the eQTLGen Consortium.
Supplemental material
Supplemental material for this article is available online.
References
Supplementary Material
Please find the following supplemental material available below.
For Open Access articles published under a Creative Commons License, all supplemental material carries the same license as the article it is associated with.
For non-Open Access articles published, all supplemental material carries a non-exclusive license, and permission requests for re-use of supplemental material or any part of supplemental material shall be sent directly to the copyright owner as specified in the copyright notice associated with the article.
