



Abstract
Background:
A connection between plasma levels of haptoglobin (Hp) and Alzheimer’s disease (AD) has been shown in several observational studies. It is debatable, nonetheless, how the two are related causally.
Objective:
To establish the causal relationship between Hp and AD using a two-sample Mendelian randomization (MR) study.
Methods:
From the extensive genome-wide association studies and FinnGen dataset, summaries and statistics pertaining to AD were gathered. We investigated the possibility of a causal link between Hp and AD using a two-sample MR study. Inverse variance weighting was used as the primary analytical technique, and it was supported by the joint application of complementary analyses and fixed effects meta-analysis to combine results from various sources.
Results:
Genetically determined Hp was causally associated with AD [odds ratio (OR), 1.05; 95% confidence interval (CI), 1.02 to 1.09; p = 8.96×10⁻⁴]; Inverse variance-weighted estimates coming from different data sources were combined in a meta-analysis with consistent findings (OR, 1.03; 95% CI, 1.01 to 1.05; p = 2.00×10⁻³). The outcomes of the inverse MR analysis showed that AD had no appreciable causal impact on Hp.
Conclusion:
The present MR analysis shows that higher plasma Hp leads to an increased risk of AD. Strategies for plasma Hp testing may open up new doors for the early diagnosis and prevention of AD.
INTRODUCTION
Alzheimer’s disease (AD) is a neurodegenerative disease that leads to progressive cognitive decline and progressive behavioral disorders. Its main pathological features are senile plaques caused by extracellular amyloid-β (Aβ) deposition and neurofibrillary tangles caused by excessive phosphorylation of tau protein which is the most abundant microtubule-associated protein.
Although the etiology of AD is yet unknown, the theory that oxidative stress and inflammatory mechanisms can trigger AD progression has been widely accepted [1, 2]. Haptoglobin (Hp) is one of the acute phase response proteins and is widely present in the circulatory system with a variety of functional properties, including antioxidant and anti-inflammatory activities [3, 4]. In recent years, several observational studies have shown elevated levels of Hp in the serum and cerebrospinal fluid of AD patients compared to healthy controls [5–7]. In a case-control study of sporadic AD conducted by Philbert et al., it was observed that Hp levels were higher than normal in most regions of the brain among patients with sporadic AD [8].
Even though there is a wealth of literature supporting the substantial link between Hp and AD, their perspectives largely revolve around conventional observational epidemiology. Because it is difficult to collect data, there are few implementation options, and observational studies are typically not randomized, the results are not yet conclusive proof of a cause-and-effect relationship between Hp and AD. Mendelian randomization (MR) is a cutting-edge and potent research technique that eliminates reverse causation [9], avoids prior external confounding, and is a more economical bioinformatics approach [10]. It has lately become a dependable new methodological tool for epidemiological investigations, based on the theory of employing genetic variables as metrics to validate causal links between exposure factors and outcome indicators [11]. Here, we performed a two-sample MR study to carry out the initial data analysis. We initially performed data analysis using a two-sample MR study, which makes use of genetic datasets from two separate populations, to establish the causal relationship between Hp and AD. Additionally, we repeated the main analysis using datasets from different sources. This study has a theoretical basis and clinical translational value, and the findings may provide a reference to guide the development of preclinical AD risk prediction and treatment tools.
MATERIALS AND METHODS
Study design
We defined single nucleotide polymorphisms (SNPs) as instrumental variables (IVs) [12] and selected circulating Hp levels for MR analysis to investigate the causal relationship of Hp with AD. In our study, three basic assumptions must be met for any MR analysis to be reliable (Fig. 1) [13]. Every piece of information used in this study came from publicly accessible databases. All initial research received informed permission from all study participants as well as ethical approval from the relevant medical ethics boards. Additionally, this study precisely followed the STROBE-MR statement’s guideline for reporting observational studies in epidemiology using MR (Supplementary Table 1) [14].

Diagrammatic representation of the Mendelian randomization investigation. SNPs, single-nucleotide polymorphisms; AD, Alzheimer’s disease; IVs, instrumental variables; Hp, haptoglobin; MR, Mendelian randomization.
Data sources and IVs selections
Based on 997 people of European origin from the Cooperative Health Research in the Region of Augsburg (KORA) public database, which includes age, sex, and body mass index as variables, we retrieved the SNPs with Hp-related phenotypes for this MR investigation (Table 1) [15]. Some researchers have suggested selecting more than 10 independent SNPs as IVs for MR analysis to maintain sufficient statistical power [16]. Therefore, the criteria of p < 5×10⁻⁶, linkage disequilibrium r2 < 0.1, and clump = 250 kb have been set to obtain an adequate number of SNPs. 23 SNPs were strongly connected to Hp out of the 95 SNPs that were substantially linked to Hp at the Bonferroni significance level. We further used PhenoScanner V2 [17] to test whether the above SNP loci were associated (p < 5×10⁻⁸) with risk factors for AD. SNPs related to LDL [18] (rs2000999, rs217181, rs8044476, rs9302635), diabetes [19], inflammation [20], height [21] (rs4788808), hypertension [22], and body mass index [23] will be specifically excluded. Then, we computed R2 for each SNP using the previously mentioned approach to account for the amount of variation [24]. For each SNP, we assessed the power of the remaining SNPs using the F statistics [F = R2(N-2)/(1-R2)], where N represents the sample size of the GWAS conducted for the SNP-Hp association [25]. The result files contained information on every single SNP. In this study, no SNPs associated with the outcome were found (p < 5×10⁻⁸) [26], and proxy SNPs were not used. In this, two loci having palindromic sequences were disregarded (rs17286411, rs2266943). Finally, all selected SNPs had minor allele frequencies greater than 0.01 (Supplementary Table 2).
Detailed information of studies and datasets used for analyses
KORA, Cooperative Health Research in the Region of Augsburg; Hp, haptoglobin; IGAP, International Genomics of Alzheimer’s Project; AD, Alzheimer’s disease; ADGC, Alzheimer Disease Genetics Consortium; CHARGE, Cohorts for Heart and Aging Research in Genomic Epidemiology Consortium; EADI, The European Alzheimer’s Disease Initiative; GERAD, Genetic and Environmental Risk in AD/Defining Genetic; AAO, Age at onset; AAE, Age at an examination or last follow-up.
We drew on pooled clinically diagnosed late-onset AD genome-wide association studies (GWAS) data from a GWAS meta-analysis of the International Genomics of Alzheimer’s Project (IGAP) stage 1 discovery study, which reported more than 10 million SNPs in 21,982 AD patients with clinical or autopsy-documented and 41,944 controls (Table 1) [27]. The GWAS dataset can be found in the GWAS Catalog (https://www.ebi.ac.uk/gwas/). Participants were sourced from multiple populations, as detailed in Table 1. Using the FinnGen consortium’s results (https://www.finngen.fi/), which yielded full genomic variant data for 500,000 Finnish residents, the study was then replicated. The FinnGen database can be accessed and downloaded from the IEU OpenGWAS project (https://gwas.mrcieu.ac.uk/) using the GWAS ID “finn-b-F5_ALZHDEMENT”. The diagnostic criteria for AD were defined using the “F00*” codes in the International Classification of Disease-10 (ICD-10), and the “20910” codes in ICD-8. The dataset included 2,191 cases and 209,487 controls from European populations.
Mendelian randomization analysis
The TwoSampleMR [28], MendelianRandomization [29], and MR-PRESSO [30] algorithm packages were used to run all analyses in R version 4.1.1. The inverse of the result variance was employed for each SNP as the weight in the study’s primary statistical model, inverse variance weighting (IVW), which was used to examine the causality between exposure (Hp) and outcome (AD). This traditional approach would be regarded as the most statistically reliable if the MR assumptions were satisfied [11]. The IVW estimations may be skewed by up to 90% of MR analyses, according to simulation studies, which have demonstrated that pleiotropy can affect MR analysis. To account for various multi-effects patterns and to evaluate the reliability of the findings, this study used a variety of MR analyses, including MR-Egger regression [31], weighted median [32], simple mode [33], and simple median [34]. MR-Egger analysis was used to examine its intercept for potential polyvalence levels [35]. If the requirement that null SNPs do not account for more than 50% of the weight of the MR effect estimates is fulfilled, the weighted median technique yields consistent effect estimates [32].
The MR-PRESSO overall test [30] and the PhenoScanner V2 [17] (as described above) were used to further examine horizontal pleiotropy as well as the MR-Egger analysis. Primarily, any pleiotropic effects were statistically tested using the MR-Egger intercept test. The MR-IVW approach’s heterogeneity was then evaluated using Cochran’s Q test and quantified using the I2 statistic [36]. The IVW fixed effects model was largely applied where there was no potential for horizontal pleiotropy heterogeneity [11]. In the presence of heterogeneity, a random effects model was chosen [37]. Identification of SNPs indicating inverse association was investigated using preliminary MR-Steiger filtering [38] (Supplementary Table 3). Eventually, after several tests, we set a two-sided p-value of less than 0.025 (= 0.05/2 outcomes) as the significance threshold, and calculated statistical power using the web tool (https://cnsgenomics.com/shiny/mRnd/) [39].
RESULTS
The exposure and outcome samples did not overlap because they were obtained from two different consortia (Table 1). We identified 16 distinct SNPs by screening the aforementioned IVs. These 16 SNPs are estimated to account for 71.38% of the diversity in Hp phenotypes (Table 2). All instrumental factors’ F-statistics were more than 10 (ranging from 20 to 161), which showed that the SNPs discovered had high power and that the biases caused by weak instrumental variables had no effect on the subsequent MR analysis (Table 2).
Characteristics of instrumental variables for Hp and their association with AD
Hp, haptoglobin; SNP, single-nucleotide polymorphism; Chr, chromosome; EA, effect allele; OA, other allele; EAF, effect allele frequency; MAF, minor allele frequency; R2, percentage of the variation of asthma explained by the SNP; Beta, estimate of the effect of the association; SE, standard error; IGAP, International Genomics of Alzheimer’s Project; AD, Alzheimer’s disease; F, F statistic.
According to the IVW method’s findings, the IGAP database’s elevated plasma Hp levels predicted by genetic variations were linked to a higher risk of AD (Fig. 2). Odds statistical analysis based on the FinnGen dataset returned a similar direction with wider CIs (OR = 1.01; 95% CI = 0.96 to 1.06; p = 0.76; Figs. 2 3). The primary results were made more reliable by the fact that the results of the meta-analysis that combined the IGAP and FinnGen datasets also passed several Bonferroni adjustments (OR = 1.03; 95% CI = 1.01 to 1.05; p = 2.00×10⁻³; Fig. 3). The general direction of the six analytical techniques remained consistent for the causal link of Hp on AD, despite some of the supplemental analytical methods’ findings falling short of the p-value of 0.025 and having wider CIs (Table 3).
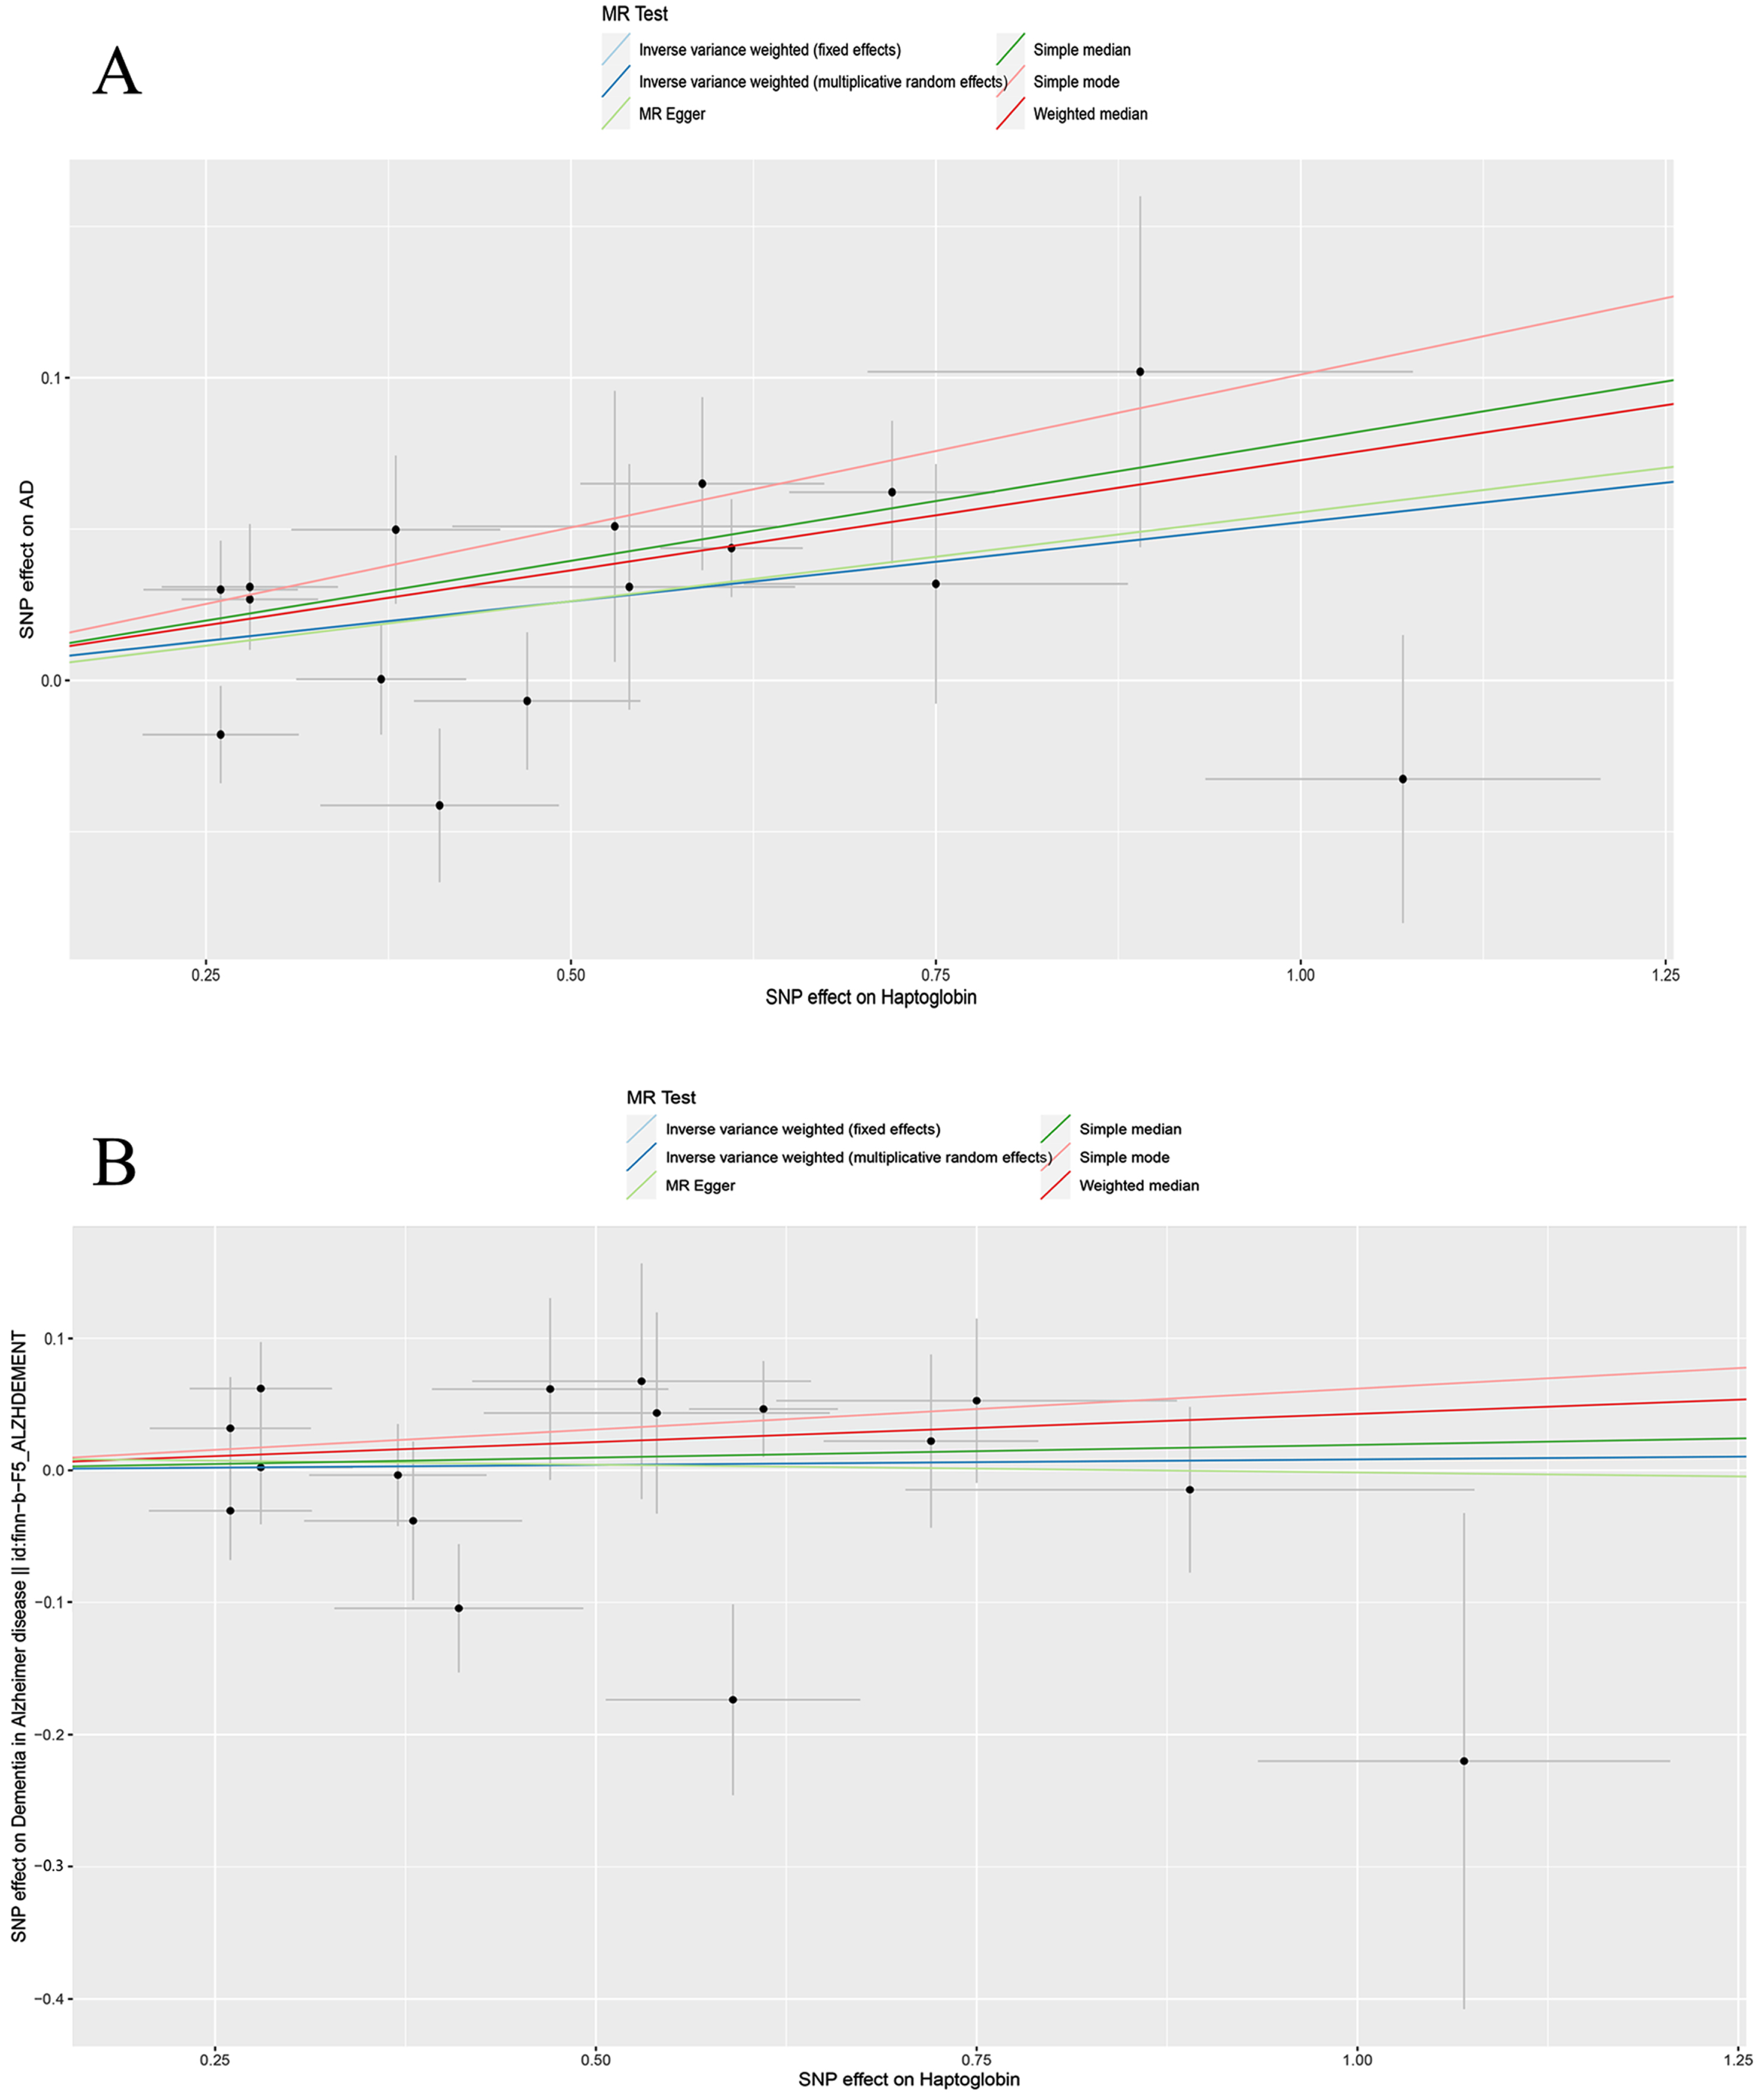
Scatter plot of the MR estimates for the association of serum Hp levels with risk of AD based on IGAP (A) and FinnGen (B). The lines of different colors in the figure represent the results of different MR analysis methods. The slope represents the MR estimate of Hp on AD risk. Each point represents an SNP, and the horizontal and vertical lines intersecting at each point display the 95% confidence interval for each SNP. IGAP, International Genomics of Alzheimer’s Project; AD, Alzheimer’s disease; Hp, haptoglobin; MR-PRESSO, MR Pleiotropy Residual Sum and Outlier.
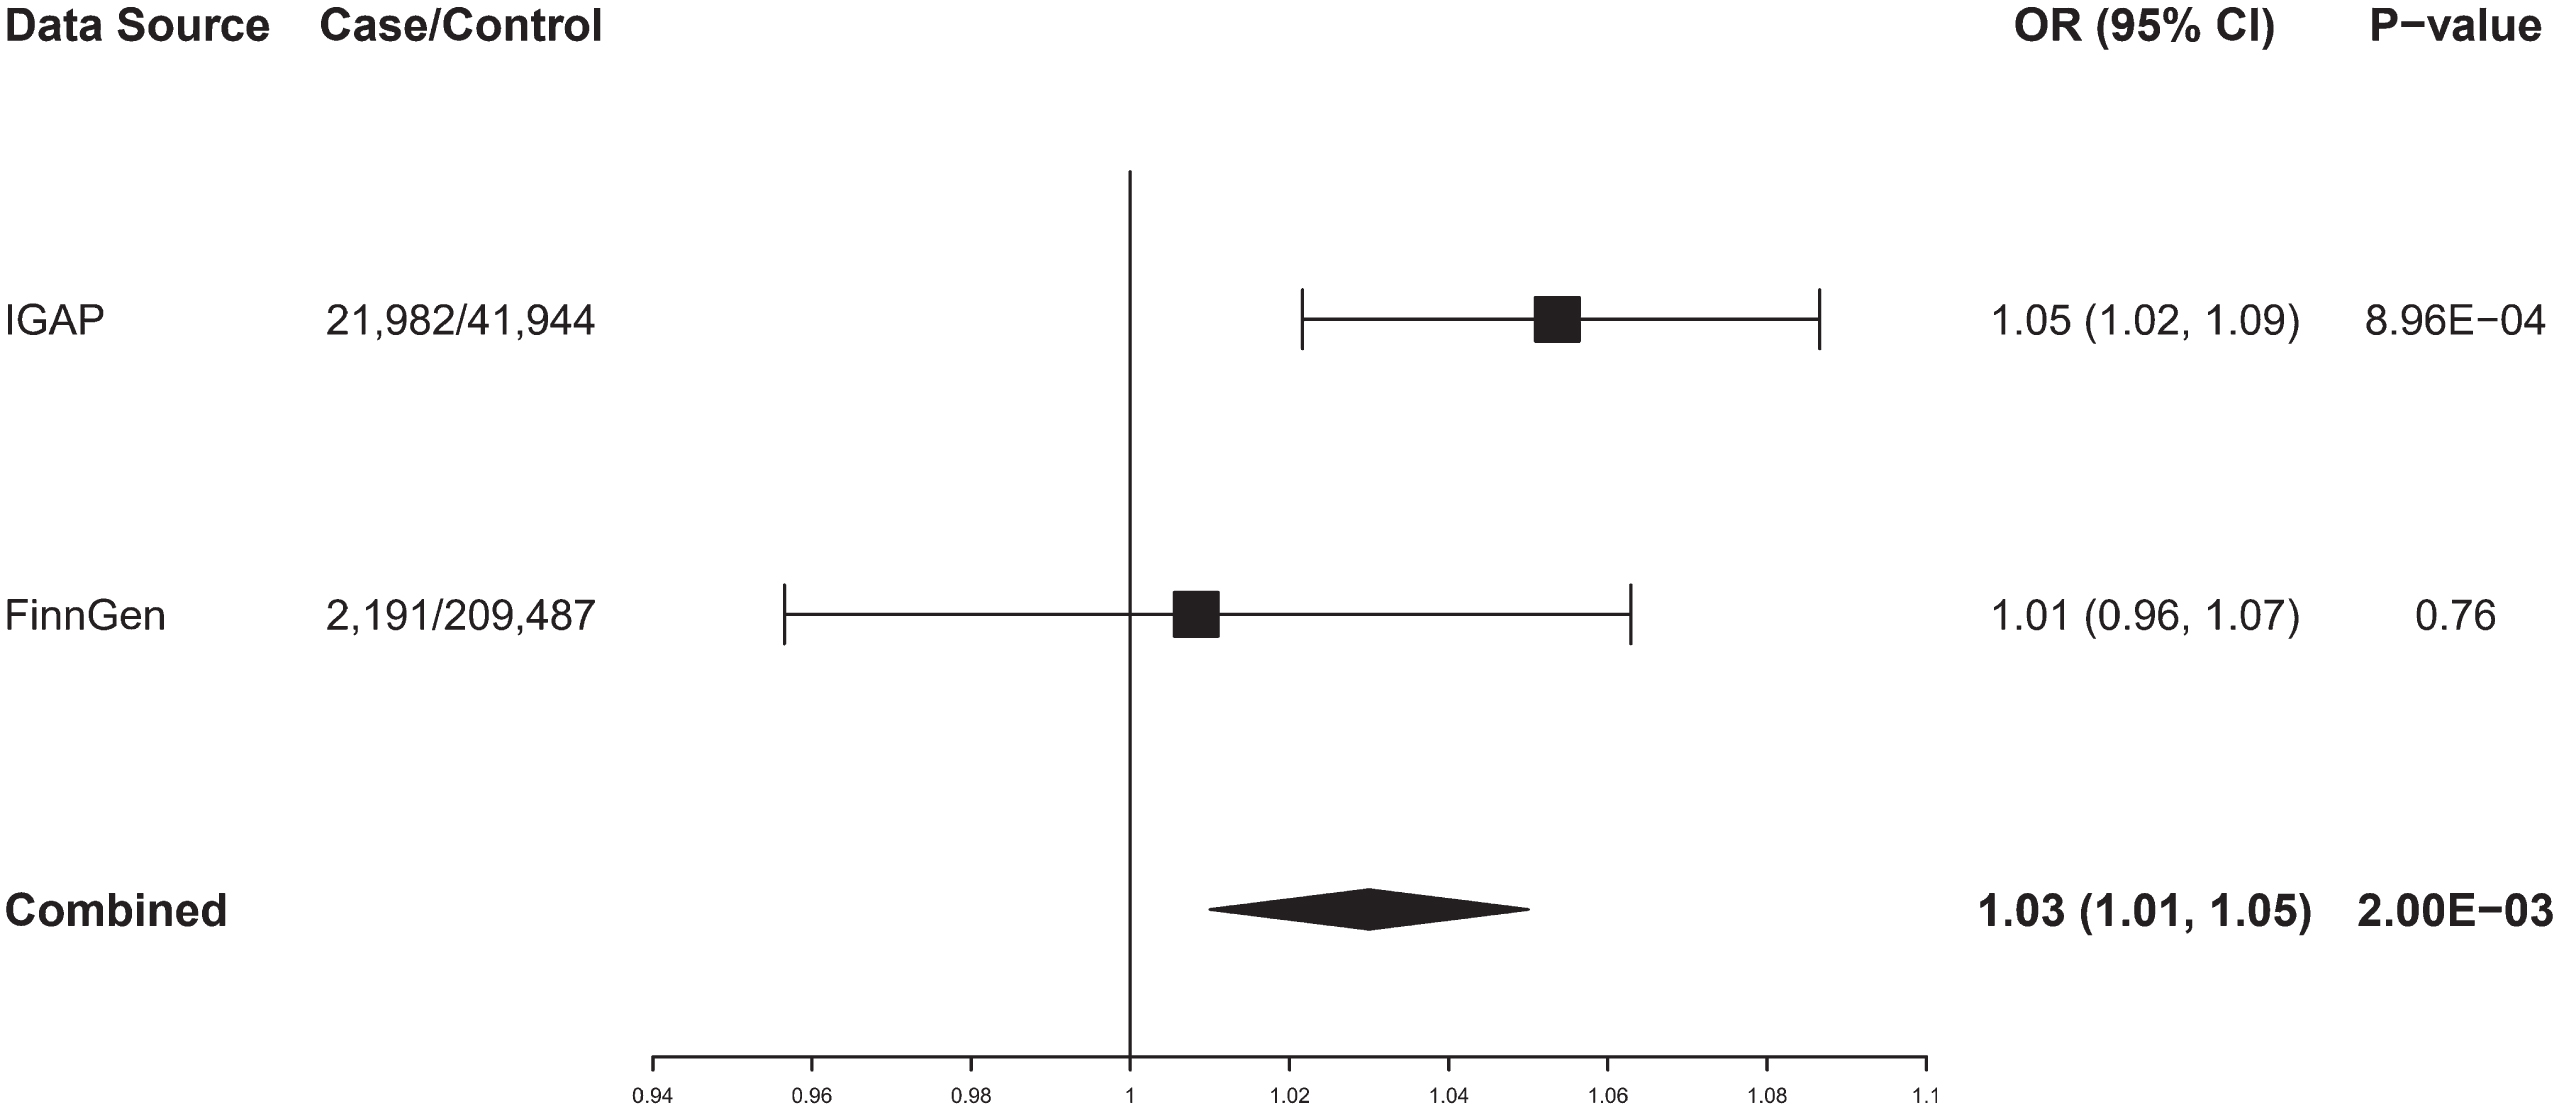
Association of genetically predicted serum Hp levels with risk of AD. IGAP, International Genomics of Alzheimer’s Project; AD, Alzheimer’s disease; Hp, haptoglobin; OR, odds ratio; CI, confidence interval.
Association of genetically predicted circulating Hp levels with AD risk in complementary analyses
IGAP, International Genomics of Alzheimer’s Project; AD, Alzheimer’s disease; Hp, haptoglobin; SNPs, single-nucleotide polymorphisms; IVW, inverse-variance weighted; MR-Egger, Mendelian randomization-Egger; MR-PRESSO, MR-pleiotropy residual sum and outlier; CI, confidence interval; The odds ratio (OR) represents the increase in genetic prediction for each 1-standard deviation (SD) increase in exposure. *No outliers detected.
Evaluation of heterogeneity and directional pleiotropy using different methods
IGAP, International Genomics of Alzheimer’s Project; AD, Alzheimer’s disease; IVW, inverse-variance weighted; MR-Egger, Mendelian randomization-Egger; MR-PRESSO, MR-pleiotropy residual sum and outlier.
A series of sensitivity analyses supported that the causal effect of Hp and AD was robust. Regarding IVW and MR-Egger regression statistics revealed no significant heterogeneity among SNPs (p > 0.05; Table 4). However, Cochran’s Q test statistics indicated a slight heterogeneity between the genetic predictive SNPs based on the Hp levels and AD from the IGAP dataset (p < 0.05, Table 4). In contrast, no heterogeneity was observed in the Finngen dataset (p > 0.05; Table 4). For the objects exhibiting heterogeneity, we selected a random-effects model to analyze the causal relationship. The MR-Egger intercept and 0 did not differ statistically significantly (p > 0.05; Table 4), and the results of the MR-PRESSO global test were also not statistically significant (p > 0.05; Table 4). Thus, it is reasonable to believe that the observed SNPs do not exhibit horizontal pleiotropy. In addition, no outliers were visible in the MR-PRESSO test data. The MR-Steiger filtering test results are presented in Supplementary Table 3, and no SNPs with inverse correlation were discovered. This study demonstrated sufficient power for the IGAP Consortium AD, while for the FinnGen Consortium AD, the estimated power of this study was 80% when the expected OR was 1.079 (or 0.929) (Supplementary Table 4).
DISCUSSION
AD is the most frequent cause of dementia in older people and is extremely dangerous to health [40]. There are not any sensitive and specific early diagnostic methods or criteria for AD, which is a crafty and irreversible disease. When the disease has often advanced to the middle and late stages, patients rely on clinical symptoms and imaging signs to make a diagnosis. The greatest strategy to lower AD morbidity and mortality, given its epidemiological features, is by early avoidance of its risk factors and early identification based on useful biomarkers.
Hp is now often found in human bodily fluids, where it binds to free hemoglobin in the blood with a high affinity and is strongly linked to, among other things, inflammatory and oxidative stress reactions in the body. For the first time, a two-sample MR method was utilized to predict plasma Hp levels genetically. Our results demonstrate that a higher plasma Hp level is linked to a higher risk of AD. Our funding indicates that for each 1-standard deviation increase in plasma Hp, there is a 3% increased risk of AD (OR, 1.03; 95% CI, 1.01 to 1.05; p = 2.00×10⁻³). In several complementary analyses, the positive outcomes were stronger and generally consistent. No horizontal pleiotropy was found. To address the observed heterogeneity in Cochran’s Q statistics during our bidirectional MR analysis, we employed the IVW random-effects method as our primary MR approach. This approach helps mitigate biases in the results caused by heterogeneity.
In various neurobehavioral tests, it was discovered that Hp-deficient mice had fewer neurological impairments [41]. Another case-control investigation revealed that in individuals with sporadic AD, Hp was found to be considerably higher in the majority of brain areas after death [8]. By combining multidimensional liquid chromatography and gel electrophoresis, a newly developed study method discovered higher Hp in AD patients as compared to controls [42]. Wang et al. obtained similar results by capillary electrophoresis immunoassay and laser-induced fluorescence detection techniques [43]. Zhu et al. showed an Area Under the Curve of 0.921 (p < 0.001, 95% CI = 0.873–0.969) for Hp in the blood of AD patients based on a subject operating characteristic curve analysis, and these findings are consistent with the results obtained by our MR [7]. However, negative results were obtained in some previous observational studies [44] with results that could be attributed to residual confounders or reverse causality [45].
It is worth noting that the neuroinflammatory response is the common thread of pathogenesis of various neurological diseases [46]. Hp, as a widespread inflammatory response protein, has been reported by many pieces of evidence. Along with AD, it is also elevated in those who have Parkinson’s disease, Huntington’s disease, schizophrenia, and other neurological diseases [47–49]. Thus, it may not be a specific marker for AD but may be a useful indicator of the inflammatory status of the disease and has potential early predictive value for AD in the clinical setting. Interestingly, Hp is a pleiotropic protein, which has also been reported to be amyloid-associated [50]. Hp is associated with Aβ plaque deposition in AD patients and Hp may affect cellular uptake and clearance of Aβ by preventing Aβ binding and/or by reducing its aggregation [51]. Spagnuolo et al. provide evidence that Hp is involved in promoting the binding of Apolipoprotein E and Aβ in cells, thereby limiting Aβ neurotoxicity and promoting its clearance [52]. Although our findings provide strong evidence for the existence of a causal relationship between elevated circulating levels of Hp and increased risk of AD, exactly how Hp affects the development of AD remains to be determined. Therefore, further clinical and fundamental research is required to interpret these results in the future.
This study using MR structures provides some benefits. First, the rule of segregation, which is the foundation of MR analysis, may successfully obviate possible confounders and reverse causation. Second, a larger sample of GWAS was employed in this work, and several sample sizes were merged for the meta-analysis, enabling a better overall analysis of AD occurrences. To make sure that its theories are solid, this MR study also passed acceptable and stringent tests of horizontal pleiotropy and heterogeneity. The current study does, however, have several drawbacks. First, although eliminating the prejudice associated with ethnic bias, our study was only conducted on people of European ancestry, which raises questions about its application to populations of other races. Second, previous studies have indicated that Hp increases with age in both humans and experimental animals [53, 54]. Age is closely associated with the onset and progression of AD, and it may serve as an unavoidable confounding factor. Both the KORA and IGAP datasets have accounted for important individual characteristics, including age, in their analyses, thus reducing the influence of confounding factors. However, the two-sample MR design used in this study does not allow for further elucidation of this relationship. Future investigations could explore this further using multivariable MR or other approaches. Third, considering the limited number of genetic variants included in the study, the variance explained by these variants in Hp is constrained, and there may be an underlying genetic variation that remains unaccounted for. This is because Hp, as a plasma protein, does not exist in isolation but rather functions within various protein networks [55]. However, current research capabilities do not provide a definitive explanation, and therefore, larger sample sizes or more precise detection techniques are required to robustly confirm the missing variations in this study. Some of the primary analysis’s statistical power fell below the 80% cutoff (Supplementary Table 4). This could be also attributed to the insufficient sample sizes or relatively small proportion of cases in the FinnGen dataset. As a result, caution should be used while interpreting the data. Finally, despite the benefit of less intrusive and accessible human blood samples in clinical settings, the blood-brain barrier may prevent some proteins in plasma from accurately and quickly detecting changes in the brain. We will investigate the function of proteins from the intracellular environment or Hp of cerebrospinal fluid in more detail in the future.
CONCLUSION
Taken together, the genetic evidence from the results of this MR Study reveals a potential causal relationship between higher plasma Hp and increased risk of AD. Hp may be a novel high-sensitivity plasma biomarker for the diagnosis of AD, providing new insights into the early prevention of AD.
Footnotes
ACKNOWLEDGMENTS
The authors wish to thank the KORA study, the IGAP consortium, and the FinnGen consortium for providing summary-level data. We would like to express our gratitude to Mr. Chen (12218519@zju.edu.cn) for his MR training course. His excellent sharing of the MR process makes it easier for us to accomplish this work.
FUNDING
This study was funded by grants from the Basic Research Project of Shanghai Sixth People’s Hospital (General Cultivation Project, ynms202207).
CONFLICT OF INTEREST
The authors have no conflict of interest to report.
DATA AVAILABILITY
All the datasets used in the present study are openly available. The data generated or analyzed during this study have been included in this published article and its supplementary information files.
