
Abstract
This article considers Australian attitudes to immigration and cultural diversity. It argues that Australia and Canada are the most receptive to immigration among western nations. The average of 25 surveys conducted in Australia in the period 1999–2010 finds 52% in support of the current immigration level or in support of an increased intake, 43% in support of reduction, and 5% uncertain. While there can be no definitive measure of the level of strong opposition to cultural diversity, on the basis of a number of surveys conducted over the last 30 years, there are indications that the level is close to 10% of the population, with higher levels within specific demographics. Areas of high immigrant concentration present a complex picture. They are characterised by high levels of identification with Australia, but also lower levels of trust and sense of safety, lower levels of participation and heightened experience of discrimination.
Surveying in Australia
Given the significance of immigration for Australia, there has been surprisingly little investment in systematic public opinion research into attitudes to immigration and cultural diversity. Within the European Union (EU) opinion is tracked by the annual Eurobarometer, 1 established in 1973, with a minimum of 1000 respondents in each member state, and the biennial European Social Survey, 2 which reaches over 30,000 respondents. In England, the British Social Attitudes survey has been administered annually since 1983 to monitor and interpret the British public’s changing attitudes towards social, economic, political and moral issues. It uses a comprehensive questionnaire, is administered by trained interviewers and is completed by a sample of 3000 respondents. It has included a number of questions on immigration and race relations and its findings have been reported in major research publications (see McLaren and Johnson, 2004; Rothon and Heath, 2003). In addition, wide-ranging Citizenship Surveys 3 were conducted biennially and then on a more frequent basis between 2001 and 2011. The first three citizenship surveys were each administered to some 15,000 respondents (including a minority ethnic boost of 5000) in face-to-face interviews, taking approximately 60 minutes to complete. In Canada, the Department of Citizenship and Immigration commissioned tracking surveys on a three-monthly basis between 1996 and 2005 and annual surveys in 2006, 2007, 2009 and 2010 (Ekos, 2010; Pollara, 2003). An Ethnic Diversity Survey, conducted in 2002 by Statistics Canada 4 in conjunction with other departments, set a standard of excellence involving personal interviewing of 42,500 respondents, utilising a rigorous sample based on the 2001 census.
Australia lacks government-sponsored surveying on the scale evident in the EU, England and Canada. The main source of long-run time-series data is the relatively underfunded work of researchers at the Australian National University (ANU). ANU researchers conduct the Australian Survey of Social Attitudes (AuSSA), which is presented as ‘Australia’s major academic social survey’. 5 It has been conducted every two years since 2003 and contributes to the International Social Survey Program (ISSP) and the World Values Survey, but includes few questions on immigration. It is not administered by trained interviewers but is a mailed out, self-administered survey which achieves some 3000–4000 completions.
Two other major social surveys have been conducted by ANU researchers. The Australian Election Study (AES) 6 is administered following a federal election, an average frequency of three years. The AES utilises a mailed, self-administered questionnaire. It achieves a sample of 1800–2000 respondents and provides insight into the relative importance of political issues, including immigration.
The ANU Poll 7 commenced in 2008 and was planned to run on a quarterly basis, but has not been maintained at that level of frequency, with the 13th survey published in October 2012. It is telephone based and reaches 1000–1200 respondents. In addition to common questions across surveys, each survey focuses on a specific topic. The seventh poll, published in October 2010, covered population, immigration and ageing.
Tracking shifts of opinion on immigration has until recent years been in large part reliant on commercial polling for the print media. There are problems, however, with reliance on such polling. Commercial polls typically include one to three questions on immigration, in the context of an omnibus survey exploring a range of other issues. There is no consistency in wording and frequency is determined solely by level of public interest. In some years there has been no polling on immigration. 8
For the first time in Australian social research, systematic surveying of attitudes to immigration, cultural diversity and social cohesion has been conducted since 2007. Five Scanlon Foundation national surveys have been conducted to date (2007, 2009, 2010, 2011, 2012), 9 each with a sample of 2000 respondents, utilising a uniform methodology and a survey instrument of some 70 questions. In addition, three parallel surveys (2007, 2009, 2012) 10 have been conducted in Sydney and Melbourne in areas of high immigrant concentration. The large sample makes possible reliable analysis of sub-groups.
Australian attitudes to immigration and cultural diversity
There is substantial evidence to indicate that among western nations Australia and Canada rank as the most receptive to immigration (Markus, 2012b; Reitz, 2011). In Australia and Canada a majority of the population regularly supports immigration, in contrast with a number of European countries. For example, a 2003 ISSP survey found that 68% of Canadian and 61% Australian respondents supported the current level of immigration or favoured an increase, compared with 34% in France, 30% in Germany and 22% in England (ISSP, 2003). Indicative of high levels of opposition within some countries of the EU, the 2002 European Social Survey module on immigration found that negative views on immigration reached a peak of 86% in Greece and 87% in Hungary (Card et al., 2005). The 2009–10 English Citizenship Survey found that 78% of respondents favoured reduction of immigration, including 57% who favoured reducing immigration ‘a lot’ (ECS, 2009–10). Over the last 15 years immigration and race relations have become one of the most important political issues in England (Blinder, 2011; Marshall et al., 2007).
In contrast to the interpretation presented in this article of relatively positive attitudes in Australia, some recent surveys have reported high levels of opposition to immigration and high levels of intolerance of diversity. Two surveys are considered: the reported findings of the AustraliaSCAN survey 11 and the Challenging Racism 12 project led by Professor Kevin Dunn of the University of Western Sydney.
The 2011AustraliaSCAN survey found, according to reports in the Herald Sun and Daily Telegraph, that ‘more than half of Australians want to ban immigration because population growth is out of control … more than half of Australians want our borders closed and immigration ended’. Monash University academic Dr Bob Birrell, a regular critic of immigration policy, interpreted the findings to indicate that ‘people are concerned that the present rate of population growth is not sustainable and is going to make Australia a poorer place to live rather than a better one’ (Herald Sun, 22 May 2012).
There are, however, a number of problems with the reported findings. The question which produced these results and the methodology employed by AustraliaSCAN to establish broad social trends was not disclosed in media reports, nor was it publicly available. When results and methodology were subsequently released following a request to the survey company, Quantum Market Research, it was found that respondents had not been presented with a question but a polarising proposition: ‘Australia’s population is high enough already and we should stop any further immigration no matter where from.’ Participants could indicate their opinion along a 6-point scale, ranging from strongly agree (6) to strongly disagree (1).
The ‘more than half of Australians’ (51%) finding was not the proportion indicating strong agreement (6), nor those who indicated one of the two end points on the scale (6, 5); rather, it also included the close to mid-point response (4). Thus the views of those who indicated a weak level of agreement (4) were counted as the equivalent of those with the strongest level of agreement (6).
There is a second way to read the AustraliaSCAN finding. The artificial or forced polarisation of opinion employed by AustraliaSCAN may be useful for detecting trend of opinion (the objective of AustraliaSCAN), but it does not necessarily yield a reliable reading of opinion on specific issues. Surveying typically proceeds on the understanding that there are people with firm views either for or against any given issue, but many in the middle-ground or the ‘don’t know’ category. Recalculating the AustraliaSCAN results to identify the middle-ground yields a minority, 35%, who clearly agree (6, 5) that ‘we should stop any further immigration’, 37% in the middle (4, 3), and 28% in clear disagreement (2, 1) (see Markus, 2012c).
Findings of Dunn’s Challenging Racism project were also presented as indicating a high level of negativity. In the context of stated ‘racist attitude indicators’, nearly half of Australians (49%) reportedly harboured ‘anti-Muslim’ attitudes and nearly a quarter were ‘anti-Indigenous’ (28%), ‘anti-Asian’ (24%) and ‘anti-Semitic’ (23%). As with the AustraliaSCAN survey, the finding gained much media attention, with prominent coverage in the Melbourne Age (23 February 2011). Paralleling the AustraliaSCAN report, the finding that gained most public attention – relating to the extent of ‘anti-Muslim’ sentiment – was based on just one question and employed a methodology which failed to distinguish mid-range from strongly held opinion.
In the Dunn surveys, conducted in different states of Australian between 2001 and 2008, respondents were asked: ‘In your opinion how concerned would you feel if one of your close relatives were to marry a person of Muslim faith’, then Jewish faith, Asian background, and Aboriginal background.
In reporting the findings, it was assumed that concern over marriage of a ‘close relative’ to a person of Muslim faith was indicative of ‘anti-Muslim’ attitude and was a ‘racist attitude indicator’. But a range of factors may explain ‘concern’ over the marriage of a son or daughter, not least the strength of the respondent’s own identity and hopes for transmission of values to children, and hence is an ambiguous finding.
A further problem concerns the way the result was obtained. In surveying, respondents are normally presented with a matched set of positive and negative response options, typically two positive, a mid-point and two negative. But in the question used by Dunn, an uneven response frame was employed, with one positive and four negative response options: (1) ‘not at all concerned’; (2) ‘slightly concerned’; (3) ‘somewhat concerned’; (4) ‘very concerned’; and (5) ‘extremely concerned’.
To illustrate the method used to calculate ‘anti-Muslim’ attitudes, findings for the Sydney Statistical Region are considered. The Challenging Racism project reported that in the Sydney Statistical Region, 56.6% of the population is ‘anti-Muslim’, compared with 54.4% in New South Wales and 48.6% in Australia. To reach this result the four negative responses were simply added, so that the response ‘slightly concerned’ was accorded equal weight with the response ‘extremely concerned’, as indicated in Table 1.
‘In your opinion how concerned would you feel if one of your close relatives were to marry a person of Muslim faith’ (2012).
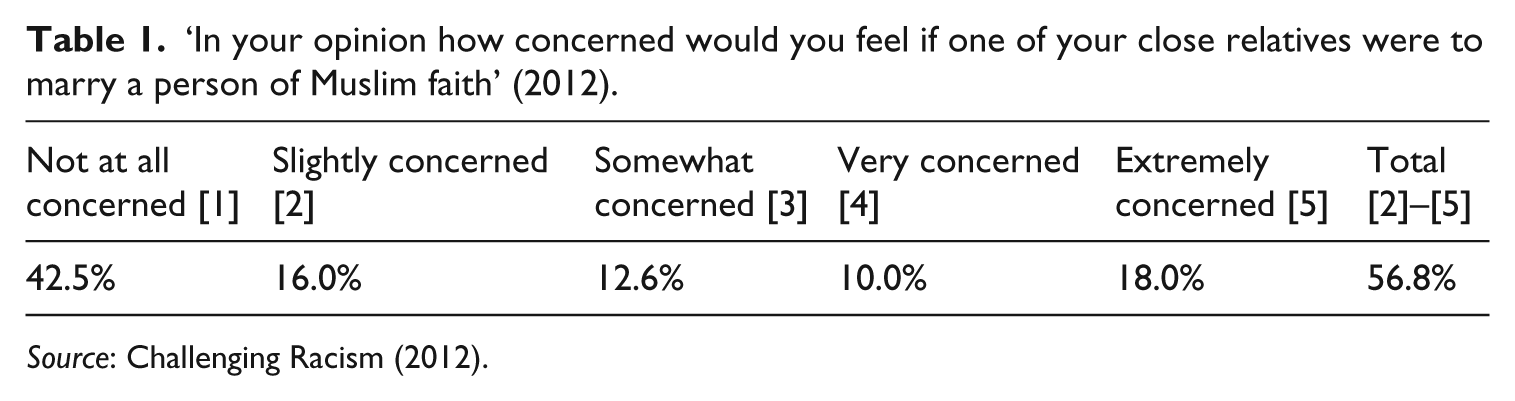
Source: Challenging Racism (2012).
A reading of the data which balances responses along a 2 : 1 : 2 distribution produces a very different result: 58.5% of respondents indicated that they were ‘not at all concerned’ or ‘slightly concerned’ (response options 1 and 2), 12.6% ‘somewhat concerned’ (3) and 28% ‘very concerned’ or ‘extremely concerned’ (4 and 5).
The problem with the reported findings of AustraliaSCAN and the Challenging Racism project is that strong claims concerning the distribution of attitudes are measured by just one question and the imputed levels of negative sentiment rest on combining extreme and mid-range responses. Thus, opinion is located in just two categories, negative and positive. The alternative approach recognises that public opinion is not so simply categorised, that on many issues opinion is vague, half-formed and inconsistent.
The Scanlon Foundation surveys
Scanlon Foundation survey findings and reporting allow for complexity in the reading of attitudes. Thus its Index of Social Cohesion is based on aggregated data for 18 questions, selected on the basis of factor analysis to determine patterns of response. The index also weights strength of response; in calculating agreement, ‘strong’ agreement is accorded double the weight of ‘moderate’ agreement – and a balanced response frame is used in all questions.
First, findings on attitudes to immigration are considered. A staple of Australian surveying on immigration, beginning in 1951 (Goot, 1999: 39), has used a 3-point response scale to determine attitudes: the intake is too high, about right, or too low. The record of polling indicates that questions of this nature find volatility of response. In a period of increasing or relatively high unemployment, there is majority support for the view that the intake is too high; in times of economic growth and relatively low unemployment, the majority supports the current intake or its increase. Four of the five Scanlon Foundation surveys conducted between 2007 and 2012, a time of relatively low unemployment, found that 53–56% of respondents considered that the intake was ‘about right’ or ‘too low’ (Table 2). In 2010 there was a statistically significant fall, to 46%, in the context of economic concerns and politically divisive debate over population growth.
‘What do you think of the number of immigrants accepted into Australia?’ (2007–12).
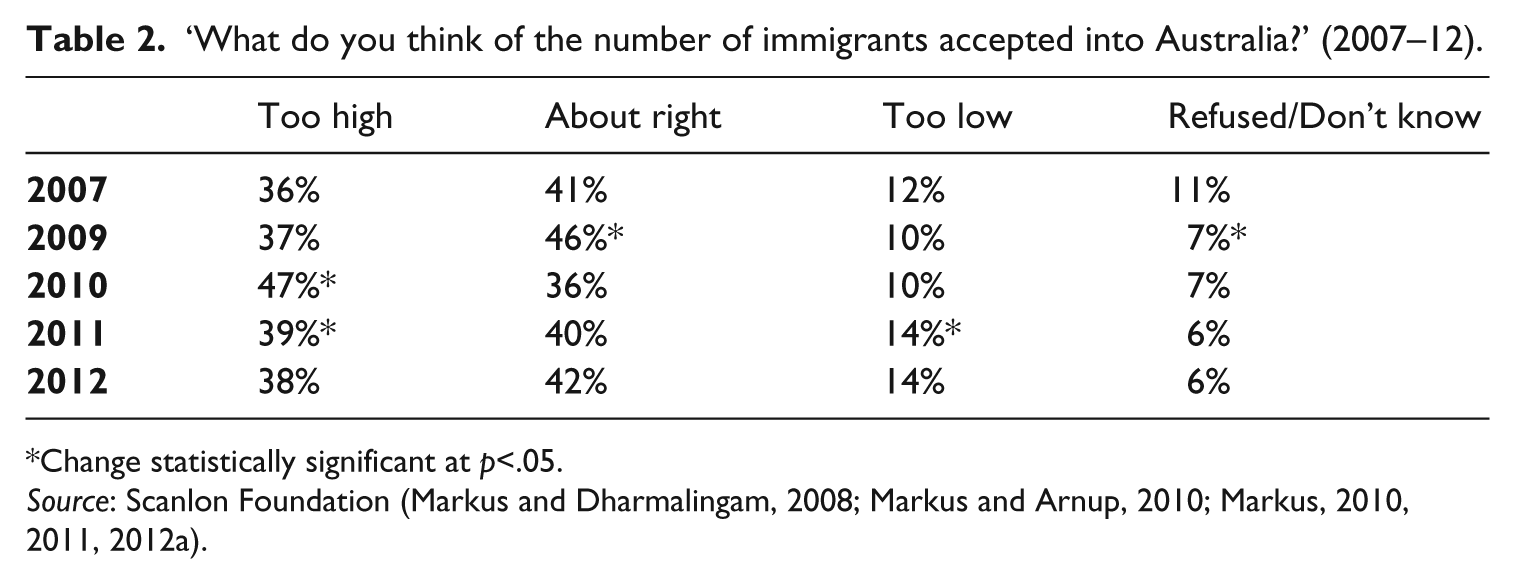
Change statistically significant at p<.05.
Source: Scanlon Foundation (Markus and Dharmalingam, 2008; Markus and Arnup, 2010; Markus, 2010, 2011, 2012a).
The Scanlon Foundation survey findings are in large measure consistent with the long-run findings of other published surveys. Goot and Watson (2011) have identified 25 surveys on immigration conducted in the period 1999–2010, with considerable variance in question wording and methodology. The average of the 25 surveys is 52% in support of the current immigration level or support for increase, 43% in support of reduction and 5% uncertain (Goot and Watson, 2011: 23).
The AES, as noted, measures opinion in the aftermath of election campaigns. The AES employs a 5-point response scale and finds that of the six elections in the period 1996–2010, a clear majority favouring a reduction in immigration was obtained in just one survey, 1996, when 63% favoured reduction. In 1999 and 2010, opinion was almost evenly divided when allowance is made for the margin of sampling error. In the other three years (2001, 2004 and 2007–8) a majority favoured the current intake or its increase (see Table 3).
‘Do you think the number of immigrants allowed in Australia nowadays should be reduced or increased?’ (1996–2010).
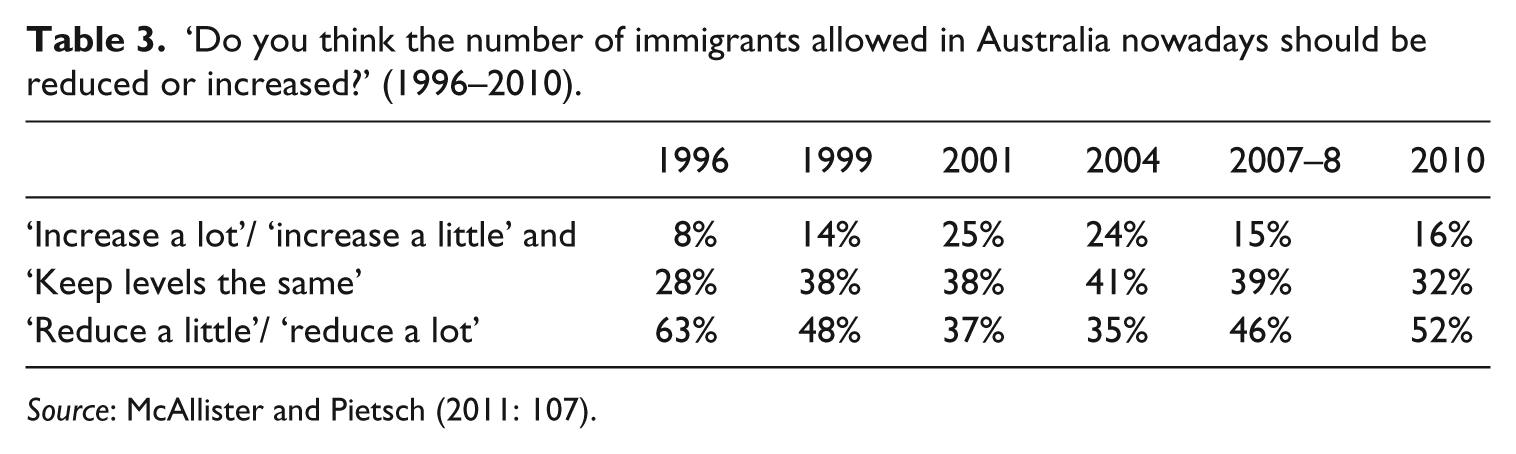
Source: McAllister and Pietsch (2011: 107).
Strength of opinion
In interpreting survey findings, it is of importance to consider strength of opinion. While a 3-point response scale does not allow for testing of strength, the 5-point scale employed by the AES does. Differentiating those who are of the view that immigration should be ‘reduced a lot’ and ‘reduced a little’ yields an almost even split, with the numerical value fluctuating with the level of support or opposition to immigration; thus in 1996, 34% favoured ‘reduce a lot’, 30% ‘reduce a little’; the relative proportions were 20% and 17% in 2001, 27% and 26% in 2010 (Table 4).
‘Do you think the number of immigrants allowed in Australia nowadays should be reduced or increased?’ (1996–2010).
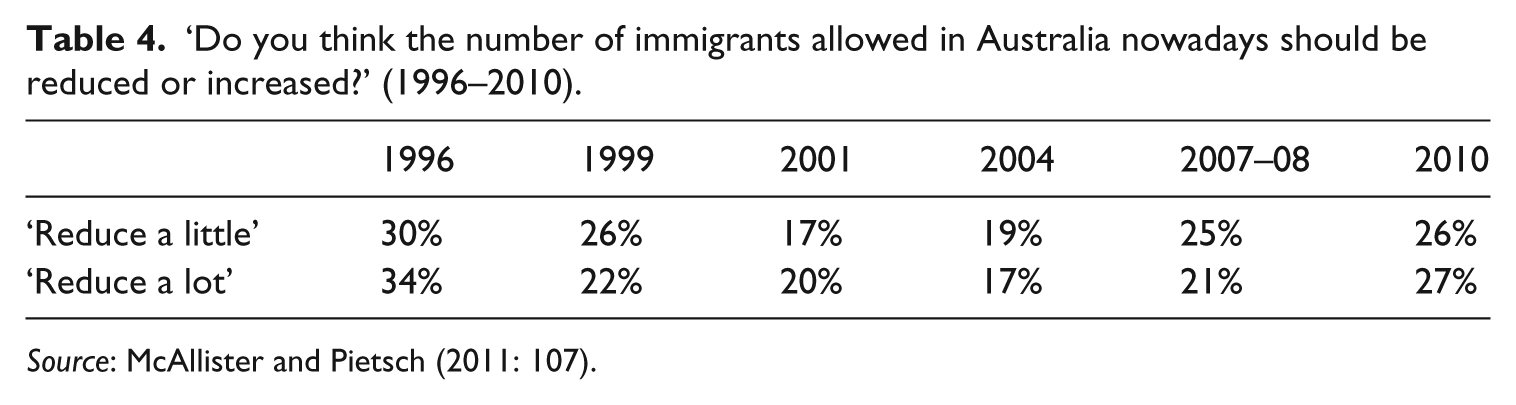
Source: McAllister and Pietsch (2011: 107).
Further scope to interpret strength of opinion is provided by questions on the relative importance of political issues. The AES specifies 13 prominent issues and asks respondents: ‘which has been the most important to you and your family during the electoral campaign?’ In the six election campaigns between 1996 and 2010, the proportion selecting immigration and population policy did not exceed 5%: over this period it was selected by 4.0%, 2.8%, 4.5%, 1.8%, 2.9%, and 1.0% (McAllister and Pietsch, 2011: 84).
Three Scanlon Foundation surveys asked respondents in an open-ended question for their perception of the ‘two most important problems’ (Markus, 2010, 2011) and ‘most important problem’ (Markus, 2012a) ‘facing Australia today’. Immigration and population issues were ranked first by 7%, 7% and 4% in the three surveys. Both the AES and Scanlon findings point to the relative insignificance of immigration issues in recent Australian politics.
Further insight into strength of opinion is provided by consideration of the proportion strongly opposed to immigration and cultural diversity. The following analysis utilises questions which (unlike questions on current levels of immigration) produce a large measure of consistency of response and which employ a 5-point response frame.
A general question posed by Scanlon Foundation surveys presented respondents with the proposition that ‘accepting immigrants from many different countries makes Australia stronger’. Across the five surveys, those who disagreed with the proposition were in the range 25–30%, with 8–11% indicating ‘strong disagreement’ (Table 5).
‘Accepting immigrants from many different countries makes Australia stronger’ (2007–12).

Change between 2011 and 2012 statistically significant at p<.05.
Source: Scanlon Foundation (Markus and Dharmalingam, 2008; Markus and Arnup, 2010; Markus 2010, 2011, 2012a).
Using a 5-point scale, the Scanlon Foundation surveys tested attitudes towards specific national groups. In all countries of immigration there is a hierarchy of ethnic preference. For much of the 20th century there was a large degree of consistency in the status hierarchy in Australia, with immigrants from the United Kingdom and other English-speaking countries ranked at the top, northern Europeans next, followed by other Europeans. Non-Europeans were denied entry for permanent residence until reforms between 1966 and 1973 brought the White Australia policy to an end (Markus, 1994).
The three Scanlon Foundation surveys conducted between 2010 and 2012 asked respondents for their attitude to immigrants from 15 specified countries. The highest level of negative sentiment was towards immigrants from Iraq and Lebanon. In 2012, 11% of respondents indicated that they were ‘very negative’ and 12% ‘negative’ towards immigrants from Iraq; 9% were ‘very negative’ and 13% ‘negative’ towards immigrants from Lebanon (Markus, 2012a).
The Scanlon Foundation surveys also considered attitudes towards faith groups as a way of obtaining additional evidence on Australian openness to diversity – and also to provide further insight into attitudes towards large immigrant groups of non-Christian background.
The 2010–12 surveys asked respondents for their attitude to members of the Christian, Buddhist and Muslim faiths. Across the three surveys, 5% or fewer respondents indicated that they were ‘very negative’ or ‘somewhat negative’ towards Christians or Buddhists, but a significantly higher 12–13% were ‘very negative’ towards Muslims and a further 11–12% ‘somewhat negative’.
Thus, in response to these three questions, 22–26% of respondents gave a negative response, with almost half selecting the strongest negative (Table 6).
Negative responses by selected question (2012).
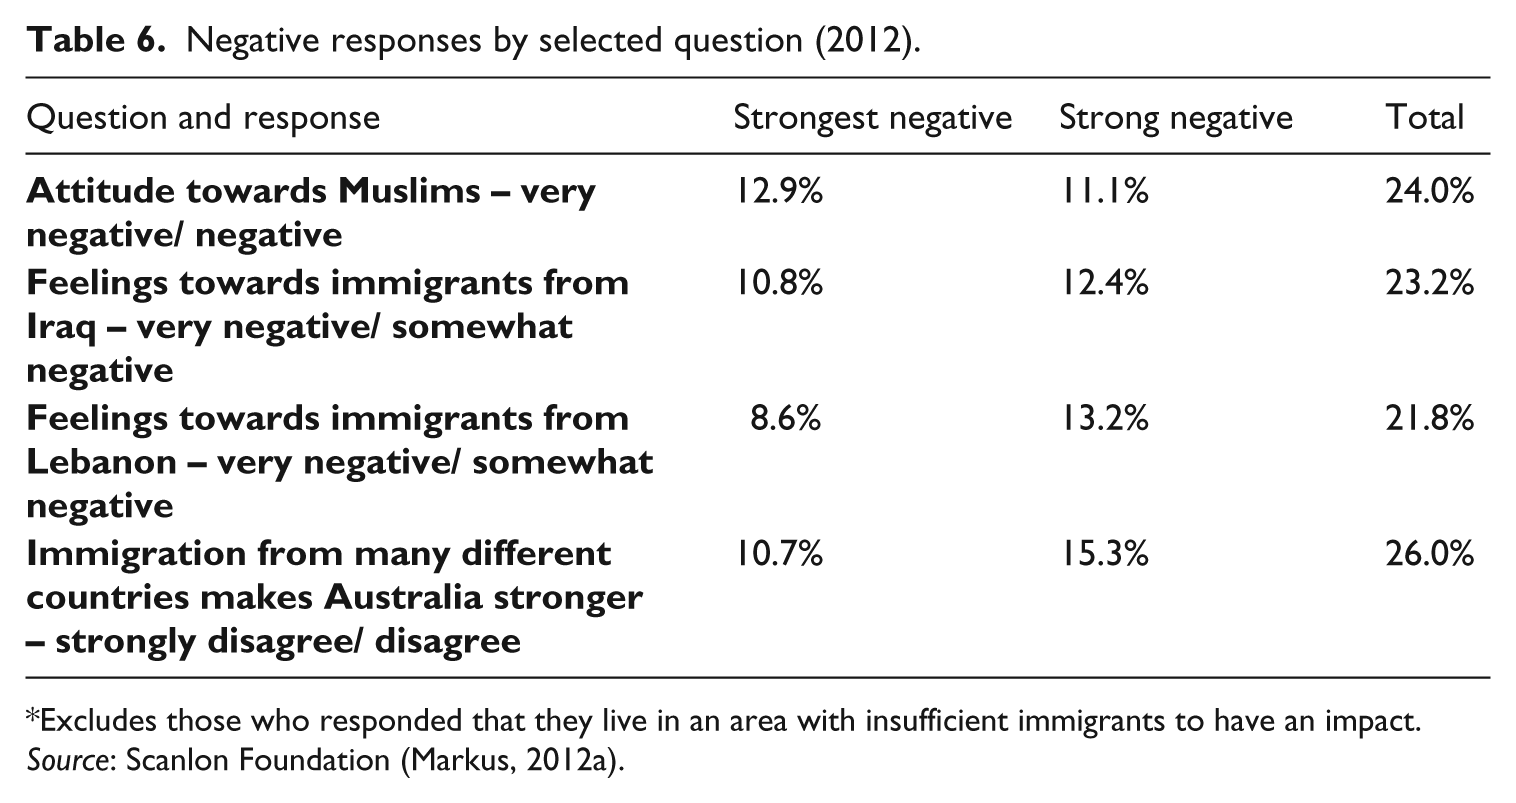
Excludes those who responded that they live in an area with insufficient immigrants to have an impact.
Source: Scanlon Foundation (Markus, 2012a).
While there can be no definitive measure of the level of strong opposition to a diverse immigration intake which increases cultural diversity in Australia, on the basis of Scanlon Foundation polling and a number of additional surveys conducted over the last 30 years there are indications that the level is close to 10% of the population. Using a broader definition (incorporating both the strongest negative and next negative response), rejection of cultural diversity reaches close to 25% of the population. However, on a polarised issue such as asylum policy, the level of strong negative sentiment alone can reach 25%.
These proportions represent the average across the population. There are heightened levels of opposition to immigration within specific demographics, with the variables of age, level of education, income and locality of residence producing statistically significant variation. Locality is discussed in the final section.
Areas of high immigrant concentration
The Scanlon Foundation surveys are distinctive in their tracking of attitudes not only at the national level, but also in areas of high immigrant concentration. Surveys were conducted in 2007, 2009 and 2012 in outer-urban areas of high immigrant concentration and low socio-economic status in Sydney and in Melbourne. The parallel national survey provided a reference point for evaluation of findings. In the following, analysis is focused on third-generation Australians, those born in Australia, with both parents born in Australia, and first generation Australians (overseas-born) of non-English-speaking background (NESB).
One key finding relates to attitudes to life in Australia. The Scanlon Foundation surveys, and other polling, have consistently found that a large majority of Australians have a high level of identification with their country, a fundamental prerequisite for a cohesive society. Almost unanimously, the national surveys have found that Australians express a sense of belonging (95% ‘to a great’ or ‘moderate’ extent in 2012), indicate pride in the Australian way of life (90%) and believe that its maintenance is important (91%). Less than 5% of respondents to the 2012 Scanlon Foundation national survey indicated that they had ‘slight’ or no sense of belonging (Markus, 2012a).
These findings are in large measure replicated in the 2012 survey in areas of high immigrant concentration. Thus among third-generation Australians, 96% in the national survey and 93% in the local survey indicate a strong sense of belonging; among NESB respondents, the proportions are 94% in the national and 86% in the local survey.
Of third-generation Australians, 91% consider that it is important to maintain the Australian way of life, an even higher 96% in the local survey; the proportions among NESB respondents are 93% in the national survey, 91% in the local.
There is also strong endorsement of the view that ‘Australia is a land of economic opportunity where in the long run, hard work brings a better life.’ In the 2007 national survey (Markus and Dharmalingam, 2008), 81% of respondents ‘strongly agreed’ or ‘agreed’, 82% in 2010, 81% in 2012. These views are consistent with international indicators, which rank Australia at or near the top of developed countries in terms of standard of living, education, health services and quality of life. Immigrants, presumably reflecting on their previous conditions of life, provide strong endorsement of Australia as a land of economic opportunity and social justice. Of third-generation Australians 76% in the 2012 national survey agreed with the proposition that Australia is a land of economic opportunity, 81% in the local survey; the level of agreement among NESB respondents in the national survey is 85%, in the local 81% (Markus, 2012a, 2012d).
When views of immigration are considered, support is lower in the local surveys. In 2012, in response to the question on the level of the immigration intake, 52% of third-generation Australians in the national survey considered that the level was about right or too low, 42% in the local. There is stronger support for immigration among NESB respondents, but again at a lower level in local survey: 64% are positive in national survey, 51% in the local. There is a similar pattern of response to the proposition that ‘accepting immigrants from many different countries makes Australia stronger’; 62% of third-generation Australians agreed in the national survey, 49% in the local; 73% of NESB respondents agreed at the national, 63% at the local (Markus, 2012a, 2012d).
With regard to levels of trust, sense of safety, experience of discrimination, political participation and involvement in voluntary work, there are consistently lower levels indicated in the local surveys.
When asked concerning experience of discrimination over the past year on the basis of ‘skin colour, ethnic origin or religion’, the reported level in 2012 was 10% for third-generation Australian and 11% for NESB respondents in the national survey, 18% for third-generation Australian and 23% for NESB in the local survey (Markus, 2012a, 2012d).
In response to the question, ‘generally speaking, would you say that most people can be trusted, or you can’t be too careful in dealing with people’, 52% of respondents in the national survey indicated that ‘most people can be trusted’. In marked contrast, in the local survey just 39% of third-generation Australian and 30% of NESB respondents agreed that ‘most people can be trusted’ (Markus, 2012a, 2012d).
The fact that these areas are also economically disadvantaged raises the question of whether the lower levels of trust and participation are more a consequence of poverty than cultural diversity.
In an influential 2007 article, Robert Putnam argued that ethnic diversity has a negative impact on social cohesion. Putnam’s argument was based on a United States survey of 30,000 participants, which was analysed using a range of bivariate and multivariate techniques. Putnam concluded that in areas of ethnic diversity there was, among other outcomes, lower confidence in ability to influence local decisions; less expectation that people will work together on community projects; lower likelihood of giving to charity or volunteering; lower indication of life satisfaction; and lower perception of quality of life. Putnam observed that ‘inhabitants of diverse communities tend to withdraw from collective life’, but the evidence did not establish that ethnic diversity led to ‘bad race relations’ or to ‘ethnically defined group hostility’ (2007: 150).
Using the 2012 Scanlon Foundation national and local surveys, economically disadvantaged areas of low ethnic diversity (less than 20% overseas-born) were compared with economically disadvantaged areas of high diversity (over 50% overseas-born). Economically disadvantaged areas were identified using the Australian Bureau of Statistics Socio-Economic Indexes for Areas (SEIFA), which provides a ranking of postcode areas in deciles, from rank 1 for the most disadvantaged to rank 10 for the least disadvantaged. Aggregated findings are reported, as the sample was not of sufficient size to permit comparison of third-generation Australian and NESB groups at the national and local levels for SEIFA 1–3 respondents.
Analysis of seven general questions related to neighbourhood and level of life satisfaction found lower levels of trust and participation, and higher levels of negativity, in the areas of high ethnic diversity. Thus 65% of respondents in high-diversity areas indicated low levels of trust (‘you can’t be too careful in dealing with people’), compared with 49% in the low-diversity areas; 28% of respondents in high-diversity areas disagreed with the proposition that ‘people are willing to help their neighbours’, compared to 16% in low-diversity areas. These findings support Putnam’s interpretation that ethnic diversity has a significant negative impact on social cohesion (Table 7).
Questions on neighbourhood, level of happiness, voluntary work – national survey in capital cities and local survey compared.

Source: Scanlon Foundation (Markus, 2012d).
The areas of high immigrant concentration present a complex and far from uniform picture: they are characterised by many positive findings, but also lower levels of trust and sense of safety, lower levels of political participation and involvement in voluntary work, and heightened experience of discrimination. There is also evidence of heightened disaffection and negative valuation of the impact of immigration among a minority of third-generation Australians in high-diversity areas.
Footnotes
Funding
The research on which this article is based has attracted funding support from the Scanlon Foundation.