
Abstract
We present a unified framework able to fit the entire quantile process, namely to estimate simultaneously multiple non-crossing quantile curves. The framework relies on assuming each regression parameter varies smoothly across the percentile direction according to B-splines whose coefficients obey proper restrictions. Multiple linear and penalized smooth terms are allowed and the corresponding tuning parameters are estimated efficiently as part of the model fitting. Monotonicity and concavity constraints on the smoothed relationships are also easily accounted for in the framework. Simulation results provide evidence our proposal exhibits good statistical performance with respect to competitors while guaranteeing the non-crossing property and modest computational load. Analyses on a real dataset related to vocabulary size growth are presented to illustrate the model capability in practice.
Introduction
Before going into article, as the first author, I would like to write a few words to remember prof. Brain Marx. I owe a lot to Brian, since I started attending the International Workshop on Statistical Modelling (IWSM) in 1999. Brian, just as he used to do with all new participants at the meeting, was always hospitable and friendly, at all subsequent workshops, contributing greatly to my continued participation in the conference. Brian was also my biggest supporter when I became chair of the Statistical Modelling Society in 2017. A preliminary version of this article was presented at IWSM 2019 in Guimaraes, Brian’s last meeting: some of the improvements were inspired by discussions with him during coffee breaks. Brian, you have left an unbridgeable void in the IWSM family, but your work in promoting statistical modelling and welcoming and engaging young students will continue. Thank you Brian for all your work. We miss you a lot!
Quantile regression (qr) (Koenker and Bassett, 1978; Koenker, 2005; Kneib, 2013) allows to estimate the effect of one or more covariates on the specified quantile of the conditional response distribution. Estimation of a single quantile curve does not pose any particular complication, but sometimes the focus is on estimating and managing multiple quantile curves: typical examples include the so-called ‘growth charts’ or ‘reference values’ where, for a specific problem at hand, the units have to be classified into ’normal’, ’over-’ or ‘under-’ taking the fitted quantiles as reference values. The most popular growth charts concern the ones for the growth of height, weight and other anthropometric measures in children (Borghi et al., 2006). Some less known successful applications of qr include Posidonia oceanica seagrass (Tomasello et al., 2016), for the forced expiratory volume (Kim et al., 2018), sport performance (Sandercock et al., 2016), and vocabulary developments (Frank et al., 2017). However, a well-known problem when dealing jointly with multiple quantiles is that of so-called crossing curves. Namely, any two, even quite close, estimated quantile curves should not cross each other along the covariate range in order to preserve the corresponding inequality in the population. Unfortunately crossing quantile curves can frequently occur, especially in small or moderate samples with sparse data and a nonlinear relationship to be estimated. Such a problem can lead to unpleasant consequences when the fitted model is used for prediction or classification (e.g., Wei et al., 2006).
Several authors have proposed solutions to fix the crossing issue in quantile regression. He (1997) discusses a location-scale shift model that avoids crossing while maintaining sufficient flexibility; Shim et al. (2009) propose to estimate location and scale functions simultaneously using doubly penalised kernel machines to achieve non-crossing; Chernozhukov et al., (2009) use the Lorentz inequalities and their generalizations; Bondell et al. (2010) set proper inequality constraints at the observed covariate values; Muggeo et al. (2013) achieve non-crossing by fitting sequentially the quantile regressions with inequality constraints to prevent non-crossing between two consecutive curves.
Schnabel and Eilers (2013) and Frumento and Bottai (2016) take a different approach by imposing a global structure for the quantile curves, rather than estimating them individually. In other words, they estimate the entire quantile process, and the curves at specific percentile levels can be ‘predicted’ afterwards. Schnabel and Eilers (2013) use the tensor product of B-splines to model the ‘surface’ defined over the (necessarily continuous) covariate by percentiles plane. Such surface—or ‘sheet’ as called by the authors—is fitted via iterative weighted least squares by putting two penalties on both covariate and percentile directions, which only reduces and does not eliminate the chance of occurrence of non-crossing. Frumento and Bottai (2016) exploit a similar perspective: they assume each covariate effect with respect to the percentile follows a polynomial or any specified parametric function, and they fit the model by minimizing an integrated loss function via a Newton-like algorithm. Their proposal has been extended to variable selection problems (Sottile et al., (2020) and nonlinear relationships (Bottai and Cilluffo, (2020). However, as in the aforementioned quantile sheet, this approach discourages but does not eliminate non-crossing, and further post-fit adjustments are requested to enforce a non-crossing fit (Sottile and Frumento, 2023).
Quite a different strategy to obtain non-crossing curves is represented by the lms method (Cole and Green, 1992), which is probably the oldest among different approaches, and the most widespread in some fields, especially in anthropometry. Here we fit a sub-regression model for each parameter of a specified response distribution, traditionally the Box-Cox-Normal or t distributions, and non-crossing quantile curves are obtained straightforwardly via the quantile function of the assumed model (Stasinopoulos and Rigby, 2007; Stasinopoulos et al., 2017). The key point is the appropriate selection of the response distribution: several alternatives could be undertaken, notably the Box-Cox-power-exponential, which has 4 parameters and it is the most flexible distribution able to account for any type of kurtosis. Several growth charts for World Health Organization have been produced by means of the lms method within the gamlss framework (Borghi et al., 2006).
Of course, there are a plenty of proposals relying on the Bayesian paradigm, such as Das and Ghosal (2018) and Yang and Tokdar (2017). While the Bayesian approach is able to provide satisfactory results, it requires specification of the priors and therefore it could not be favoured by practitioners. We do not discuss the Bayesian approaches in this article.
In this work we take an approach similar to Schnabel and Eilers (2013) and Frumento and Bottai (2016) by focussing on the entire quantile process. Namely, we aim to estimate jointly multiple non-crossing quantile curves depending on several linear and smooth terms via penalized splines with automatic and efficient ‘selection’ of the tuning parameters.
The rest of the article is organized as follows. In Section 2 we describe our proposal in detail, and in Section 3, we show results from simulation studies. Section 4 is devoted to the real data analysis and finally, Section 5 includes discussion and conclusions.
Methodology
Let
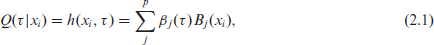
where
Since we have the entire quantile process as focus, we aim to estimate simultaneously quantile curves at percentiles

Section A.1 of Supplementary Material includes a simple example about

Note we now estimate
Non-crossing is obtained when the inequality

Expressing the constraints via the first derivatives, allows to manage them more clearly as B-splines of degree

where

which makes clear that, in addition to the inequalities on the
Notice that making identifiable the bases turns out crucial when several smooth terms are included in the quantile regression equation, see section 2.4.
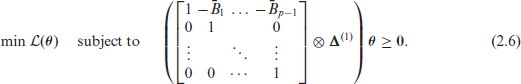
Optimization of the constrained objective (2.5) or (2.6) prevents non-crossing curves when a B-spline basis is employed with no additional constraint on its coefficients. In the spirit of


where the last compact form assumes that the same difference order
where
The traditional approach to tune the smoothing parameter
As an alternative to SIC to select

The numerator is just the overall unpenalized fidelity
Quantifying the model complexity is a crucial step in model selection. Both the SIC and the HFS step in (2.10) need some measure of
To quantify the
Extending the model: multiple linear and smooth terms
We write the qr equation with

Again, such

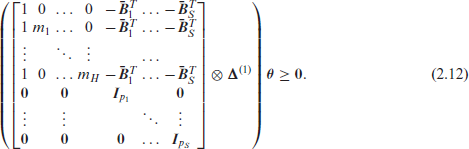
When in addition to the
If penalties on the basis coefficients are included, model estimation at fixed

where
To obtain the estimates variance matrix

Notice it is unnecessary to estimate the sparsity function or to rely on numerical approximations such as ‘Hendricks-Koenker’ or ‘Powell’ (Koenker, 2005, pages 79–80) used when a single qr is fitted. Indeed formula (2.14), via the
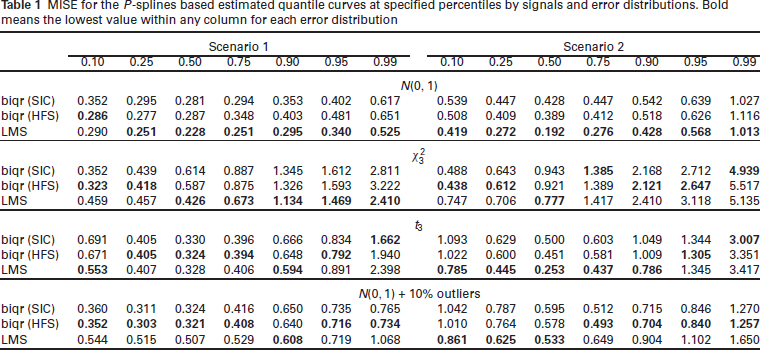
We ran extensive simulations to assess how our proposed framework performs empirically. The performance is expressed by the MISE (mean integrated square error) defined as average (over the covariate space and the replicates) of the squared differences between true and fitted quantiles. In the first batch of simulations, we aim to assess how the quantile estimates depend on the number
In the second batch of simulations, we aim to compare our proposal with respect to some competitors when the relationship is both linear and nonlinear. Results for the linear case are reported in section C.1 of Supplementary Material. For the nonlinear case, data have been simulated according to
MISE for the P-splines based estimated quantile curves at specified percentiles by signals and error distributions. Bold means the lowest value within any column for each error distribution
MISE for the P-splines based estimated quantile curves at specified percentiles by signals and error distributions. Bold means the lowest value within any column for each error distribution
We apply the proposed B-spline integrated quantile regression to the Children’s vocabulary development. The Wordbank data (
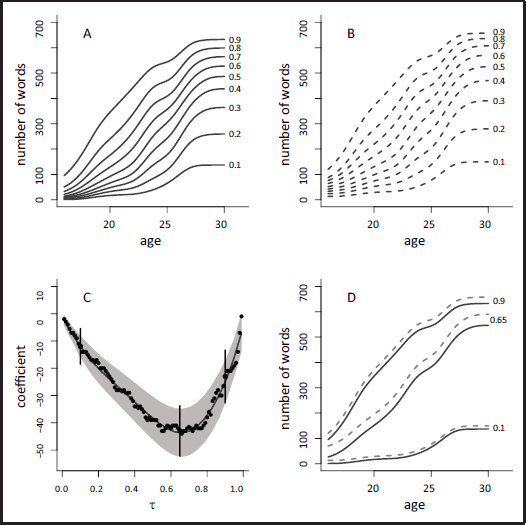
Figure 1 summarizes the model fits where we report the estimated quantile curves for males and females (panels A and B) and the
Panels A and B: Some estimated quantile curves for males (A) and females (B). Panel C:
-varying effect of the linear coefficient of sex with corresponding 95% pointwise confidence intervals. The points refer to the estimates from qr models fitted separately with the three bars representing the 95% confidence intervals at the three
values
. Panel D: Three quantile curves for males (continuous lines) and females (dashed lines): the largest distance between corresponding quantile curves is at about
, when the sex coefficient gets the largest effect (in absolute value)
We have presented a unified framework to estimate the quantile process, that is, multiple quantile curves simultaneously when the non-crossing constraints are requested; while
Supplementary Material online includes further discussion and simulation results on the proposed framework, including fitting of discrete data following discussion of Frumento and Salvati (2021).
Supplementary materials
Supplementary materials for this article are available online.
Supplemental Material for Joint modelling of non-crossing additive quantile regression via constrained B-spline varying coefficients by Vito M.R. Muggeo, Gianluca Sottile, Giovanna Cilluffo, in Statistical Modelling
Footnotes
Acknowledgment
We would like to thank the Editor who handled the manuscript, Paul Eilers, for his careful reading and the referees whose suggestions greatly improved the article.
Declaration of Conflicting Interests
The authors declared no potential conflicts of interest with respect to the research, authorship and/or publication of this article.
Funding
The authors gratefully acknowledge financial support from the University of Palermo (FFR2022-23).
References
Supplementary Material
Please find the following supplemental material available below.
For Open Access articles published under a Creative Commons License, all supplemental material carries the same license as the article it is associated with.
For non-Open Access articles published, all supplemental material carries a non-exclusive license, and permission requests for re-use of supplemental material or any part of supplemental material shall be sent directly to the copyright owner as specified in the copyright notice associated with the article.