
Abstract
The purpose of this paper is to build an analysis model of digital economy collaborative governance by using backpropagation (BP) algorithm driven by big data, to evaluate the economic development level of the city, and to provide suggestions for the future development of the city. This paper aims at the economic development level of eight urban areas in S city and compares the economic development level of each urban area from 13 basic indicators in four aspects: economic benefit, innovative development, people’s life, and sustainable development. This paper constructs a three-layer BP neural network model, scores the economic development level of each urban area, and puts forward a reasonable plan for the future urban construction of S city according to the comprehensive score. The results show that this research model has high accuracy in evaluating the economic development level of each urban area, which is consistent with the actual development situation. Therefore, the analytical model established in this paper utilizes the BP algorithm to precisely assess the urban economic development level. It offers optimized strategies for collaborative governance in the context of a big data-driven urban digital economy. This effective approach aims to achieve the collaborative governance objectives for urban digital economies, serving as an experimental reference for similar research in other cities.
Introduction
Research background and motivation
The complexity and dynamics of the economic evaluation system means that at different stages of economic development, 1 the degree of correlation and influence among various economic indicators and variables will change, and this change is very complex and dynamic. 2 This complexity and dynamics mean that a more scientific method is needed to measure the high-quality economic development level and determine the weight of each index. 3 The traditional evaluation method usually adopts the method of artificially determining the index weight. However, this method is easily influenced by subjective factors, because different people may have different opinions and preferences. 4 Such an evaluation method may lead to the deviation of index weights, thus affecting the accuracy and fairness of evaluation results. 5 Therefore, there is a need to investigate a more objective and scientific approach to determine the index weights.
Artificial neural network (ANN) is a computational model that can simulate the nervous system of human brain, 6 and it can realize the modeling and analysis of nonlinear relations by learning and adjusting weights. 7 In the economic evaluation system, ANN can be used to train the model and automatically determine the weight of each index to reduce the influence of human subjective factors and better reflect the fairness and accuracy of the index. By using ANN, people can better understand the nonlinear relationship of economic system, 8 and thus get more accurate and objective evaluation results. In addition, the ANN can also process a large number of complex data, thus better reflecting the changes and trends of the economic system. 9 Therefore, under the background of big data, the application of BP algorithm in collaborative governance of digital economy is worth studying.
Research objectives
Digital economy is the main trend of current economic development. 10 Collaborative governance of digital economy is an important guarantee for the development of digital economy and plays an important role in promoting the development of digital economy. 11 Therefore, the purpose of this paper is to evaluate the economic development level of eight urban areas in S city by establishing an analysis model of collaborative governance of digital economy, and to formulate a reasonable collaborative governance plan of digital economy to promote the development of digital economy in S city.
In order to achieve the above research objectives, based on big data technology, this paper obtains the relevant data of eight urban areas of S city through data preprocessing and feature extraction. By using BP algorithm, an analysis model of digital economy collaborative governance is established to evaluate the economic development level of eight urban areas in S city. 12 In the process of establishing the model, this paper also normalizes the relevant data to improve the accuracy and stability of the model. 13
Finally, according to the model evaluation results, this paper formulates a reasonable collaborative governance plan for digital economy to promote the development of digital economy in S city. This will help to improve the overall level of digital economy development in S city, promote the application and innovation of digital technology, 14 and improve the quality of life and economic welfare of citizens. 15 Meanwhile, the research results of this paper can also provide reference for the planning of collaborative governance of digital economy in other regions.
Literature review
When evaluating the level of economic development, experts are usually used to determine the weight of each index, but this evaluation method will be influenced by human subjective factors and cannot well reflect the fairness of the index. The development and application of ANN provides a direction to overcome this problem. 16
Some scholars apply ANN to the study of high-quality economic development to get more objective empirical results. For example, Luo et al. (2022) combined heating network with ANN to dispatch low-carbon economy of regional comprehensive energy system, and the results showed that neural network had high accuracy in economic dispatch prediction. 17 Zhang et al. (2022) combined the optimization algorithm with neural network to predict and evaluate carbon emissions and eco-economy, showing the wide application of optimization algorithm and neural network in economic prediction. 18 Li et al. (2023) studied the prediction of neural network in financial management risk of listed companies under digital economy and combined digital economy with neural network to better help listed companies avoid risks. 19 Yang et al. (2021) optimized the evaluation model of BP neural network teaching management and put forward suggestions for the development of network teaching according to the evaluation model. 20 Through the research and analysis of the above scholars, ANN has certain application potential in economic development evaluation, which can help better understanding and evaluating the state and trend of economic development. However, the research on high-quality economic development through BP neural network is rare.
To sum up, the innovation of this paper lies in the introduction of BP algorithm and the construction of an analysis model for the collaborative governance of urban digital economy driven by big data. Finally, the comprehensive evaluation results analysis furnishes valuable insights and optimization suggestions for the future development and planning of the city.
Construction of collaborative governance analysis model of digital economy based on BP algorithm
The principle of BP algorithm
Artificial neural network (ANN) is a computational model based on the structure and function of biological neurons,
21
which is composed of multiple neurons and can be used to solve various problems. The specific classification is shown in Figure 1. Classification of neural network algorithms.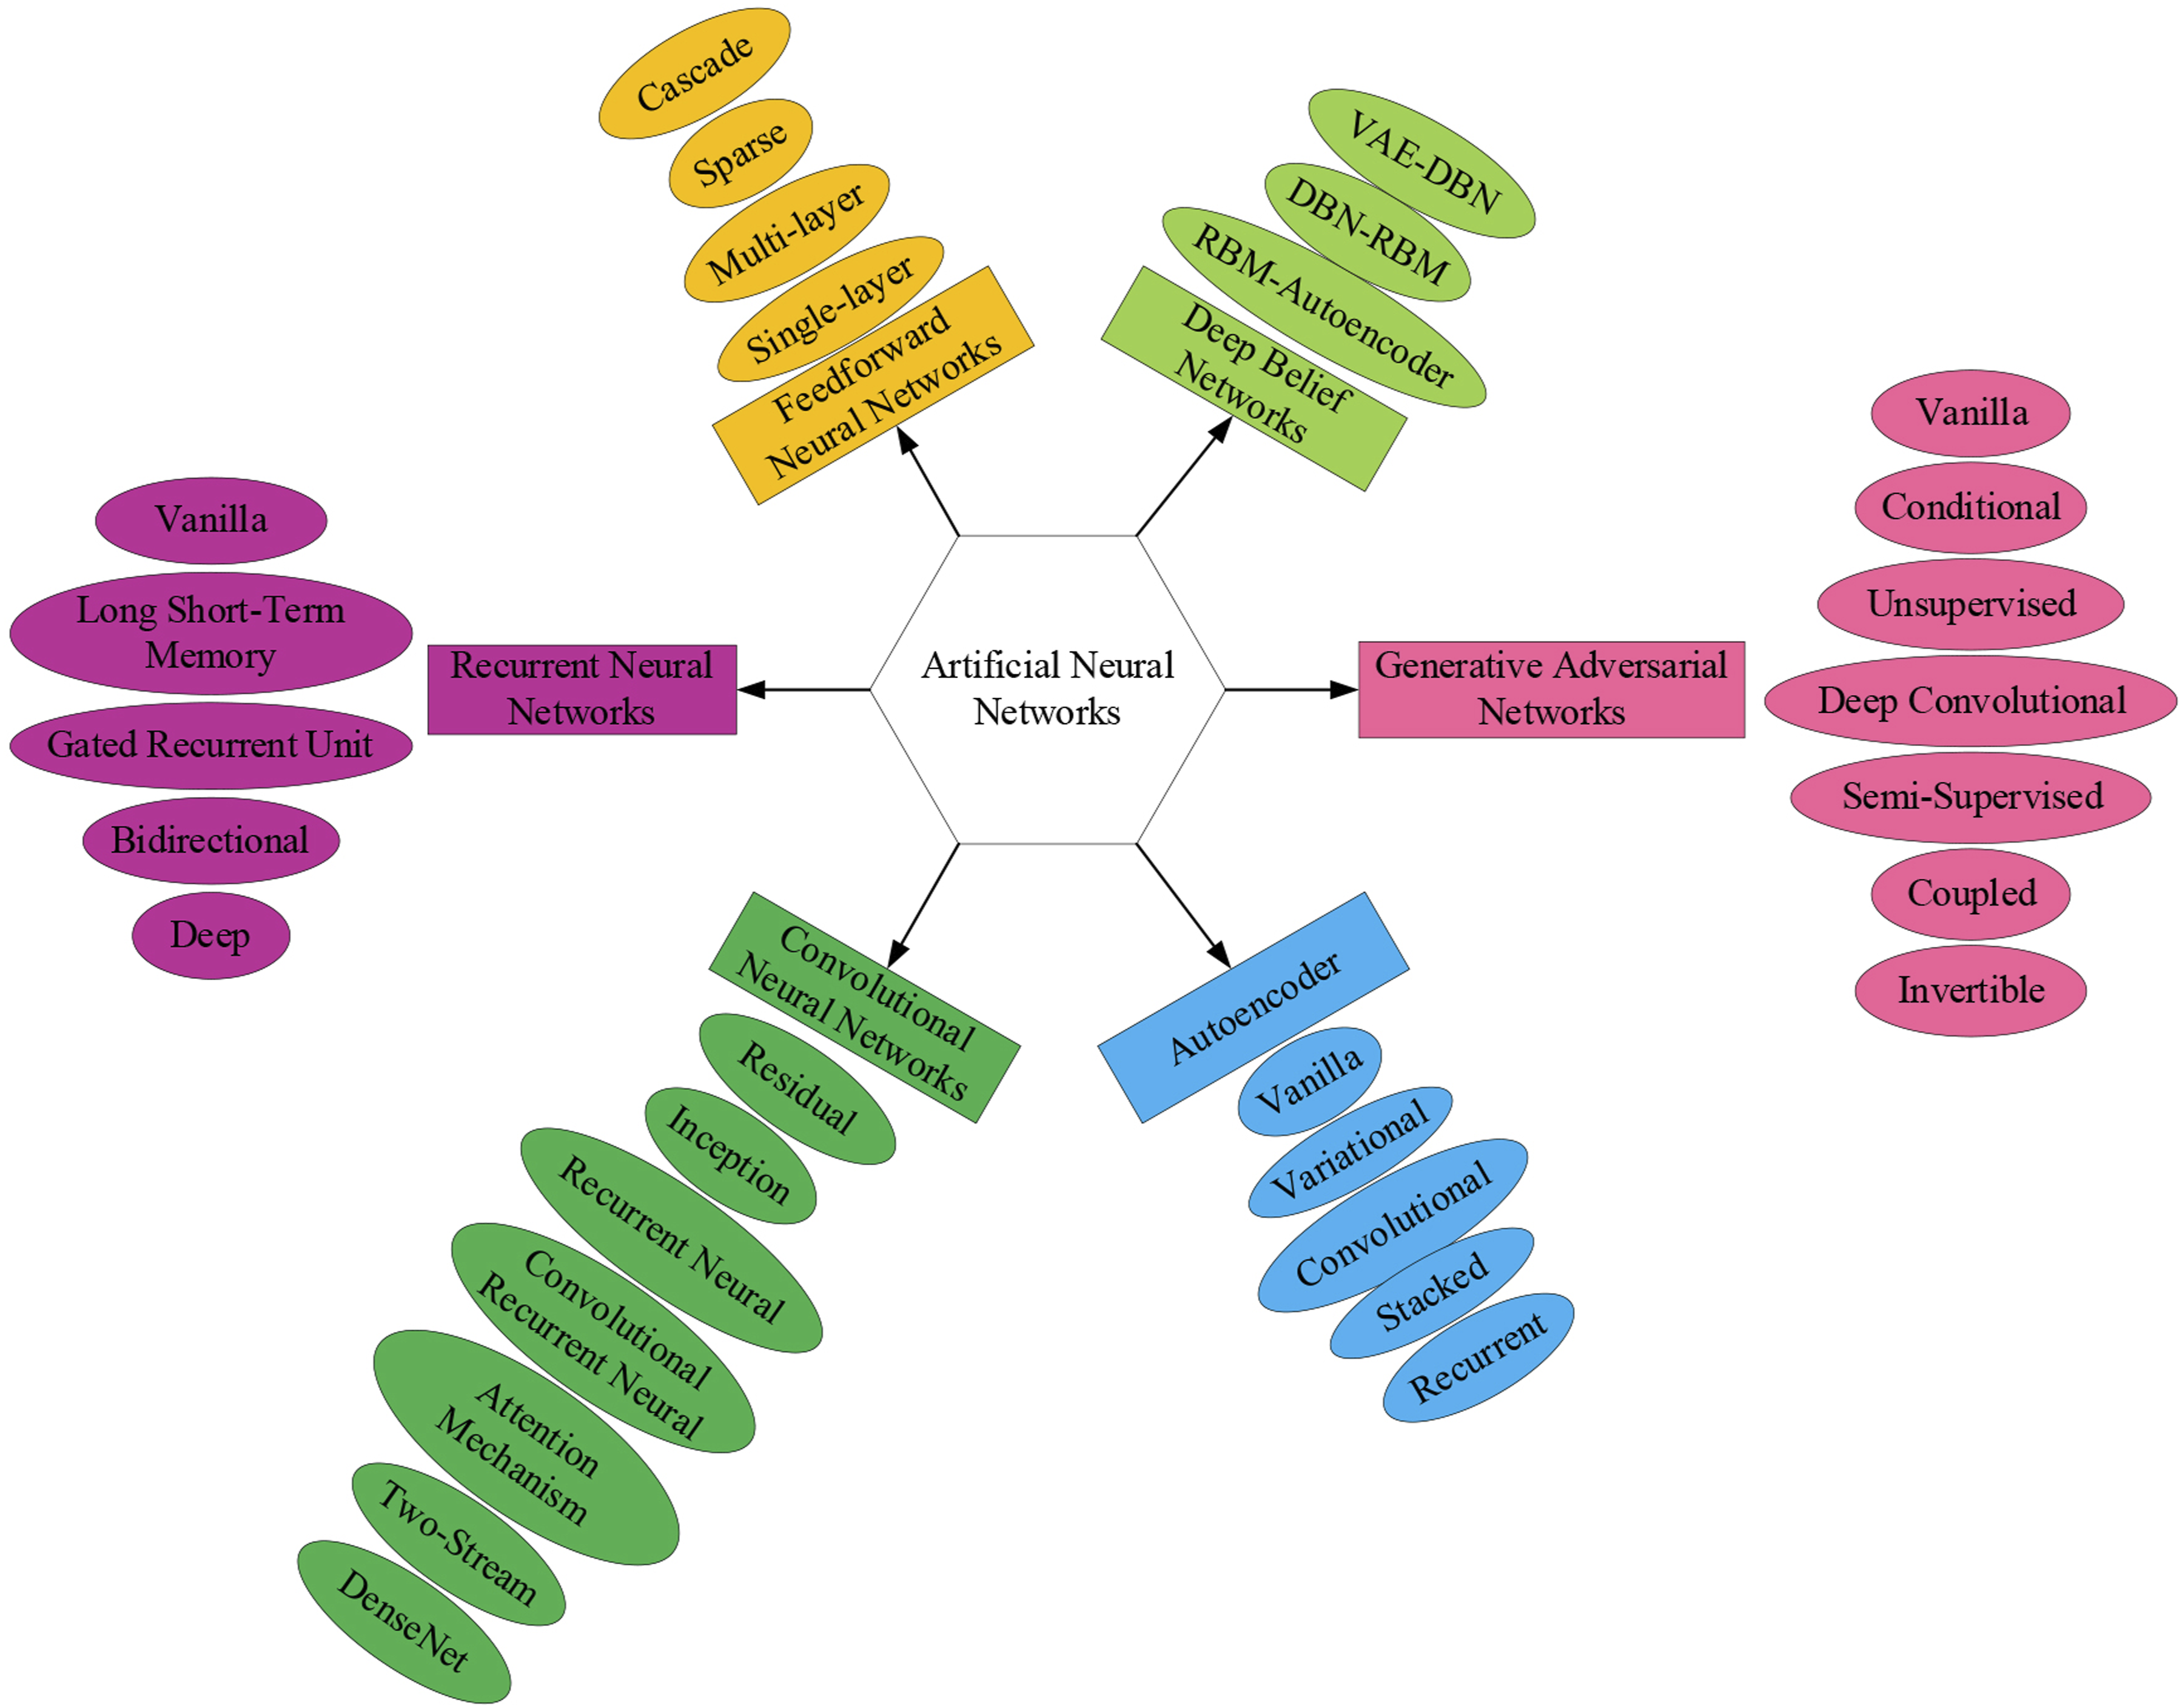
It encompasses six major categories: feedforward neural networks, recurrent neural networks, autoencoders, generative countermeasure networks, attention mechanisms, and various other types of neural networks like deep confidence networks, convolutional self-encoders, and generative adversarial networks. 22 BP algorithm is an algorithm for training artificial feedforward neural networks. 23 The algorithm can approach the expected output by constantly adjusting the weight and bias of the neural network. Its core idea is to adjust the weight and bias of neural network through back propagation error. 24
Research object and data source
Being a small and medium-sized city with growth potential, the significance of the digital economy in driving local economic development has become increasingly noticeable. The current status and future trajectory of the digital economy industry in S city serve as indicators of the broader characteristics and trends of digital economy development in small and medium-sized cities. This holds particular representativeness and reference value for the coordinated governance of the digital economy in such cities. Therefore, examining S city as a case study for the collaborative governance model of the digital economy can offer insights applicable to the development of the digital economy in other small and medium-sized cities.
In this paper, eight urban areas in S city, including areas A, B, …, H, are taken as the research object, and the research period is from 2017 to 2022. The relevant data are mainly from the relevant statistical yearbooks of S city. There are four aspects to be considered in the collaborative governance of digital economy, namely, economic benefits, innovative development, people’s life, and sustainable development. In these four aspects, it is necessary to evaluate the effectiveness of collaborative governance of digital economy through some key indicators. The collected social data of each urban area, including policies and regulations, public opinion, public response and other data, are analyzed, and then data mining and prediction are carried out through BP algorithm. It can analyze and predict the development environment and trend of digital economy and finally provide scientific decision support for collaborative governance of digital economy.
Data preprocessing and feature extraction
In this paper, because there are many indicators involved, the dimensions of each indicator are different, and there may be huge differences between different urban areas. In order to solve these problems, the normalization method is used to de-dimension the relevant data. 25 The data is converted into real numbers between 0 and 1 by normalization method, which effectively eliminates the gap between the index dimension and each urban area, helps to improve the accuracy of the established network model, and avoids the problem of difficult convergence or falling into local optimal value. This processing step provides a reliable data base for the follow-up research.
For positive indicators:

For negative indicators:

Establishment of algorithm model
The understanding of BP neural network can be roughly divided into two stages, and its algorithm flow is shown in Figure 2. BP neural network algorithm flow.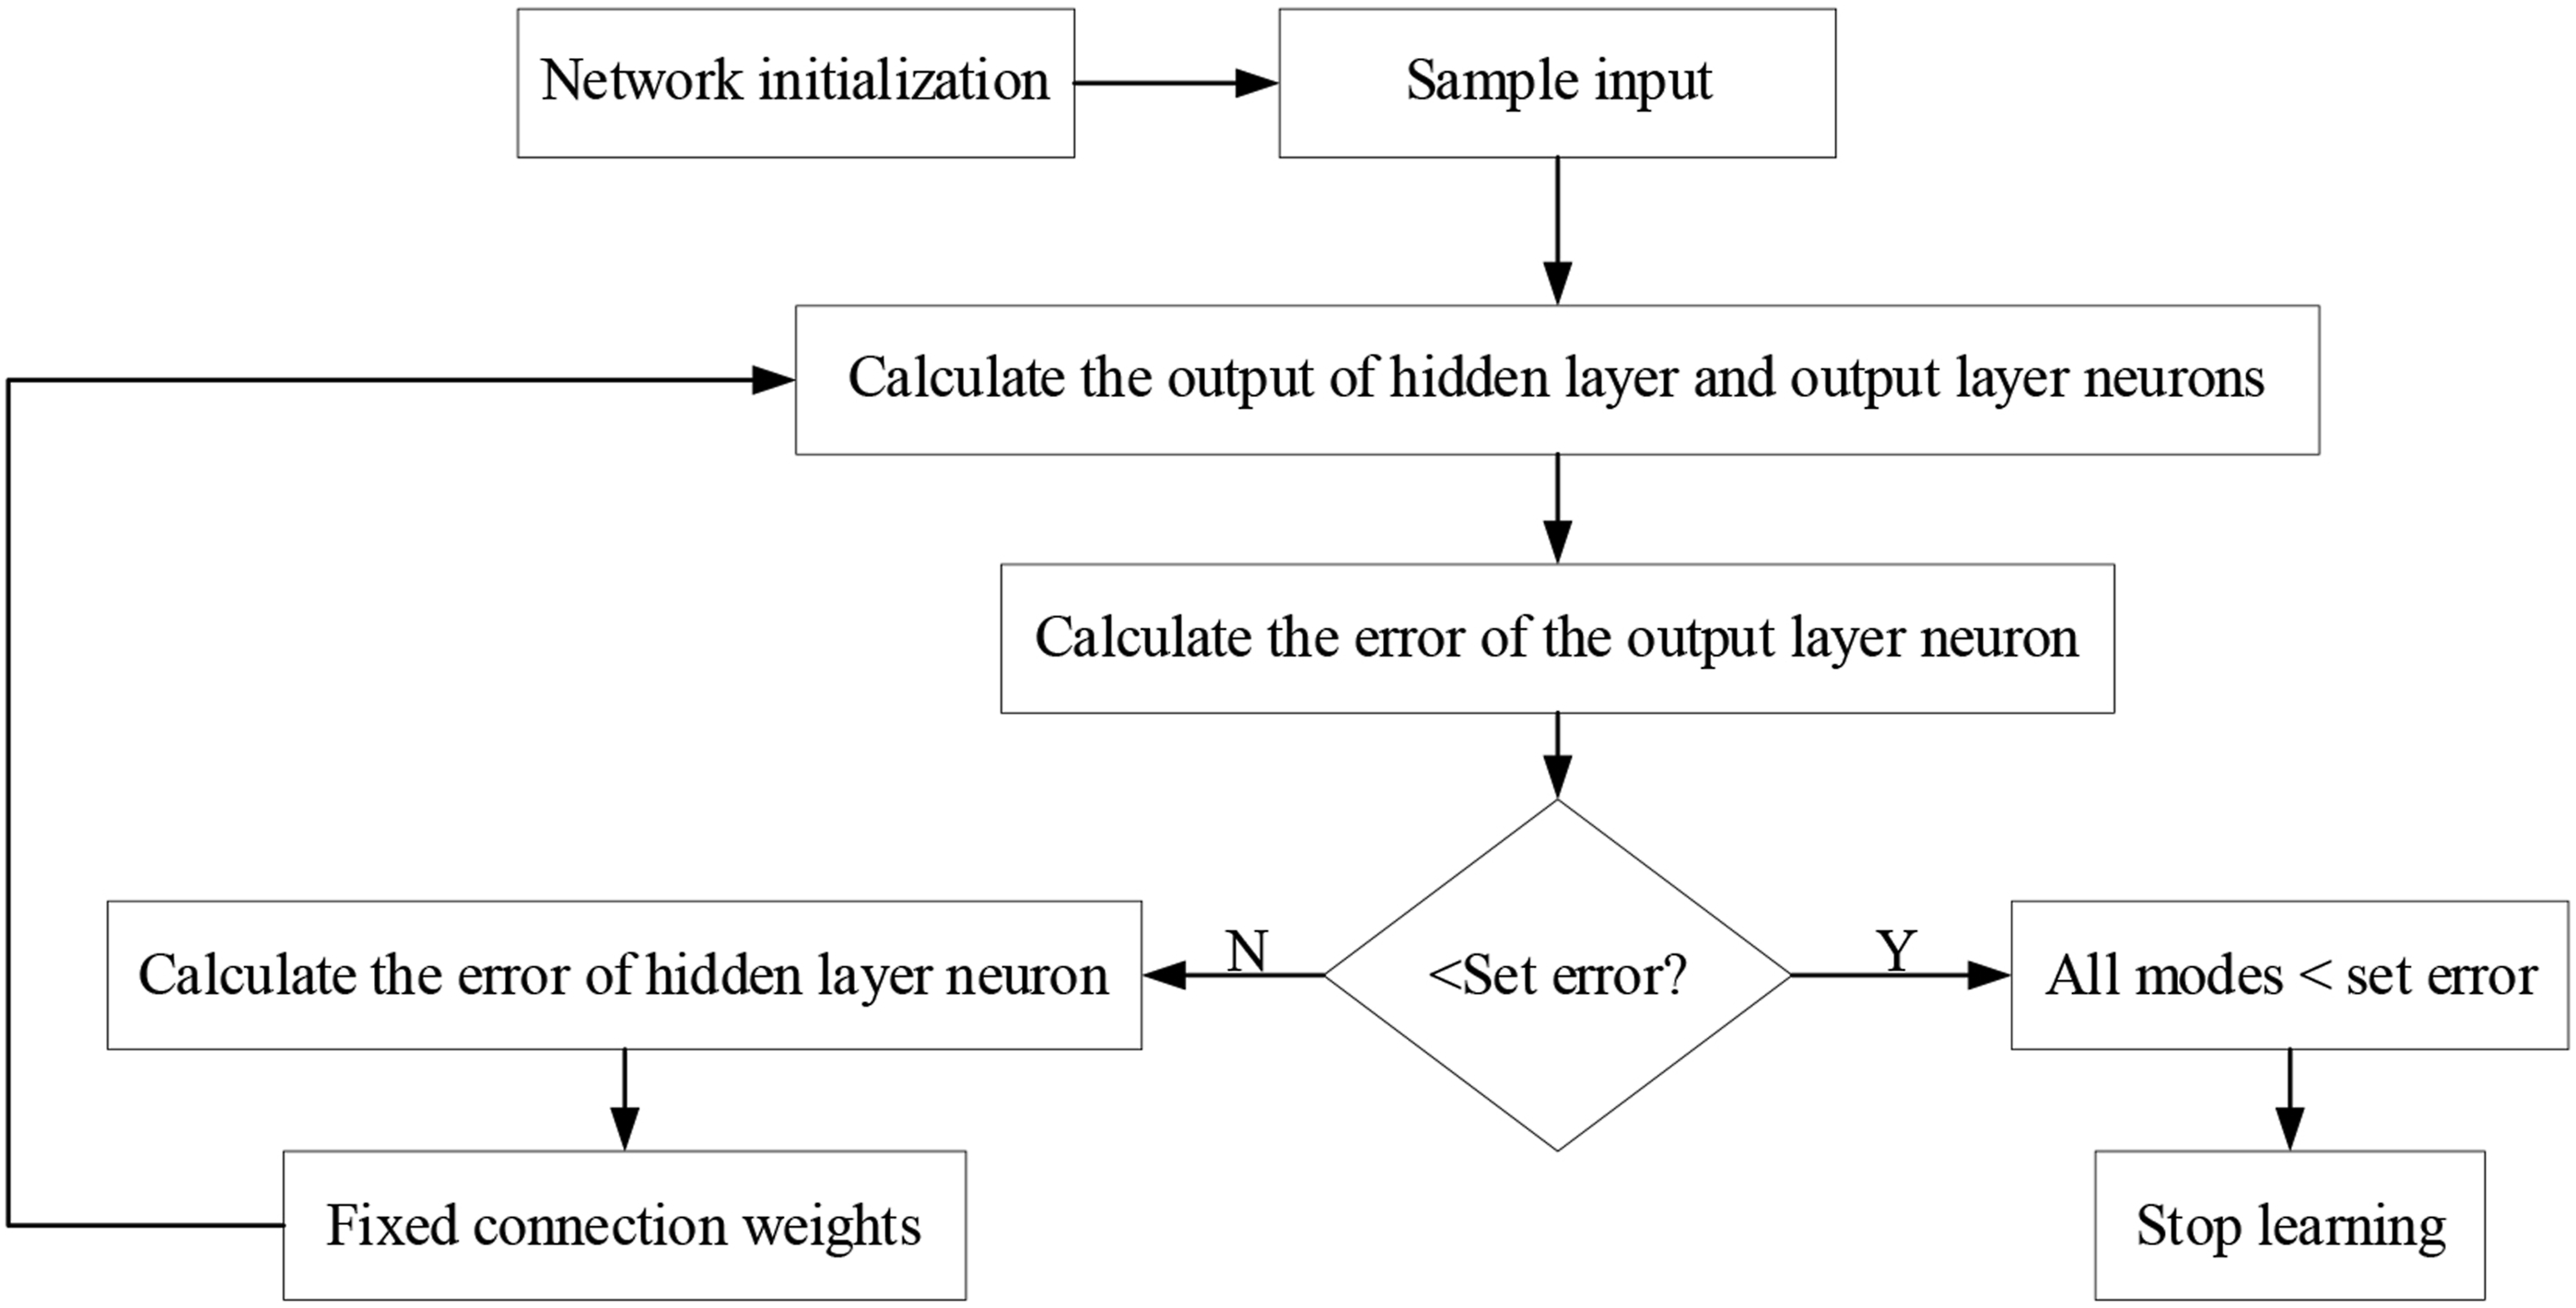
The learning algorithm of BP neural network is mainly divided into four stages: iterative calculation of threshold and weight: input the input data samples into the network and perform iterative calculation within the set network to get the iterative values of threshold and weight. 26 Approximation correction: within the set parameter range, the obtained threshold and weight are approximated and corrected. These two processes alternate until the values within the network converge. Error back propagation: After the values in the network converge, the error will be transmitted back layer by layer, and the weights and thresholds of each layer will be corrected reversely, which is called error back propagation. 27 This process enables the network to learn the characteristics of input samples and gradually reduce the error. Convergence judgment: judge whether the output error of the network is less than the set error threshold. If the error is less than the set threshold, stop learning. Otherwise, repeat steps 2 and 3 until the error reaches the set threshold. 28 After completing the above four stages, the network will get appropriate connection weights, which can be used for nonlinear mapping of new samples. 29
The forward transmission of information
Assume that the BP network has M layers, for a given m samples, the expected output of the network is:

After m samples are input, the jth neuron in the first (l = 1, 2, …, L-1) layer in the network represents:


Among them, the parameters are defined as follows.
For the output layer, there are:

The purpose of neural network learning is to realize the learning of each sample.

The number of output nodes is p, and when p is minimum, the error E is minimized.

Weight calculation by gradient descent method
Coefficient equation of initial layer:


Make

Model verification and evaluation
Parameter setting and index evaluation
In this paper, a three-layer BP neural network model is constructed.
30
The parameters are set as follows: there are 13 nodes in the input layer, 4 nodes in the middle layer, and 1 node in the output layer.
31
The training function is a gradient descending training function, the learning rate is 0.05, the maximum training times is 1000 times, the target error is 0.005, and the target error is 0.005. The specific classification of the evaluation system of economic quality development level is shown in Figure 3. Evaluation system of economic quality development level.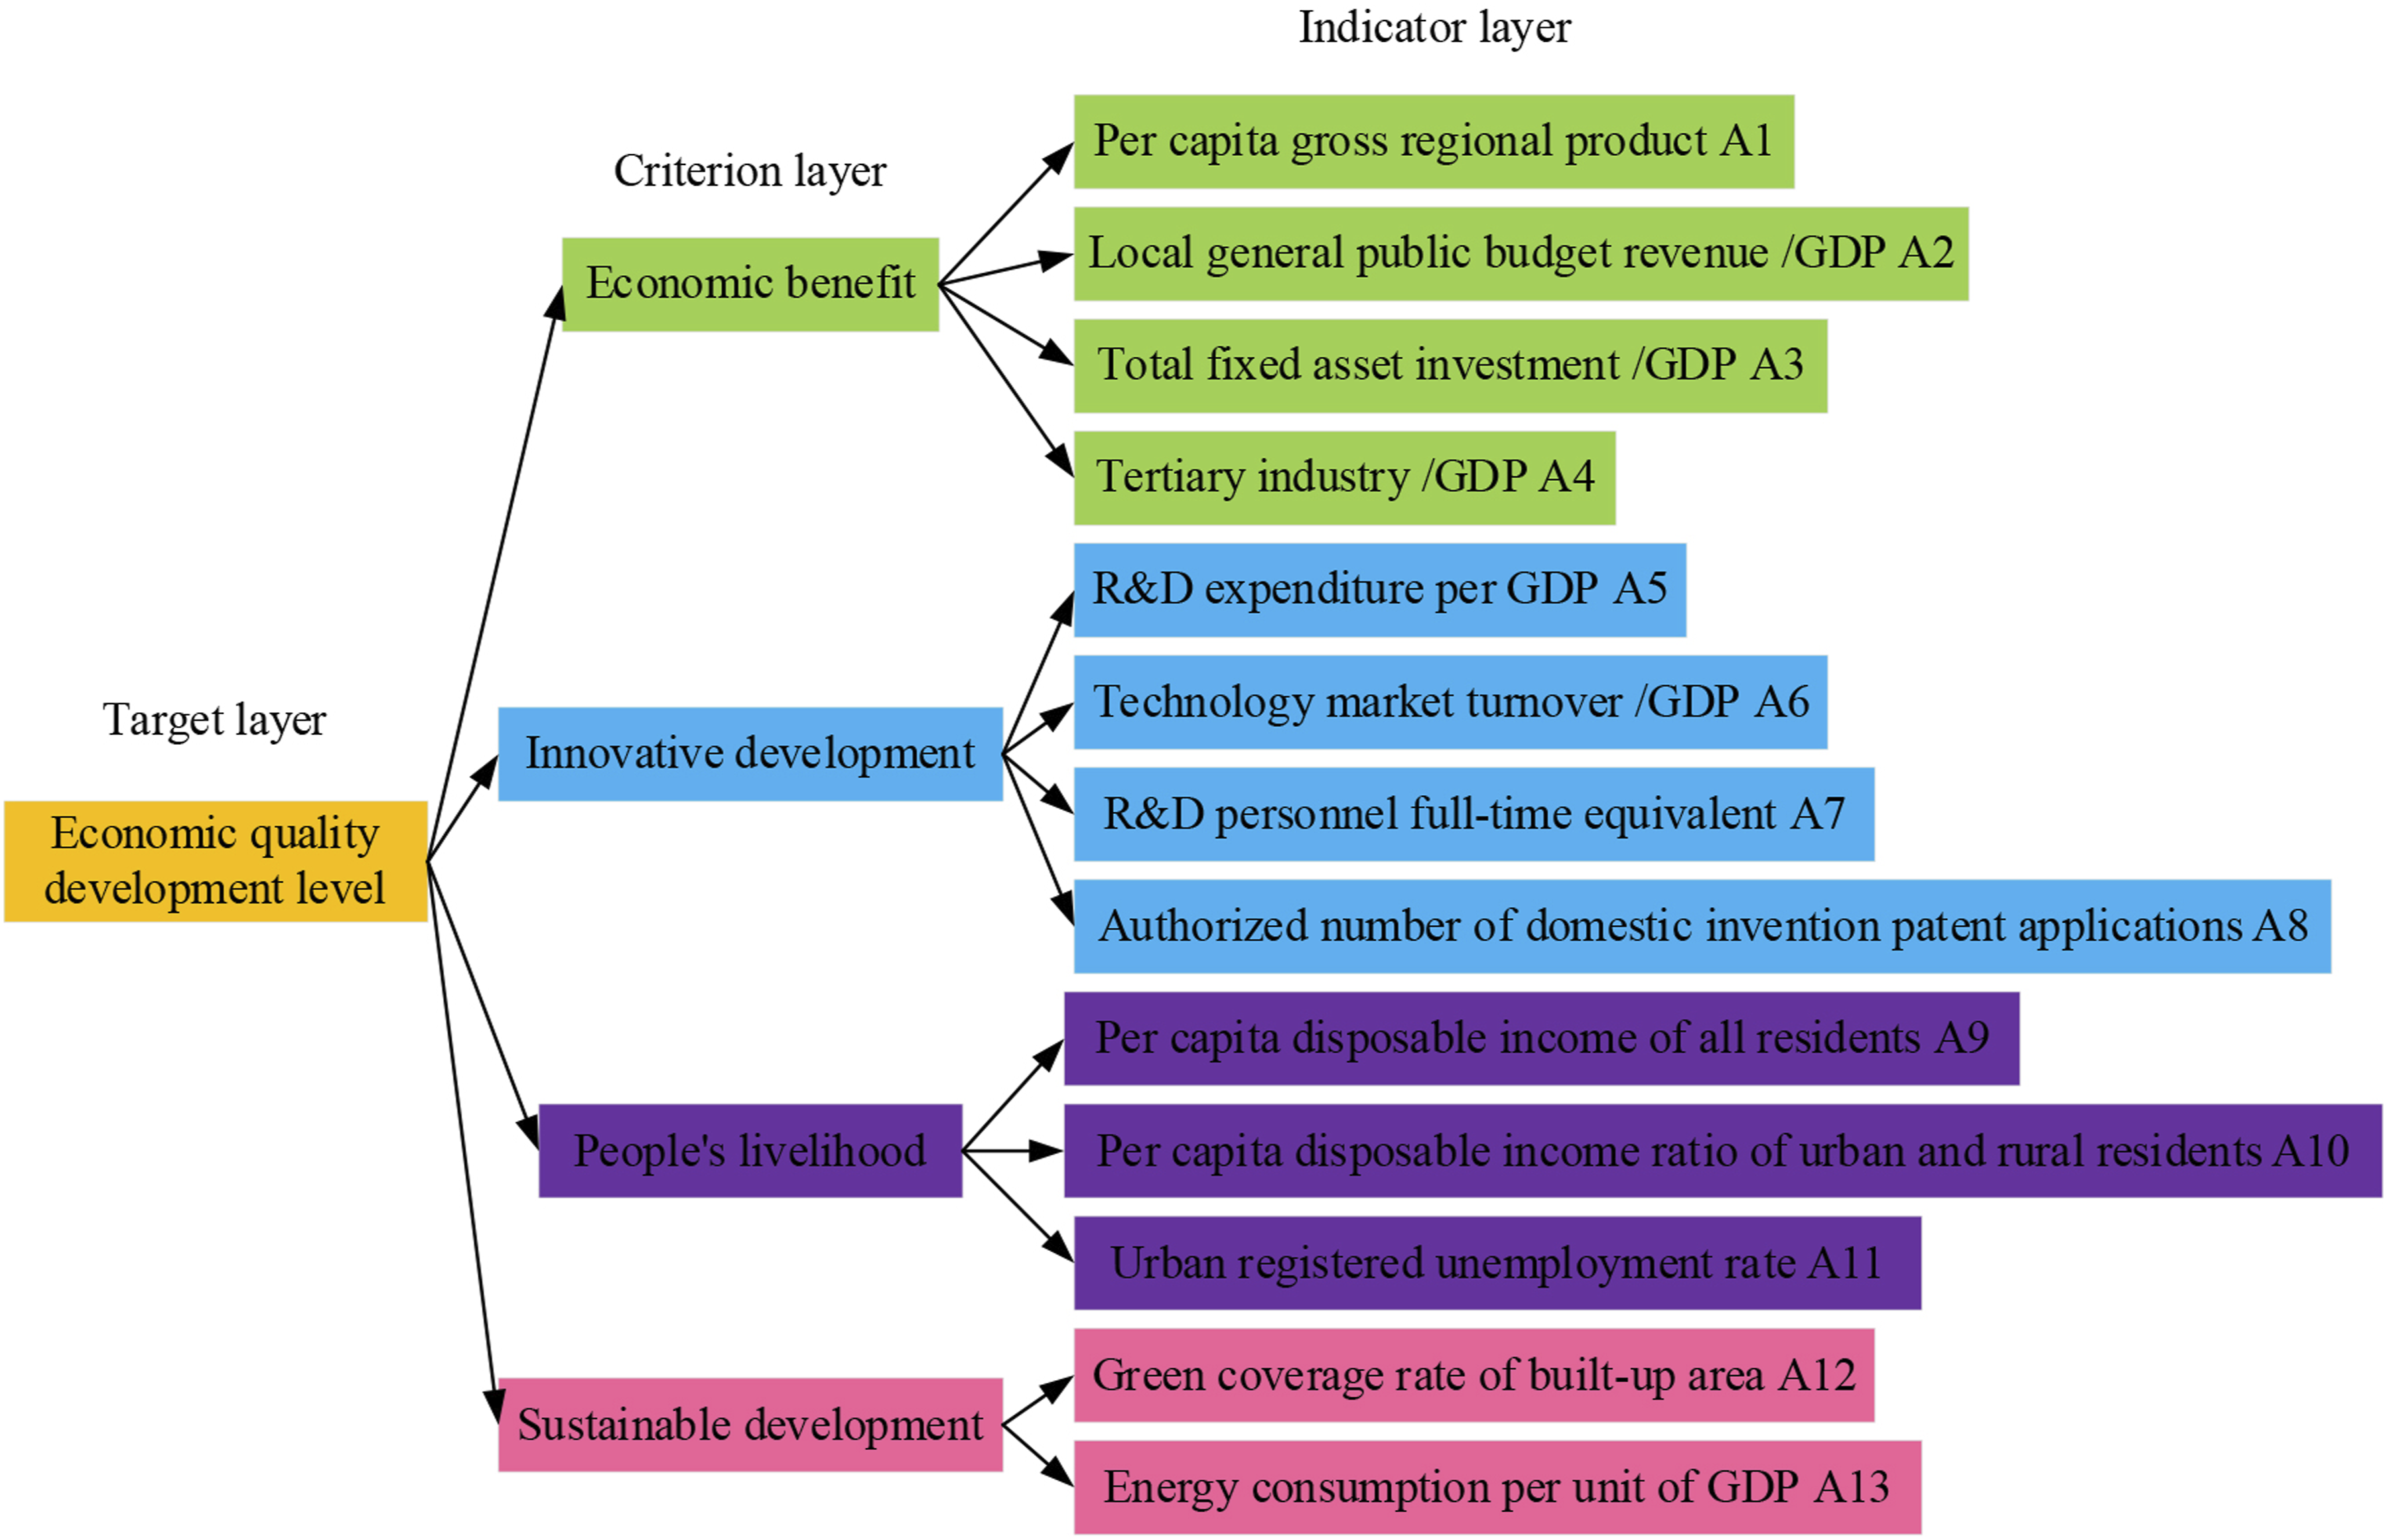
The data of 13 basic indicators in four dimensions of economic benefit, innovation and development, people’s life, and sustainable development are taken as input variables, and the level of high-quality economic development is taken as output variables. The grading standards of 13 basic indicators are used as samples, and the evaluation level of high-quality economic development level is used as samples.
32
Considering that the distribution types of the numerical values of each indicator are skewed, the indicators are classified by the method of dividing natural breakpoints, and the regional economic development level is divided into five grades.
33
Taking 2022 as an example, the economic development level grades of each urban area are shown in Figure 4. Evaluation standard of high economic development level in S city in 2022.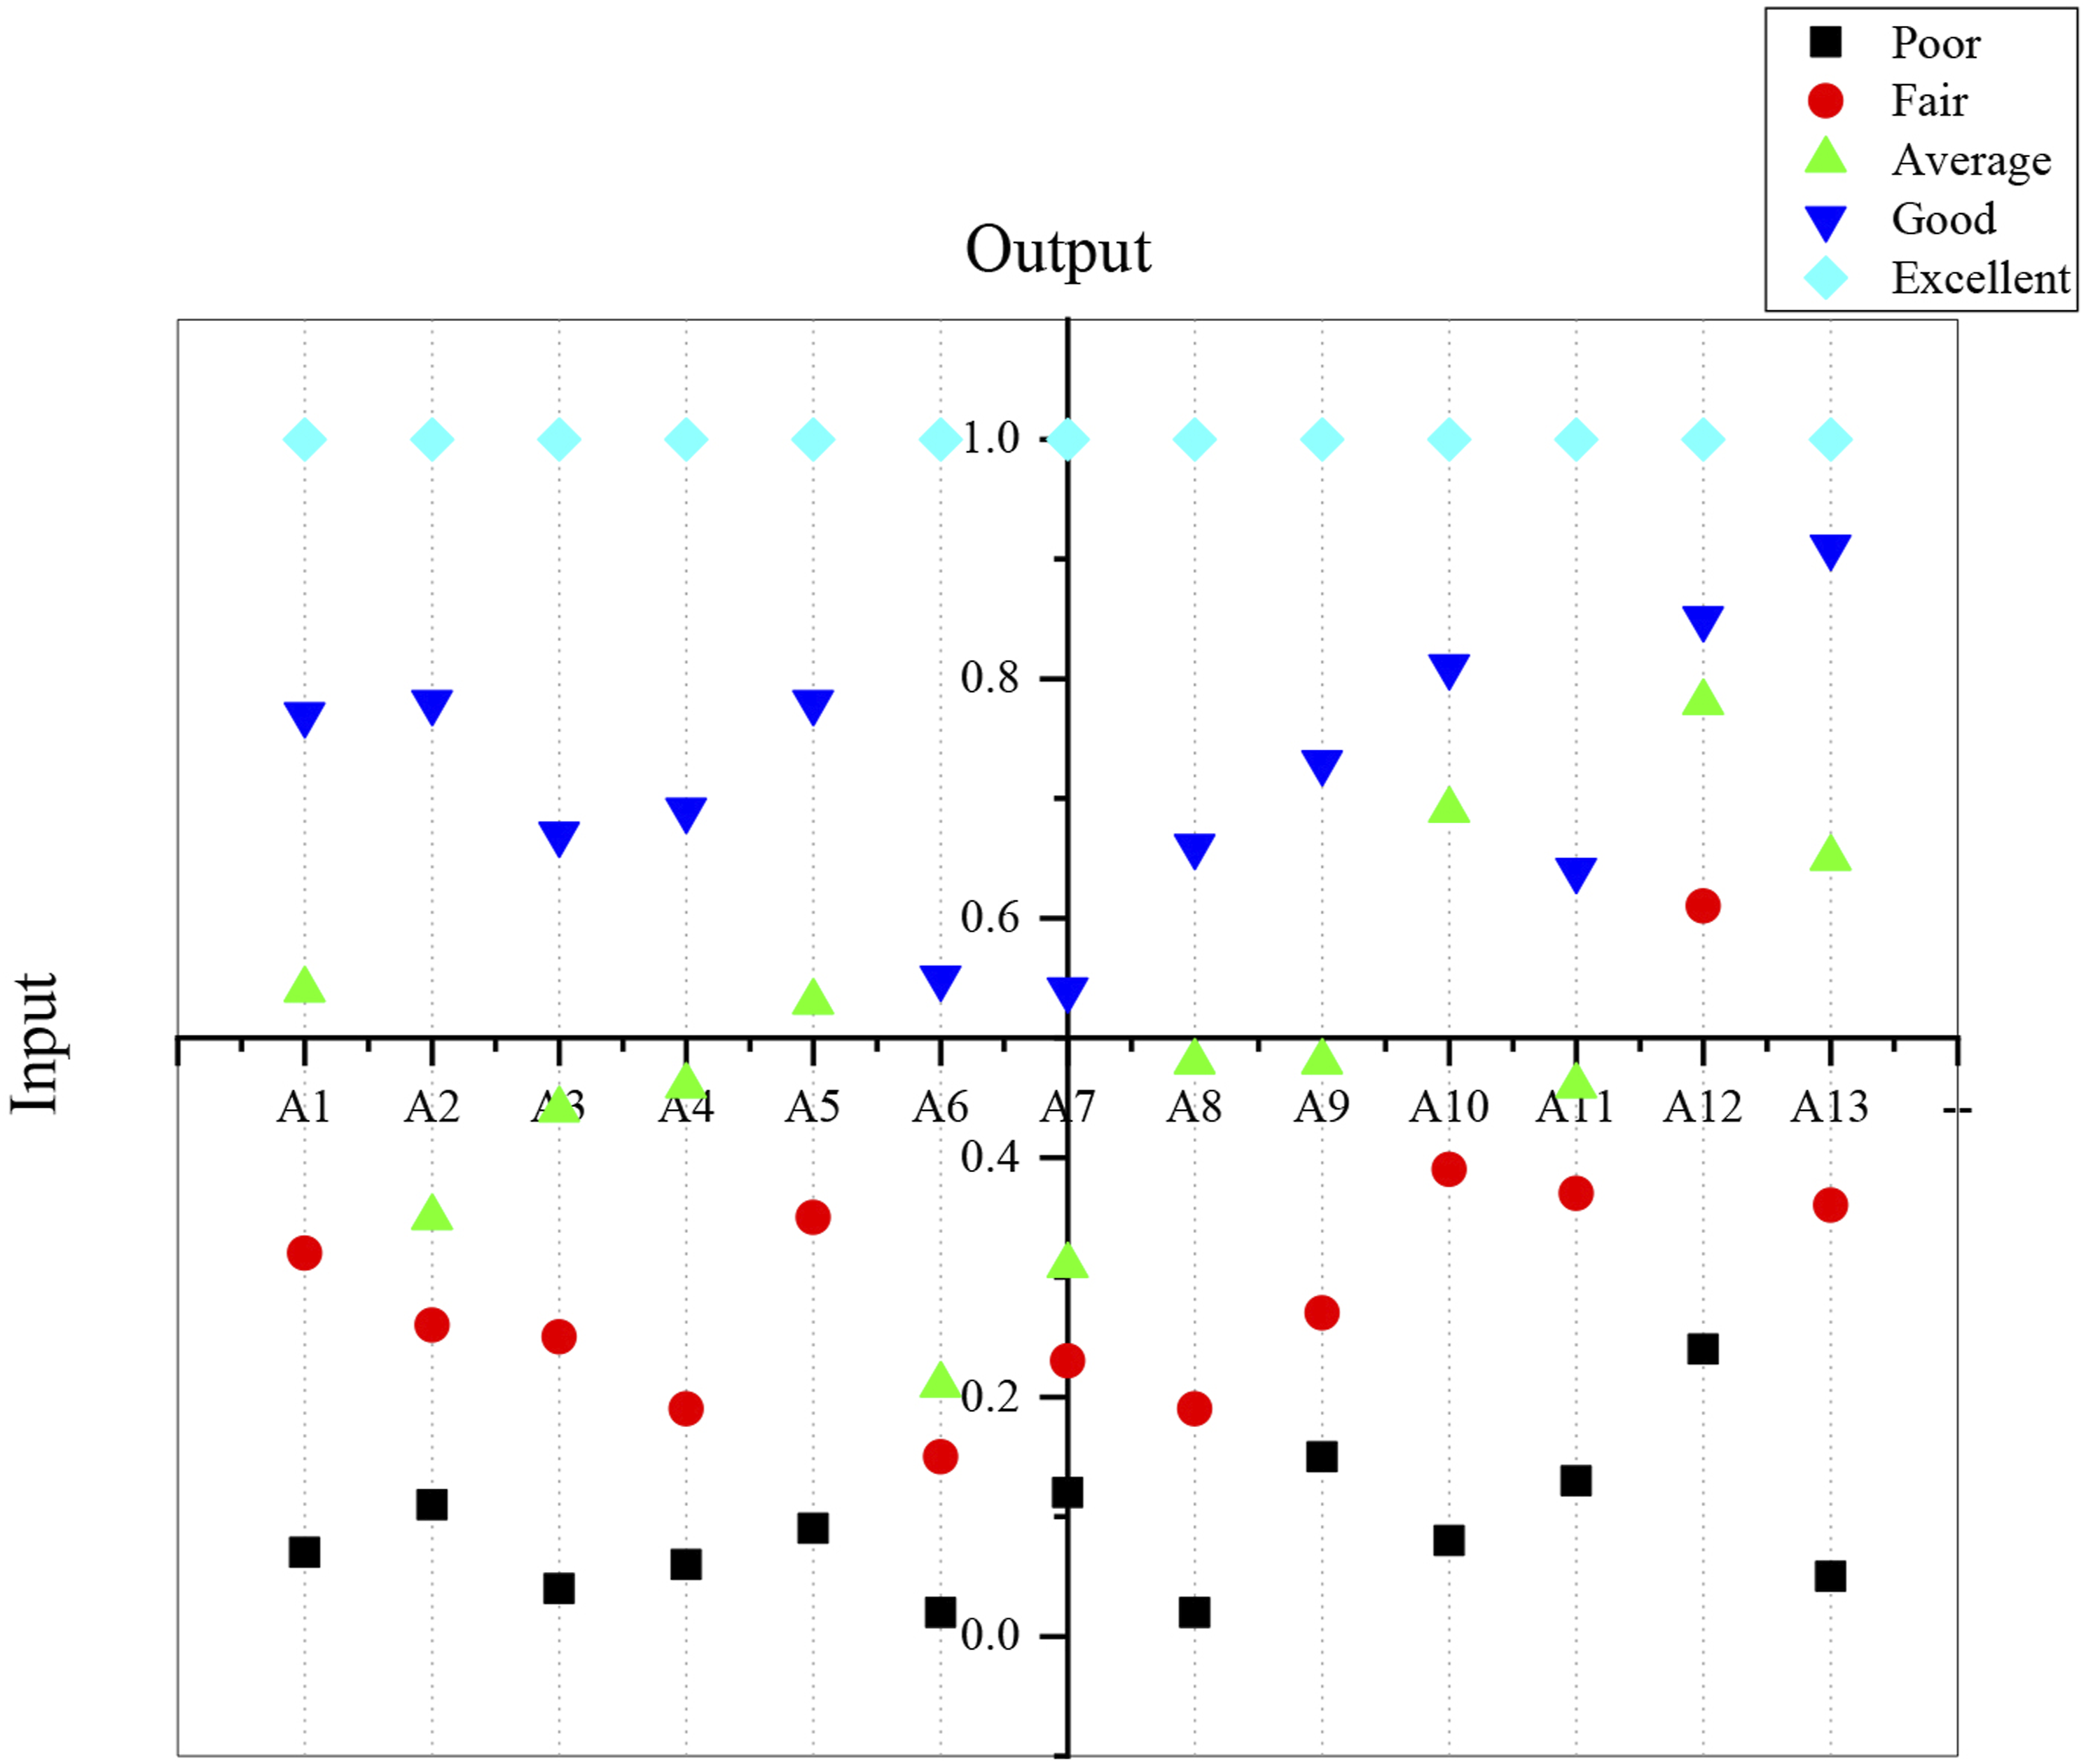
After the sample data is trained by BP algorithm, the accuracy is required to reach the standard, and all the index data are input into the network. 34 The BP evaluation value of the high-quality economic development level of eight urban areas in S city is obtained, with the range of 0–5.
Comprehensive evaluation and analysis
Comprehensive score of high-quality economic development level in S City from 2017 to 2022.
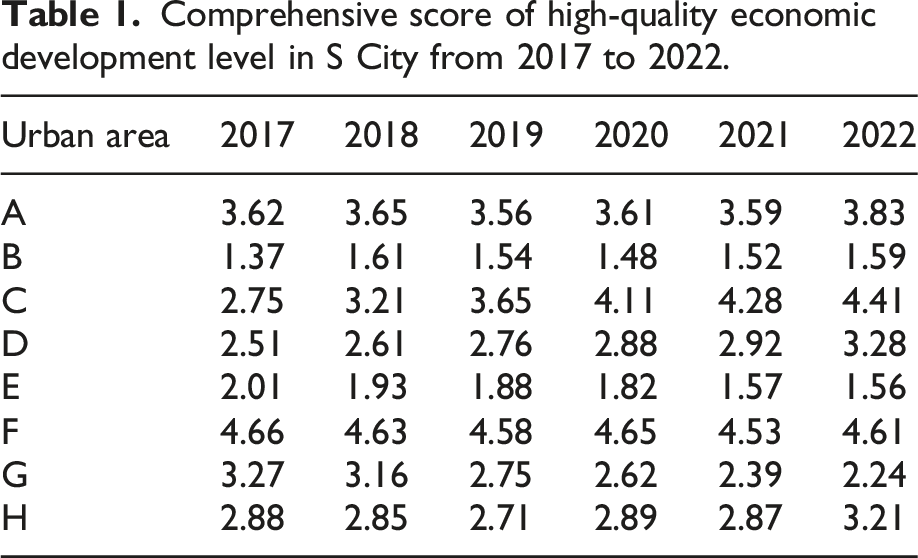
The overall trend of high-quality economic development level in various urban areas of S city
The overall trend of comprehensive score of high-quality economic development level evaluation in various urban areas of S city is shown in Figure 5. Overall trend of evaluation scores of high-quality economic development level in various urban areas of S city.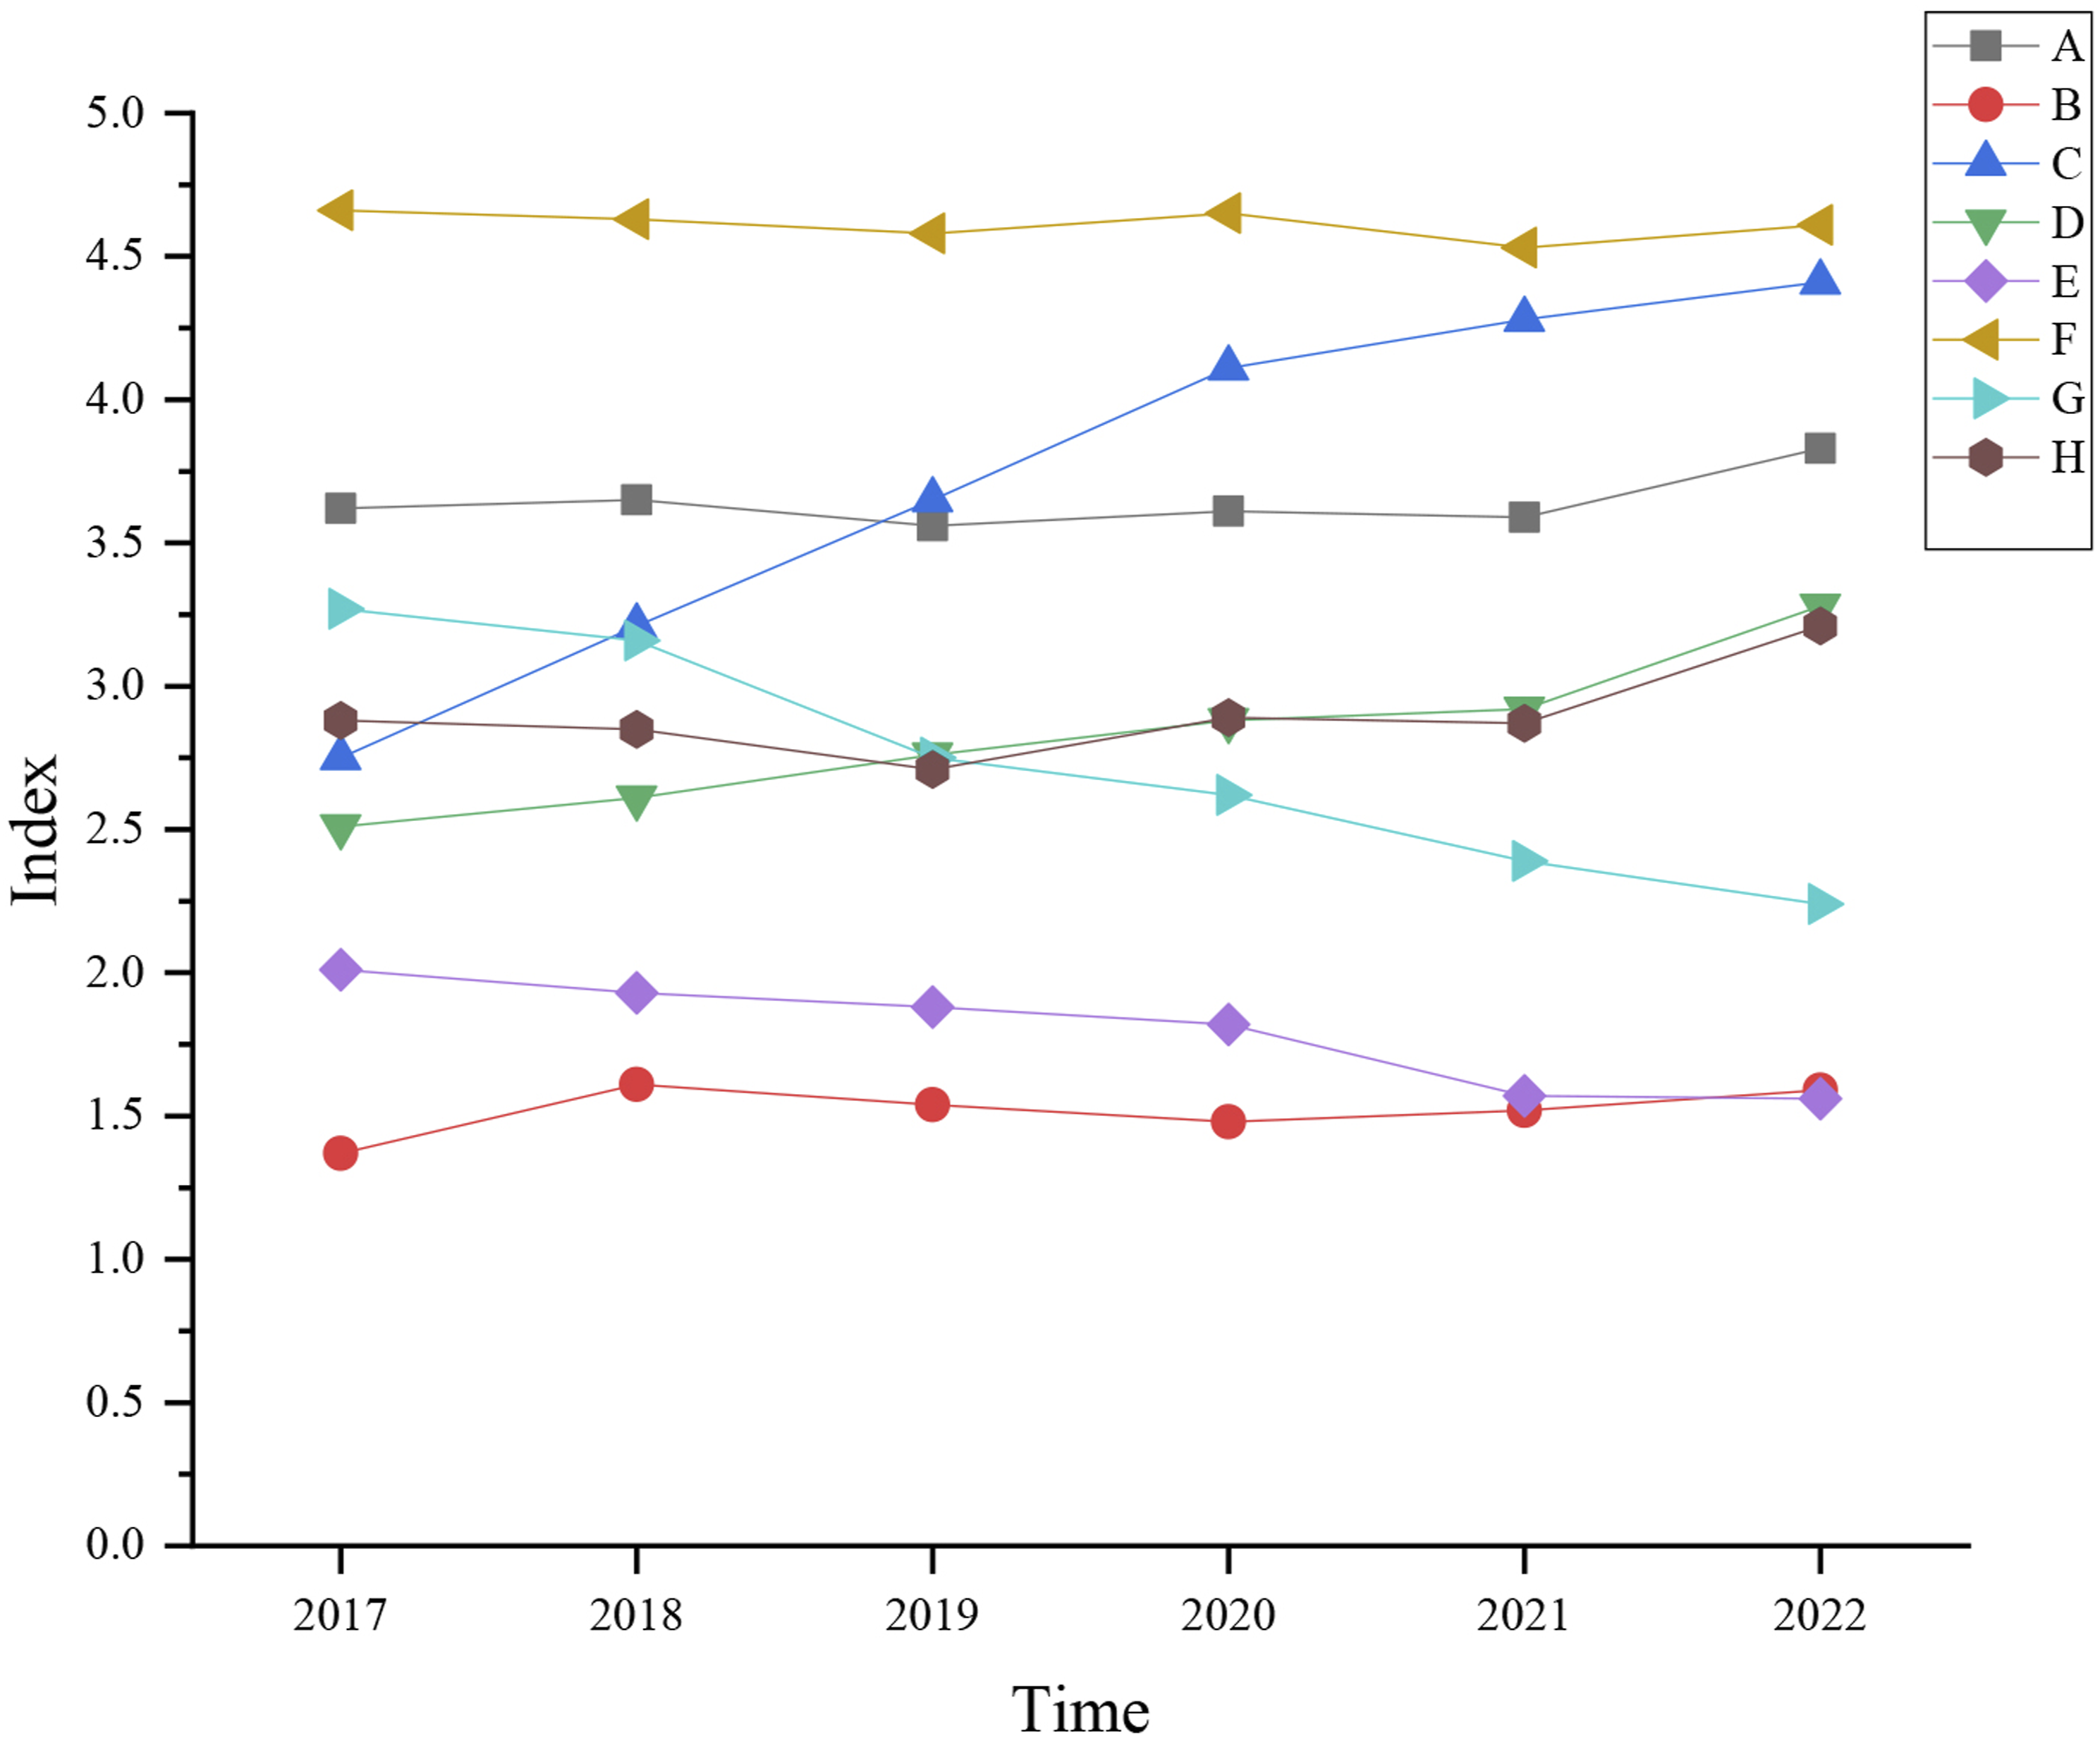
In Figure 5, during the period from 2017 to 2022, the high-quality economic development levels of eight urban areas in S city are ranked, and the results show that urban area C is always in the forefront, while urban area F comes from behind and gradually caught up. However, the economic development of H city has obviously declined. In contrast, the economic development quality of urban areas A, D and G belongs to the middle level of S city. Although the level of high-quality economic development in urban areas B and E is not high, there is still a lot of room for improvement in the future. On the whole, these urban areas all show different characteristics and advantages, which have contributed to the overall economic prosperity
Separate trend of high-quality economic development level in each urban area of S city
From 2017 to 2022, the individual trend of high-quality economic development level in eight urban areas of S city can be roughly divided into three categories. The first category is the growth group, including urban areas C, D, and H, as shown in Figure 6. Growth group of high-quality economic development level in S city from 2017 to 2022.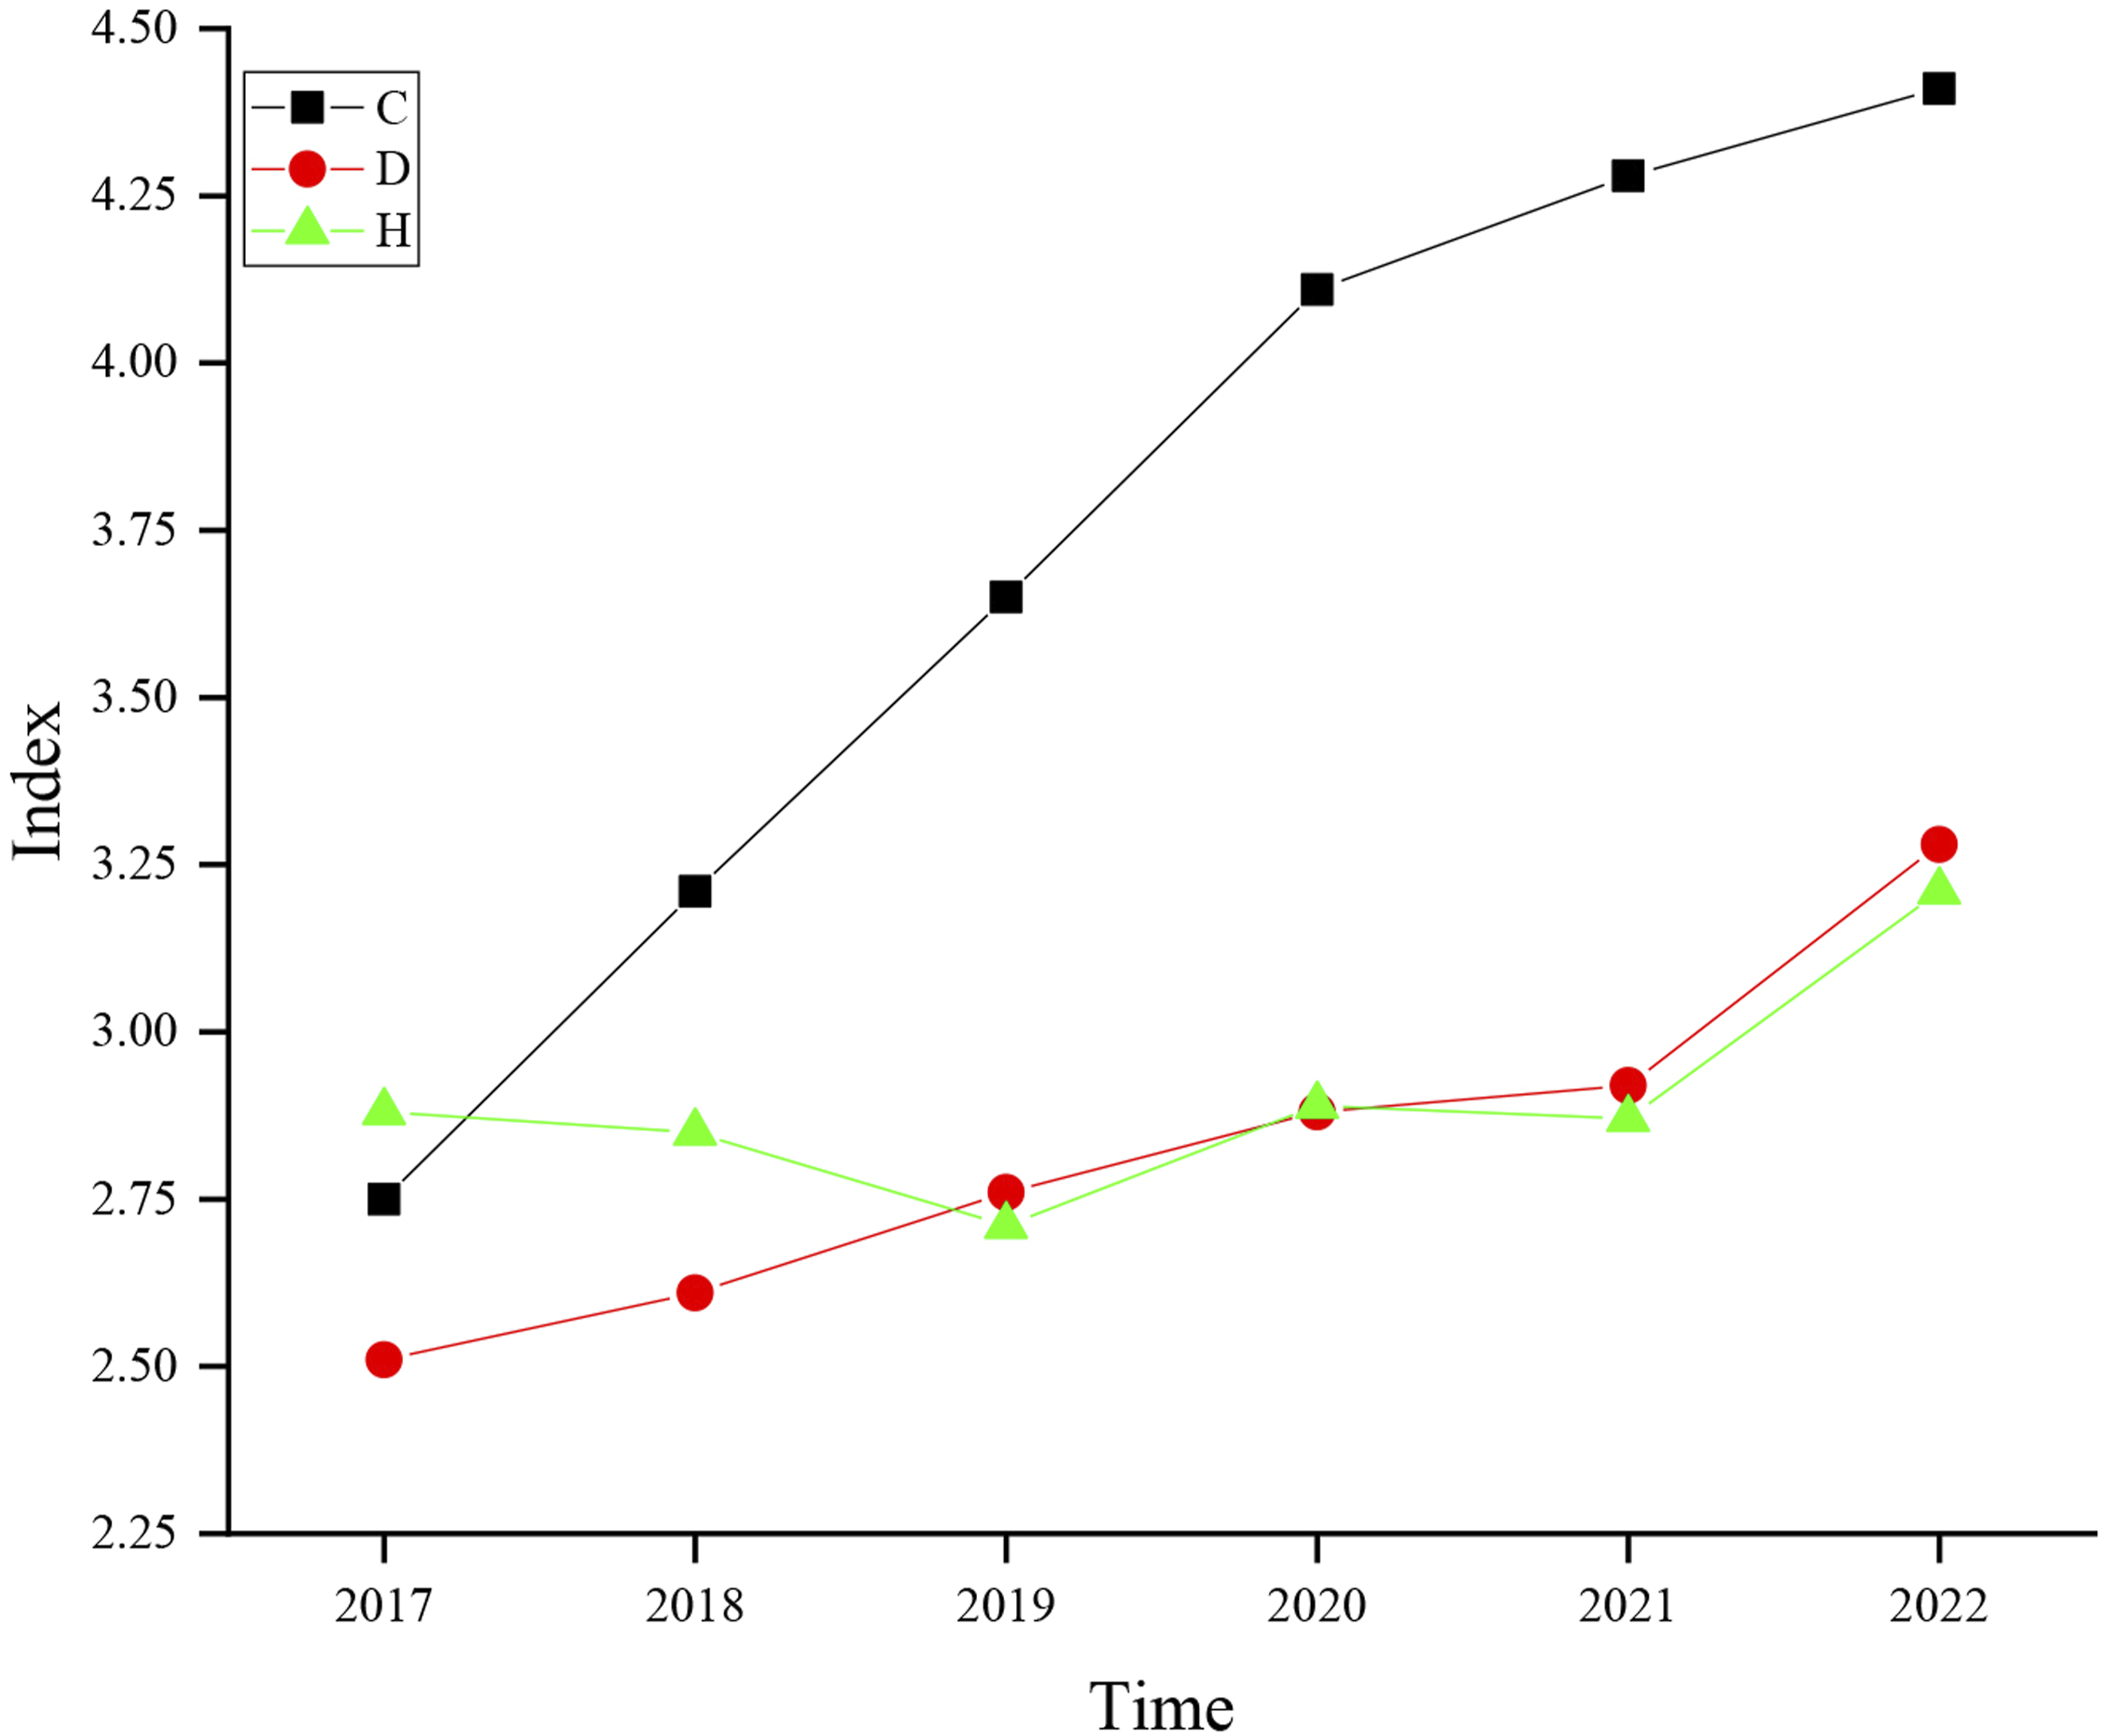
Figure 6 shows that C city has achieved rapid economic development by seizing major strategic opportunities and continuously optimizing the industrial structure in the city. As the environmental protection barrier of S city, D city has successfully promoted the coordination of economic development and ecological protection by actively adjusting its development strategy. During the period of 2017–2020, urban area H maintained a stable level of high-quality economic development, but in 2021, thanks to the support of relevant policies, the level of economic development increased rapidly. The successful experience of these urban areas shows that it is very important to seize strategic opportunities, optimize industrial structure, and actively adjust development strategies and policy support to achieve high-quality economic development.
The second category is the stable group, including urban areas A, B, and F, as shown in Figure 7. Stable group of high-quality economic development level in S city from 2017 to 2022.
Figure 7 shows that urban areas A and F show obvious development advantages and maintain a steady improvement in economic operation. Although the level of economic development in urban area B is relatively low, it has a perfect economic structure system, which provides a strong guarantee for the stable development of urban economy. These situations show that by establishing a sound industrial chain and economic support system, people can effectively cope with economic fluctuations and challenges and ensure sustained and stable economic development.
The third category is the declining group, including areas E and G, as shown in Figure 8. The declining group of high-quality economic development level in each urban area of S city from 2017 to 2022.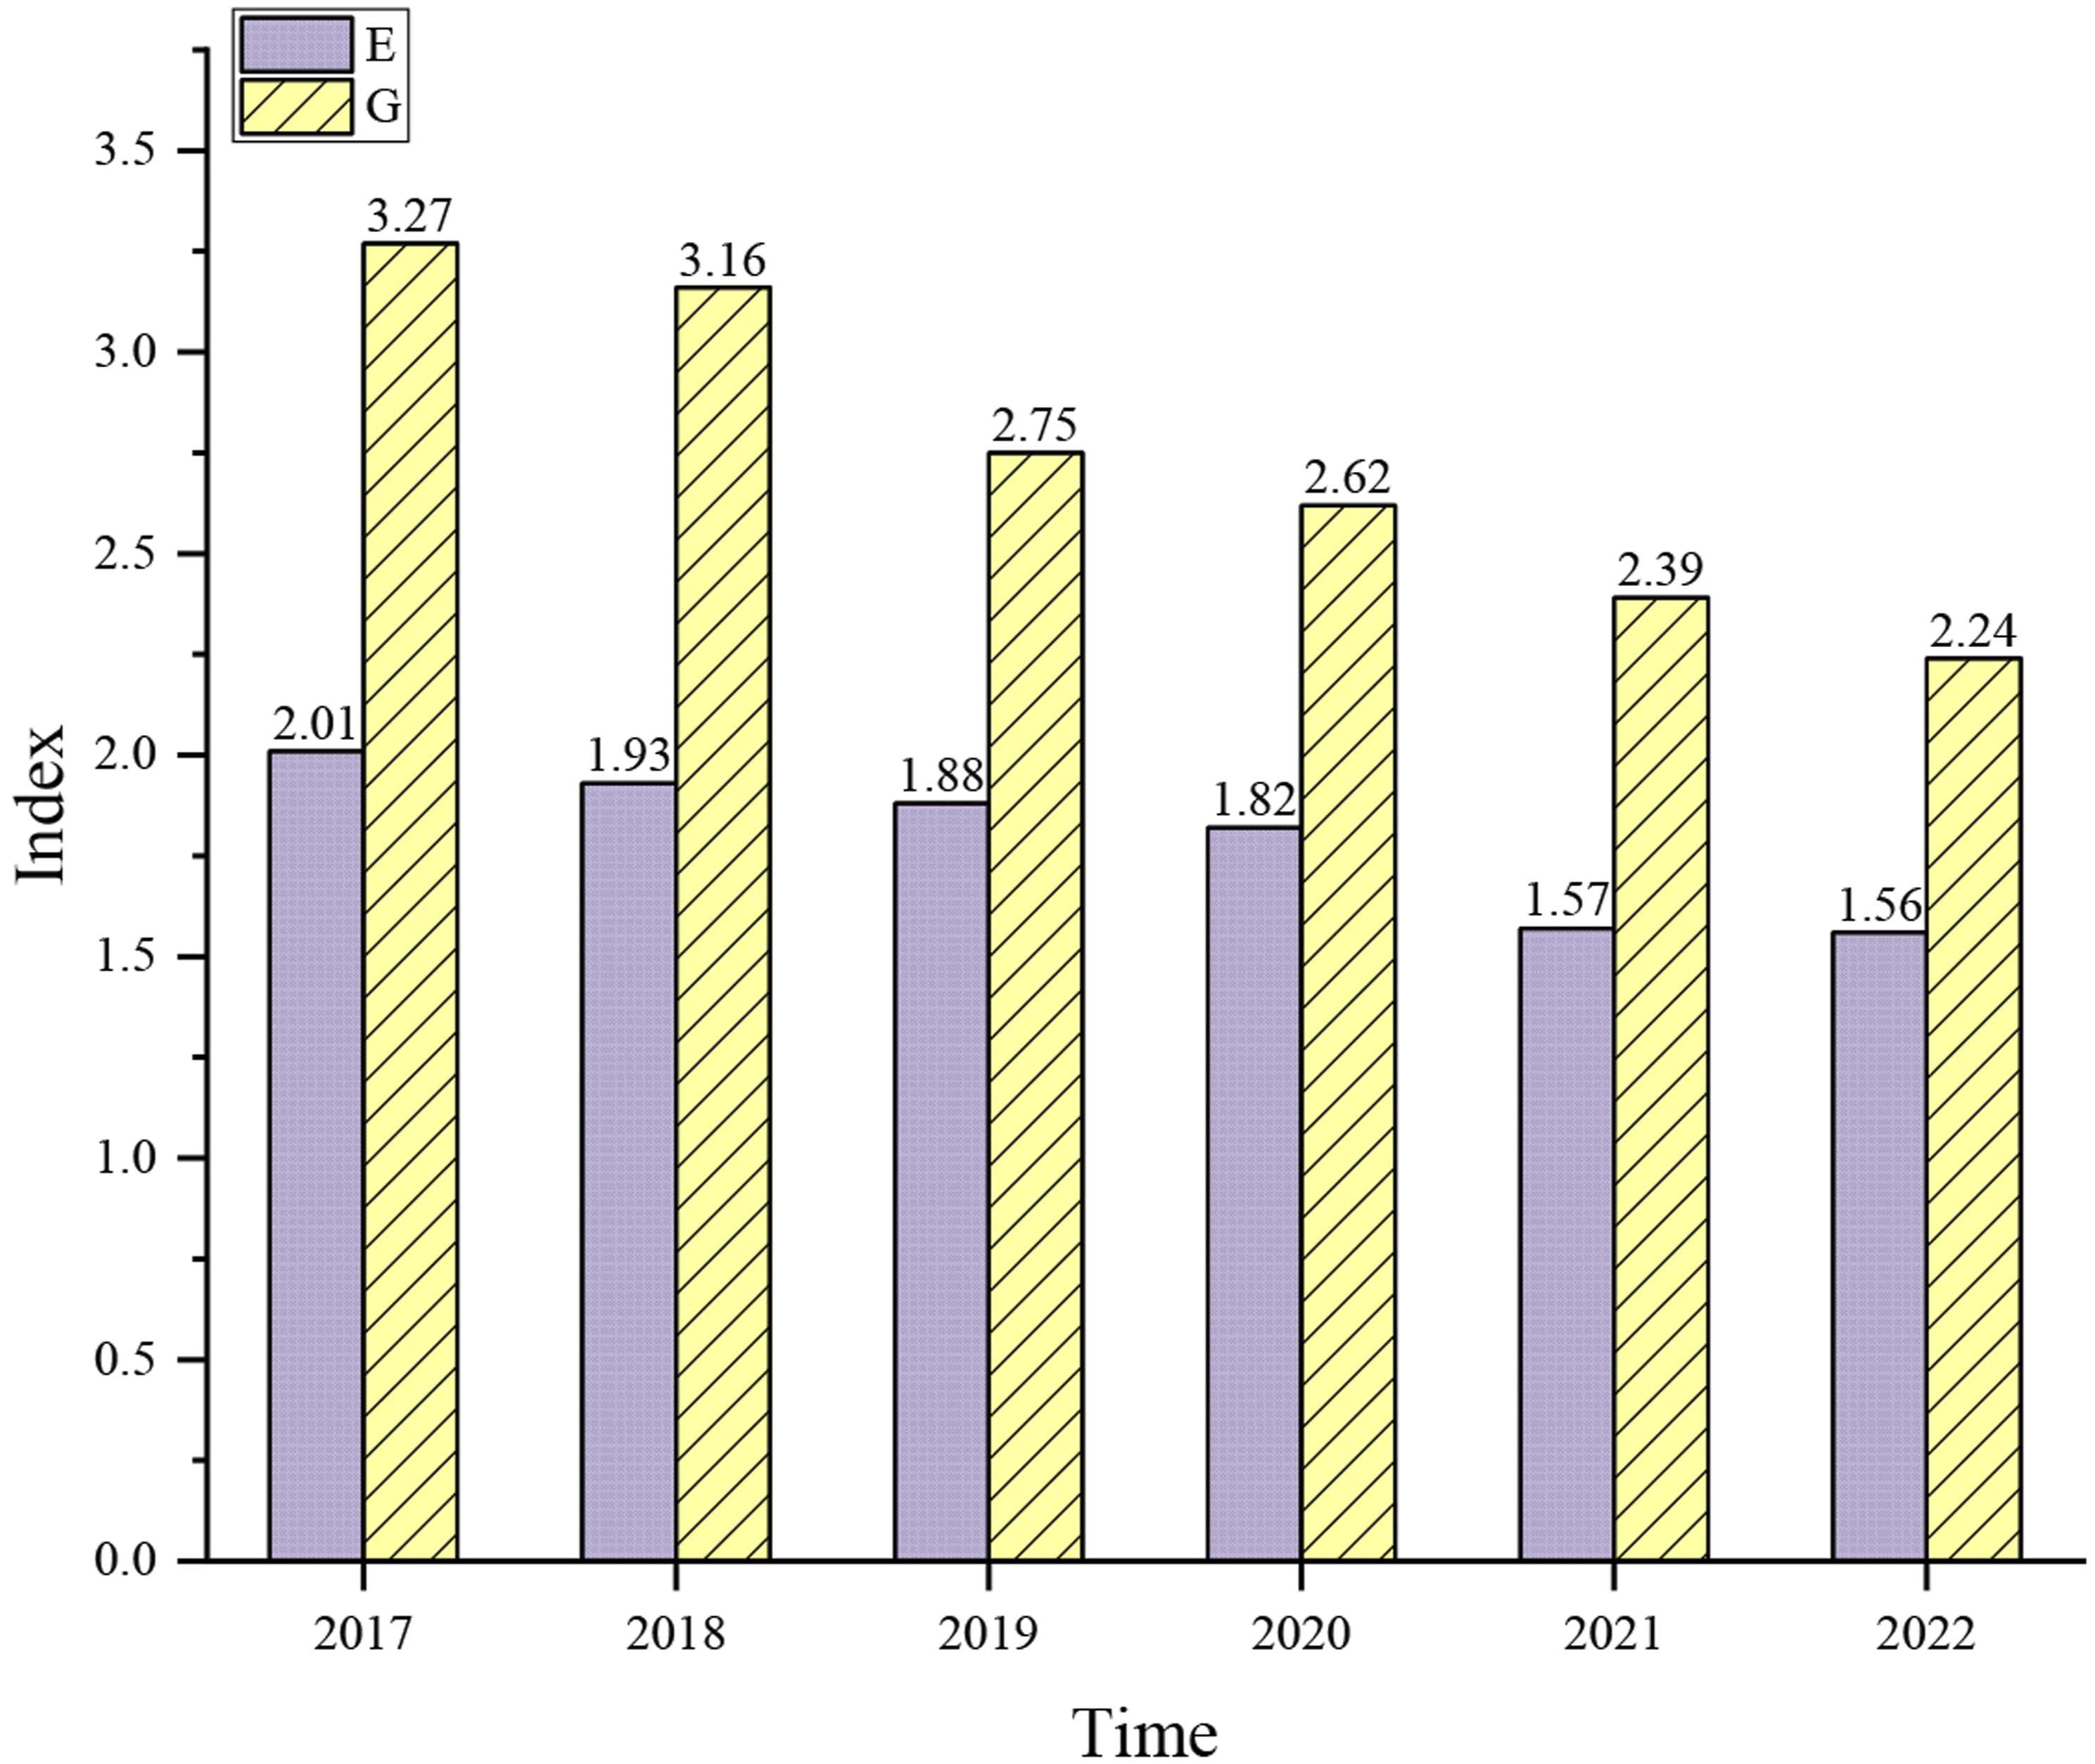
Figure 8 shows that the E urban area remained stable during the period of 2017–2020, but it declined greatly in 2021, mainly due to the weak growth of the real economy and the decrease in the number of fixed employees. However, due to excessive dependence on heavy industry, area G faces the obstacles of transformation, showing a trend of rising first and then falling. These situations show that urban areas E and G are facing some challenges in economic development, and measures need to be taken to promote economic diversification and high-quality development. 35
Discussion
Through the analysis of the results of the model, it is found that the model has high accuracy in the comprehensive evaluation of urban economic development level, which is consistent with the actual development. This shows that this research model can comprehensively analyze and process all kinds of development indicators of the city to get the corresponding evaluation results. Based on the evaluation results of this model, the planning suggestions for the future economic development of S city are put forward.
Support the development of relatively backward urban areas. For urban areas with low scores, the government can increase investment and focus on supporting their development in infrastructure construction, technological innovation and industrial upgrading to improve their economic vitality and attractiveness. Dupre (2019)’s research shows that organizing professionals to conduct in-depth research and analysis on the economic situation and development potential of backward urban areas will help to formulate more targeted development plans and policies and promote the development of advantageous industries and emerging industries. 36
Encourage cooperation and coordinated development between urban areas. Cooperation and exchanges between urban areas can be strengthened to jointly build a more perfect regional economic system, realize complementary resource advantages, and jointly promote the high-quality economic development of the whole city of S. The government can set up relevant institutions or committees to coordinate the economic cooperation and development of urban areas. Wang & Yeh’s (2020) research showed that making coordinated development plans and policies can strengthen the cooperation and exchange of similar industries, promote the integration and intersection among different industries, and promote the common development of urban areas. 37
Optimize the urban spatial layout. For urban areas with high scores, the government can moderately guide and control their economic development speed, and meanwhile strengthen urban spatial planning and management to avoid the negative impact of excessive economic development and urban expansion. Medeiros and Van Der Zwet (2020)’s research shows that according to the actual needs of urban development and the future development trend, it is more helpful to make scientific and reasonable urban planning and spatial layout plans and adjust the urban industrial and population distribution structure to make full use of urban space. 38
Conclusion
Research contribution
In this paper, an evaluation system for high-quality economic development in eight urban areas of S city is established across four dimensions: economic benefit, innovative development, people’s life, and sustainable development. The comprehensive assessment of the high-quality economic development level from 2017 to 2022 employs a BP neural network model. Leveraging the self-learning, self-adaptation, and nonlinearity characteristics of the BP neural network, this approach mitigates the impact of nonlinear uncertain factors, ensuring fairness, scientific rigor, and reliability in the evaluation of indicators. The research highlights the potential application of the BP neural network in assessing high-quality economic development, aiding a better understanding of economic states and trends, fostering urban digital economy development, and offering insights for collaborative governance planning in other regions.
Future works and research limitations
The evaluation system for high-quality economic development needs to be dynamically adjusted and optimized in response to evolving development stages and market demands. It should undergo continuous updates and improvements to align with the changing times and needs. A limitation of this paper lies in relying on a single evaluation method, and future studies should incorporate various methods for comparative analysis. Considering different stages of urban development, there is a need to add or remove indicators such as industrial structure upgrading and technological innovation to enhance the accuracy of the evaluation model.
Statements and declarations
Footnotes
Conflicting interest
The author(s) declared no potential conflicts of interest with respect to the research, authorship, and/or publication of this article.
Funding
The author(s) disclosed receipt of the following financial support for the research, authorship, and/or publication of this article: This work was supported by 2023 Provinical Natural Science Foundation Project of Fujian, “The Impact of Human Resource Management Practices on International Business of Fujian Province after the COVID-19” (No. 2023J05215). This work was supported by PhD Project of Fujian Social Science Foundation in 2022 “Study on the Interaction Mechanism of Digital Technology Application under Carbon Peaking and Carbon Neutrality Goals” (No. FJ2022BF076). This work was supported by General Project of Humanities and Social Sciences Research of the Ministry of Education in 2022 “Measurement of Digitalization Level. Transformation and Upgrading Strategy of China’s Manufacturing Industry: a Comparative Study of State-Owned Enterprises and Private Enterprises” (No. 22YJC910004).